| 1 Death Show forest plot | 9 | | Risk Ratio (M‐H, Fixed, 95% CI) | Subtotals only |
|
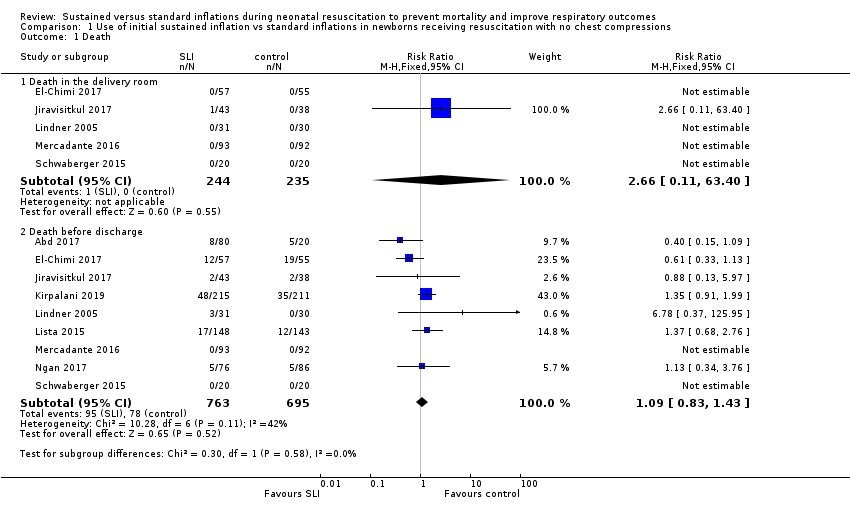
| 1.1 Death in the delivery room | 5 | 479 | Risk Ratio (M‐H, Fixed, 95% CI) | 2.66 [0.11, 63.40] |
| 1.2 Death before discharge | 9 | 1458 | Risk Ratio (M‐H, Fixed, 95% CI) | 1.09 [0.83, 1.43] |
| 2 Endotracheal intubation Show forest plot | 8 | | Risk Ratio (M‐H, Fixed, 95% CI) | Subtotals only |
|
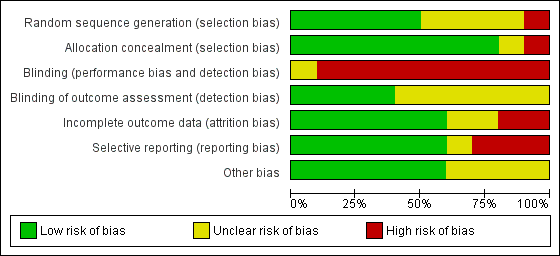
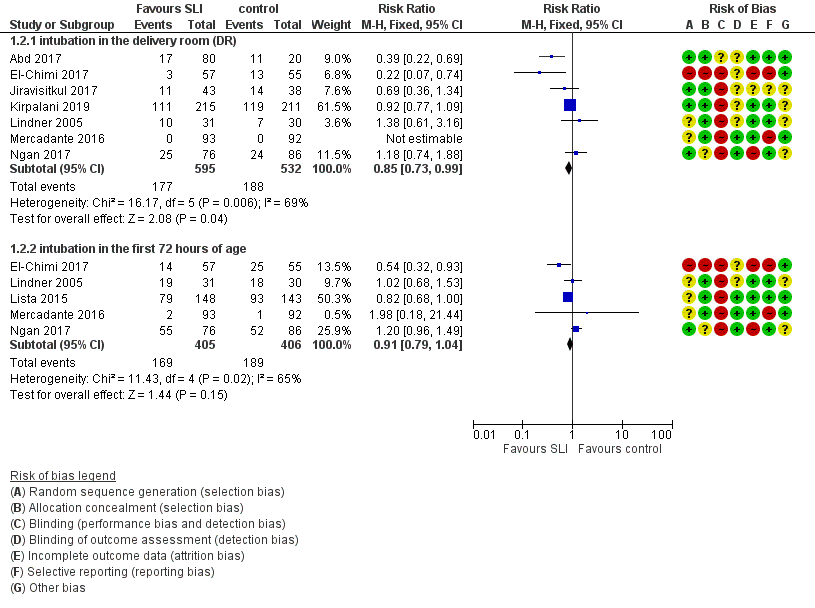
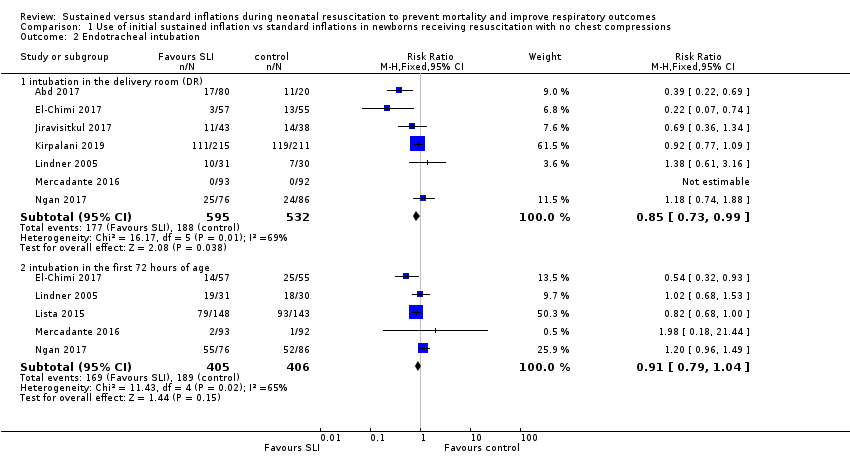
| 2.1 intubation in the delivery room (DR) | 7 | 1127 | Risk Ratio (M‐H, Fixed, 95% CI) | 0.85 [0.73, 0.99] |
| 2.2 intubation in the first 72 hours of age | 5 | 811 | Risk Ratio (M‐H, Fixed, 95% CI) | 0.91 [0.79, 1.04] |
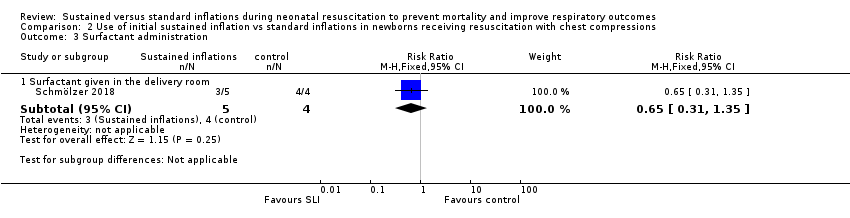
| 3 Surfactant administration Show forest plot | 9 | | Risk Ratio (M‐H, Fixed, 95% CI) | Subtotals only |
|
| 3.1 Surfactant given in the delivery room | 4 | 761 | Risk Ratio (M‐H, Fixed, 95% CI) | 1.06 [0.88, 1.27] |
| 3.2 Surfactant given at any time | 9 | 1458 | Risk Ratio (M‐H, Fixed, 95% CI) | 0.99 [0.91, 1.08] |
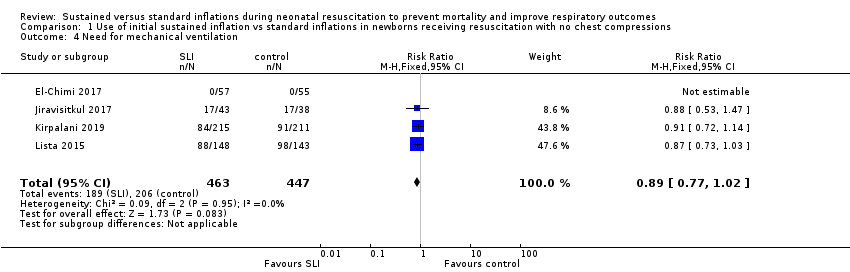
| 4 Need for mechanical ventilation Show forest plot | 4 | 910 | Risk Ratio (M‐H, Fixed, 95% CI) | 0.89 [0.77, 1.02] |
|
| 5 Duration of NCPAP Show forest plot | 3 | 355 | Mean Difference (IV, Fixed, 95% CI) | 0.26 [‐0.19, 0.72] |
|
| 6 Duration of mechanical ventilation Show forest plot | 5 | 524 | Mean Difference (IV, Fixed, 95% CI) | ‐5.37 [‐6.31, ‐4.43] |
|
| 7 Duration of respiratory support (NCPAP + MV) Show forest plot | 2 | 243 | Mean Difference (IV, Fixed, 95% CI) | 0.69 [0.23, 1.16] |
|
| 8 Duration of supplemental oxygen requirement Show forest plot | 1 | 81 | Mean Difference (IV, Fixed, 95% CI) | ‐9.73 [‐25.06, 5.60] |
|
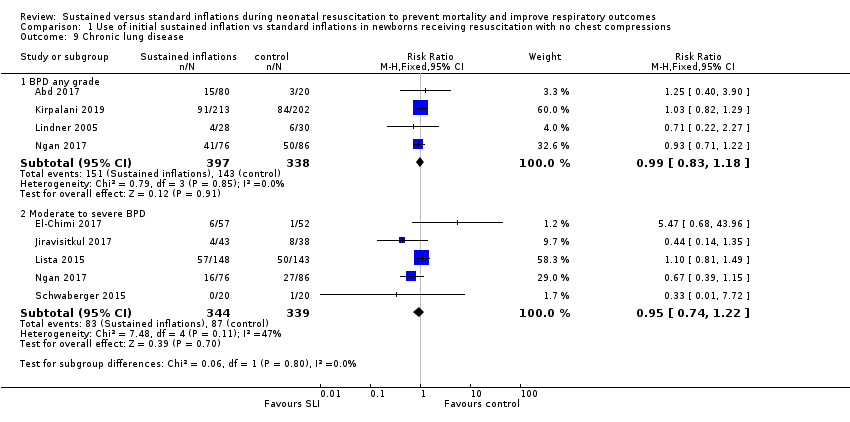
| 9 Chronic lung disease Show forest plot | 8 | | Risk Ratio (M‐H, Fixed, 95% CI) | Subtotals only |
|
| 9.1 BPD any grade | 4 | 735 | Risk Ratio (M‐H, Fixed, 95% CI) | 0.99 [0.83, 1.18] |
| 9.2 Moderate to severe BPD | 5 | 683 | Risk Ratio (M‐H, Fixed, 95% CI) | 0.95 [0.74, 1.22] |
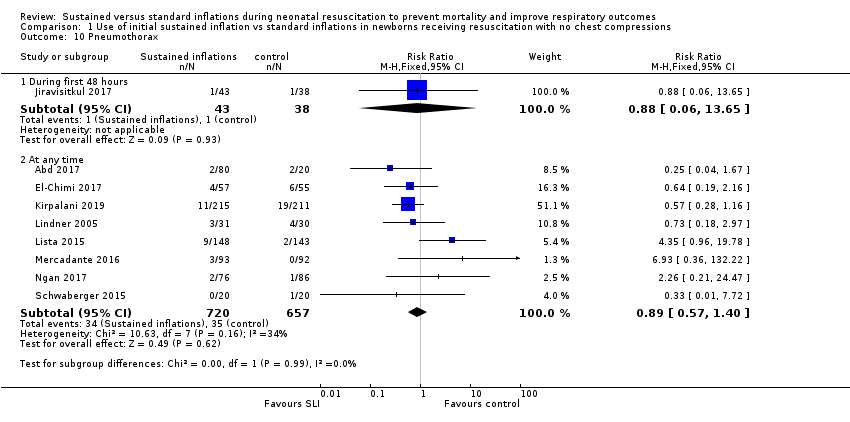
| 10 Pneumothorax Show forest plot | 9 | | Risk Ratio (M‐H, Fixed, 95% CI) | Subtotals only |
|
| 10.1 During first 48 hours | 1 | 81 | Risk Ratio (M‐H, Fixed, 95% CI) | 0.88 [0.06, 13.65] |
| 10.2 At any time | 8 | 1377 | Risk Ratio (M‐H, Fixed, 95% CI) | 0.89 [0.57, 1.40] |
| 11 Pulmonary interstitial emphysema Show forest plot | 1 | 426 | Risk Ratio (M‐H, Fixed, 95% CI) | 1.14 [0.39, 3.35] |
|
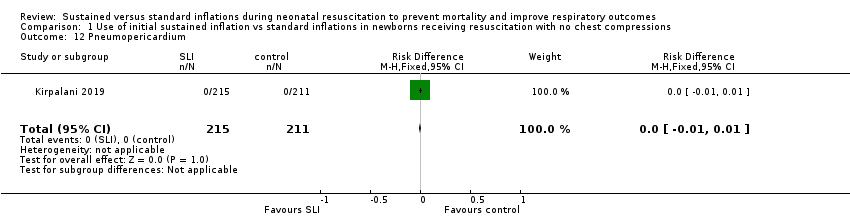
| 12 Pneumopericardium Show forest plot | 1 | 426 | Risk Difference (M‐H, Fixed, 95% CI) | 0.0 [‐0.01, 0.01] |
|
| 13 Cranial ultrasound abnormalities Show forest plot | 8 | | Risk Ratio (M‐H, Fixed, 95% CI) | Subtotals only |
|
| 13.1 Intraventricular haemorrhage grade 3‐4 | 6 | 735 | Risk Ratio (M‐H, Fixed, 95% CI) | 0.85 [0.56, 1.28] |
| 13.2 IVH any grade | 3 | 578 | Risk Ratio (M‐H, Fixed, 95% CI) | 1.01 [0.77, 1.32] |
| 13.3 Cystic periventricular leukomalacia | 5 | 635 | Risk Ratio (M‐H, Fixed, 95% CI) | 0.59 [0.24, 1.44] |
| 14 Retinopathy of prematurity (ROP) stage ≥ 3 Show forest plot | 6 | 732 | Risk Ratio (M‐H, Fixed, 95% CI) | 0.73 [0.46, 1.15] |
|
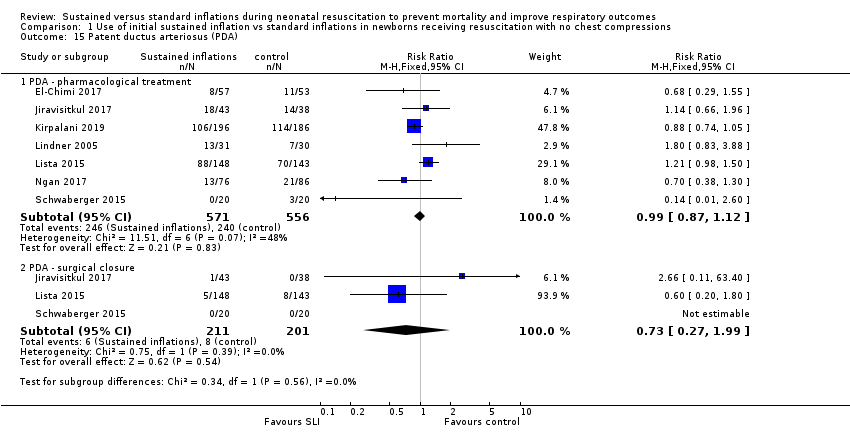
| 15 Patent ductus arteriosus (PDA) Show forest plot | 7 | | Risk Ratio (M‐H, Fixed, 95% CI) | Subtotals only |
|
| 15.1 PDA ‐ pharmacological treatment | 7 | 1127 | Risk Ratio (M‐H, Fixed, 95% CI) | 0.99 [0.87, 1.12] |
| 15.2 PDA ‐ surgical closure | 3 | 412 | Risk Ratio (M‐H, Fixed, 95% CI) | 0.73 [0.27, 1.99] |