| 1 Heart rate change (beats per minute) Show forest plot | 6 | | Mean Difference (IV, Fixed, 95% CI) | Subtotals only |
|
| 1.1 Supplemental breast milk vs placebo | 5 | 300 | Mean Difference (IV, Fixed, 95% CI) | ‐4.49 [‐7.08, ‐1.89] |
| 1.2 Supplemental breast milk vs no treatment | 1 | 60 | Mean Difference (IV, Fixed, 95% CI) | ‐5.10 [‐12.37, 2.17] |
| 1.3 Supplemental breast milk vs 25% sucrose | 1 | 68 | Mean Difference (IV, Fixed, 95% CI) | 13.80 [4.23, 23.37] |
| 1.4 Supplemental breast milk vs 10% glucose | 2 | 110 | Mean Difference (IV, Fixed, 95% CI) | 0.62 [‐1.79, 3.03] |
| 1.5 Supplemental breast milk vs 25% glucose | 1 | 50 | Mean Difference (IV, Fixed, 95% CI) | 9.00 [7.00, 11.00] |
| 1.6 Supplemental breast milk vs 30% glucose | 1 | 60 | Mean Difference (IV, Fixed, 95% CI) | 6.80 [0.70, 12.90] |
| 1.7 Supplemental breast milk vs 50% glucose | 1 | 50 | Mean Difference (IV, Fixed, 95% CI) | 10.10 [8.08, 12.12] |
| 1.8 Supplemental breast milk vs artificial sweetener | 1 | 40 | Mean Difference (IV, Fixed, 95% CI) | 8.0 [‐0.15, 16.15] |
| 1.9 Supplemental breast milk vs glycine | 1 | 40 | Mean Difference (IV, Fixed, 95% CI) | 4.0 [‐2.82, 10.82] |
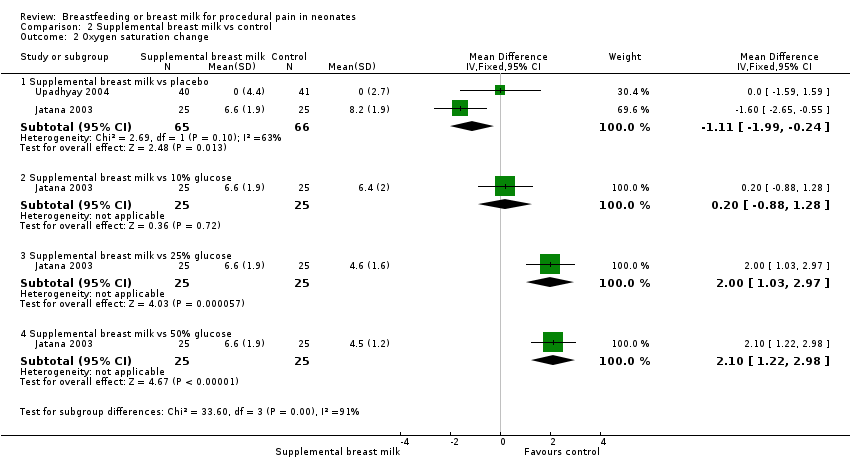
| 2 Oxygen saturation change Show forest plot | 2 | | Mean Difference (IV, Fixed, 95% CI) | Subtotals only |
|
| 2.1 Supplemental breast milk vs placebo | 2 | 131 | Mean Difference (IV, Fixed, 95% CI) | ‐1.11 [‐1.99, ‐0.24] |
| 2.2 Supplemental breast milk vs 10% glucose | 1 | 50 | Mean Difference (IV, Fixed, 95% CI) | 0.20 [‐0.88, 1.28] |
| 2.3 Supplemental breast milk vs 25% glucose | 1 | 50 | Mean Difference (IV, Fixed, 95% CI) | 2.0 [1.03, 2.97] |
| 2.4 Supplemental breast milk vs 50% glucose | 1 | 50 | Mean Difference (IV, Fixed, 95% CI) | 2.10 [1.22, 2.98] |
| 3 Percentage of time crying Show forest plot | 1 | | Mean Difference (IV, Fixed, 95% CI) | Subtotals only |
|
| 3.1 Supplemental breast milk vs placebo | 1 | 40 | Mean Difference (IV, Fixed, 95% CI) | 9.0 [‐1.99, 19.99] |
| 3.2 Supplemental breast milk vs artificial sweetener | 1 | 40 | Mean Difference (IV, Fixed, 95% CI) | 15.0 [2.38, 27.62] |
| 3.3 Supplemental breast milk vs glycine | 1 | 40 | Mean Difference (IV, Fixed, 95% CI) | 1.0 [‐4.61, 6.61] |
| 4 Duration of crying (seconds) Show forest plot | 8 | | Mean Difference (IV, Fixed, 95% CI) | Subtotals only |
|
| 4.1 Supplemental breast milk vs placebo | 7 | 357 | Mean Difference (IV, Fixed, 95% CI) | ‐8.67 [‐12.32, ‐5.02] |
| 4.2 Supplemental breast milk vs 2 doses of placebo (water) | 1 | 44 | Mean Difference (IV, Fixed, 95% CI) | 0.0 [‐5.39, 5.39] |
| 4.3 Supplemental breast milk vs 12.5% sucrose (single dose) | 1 | 43 | Mean Difference (IV, Fixed, 95% CI) | 35.0 [29.04, 40.96] |
| 4.4 Supplemental breast milk vs 12.5% sucrose (2 doses) | 1 | 41 | Mean Difference (IV, Fixed, 95% CI) | 22.0 [13.09, 30.91] |
| 4.5 Supplemental breast milk vs 20% sucrose | 2 | 95 | Mean Difference (IV, Fixed, 95% CI) | 10.50 [4.10, 16.91] |
| 4.6 Supplemental breast milk vs 25% sucrose | 1 | 68 | Mean Difference (IV, Fixed, 95% CI) | 33.17 [12.08, 54.26] |
| 4.7 Supplemental breast milk vs 10% glucose | 2 | 110 | Mean Difference (IV, Fixed, 95% CI) | 3.58 [‐1.52, 8.68] |
| 4.8 Supplemental breast milk vs 25% glucose | 1 | 50 | Mean Difference (IV, Fixed, 95% CI) | 29.76 [24.14, 35.38] |
| 4.9 Supplemental breast milk vs 30% glucose | 1 | 60 | Mean Difference (IV, Fixed, 95% CI) | 12.91 [‐3.26, 29.08] |
| 4.10 Supplemental breast milk vs 50% glucose | 1 | 50 | Mean Difference (IV, Fixed, 95% CI) | 27.2 [20.89, 33.51] |
| 4.11 Supplemental breast milk vs artificial sweetener | 1 | 40 | Mean Difference (IV, Fixed, 95% CI) | 41.0 [‐6.61, 88.61] |
| 4.12 Supplemental breast milk vs glycine | 1 | 40 | Mean Difference (IV, Fixed, 95% CI) | 51.8 [6.33, 97.27] |
| 4.13 Supplemental breast milk vs non‐nutritive sucking (pacifier) | 2 | 98 | Mean Difference (IV, Fixed, 95% CI) | 44.23 [38.47, 49.98] |
| 4.14 Supplemental breast milk vs massage | 1 | 35 | Mean Difference (IV, Fixed, 95% CI) | ‐9.0 [‐16.97, ‐1.03] |
| 4.15 Supplemental breast milk vs rocking | 1 | 35 | Mean Difference (IV, Fixed, 95% CI) | 31.0 [24.47, 37.53] |
| 4.16 Supplemental breast milk vs no intervention | 1 | 60 | Mean Difference (IV, Fixed, 95% CI) | 36.7 [0.60, 72.80] |
| 4.17 Supplemental breast milk vs two doses of supplemental breast milk | 1 | 41 | Mean Difference (IV, Fixed, 95% CI) | ‐11.0 [‐21.22, ‐0.78] |
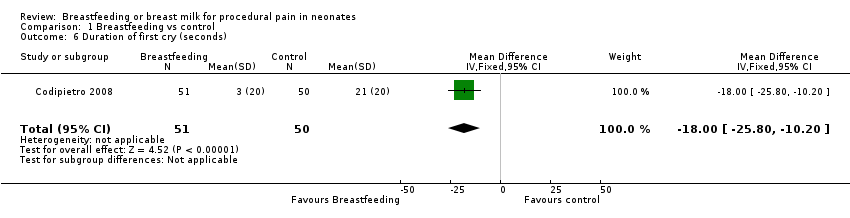
| 5 Duration of first cry (seconds) Show forest plot | 2 | 376 | Mean Difference (IV, Fixed, 95% CI) | 4.58 [3.32, 5.85] |
|
| 5.1 Supplemental breast milk vs 20% sucrose | 1 | 35 | Mean Difference (IV, Fixed, 95% CI) | 6.0 [2.50, 9.50] |
| 5.2 Supplemental breast milk vs placebo (water) | 2 | 83 | Mean Difference (IV, Fixed, 95% CI) | ‐3.77 [‐6.73, ‐0.82] |
| 5.3 Supplemental breast milk vs non‐nutritive sucking (pacifier) | 1 | 38 | Mean Difference (IV, Fixed, 95% CI) | 4.0 [0.18, 7.82] |
| 5.4 Supplemental breast milk vs massage | 1 | 35 | Mean Difference (IV, Fixed, 95% CI) | ‐6.0 [‐12.34, 0.34] |
| 5.5 Supplemental breast milk vs rocking | 1 | 35 | Mean Difference (IV, Fixed, 95% CI) | 3.0 [‐1.52, 7.52] |
| 5.6 Supplemental breast milk vs 10% glucose | 1 | 50 | Mean Difference (IV, Fixed, 95% CI) | 1.92 [‐1.38, 5.22] |
| 5.7 Supplemental breast milk vs 25% glucose | 1 | 50 | Mean Difference (IV, Fixed, 95% CI) | 12.78 [9.36, 16.20] |
| 5.8 Supplemental breast milk vs 50% glucose | 1 | 50 | Mean Difference (IV, Fixed, 95% CI) | 11.56 [8.54, 14.58] |
| 6 Neonatal Infant pain scale (NIPS) Show forest plot | 1 | 180 | Mean Difference (IV, Fixed, 95% CI) | 1.07 [0.33, 1.81] |
|
| 6.1 Supplemental breast milk vs 20% sucrose | 1 | 60 | Mean Difference (IV, Fixed, 95% CI) | 2.20 [0.97, 3.43] |
| 6.2 Supplemental breast milk vs non‐nutritive sucking (pacifier) | 1 | 60 | Mean Difference (IV, Fixed, 95% CI) | 1.20 [‐0.14, 2.54] |
| 6.3 Supplemental breast milk vs no intervention | 1 | 60 | Mean Difference (IV, Fixed, 95% CI) | ‐0.30 [‐1.60, 1.00] |
| 7 Neonatal Facial Coding Score at 3 minutes Show forest plot | 3 | | Mean Difference (IV, Fixed, 95% CI) | Subtotals only |
|
| 7.1 Supplemental breast milk vs placebo | 3 | 183 | Mean Difference (IV, Fixed, 95% CI) | ‐0.57 [‐0.97, ‐0.16] |
| 7.2 Supplemental breast milk vs artificial sweetener | 1 | 40 | Mean Difference (IV, Fixed, 95% CI) | ‐0.22 [‐0.65, 0.21] |
| 7.3 Supplemental breast milk vs glycine | 1 | 40 | Mean Difference (IV, Fixed, 95% CI) | ‐0.47 [‐0.90, ‐0.04] |
| 8 Neonatal Facial Coding Score (NFCS) at 2 minutes Show forest plot | 1 | | Mean Difference (IV, Fixed, 95% CI) | Subtotals only |
|
| 8.1 Supplemental breast milk vs placebo (water) | 1 | 45 | Mean Difference (IV, Fixed, 95% CI) | ‐0.84 [‐1.09, ‐0.59] |
| 8.2 Supplemental breast milk vs placebo (2 doses of water) | 1 | 44 | Mean Difference (IV, Fixed, 95% CI) | ‐0.59 [‐0.83, ‐0.35] |
| 8.3 Supplemental breast milk vs 12.5% sucrose (single dose) | 1 | 43 | Mean Difference (IV, Fixed, 95% CI) | 0.92 [0.64, 1.20] |
| 8.4 Supplemental breast milk vs 12.5% sucrose (2 doses) | 1 | 41 | Mean Difference (IV, Fixed, 95% CI) | 0.16 [‐0.11, 0.43] |
| 8.5 Supplemental breast milk vs two doses of supplemental breast milk | 1 | 41 | Mean Difference (IV, Fixed, 95% CI) | ‐1.14 [‐1.37, ‐0.91] |
| 9 Douleur Aigue du Nouveau‐né (DAN) at 2 minutes Show forest plot | 1 | | Mean Difference (IV, Fixed, 95% CI) | Subtotals only |
|
| 9.1 Supplemental breast milk vs 20% sucrose | 1 | 35 | Mean Difference (IV, Fixed, 95% CI) | 0.10 [‐0.30, 0.50] |
| 9.2 Supplemental breast milk vs placebo (water) | 1 | 33 | Mean Difference (IV, Fixed, 95% CI) | ‐1.10 [‐1.65, ‐0.55] |
| 9.3 Supplemental breast milk vs non‐nutritive sucking (pacifier) | 1 | 38 | Mean Difference (IV, Fixed, 95% CI) | 0.80 [0.40, 1.20] |
| 9.4 Supplemental breast milk vs massage | 1 | 35 | Mean Difference (IV, Fixed, 95% CI) | ‐0.5 [‐0.91, ‐0.09] |
| 9.5 Supplemental breast milk vs rocking | 1 | 35 | Mean Difference (IV, Fixed, 95% CI) | 1.1 [0.65, 1.55] |
| 10 Body pain score Show forest plot | 1 | | Mean Difference (IV, Fixed, 95% CI) | Subtotals only |
|
| 10.1 Supplemental breast milk vs placebo | 1 | 40 | Mean Difference (IV, Fixed, 95% CI) | 0.48 [‐0.38, 1.34] |
| 10.2 Supplemental breast milk vs artificial sweetener | 1 | 40 | Mean Difference (IV, Fixed, 95% CI) | 0.16 [‐0.72, 1.04] |
| 10.3 Supplemental breast milk vs glycine | 1 | 40 | Mean Difference (IV, Fixed, 95% CI) | 0.43 [‐0.51, 1.37] |