Inducción del trabajo de parto a partir de la semana 37 de gestación
Resumen
Antecedentes
Los riesgos de mortinatalidad o muerte neonatal aumentan a medida que la gestación se prolonga más allá del término (alrededor de las 40 semanas de gestación). No está claro si una política de inducción del trabajo de parto puede reducir estos riesgos. Esta revisión Cochrane es una actualización de una revisión que se publicó originalmente en 2006 y se actualizó posteriormente en 2012 y 2018.
Objetivos
Evaluar los efectos de unas directrices de inducción del parto a partir de la semana 37 de gestación, en comparación con unas directrices de espera indefinidamente hasta el parto espontáneo (o hasta una edad gestacional posterior o hasta que surja una indicación materna o fetal para la inducción del parto), sobre los desenlaces de embarazo para el recién nacido y la madre.
Métodos de búsqueda
Para esta actualización se hicieron búsquedas en el registro de ensayos del Grupo Cochrane de Embarazo y Parto (Cochrane Pregnancy and Childbirth's Trials Register), ClinicalTrials.gov, y en la Plataforma de registros internacionales de ensayos clínicos de la Organización Mundial de la Salud (OMS) (ICTRP) (17 de julio de 2019), y en las listas de referencias de los estudios obtenidos.
Criterios de selección
Ensayos controlados aleatorizados (ECA) realizados en mujeres embarazadas a partir de las 37 semanas, que compararon una estrategia de inducción del trabajo de parto con una estrategia de espera del inicio espontáneo del trabajo de parto (tratamiento expectante). También se incluyeron ensayos publicados solo en forma de resumen. Los ECA grupales, los ensayos cuasialeatorizados y los ensayos que utilizaron un diseño cruzado (cross‐over) no fueron elegibles para su inclusión en esta revisión.
Se incluyeron embarazadas a partir de 37 semanas de gestación. Como los factores de riesgo en este estadio del embarazo requerirían normalmente una intervención, solo fueron elegibles los ensayos que reclutaron mujeres con un riesgo bajo de complicaciones, definido por los autores de los ensayos. Los ensayos de inducción del trabajo de parto en mujeres con rotura de membranas antes del trabajo de parto a término o más allá del término no se consideraron en esta revisión, pero se consideran en una revisión Cochrane separada.
Obtención y análisis de los datos
Dos autores de la revisión, de forma independiente, evaluaron los ensayos para inclusión, evaluaron el riesgo de sesgo y extrajeron los datos. Se verificó la exactitud de los datos. La certeza de la evidencia se evaluó con los criterios GRADE.
Resultados principales
En esta revisión actualizada se incluyeron 34 ECA (que informaron acerca de más de 21 000 mujeres y lactantes), la mayoría realizados en contextos de ingresos altos. Los ensayos compararon una estrategia de inducción del parto generalmente después de 41 semanas completas de gestación (> 287 días), con esperar el inicio del trabajo de parto o esperar un período antes de inducir el trabajo de parto. En general los ensayos tuvieron un riesgo de sesgo bajo a moderado .
En comparación con una política de tratamiento expectante, una política de inducción del trabajo de parto se asoció con menos muertes perinatales (por todas las causas) (riesgo relativo [RR] 0,31; intervalo de confianza [IC] del 95%: 0,15 a 0,64; 22 ensayos, 18 795 lactantes; evidencia de calidad alta). Hubo cuatro muertes perinatales en el grupo de estrategia de inducción del trabajo de parto, en comparación con 25 muertes perinatales en el grupo de conducta expectante. El número necesario a tratar para obtener un resultado beneficioso adicional (NNTB) con la inducción del parto, a fin de prevenir una muerte perinatal, fue 544 (IC del 95%: 441 a 1042). También hubo menos mortinatos en el grupo de inducción (RR 0,30; IC del 95%: 0,12 a 0,75; 22 ensayos, 18 795 lactantes; evidencia de calidad alta): dos mortinatos en el grupo de inducción y 16 en el grupo de conducta expectante.
En el caso de las mujeres en los grupos de inducción de los ensayos, es probable que hubiera menos cesáreas en comparación con la conducta expectante (RR 0,90; IC del 95%: 0,85 a 0,95; 31 ensayos, 21 030 mujeres; evidencia de calidad moderada); y probablemente poca o ninguna diferencia en los partos vaginales operatorios con la inducción (RR 1,03; IC del 95%: 0,96 a 1,10; 22 ensayos, 18 584 mujeres; evidencia de calidad moderada). La inducción puede suponer poca o ninguna diferencia en el trauma perineal (desgarro perineal grave: RR 1,04, IC del 95%: 0,85 a 1,26; cinco ensayos; 11 589 mujeres; evidencia calidad baja). La inducción probablemente da lugar a poca o ninguna diferencia en la hemorragia posparto (RR 1,02; IC del 95%: 0,91 a 1,15, nueve ensayos, 12 609 mujeres, evidencia de certeza moderada) o en la lactancia materna al alta (RR 1,00; IC del 95%: 0,96 a 1,04; dos ensayos, 7487 mujeres; evidencia de certeza moderada). La evidencia de certeza muy baja implica que no se conoce el efecto de la inducción ni de la conducta expectante en la duración de la estancia hospitalaria materna (diferencia de medias (DM) promedio ‐0,19 días, IC del 95%: ‐0,56 a 0,18; siete ensayos; 4120 mujeres; Tau² = 0,20; I² = 94%).
Las tasas de ingreso a la unidad de cuidados intensivos neonatales (UCIN) fueron inferiores (RR 0,88; IC del 95%: 0,80 a 0,96; 17 ensayos, 17 826 lactantes; evidencia de calidad alta) y es probable que menos bebés tuvieran puntuaciones de Apgar menores de 7 a los cinco minutos en los grupos de inducción, en comparación con los de la conducta expectante (RR 0,73; IC del 95%: 0,56 a 0,96; 20 ensayos, 18 345 lactantes; evidencia de calidad moderada).
La inducción o la conducta expectante podría suponer poca o ninguna diferencia en la encefalopatía neonatal (RR 0,69; IC del 95%: 0,37 a 1,31; dos ensayos, 8851 mujeres; evidencia de certeza baja); y probablemente suponga poca o ninguna diferencia en el traumatismo neonatal (RR 0,97; IC del 95%: 0,63 a 1,49; cinco ensayos, 13 106 lactantes; evidencia de certeza moderada) de la inducción comparada con la conducta expectante. Ningún ensayo informó sobre el desarrollo neurológico durante el seguimiento en la infancia ni sobre la depresión posparto.
En los análisis de subgrupos no se observaron diferencias según el momento de la inducción (< 40 versus 40‐41 versus ≥ 41 semanas de gestación), por paridad (primíparas o multíparas), ni según el estado del cuello uterino para cualquiera de los principales criterios de valoración (muerte perinatal, parto de mortinato, ingreso en UCIN, cesárea, parto vaginal operatorio o traumatismo perineal).
Conclusiones de los autores
Existe una clara reducción de la muerte perinatal con la estrategia de inducción del parto a partir de la semana 37, en comparación con la conducta expectante, aunque las tasas absolutas son bajas (0,4 versus 3 muertes por cada 1000). También hubo menores tasas de cesáreas sin aumentar las tasas de partos vaginales operatorios y hubo menos ingresos en UCIN con la estrategia de inducción. La mayoría de los criterios de valoración importantes evaluados con el sistema GRADE tuvieron calificaciones de certeza altas o moderadas.
Si bien los ensayos existentes no han informado aún sobre el desarrollo neurológico infantil, esta es un área importante para la investigación futura.
El momento óptimo para ofrecer la inducción del parto a las mujeres a partir de las 37 semanas de gestación requiere estudios de investigación adicionales, así como un examen más a fondo de los perfiles de riesgo de las mujeres y sus valores y preferencias. Ofrecer a las mujeres una orientación personalizada podría ayudarlas a elegir de manera informada entre la inducción del parto, especialmente las que pasan de las 41 semanas de gestación, o esperar a que comience el parto y/o esperar antes de inducirlo.
PICO
Resumen en términos sencillos
Inducción del trabajo de parto en mujeres con embarazos normales a partir de la semana 37
¿La norma de inducción del parto a partir de las 37 semanas de gestación reduce los riesgos de madres e hijos en comparación con la norma de espera hasta una edad gestacional más tardía o hasta que haya indicación de inducción del parto?
Esta revisión se publicó originalmente en 2006, y se actualizó en 2012 y en 2018.
¿Cuál es el problema?
El embarazo medio dura 40 semanas desde el comienzo del último período menstrual de la mujer. Los embarazos que se prolongan más allá de las 42 semanas se describen como “postérmino” o “posfecha” y la mujer y su médico podrían decidir provocar el parto mediante la inducción. Los factores asociados con el nacimiento postérmino incluyen la obesidad, el hecho de que sea el primer bebé y de que la madre tenga más de 30 años.
¿Por qué es esto importante?
La gestación prolongada podría aumentar ligeramente los riesgos para los recién nacidos, incluido un mayor riesgo de muerte (antes o poco después del parto). Sin embargo, la inducción del parto también puede tener riesgos para las madres y sus recién nacidos, especialmente si el cuello uterino de las mujeres no está preparado para el trabajo de parto. Las pruebas actuales no pueden predecir los riesgos para los bebés o sus madres, como tales, y muchos hospitales tienen directrices sobre la duración máxima que se debe permitir que tengan los embarazos.
¿Qué evidencia se encontró?
Se buscó evidencia (17 de julio de 2019) y se identificaron 34 ensayos controlados aleatorizados realizados en 16 países diferentes que incluían a más de 21 500 mujeres (la mayoría con bajo riesgo de complicaciones). Los ensayos compararon directrices de inducción de parto habitualmente después de completar 41 semanas de gestación (> 287 días) con directrices de esperar (conducta expectante).
La norma de inducción del parto se asoció con menos muertes perinatales (22 ensayos, 18 795 lactantes). Hubo cuatro muertes perinatales en el grupo de estrategia de inducción del parto, en comparación con 25 muertes perinatales en el grupo de conducta expectante. Hubo menos mortinatos en el grupo de inducción (22 ensayos, 18,795 lactantes), dos en el grupo de estrategia de inducción y 16 en el de conducta expectante.
Es probable que las mujeres en los grupos de inducción de los ensayos tuvieran menos probabilidades de sufrir una cesárea en comparación con la conducta expectante (31 ensayos, 21 030 mujeres) y es probable que hubiera poca o ninguna diferencia en los partos vaginales asistidos (22 ensayos, 18 584 mujeres).
Menos bebés ingresaron en la unidad de cuidados intensivos neonatales (UCIN) en el grupo de estrategia de inducción del parto (17 ensayos, 17 826 lactantes; evidencia de certeza alta). Es probable que una sencilla prueba de la salud del bebé (puntuación de Apgar) a los cinco minutos de nacer fuera más favorable en los grupos de inducción en comparación con el tratamiento expectante (20 ensayos, 18 345 lactantes).
La estrategia de inducción podría suponer poca o ninguna diferencia en las mujeres que experimentan un traumatismo perineal y probablemente no supone ninguna diferencia en el número de mujeres que sufren una hemorragia posparto o que están amamantando en el momento del alta. No se sabe con certeza el efecto de la inducción ni de la conducta expectante en la duración de la estancia hospitalaria materna debido a la evidencia de certeza muy baja.
En el caso de los recién nacidos, el número de traumatismos o encefalopatías fue similar en los grupos de inducción y de conducta expectante (evidencia de certeza moderada y baja, respectivamente). Ningún ensayo informó sobre el desarrollo neurológico durante el seguimiento en la infancia, ni sobre la depresión posparto. Solo tres ensayos informaron acerca de alguna medida de satisfacción materna.
¿Qué significa esto?
Una estrategia de inducción del parto, en comparación con la conducta expectante, se asocia con menos muertes de recién nacidos y probablemente menos cesáreas, y es probable que no haya diferencia o esta sea muy pequeña en relación con los partos vaginales asistidos. El mejor momento acerca de cuándo ofrecer la inducción del trabajo de parto a las mujeres a partir de las 37 semanas de gestación justifica la realización de estudios de investigación adicionales, así como un examen más a fondo de los perfiles de riesgo de las mujeres y sus valores y preferencias. Comentar los riesgos de la inducción del parto, incluidos los efectos beneficiosos y perjudiciales, podría ayudar a las mujeres a elegir de manera informada entre la inducción del parto, especialmente las que pasan de las 41 semanas de gestación, o esperar que comience el parto y/o esperar antes de inducirlo. El conocimiento por parte de las mujeres sobre la inducción, los procedimientos, sus riesgos y beneficios influye en sus elecciones y su satisfacción.
Authors' conclusions
Summary of findings
| Induction of labour for improving birth outcomes for women at or beyond 37 weeks gestation | ||||||
| Population: pregnant women at or beyond 37 weeks gestation | ||||||
| Outcomes | Anticipated absolute effects* (95% CI) | Relative effect | № of participants | Quality of the evidence | Comments | |
|---|---|---|---|---|---|---|
| Risk with expectant management | Risk with labour induction | |||||
| Perinatal death (intrauterine deaths plus neonatal deaths in the first week of life) | Study population | RR 0.31 | 18,795 | ⊕⊕⊕⊕ | Exact day of death not reported for all of the nine neonatal deaths but all were likely to have occurred in the first week of life (see Table 5) | |
| 3 per 1000 | 0.4 per 1000 (0.1 to 1.9) | |||||
| Stillbirth | Study population | RR 0.30 | 18,795 | ⊕⊕⊕⊕ | ||
| 2 per 1000 | 1 per 1000 | |||||
| Admission to neonatal intensive care unit | Study population | RR 0.88 | 17,826 | ⊕⊕⊕⊕ | ||
| 95 per 1000 | 83 per 1000 | |||||
| Neonatal encephalopathy | Study population | RR 0.69 (0.37 to 1.31) | 8,851 (2 RCTs) | ⊕⊕⊝⊝ LOW 2 | ||
| 5 per 1000 | 3 per 1000 (2 to 7) | |||||
| Apgar score less than 7 at 5 minutes | Study population | RR 0.73 | 18,345 | ⊕⊕⊕⊝ | ||
| 13 per 1000 | 10 per 1000 | |||||
| Neonatal (birth) trauma | Study population | RR 0.97 | 13,106 | ⊕⊕⊕⊝ | ||
| 7 per 1000 | 7 per 1000 | |||||
| Neurodevelopment at childhood follow‐up | Study population | ‐ | (0 RCTs) | ‐ | No RCTs reported data for this outcome. | |
| see comment | see comment | |||||
| *The risk in the intervention group (and its 95% confidence interval) is based on the assumed risk in the comparison group and the relative effect of the intervention (and its 95% CI). | ||||||
| GRADE Working Group grades of evidence | ||||||
| 1Not downgraded (larger studies (> 1000 participants) are generally at low risk of bias, although some smaller studies have unclear risk of selection bias); not downgraded for lack of blinding as unlikely to have influenced objective outcomes. 2Downgraded 2 levels for very serious concerns regarding imprecision (wide confidence intervals crossing the line of no effect). 3Downgraded 1 level for serious concerns regarding indirectness, with three studies reporting Apgar scores with more stringent cutoffs than < 5 at 7 minutes (see graph footnotes). 4Downgraded 1 level for serious concerns regarding imprecision, with wide confidence intervals crossing line of no effect. | ||||||
| Study | Cause of death | |
| Intervention Group | Control Group (Expectant management) | |
| No deaths | No deaths | |
| 1. Severe malformations (Livebirth) GA at birth and timing of death after birth not reported, but assumed to be early | 1. Malformation (Livebirth) GA at birth and timing of death after birth not reported, but assumed to be early 2. Pneumonia (Livebirth) GA at birth and timing of death after birth not reported, but assumed to be early | |
| No deaths | No deaths | |
| No deaths | 1. Congenital heart condition (Stillbirth) GA at detection of death not reported | |
| No deaths | 1. Meconium aspiration and persistent fetal circulation (Livebirth) GA at birth was 43 + 4 and timing of death after birth was early but not reported in days | |
| No deaths | 1. Cord complication (Stillbirth) GA at detection of fetal death was 40 + 3 weeks | |
| No deaths | 1. Intrauterine fetal death (Stillbirth) GA at death 41 + 5 weeks | |
| Antepartum stillbirth: 1 | Antepartum stillbirth: 1 Intrapartum stillbirth: 0 Neonatal death: 2 early deaths (no other information; time of death not reported) | |
| No deaths | 1. Hypoxic ischaemic encephalopathy (Stillbirth) GA at detection of death not reported in days 2. Massive aspiration of meconium (Stillbirth) GA at detection of death not reported | |
| No deaths | 1. Birth asphyxia secondary to a true knot in the umbilical cord (Livebirth) Birth at 294 days GA; death at 2 days of age | |
| No deaths | 1. Stillbirth in a woman with an abnormal glucose tolerance test (Stillbirth) GA at detection of death not reported 2. Neonatal death from meconium inhalation in a woman with a positive amnioscopy who refused surgical induction of labour (Livebirth) GA at detection of death not reported, but presumed early | |
| No deaths | 1. Congenital anomaly (Livebirth) Birth at 43 weeks; death at 3 days of age | |
| No deaths | No deaths | |
| One fetal death: “The stillbirth in the induction group was in a 30 year old multiparous woman who was randomised at 40 weeks+5 days and scheduled for induction at 41 weeks+1 day. She had reduced fetal movements at 40 weeks+6 days, and fetal death was diagnosed at consultation. She delivered a neonate weighing 3595 g (20th to 50th centiles). Investigations, including a postmortem examination, did not explain the stillbirth.” | 2 fetal deaths: "stillbirth was diagnosed in a 36 year old nulliparous woman at 41 weeks+3 days, when she was admitted to hospital in labour. She delivered a neonate weighing 2945 g (5th to 10th centiles). Investigations, including placental examination, did not explain the stillbirth, and the parents declined a postmortem examination. The second stillbirth in the expectant management group was diagnosed in a 32 year old multiparous woman at 41 weeks+4 days during a regular consultation in secondary care for impending post‐term pregnancy. She delivered a neonate weighing 3715 g (20th to 50th centiles). No postmortem examination was performed, but the placenta showed signs of chorioamnionitis.” | |
| No deaths reported | 1 (Stillbirth) Stillbirth after induction of labour at 42 weeks for postmaturity and meconium | |
| No deaths | No deaths | |
| No deaths | No deaths | |
| No deaths reported | No deaths reported | |
| No deaths | 1 (Intrauterine fetal death) (Stillbirth) Death detected at 42 weeks' GA | |
| No deaths | No deaths | |
| No deaths | No deaths | |
| No deaths | No deaths | |
| No deaths | 6 (5 stillbirths; 1 early neonatal death) One stillborn baby had cardiovascular malformations not considered to be lethal and there were no explanations for the deaths of the other four stillbirths; Cause of the early neonatal death was hypoxic ischaemic encephalopathy in a large for gestational age neonate. | |
| GA: gestational age | ||
| Induction of labour for improving birth outcomes for women at or beyond term | ||||||
| Population: pregnant women at or beyond 37 weeks gestation | ||||||
| Outcomes | Anticipated absolute effects* (95% CI) | Relative effect | № of participants | Quality of the evidence | Comments | |
|---|---|---|---|---|---|---|
| Risk with expectant management | Risk with labour induction | |||||
| Caesarean section | Study population | RR 0.90 | 21,030 | ⊕⊕⊕⊝ | ||
| 186 per 1000 | 167 per 1000 | |||||
| Operative vaginal birth (forceps or ventouse) | Study population | RR 1.03 | 18,584 | ⊕⊕⊕⊝ | ||
| 136 per 1000 | 140 per 1000 | |||||
| Perineal trauma (severe perineal tear) | Study population | RR 1.04 | 11,589 | ⊕⊕⊝⊝ | ||
| 31 per 1000 | 33 per 1000 | |||||
| Postpartum haemorrhage | Study population | RR 1.02 | 12,609 | ⊕⊕⊕⊝ | variously defined | |
| 79 per 1000 | 81 per 1000 | |||||
| Breastfeeding at discharge | Study population | RR 1.00 (0.96 to 1.04) | 7487 (2 RCTs) | ⊕⊕⊕⊝ | ||
| 505 per 1000 | 505 per 1000 (485 to 525) | |||||
| Postnatal depression | Study population | ‐ | (0 RCTs) | ‐ | No RCTs reported data for this outcome. | |
| see comment | see comment | |||||
| Length of maternal hospital stay (days) | ‐ | ‐ | Average MD 0.19 days shorter for women who were induced | 4120 | ⊕⊝⊝⊝ VERY LOW5 | |
| *The risk in the intervention group (and its 95% confidence interval) is based on the assumed risk in the comparison group and the relative effect of the intervention (and its 95% CI). | ||||||
| GRADE Working Group grades of evidence | ||||||
| 1Downgraded 1 level for serious concerns regarding unclear allocation concealment methods for many of the 31 trials included for this outcome. 3Downgraded 1 level for serious concerns regarding indirectness with postpartum haemorrhage defined in different ways for several of the trials. 4Downgraded 1 level for indirectness with one of the two studies reporting breastfeeding 4‐8 weeks after discharge (not at discharge). 5Downgraded 1 level for serious concerns regarding selection bias, with 4 of 5 trials having with unclear allocation concealment; and downgraded 2 levels for very serious concerns regarding inconsistency, with very high statistical heterogeneity (I² = 94%). | ||||||
Background
Description of the condition
Pregnancies continuing beyond 294 days (420 weeks) are described as being 'post‐term' or 'postdate' (Roos 2010). In 2017 in the USA, 5.8% of pregnancies progressed to 41+ weeks (Martin 2018), dropping from around 10% a decade or so earlier (Olesen 2003; Zeitlin 2007). However the definition of term pregnancy is less clear, with increasing calls for term to be redefined as close to 40 completed weeks as possible (University of Sydney 2020).
While the aetiology of post‐term birth is not well elucidated (Mandruzzato 2010), risk factors such as obesity, nulliparity and maternal age greater than 30 years have been associated with an increased risk of post‐term birth (Arrowsmith 2011; Caughey 2009; Heslehurst 2017; Roos 2010). Placental senescence may play a role in the pathophysiology of post‐term birth (Mandruzzato 2010), and genetic/epigenetic factors have also been implicated (Schierding 2014).
In a systematic review of 15 million pregnancies from high‐income countries, the risk of stillbirth increased with gestational age, from 0.11 per 1000 births at 37 weeks' gestation to 3.18 per 1000 births at 42 weeks' gestation; and risk of neonatal death was nearly doubled for pregnancies continuing beyond 41 weeks, compared with 38‐41 weeks' gestation (Muglu 2019). In a large retrospective cohort study from the United States, involving 5.4 million pregnancies of low‐risk, parous women at 39 to 41 weeks' gestation, overall risks of a composite adverse neonatal outcome (any of: Apgar score less than five at five minutes, assisted ventilation for longer than six hours, neonatal seizure or neonatal mortality) and a composite adverse maternal outcome (any of: intensive care unit admission, blood transfusion, uterine rupture, or unplanned hysterectomy) increased from 39 through to 41 weeks (Chen 2019). These findings are important in that, even in settings where early booking allows accurate assessment of gestational age and antenatal services are accessible for most women, post‐term pregnancy still constitutes a high‐risk situation, especially for the baby.
The obstetric problems associated with post‐term pregnancy include induction of labour with an unfavourable cervix, caesarean section, prolonged labour, postpartum haemorrhage and traumatic birth. It is likely that some of these unwanted outcomes result from intervening when the uterus and cervix are not ready for labour (Caughey 2004).
Description of the intervention
Induction of labour is widely practised to try and prevent outcomes such as caesarean section, prolonged labour, postpartum haemorrhage and traumatic birth (Caughey 2004), and to improve health outcomes for women and their infants. Rates of induction of labour have increased over recent decades, with between and within country variations (Coates 2020; Marconi 2019). In the USA in 2017, one in four births (25.7%) was induced (Martin 2018). In Australia, the induction rate rose from 25% in 2007 to 33% in 2017 (AIHW 2019). For post‐term pregnancies, one in every two births may be induced (e.g. 52% induction rate for gestations ≥ 41 weeks as reported by Wolff 2016).
Variation in rates of post‐term births suggests that different policies and practices for managing post‐term pregnancies (especially timing of inductions) are used in Europe (Zeitlin 2007), and elsewhere. There is concern about increasing caesarean rates, despite induction rates also rising (Keirse 2010).
Earlier versions of this review included interventions involving monitoring, such as early pregnancy ultrasound, that may have an effect on the outcomes of pregnancies for women at or beyond 37 weeks. This topic is addressed in the Cochrane Review 'Ultrasound for fetal assessment in early pregnancy' (Whitworth 2015). In this update, we evaluated the effects of timing of labour induction at or beyond 37 weeks compared with expectant management (which may include various intensities and forms of monitoring).
How the intervention might work
Methods of induction of labour aim to induce cervical ripening and/or the onset of uterine contractions, and primarily include pharmacological methods (such as prostaglandins and oxytocin) and mechanical methods (such as the Foley catheter, double balloon catheter and artificial rupture of amniotic membranes: 'amniotomy'). Prostaglandins (misoprostol: prostaglandin E1 ‐ with oral, buccal/sublingual or vaginal administration; and dinoprostone: prostaglandin E2 ‐ available as vaginal gels or pessaries) are commonly used when the cervix is not favourable. When the cervix is favourable, oxytocin is usually used. The Foley catheter and/or amniotomy may be used alone, or in association with oxytocin, or misoprostol (Marconi 2019).
Why it is important to do this review
Determining the threshold for induction of post‐term pregnancies has been described as 'the 41 week to 42 week dilemma' (Keulen 2018), with many clinical practice guidelines now recommending a policy of induction at 41 weeks rather than a policy of waiting to induce at 42 weeks if spontaneous labour has not occurred (ACOG 2014; New Zealand Guideline Development Panel 2019; NICE 2008; SOGC 2017; WHO 2018). As there are no agreed standards for the timing of induction of labour, with guidance varying considerably internationally and nationally, debate continues (Coates 2020). Much uncertainty surrounds the optimal timing for induction, with clinical practice, and research studies in some settings, demonstrating trends towards earlier gestations at induction (Coates 2020).
It is important to assess whether improved outcomes such as reduced perinatal death and fewer caesarean sections can be achieved without negative impacts of being born too early, by choosing a window of timing for induction, and to determine optimal gestational thresholds, which may differ according to individual characteristics of women (Alavifard 2019).
Objectives
To assess the effects of a policy of labour induction at or beyond 37 weeks' gestation compared with a policy of awaiting spontaneous labour indefinitely (or until a later gestational age, or until a maternal or fetal indication for induction of labour arises) on pregnancy outcomes for the infant and the mother.
Methods
Criteria for considering studies for this review
Types of studies
We included randomised controlled trials. We included trials presented only as abstracts as well as trials published in full‐text manuscript format.
Cluster‐randomised trials, quasi‐randomised trials and cross‐over trials were not eligible for inclusion in this review.
Types of participants
We included pregnant women at or beyond 37 weeks. Since a risk factor at this stage of pregnancy would normally require an intervention, only trials including women at low risk for complications were eligible. We accepted the trialists' definition of 'low risk'. The trials of induction of labour exclusively in women with prelabour rupture of membranes at or beyond term were not considered in this review (and are considered in the Cochrane Review 'Planned early birth versus expectant management (waiting) for prelabour rupture of membranes at term (37 weeks or more)' (Middleton 2017), although some women participating in the eligible trials in this review may have had ruptured membranes.
Types of interventions
The intervention evaluated in this review is a policy of labour induction at a predetermined gestational age at or beyond 37 weeks. This policy is compared with 'expectant management' until an indication for birth arises. The trial protocols differ according to:
-
gestational age used in the induction of labour policy;
-
actual method of labour induction (prostaglandins, misoprostol, +/‐ oxytocin);
-
protocol used (dosage of any drugs, timing, frequency of use and mode of administration);
-
expectant management protocols (intensity of fetal well‐being assessment and fetal monitoring techniques used).
Types of outcome measures
Primary outcomes
Perinatal death (defined as intrauterine death plus neonatal death in the first week of life)
Secondary outcomes
For the infant/child
-
Stillbirth
-
Neonatal death within first week
-
Birth asphyxia (as defined by trialists)
-
Admission to neonatal intensive care unit
-
Neonatal convulsions
-
Neonatal encephalopathy
-
Use of anticonvulsants
-
Meconium aspiration syndrome
-
Pneumonia
-
Apgar score less than seven at five minutes
-
Birthweight
-
Birthweight > 4000 g
-
Neonatal trauma
-
Neurodevelopment at childhood follow‐up
For the mother
-
Mode of birth (caesarean section)
-
Operative vaginal birth (forceps or ventouse)
-
Analgesia used
-
Perineal trauma
-
Prolonged labour (cut‐off used by the trialists was used)
-
Postpartum haemorrhage (cut‐off used by the trialists was used)
-
Anxiety before birth
-
Other measures of satisfaction with the approach
-
Breastfeeding at discharge
-
Postnatal depression
Health services use
-
Length of maternal postnatal stay
-
Length of neonatal postnatal stay
-
Length of labour
Cost‐related analyses are described in the Discussion.
Search methods for identification of studies
The following methods section of this review is based on a standard template used by Cochrane Pregnancy and Childbirth.
Electronic searches
We searched Cochrane Pregnancy and Childbirth’s Trials Register by contacting their Information Specialist (17 July 2019).
The Register is a database containing over 25,000 reports of controlled trials in the field of pregnancy and childbirth. It represents over 30 years of searching. For full current search methods used to populate Pregnancy and Childbirth’s Trials Register including the detailed search strategies for CENTRAL, MEDLINE, Embase and CINAHL, the list of handsearched journals and conference proceedings, and the list of journals reviewed via the current awareness service, please follow this link.
Briefly, Cochrane Pregnancy and Childbirth’s Trials Register is maintained by the Information Specialist and contains trials identified from:
-
monthly searches of the Cochrane Central Register of Controlled Trials (CENTRAL);
-
weekly searches of MEDLINE (Ovid);
-
weekly searches of Embase (Ovid);
-
monthly searches of CINAHL (EBSCO);
-
handsearches of 30 journals and the proceedings of major conferences;
-
weekly current awareness alerts for a further 44 journals plus monthly BioMed Central email alerts.
Search results are screened by two people and the full text of all relevant trial reports identified through the searching activities described above is reviewed. Based on the intervention described, each trial report is assigned a number that corresponds to a specific Pregnancy and Childbirth review topic (or topics), and is then added to the Register. The Information Specialist searches the Register for each review using this topic number rather than keywords. This results in a more specific search set that has been fully accounted for in the relevant review sections (Included studies; Excluded studies; Studies awaiting classification; Ongoing studies).
In addition, we searched ClinicalTrials.gov and the WHO International Clinical Trials Registry Platform (ICTRP) for unpublished, planned and ongoing trial reports (17 July 2019) (see: Appendix 1 for search methods used).
Searching other resources
We searched the reference lists of retrieved studies. We did not apply any language or date restrictions.
Data collection and analysis
For methods used in the previous versions of this review, seeGülmezoglu 2012; and Middleton 2018.
For this update, the following methods were used for assessing the reports that were identified as a result of the updated search. Where required, information pertaining to the previously included studies was updated according to methods outlined in the Cochrane Handbook for Systematic Reviews of Interventions (Higgins 2011).
Selection of studies
Two review authors independently assessed for inclusion all the potential studies identified as a result of the search strategy. We resolved any disagreement through discussion or, if required, we consulted the third review author.
Data extraction and management
We designed a form to extract data. For eligible studies, two review authors extracted the data using the agreed form. We resolved discrepancies through discussion or, if required, we consulted the third review author. Data were entered into Review Manager software (RevMan 2014), and checked for accuracy.
When information regarding any of the above was unclear, we planned to contact authors of the original reports to provide further details.
Assessment of risk of bias in included studies
Two review authors independently assessed risk of bias for each study using the criteria outlined in the Cochrane Handbook for Systematic Reviews of Interventions (Higgins 2011). Any disagreement was resolved by discussion or by involving the third review author.
(1) Allocation (checking for possible selection bias)
We described for each included study the method used to generate the allocation sequence in sufficient detail to allow an assessment of whether it should produce comparable groups.
We assessed the method as:
-
low risk of bias (any truly random process, e.g. random number table; computer random number generator);
-
high risk of bias (any non‐random process, e.g. odd or even date of birth; hospital or clinic record number);
-
unclear risk of bias.
(2) Allocation concealment (checking for possible selection bias)
We described for each included study the method used to conceal allocation to interventions prior to assignment and assessed whether the intervention allocation could have been foreseen in advance of, or during recruitment, or changed after assignment.
We assessed the methods as:
-
low risk of bias (e.g. telephone or central randomisation; consecutively numbered sealed opaque envelopes);
-
high risk of bias (open random allocation; unsealed or non‐opaque envelopes, alternation; date of birth);
-
unclear risk of bias.
(3.1) Blinding of participants and personnel (checking for possible performance bias)
We described for each included study the methods used, if any, to blind study participants and personnel from knowledge of which intervention a participant received. We considered that studies were at low risk of bias if they were blinded, or if we judged that the lack of blinding was unlikely to affect results. We assessed blinding separately for different outcomes or classes of outcomes.
We assessed the methods as:
-
low, high or unclear risk of bias for participants;
-
low, high or unclear risk of bias for personnel.
(3.2) Blinding of outcome assessment (checking for possible detection bias)
We described for each included study the methods used, if any, to blind outcome assessors from knowledge of which intervention a participant received. We assessed blinding separately for different outcomes or classes of outcomes.
We assessed methods used to blinded outcome assessment as:
-
low, high or unclear risk of bias.
(4) Incomplete outcome data (checking for possible attrition bias due to the amount, nature and handling of incomplete outcome data)
We described for each included study, and for each outcome or class of outcomes, the completeness of data including attrition and exclusions from the analysis. We stated whether attrition and exclusions were reported and the numbers included in the analysis at each stage (compared with the total randomised participants), reasons for attrition or exclusion where reported, and whether missing data were balanced across groups or were related to outcomes. Where sufficient information was reported, or could be supplied by the trial authors, we planned to re‐include missing data in the analyses which we undertook.
We assessed methods as:
-
low risk of bias (e.g. no missing outcome data; missing outcome data balanced across groups);
-
high risk of bias (e.g. numbers or reasons for missing data imbalanced across groups; ‘as treated’ analysis done with substantial departure of intervention received from that assigned at randomisation);
-
unclear risk of bias.
(5) Selective reporting (checking for reporting bias)
We described for each included study how we investigated the possibility of selective outcome reporting bias and what we found.
We assessed the methods as:
-
low risk of bias (where it is clear that all of the study’s prespecified outcomes and all expected outcomes of interest to the review have been reported);
-
high risk of bias (where not all the study’s prespecified outcomes have been reported; one or more reported primary outcomes were not prespecified; outcomes of interest are reported incompletely and so cannot be used; study fails to include results of a key outcome that would have been expected to have been reported);
-
unclear risk of bias.
(6) Other bias (checking for bias due to problems not covered by (1) to (5) above)
We described for each included study any important concerns we had about other possible sources of bias.
(7) Overall risk of bias
We made explicit judgements about whether studies were at high risk of bias, according to the criteria given in the Handbook (Higgins 2011). With reference to (1) to (6) above, we assessed the likely magnitude and direction of the bias and whether we considered it was likely to have impacted on the findings. We explored the impact of the level of bias through undertaking sensitivity analyses ‐ seeSensitivity analysis.
Measures of treatment effect
Dichotomous data
For dichotomous data, we presented results as summary risk ratio with 95% confidence intervals.
Continuous data
For continuous data, we used the mean difference. We planned to use the standardised mean difference to combine trials that measured the same outcome, but used different methods.
Unit of analysis issues
Cluster‐randomised trials
Cluster‐randomised trials were not eligible for inclusion.
Cross‐over trials
Cross‐over trials were not eligible for inclusion.
Multiple pregnancies
We did not identify any eligible studies that reported multiple pregnancies separately. If studies with multiple pregnancies are reported separately in trials included in future updates of this review, we will adjust for clustering in the analyses wherever possible, and use the inverse variance method for adjusted analyses, as described in the Cochrane Handbook for Systematic Reviews of Interventions (Higgins 2011), and in Yelland 2011.
Multi‐armed trials
Where we included studies with multiple arms, we created single pairwise comparisons, by including only the groups relevant to this review, or by combining groups. In Gelisen 2005, we combined the three induction arms for the relevant analyses.
Dealing with missing data
For included studies, we noted levels of attrition. In future updates, if more eligible studies are included, we will explore the impact of including studies with high levels of missing data in the overall assessment of treatment effect by using sensitivity analyses.
For all outcomes, we carried out analyses, as far as possible, on an intention‐to‐treat basis, i.e. we attempted to include all participants randomised to each group in the analyses. The denominator for each outcome in each trial was the number randomised minus any participants whose outcomes were known to be missing.
Assessment of heterogeneity
We assessed statistical heterogeneity in each meta‐analysis using the Tau², I² and Chi² statistics. We regarded heterogeneity as substantial if an I² was greater than 30% and either the Tau² was greater than zero, or there was a low P value (less than 0.10) in the Chi² test for heterogeneity. Where we identified substantial heterogeneity (above 30%), we aimed to explore it using prespecified subgroup analyses.
Assessment of reporting biases
Where there were 10 or more studies in the meta‐analyses, we investigated reporting biases (such as publication bias) using funnel plots. We assessed funnel plot asymmetry visually. If asymmetry was suggested by a visual assessment, we planned to perform exploratory analyses to investigate it.
Data synthesis
We carried out statistical analysis using the Review Manager software (RevMan 2014). We used fixed‐effect meta‐analysis for combining data where it was reasonable to assume that studies were estimating the same underlying treatment effect: i.e. where studies were examining the same intervention, and the studies' populations and methods were judged sufficiently similar. The denominators used for neonatal outcomes were the whole randomised population (without the stillbirths removed).
Where there was clinical heterogeneity sufficient to expect that the underlying treatment effects differed between trials, or where substantial statistical heterogeneity was detected, we used random‐effects meta‐analysis to produce an overall summary if an average treatment effect across trials was considered clinically meaningful. The random‐effects summary has been treated as the average of the range of possible treatment effects and we have discussed the clinical implications of treatment effects differing between trials. If the average treatment effect was not clinically meaningful, we decided that we would not combine trials. Where we used random‐effects analyses, the results have been presented as the average treatment effect with 95% confidence intervals, and the estimates of Tau² and I².
Subgroup analysis and investigation of heterogeneity
Where we identified substantial heterogeneity, we planned to investigate it using subgroup and sensitivity analyses. We planned to consider whether an overall summary was meaningful, and if it was, we used random‐effects analysis to produce it.
We carried out the following subgroup analyses.
-
Gestational age by week of gestation when induction was intended in the intervention arm
-
in this update, we have presented the main groups as gestational ages < 40 weeks, 40‐41 weeks, and > 41 completed weeks (> 287 days).
-
-
Parity (nulliparous versus mixed parity (primi‐ and multiparous versus not stated).
-
State of the cervix (favourable versus unfavourable versus unknown or mixed status).
We were unable to conduct subgroup analyses by method of induction, due to wide variation in reporting of dosage, timing, frequency and mode of administration.
Where possible, we used the following outcomes in subgroup analyses.
For the infant/child
-
Perinatal death, defined as intrauterine deaths plus neonatal deaths in the first week of life
-
Stillbirth
-
Admission to neonatal intensive care unit
For the mother
-
Mode of birth (caesarean section)
-
Operative vaginal birth (forceps or ventouse)
-
Perineal trauma
We assessed subgroup differences by interaction tests available within RevMan (RevMan 2014). We reported the results of subgroup analyses quoting the Chi² statistic and P value, and the interaction test I² value.
Sensitivity analysis
We carried out sensitivity analyses to explore the effect of trial risk of bias assessed by concealment of allocation, high attrition rates, or both, with studies at high risk of bias being excluded from the analyses in order to assess whether this made any difference to the overall result. We used the following outcomes in our sensitivity analyses. If enough data becomes available in future updates, we will explore the impact of including studies with high levels of missing data in the overall assessment of treatment effect by using sensitivity analyses.
For the infant/child
-
Perinatal death, defined as intrauterine deaths plus neonatal deaths in the first week of life
-
Stillbirth
-
Admission to neonatal intensive care unit
For the mother
-
Mode of birth (caesarean section)
-
Operative vaginal birth (forceps or ventouse)
-
Perineal trauma
Assessment of the certainty of the evidence using the GRADE approach
For this update, we used the GRADE approach as outlined in the GRADE handbook, in order to assess the certainty of the body of evidence relating to the following outcomes.
For the infant/child
-
Perinatal death, defined as intrauterine deaths plus neonatal deaths in the first week of life
-
Stillbirth
-
Admission to neonatal intensive care unit
-
Neonatal encephalopathy
-
Apgar score less than seven at five minutes
-
Neonatal trauma
-
Neurodevelopment at childhood follow‐up
For the mother
-
Mode of birth (caesarean section)
-
Operative vaginal birth (forceps or ventouse)
-
Perineal trauma (e.g. severe perineal tear)
-
Postpartum haemorrhage (cut‐off reported by the trialists was used)
-
Breastfeeding at discharge
-
Postnatal depression
-
Length of maternal postnatal stay
We used the GRADEpro Guideline Development Tool to import data from Review Manager 5.3 (RevMan 2014), in order to create ’Summary of findings’ tables, comparing a policy of labour induction versus expectant management. A summary of the intervention effect and a measure of certainty for each of the above outcomes was produced using the GRADE approach. The GRADE approach uses five considerations (study limitations, consistency of effect, imprecision, indirectness and publication bias) to assess the certainty of the body of evidence for each outcome. The evidence can be downgraded from 'high certainty' by one level for serious (or by two levels for very serious) limitations, depending on assessments for risk of bias, indirectness of evidence, serious inconsistency, imprecision of effect estimates or potential publication bias.
Results
Description of studies
Results of the search
See Figure 1.
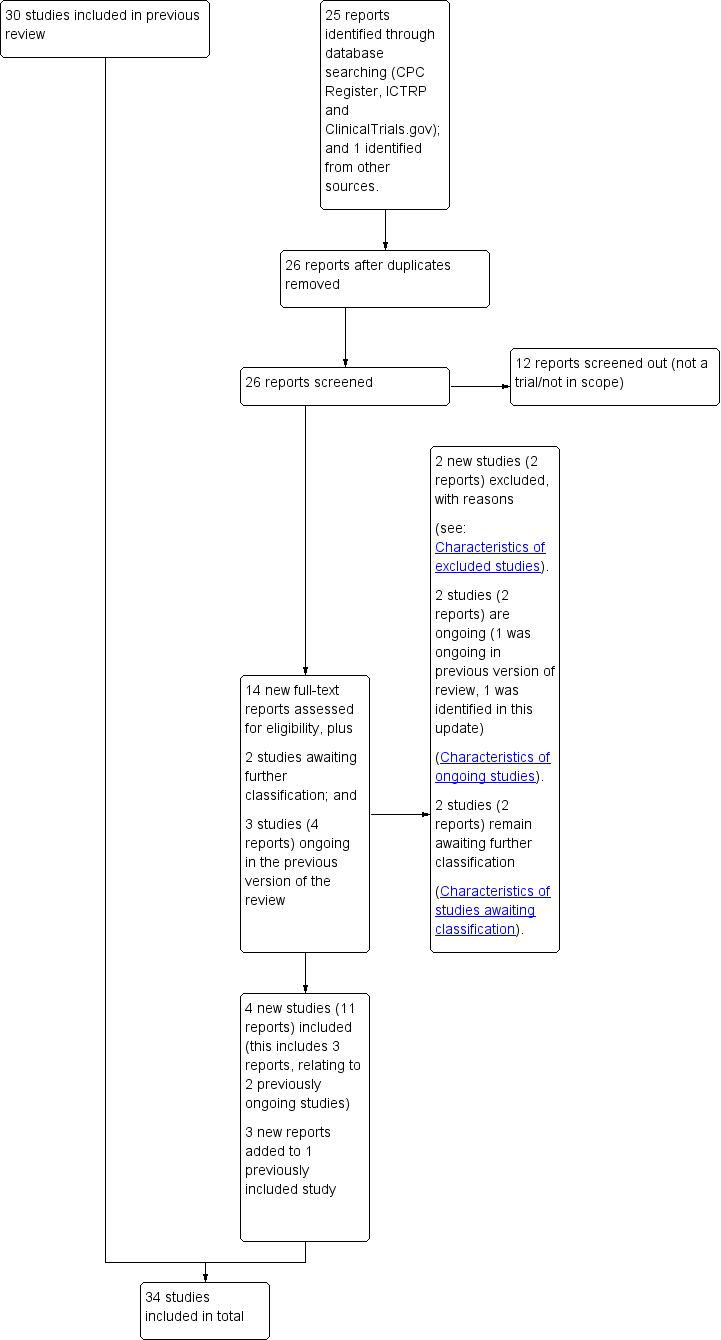
Study flow diagram.
For this update, we assessed 14 new trial reports, and re‐assessed three ongoing studies, Wennerholm 2019 (classified as Elden 2016 in the previous version of this review); Grobman 2018 (classified as NCT01990612 in the previous version of this review); ISRCTN15646866; and re‐assessed two studies which were previously awaiting further classification (Benito Reyes 2010; ISRCTN74323479)).
We included four new studies (11 reports) (Baev 2017; Grobman 2018; Sargunam 2019; Wennerholm 2019), excluded two new studies (two reports) (PACTR201805002872322; CTRI/2018/09/015719), and listed one new study as ongoing (one report) (ISRCTN83219789). Three of the new reports related to an already included study (Keulen 2019 (Kortekaas 2014 in the previous version of this review)). Two of the previously ongoing studies related to trial protocols for two newly included studies (Grobman 2018; Wennerholm 2019); and one of the previously ongoing studies (ISRCTN15646866) remains ongoing. Benito Reyes 2010 and ISRCTN74323479 remain awaiting classification (requiring an English translation, and further details, to assess eligibility respectively).
Therefore, 34 studies are included in this update (69 reports), two studies are ongoing (two reports), 66 studies are excluded (77 reports), and two studies (two reports) await further classification.
Included studies
Settings
Of the 34 included trials:
-
seven were conducted in the USA (Dyson 1987; Grobman 2018; Martin 1989; Miller 2015; NICHHD 1994; Nielsen 2005; Witter 1987);
-
four in the UK (Scotland; England; Ireland) (Cole 1975; Henry 1969; Martin 1978; Walker 2016);
-
three in China (Bergsjo 1989; Cohn 1992; Roach 1997);
-
three in Norway (Augensen 1987; Heimstad 2007; Sande 1983);
-
three in Sweden (Brane 2014; Tylleskar 1979; Wennerholm 2019);
-
two in India (Chakravarti 2000; James 2001);
-
two in Thailand (Chanrachkul 2003; Herabutya 1992);
-
one in Tunisia (Sahraoui 2005);
-
one in Turkey (Gelisen 2005);
-
one in Canada (Hannah 1992);
-
one in France (Breart 1982);
-
one in Austria (Egarter 1989);
-
one in Spain (Ocon 1997);
-
one in the Netherlands (Keulen 2019);
-
one in Malaysia (Sargunam 2019);
-
one in Finland (Suikkari 1983); and
-
one in Russia (Baev 2017).
Date trials published/conducted
-
Four trials were published in or before the 1970s (Cole 1975; Henry 1969; Martin 1978; Tylleskar 1979)
-
Nine trials were published in the 1980s (Augensen 1987; Bergsjo 1989; Breart 1982; Dyson 1987; Egarter 1989; Martin 1989; Sande 1983; Suikkari 1983; Witter 1987)
-
Six trials were published in the 1990s (Cohn 1992; Hannah 1992; Herabutya 1992; NICHHD 1994; Ocon 1997; Roach 1997)
-
Seven trials were published in the 2000s (Chakravarti 2000; Chanrachkul 2003; Gelisen 2005; Heimstad 2007; James 2001; Nielsen 2005; Sahraoui 2005)
-
Eight trials were published in the 2010s (Baev 2017; Brane 2014; Grobman 2018; Keulen 2019; Miller 2015; Sargunam 2019; Walker 2016; Wennerholm 2019).
Over half the total participants (12,074) were recruited from trials published in the last seven years.
Cervix status
Ten trials did not mention cervix status as an inclusion criterion (Bergsjo 1989; Breart 1982; Chakravarti 2000; Cohn 1992; Cole 1975; Henry 1969; James 2001; Roach 1997; Suikkari 1983; Witter 1987). Ten trials included women with unfavourable cervix (Baev 2017; Dyson 1987; Gelisen 2005; Hannah 1992; Herabutya 1992; Martin 1989; Miller 2015; NICHHD 1994; Ocon 1997; Sahraoui 2005), and five with favourable cervical status (Chanrachkul 2003; Egarter 1989; Nielsen 2005; Sande 1983; Tylleskar 1979). Nine trials included women with mixed cervical status (Augensen 1987 (35% of women with unfavourable cervix); Brane 2014; Grobman 2018; Heimstad 2007; Keulen 2019; Martin 1978; Sargunam 2019; Walker 2016; Wennerholm 2019).
Interventions
All trials were conducted in hospitals with various intensities of fetal monitoring both in the induction and expectant management groups (seeCharacteristics of included studies).
Timing of induction ‐ induction group
The information on timing of induction in each trial is outlined in Table 1.
| Study | At baseline/enrolment (all participants) | At induction (intervention group participants only) Mean [SD] unless otherwise indicated |
| 41 weeks (290‐297 days) | 294.8 days (category: ≥ 41 weeks) | |
| 40+6 weeks (283‐289 days) | 285.35 [0.93] days (category: 40‐41 weeks) | |
| 42 weeks+ (294+ days) | 294+ days, mean NR (category: ≥ 41 weeks) | |
| between 37+0 and 41+6 weeks | 282 [5.9] days (category: 40‐41 weeks) | |
| 37 to 39 weeks (259‐273 days) | 259‐273 days, mean NR (category: < 40 weeks) | |
| < 41 weeks (< 290 days) | < 290 days, mean NR (category: 40‐41 weeks) | |
| 41+3 weeks (290 days) | 290.4 [1.4] days (category: ≥ 41 weeks) | |
| 42+0 weeks (294 days) | 294+ days (category: ≥ 41 weeks) | |
| 39 to 40 weeks (273‐280 days) | 273‐280 days, mean NR (category: < 40 weeks) | |
| 41 weeks+ (287 days+) | 296.3 [2.6] days (category: ≥ 41 weeks) | |
| 40 weeks (280 days) | 280 days (category: 40 to 41 weeks ) | |
| 41 weeks+ 0‐1 | 286‐288 days (category: ≥ 41 weeks) | |
| 380 weeks to 386 (268‐274 days) | 390 weeks to 394 weeks (273‐279 days) (category: < 40 weeks) | |
| 41 weeks+ (287 days+) | 287 days+ mean NR (authors stated that women were induced within 4 days of enrolment, and that 88% of women were 41 weeks GA, (287‐293 days GA), no further details) (category: ≥ 41 weeks) | |
| 406 weeks (286 days) | Mean 289 [0.7] days (category: ≥ 41 weeks) | |
| 41 weeks+ (287 days+) | 287+ days, mean NR (category: ≥ 41 weeks) | |
| 42 weeks+ (294 days+) | 294+ days, mean NR (category: ≥ 41 weeks) | |
| 41 weeks (287 days) | 287+ days, mean NR (category: ≥ 41 weeks) | |
| 405 to 410 weeks (285‐287 days) | 287 to 288 days, mean NR (category: ≥ 41 weeks) | |
| 371 to 376 weeks (260‐266 days) | 273 days (category: < 40 weeks) | |
| 41 weeks (287 days) | 287+ days, mean NR (category: ≥ 41 weeks) | |
| 380 to 386 (266 to 272 days) | 390 to 396 weeks (273‐279 days), mean NR (category: < 40 weeks) | |
| 41 weeks+ (at least 287 days) | 287 days to < 301 days, mean NR (category: ≥ 41 weeks) | |
| 390 to 396 weeks (273‐279 days) | Within a week after enrolment, therefore between 39 and 40 weeks (274 to 280 days) (mean time between enrolment and induction of labour 3.7 days) (category: < 40 weeks) | |
| Unclear (due to incomplete translation of paper) | 42 completed weeks (category: ≥ 41 weeks) | |
| 410 to 416 weeks (287 to 293 days) | 42 completed weeks (category: ≥ 41 weeks) | |
| 410 to 416 weeks (287‐293 days) | 287‐293 days, mean NR (category: ≥ 41 weeks) | |
| 400 and 406 weeks | 280 to 286 days (category: 40 to 41 weeks) | |
| ≥ 39 weeks (≥ 273 days) | ≥ 273 days (category: < 40 weeks) | |
| 10 days or more post‐date | 287+ days (category: ≥ 41 weeks) | |
| At least 37 weeks (259+ days) | 40 weeks, EDD +/‐ 2 days (category: 40 to 41 weeks) | |
| 360 to 396 weeks (252‐279 days) | 390 to 396 weeks (273‐279 days) (category: < 40 weeks) | |
| 406 to 411 weeks (286 to 288 days) | 288.7 [1.1] weeks (category: ≥ 41 weeks) | |
| 41 weeks (293 to 298 days) | 42 weeks (293‐298 days) (category: ≥ 41 weeks) |
EDD : estimated due date
GA: gestational age
NR: not reported
SD: standard deviation
We have categorised timing of induction in the intervention arm into three groups:
-
induced at < 40 weeks: eight trials (Breart 1982; Cole 1975; Grobman 2018; Martin 1978; Miller 2015; Nielsen 2005; Sargunam 2019; Walker 2016);
-
induced between 40 to 41 weeks: six trials (Baev 2017; Brane 2014; Chakravarti 2000; Egarter 1989; Sande 1983; Tylleskar 1979);
-
induced at ≥ 41 weeks: 20 trials (Augensen 1987; Bergsjo 1989; Chanrachkul 2003; Cohn 1992; Dyson 1987; Gelisen 2005; Hannah 1992; Heimstad 2007; Henry 1969; Herabutya 1992; James 2001; Keulen 2019; Martin 1989; NICHHD 1994; Ocon 1997; Roach 1997; Sahraoui 2005; Suikkari 1983; Wennerholm 2019; Witter 1987).
Parity
Most of the 34 included trials included a mixture of primiparous and multiparous women:
-
primiparous women: six trials (Brane 2014; Chakravarti 2000; Grobman 2018; Miller 2015; Sargunam 2019; Walker 2016);
-
primiparous and multiparous women: 22 trials (Augensen 1987; Baev 2017; Bergsjo 1989; Breart 1982; Chanrachkul 2003; Cole 1975; Dyson 1987; Egarter 1989; Gelisen 2005; Hannah 1992; Heimstad 2007; Henry 1969; Herabutya 1992; Keulen 2019; Martin 1978; NICHHD 1994; Nielsen 2005; Sahraoui 2005; Sande 1983; Suikkari 1983; Tylleskar 1979; Wennerholm 2019);
-
not stated/unclear: six trials (Cohn 1992; James 2001; Martin 1989; Ocon 1997; Roach 1997; Witter 1987).
See Characteristics of included studies table and Table 2 for further details.
| Primiparous | Mixed (primi‐ and multiparous) | Not stated/not available |
| Wennerholm 2019 (perinatal deaths reported by parity) |
Method of induction ‐ induction group
Labour induction was by oxytocin with or without artificial rupture of membranes in most trials. In trials recruiting women with an unfavourable cervix, priming with prostaglandins was often undertaken before induction.
Of the 34 included trials:
-
two trials did not report the method used (Chakravarti 2000; Cohn 1992);
-
27 trials used oxytocin infusion in some or all women in their intervention group (Augensen 1987; Baev 2017; Bergsjo 1989; Brane 2014; Breart 1982; Chanrachkul 2003; Cole 1975; Dyson 1987; Gelisen 2005; Grobman 2018; Hannah 1992; Heimstad 2007; Henry 1969; Herabutya 1992; James 2001; Keulen 2019; Martin 1989; Miller 2015; NICHHD 1994; Nielsen 2005; Sande 1983; Sargunam 2019; Suikkari 1983; Tylleskar 1979; Walker 2016; Wennerholm 2019; Witter 1987). Of those trials, only one used oxytocin as the sole method of induction (Augensen 1987). Twenty trials used artificial rupture of membranes (AROM) where indicated, as well as oxytocin infusion (when possible) (Baev 2017; Bergsjo 1989; Brane 2014; Breart 1982; Chanrachkul 2003; Cole 1975; Grobman 2018; Heimstad 2007; Henry 1969; Herabutya 1992; James 2001; Keulen 2019; Miller 2015; Nielsen 2005; Sande 1983; Sargunam 2019; Suikkari 1983; Tylleskar 1979; Walker 2016; Witter 1987);
-
none of the included trials used AROM as the sole method of induction;
-
13 trials used intravaginal prostaglandin E2 for some or all women in the intervention group (in either gel or pessary form) (Baev 2017; Brane 2014; Dyson 1987; Egarter 1989; Hannah 1992; Herabutya 1992; Keulen 2019; NICHHD 1994; Ocon 1997; Roach 1997; Sahraoui 2005; Walker 2016; Wennerholm 2019). Four trials used prostaglandin E2 as the sole method of induction (Egarter 1989; Ocon 1997; Roach 1997; Sahraoui 2005) and eight trials used a combination of prostaglandin and oxytocin +/‐ AROM (Baev 2017; Brane 2014; Dyson 1987; Hannah 1992; Herabutya 1992; Keulen 2019; NICHHD 1994; Walker 2016);
-
six trials used vaginal misoprostol in some or all women in the intervention group (Gelisen 2005; Heimstad 2007; Keulen 2019; Miller 2015; Sargunam 2019; Wennerholm 2019), and one used vaginal mifepristone in all women in the intervention group (Baev 2017);
-
in Keulen 2019, cervical priming was according to local protocol, which included prostaglandin E2, misoprostol, Foley catheter, double balloon catheter or a combination; and in Grobman 2018, the method of cervical priming (where indicated) was left to the discretion of the woman’s obstetric provider;
-
two trials had more than one intervention group (Gelisen 2005; NICHHD 1994), although the placebo priming and oxytocin arm in NICHHD 1994 was not included in this review. The Gelisen 2005 trial had three labour induction arms with misoprostol, oxytocin and Foley catheter.
Expectant management group protocols
For the majority of trials, expectant management protocols included various combinations of fetal heart rate monitoring, ultrasound for amniotic fluid measurements and, in earlier studies, biochemical tests.
No gestational age limit for induction in the expectant management groups was imposed or reported in 10 of the trials (Brane 2014; Cohn 1992; Dyson 1987; Henry 1969; James 2001; Ocon 1997; Roach 1997; Sargunam 2019; Suikkari 1983; Witter 1987). In the remaining 24 trials, women were induced at the following times (unless they went into spontaneous labour earlier) in the expectant management groups.
-
405 to 422 weeks (Grobman 2018)
-
41 weeks (Cole 1975)
-
41 to 42 weeks (Walker 2016)
-
42 weeks (Baev 2017; Breart 1982; Chakravarti 2000; Egarter 1989; Gelisen 2005; Keulen 2019; Martin 1978; Miller 2015; Nielsen 2005; Sahraoui 2005; Sande 1983; Tylleskar 1979; Wennerholm 2019)
-
42 to 43 weeks (Augensen 1987; Heimstad 2007)
-
43 weeks (Bergsjo 1989; Martin 1989)
-
44 weeks (Chanrachkul 2003; Hannah 1992; Herabutya 1992; NICHHD 1994)
See Characteristics of included studies for further details.
Setting of induction is reported in Table 3.
| STUDY | START (hospital or home: and type of unit (obstetric or midwife‐led)) | WAITING (hospital or home) |
| Hospital "Women in group 1 (immediate induction) were then referred to the delivery department for induction" | Not reported | |
| Hospital | Not reported | |
| Hospital | Hospital (not explicitly stated that women in the induction group stayed in hospital after induction started). However authors reported that two women in the induction group (who waited up until a week for induction) stayed in hospital after randomisation, due to transport/distance issues). This suggests that some women waited at home. | |
| Hospital (Swedish delivery unit) | Hospital | |
| Unclear (in French) | Unclear (in French) | |
| Not reported | Not reported | |
| Hospital | Hospital | |
| Not reported | Not reported | |
| Hospital | Not reported | |
| Hospital | Home and hospital: women who did not have a regular contractile pattern 45 minutes after induction gel was administered were allowed to go home; those who did were admitted to the hospital. | |
| Not reported | Not reported | |
| Hospital | Hospital | |
| Not reported (A specific induction protocol was not mandated for women who underwent induction in either group). | Not reported | |
| Hospital (community and tertiary) | Not reported, only reported that when induction was started, women were treated as outpatients in the hospital | |
| Hospital | Not reported | |
| Hospital | Not reported | |
| Hospital | Home and hospital or either: women with a Bishop score > 6 stayed in hospital after the induction was performed, and sent to birthing ward; while those with a lower Bishop score were asked to go home and come in the next morning | |
| Hospital | Not reported | |
| Primary care midwifery practices (n = 123) and hospitals (n = 45) (in the Netherlands, care is provided for women with normal risk pregnancies by midwives, and for pregnancies at increased risk by obstetricians or gynaecologists) | "all women in the 41 week induction group received obstetrician led intrapartum secondary care" | |
| Hospital | Hospital | |
| Hospital | Hospital | |
| Hospital | Hospital | |
| Hospital | Hospital | |
| Hospital | Not reported | |
| Unclear (in Spanish) | Unclear (in Spanish) | |
| Hospital | Not reported | |
| Not reported | Not reported | |
| Not reported | Not reported | |
| Hospital Not stated by authors, however implied by the trial inclusion criteria: "persistent contractions after overnight hospitalisation > 8 h" | Not reported | |
| Hospital | Not reported | |
| "Two health clinics" | Health clinic where labour was induced | |
| Not reported: "In the induction group, local policies for induction of labor were followed". | Not reported | |
| Not reported | Not reported | |
| Hospital | Not reported |
Outcomes
The primary outcome of perinatal death was reported in 22 of the 34 included trials. Caesarean section was reported in 31 trials. Operative vaginal birth (forceps or ventouse) was reported in 22 trials. Apgar score less than seven at five minutes, birthweight and admission to neonatal intensive care unit, were reported in 20, 18 and 17 trials, respectively. Other outcomes, such as many of the adverse pregnancy and neonatal outcomes, were reported in fewer than half of the included trials. Only three trials reported on maternal satisfaction and only two reported on breastfeeding. No trials reported on maternal anxiety or depression.
Funding
Twelve of the 34 included trials reported their funding sources as follows: Karolinska Institute Foundations and Funds (Brane 2014); Ramathibodi Hospital Research Grants (Chanrachkul 2003; Herabutya 1992); Community Service Program of Kaiser Foundation Hospitals (Dyson 1987); Eunice Kennedy Shriver National Institute of Child Health and Human Development (Grobman 2018); Medical Research Council of Canada (Hannah 1992); and Upjohn Company of Canada supplied the prostaglandin gel for this study; ZonMW: The Netherlands Organisation for Health Research and Development (Keulen 2019); Vicksburg Hospital Medical Foundation (Martin 1989); National Institute of Child Health and Human Development, NIH, USA (NICHHD 1994); University of Malaya (Sargunam 2019); other Research for Patient Benefit Programme of the National Institute for Health Research (Walker 2016); Swedish Government and county councils, Health Technology Centre at Sahlgrenska University Hospital, Foundation of the Health and Medical care committee of the Region of Vastra Gotaland, Sweden, Hjalmar Svensson Foundation, Foundation Mary von Sydow, born Wijk donation fund, Uppsala‐Orebro regional research council, region Orebro County research committee, ALF agreement in Stockholm, Centre for Clinical Research Dalama‐Uppsala University, Sweden (Wennerholm 2019).
One trial (Baev 2017) reported receiving no funding.
Twenty‐one of the 34 included trials did not report their funding sources.
Declarations of interest
Walker 2016 declared relevant interests on the part of one author, Dr Smith: "Dr. Smith reports receiving fees for serving on an advisory board from Roche Diagnostics, consulting fees from GlaxoSmithKline, equipment loans from Roche Diagnostics and General Electric, travel support from Roche Diagnostics and Chiesi, and grant support from GlaxoSmithKline and Action Medical Research, and being named as an inventor on a pending patent (PCT/EP2014/062602) filed by GlaxoSmithKline related to retosiban as a preventive treatment for preterm labour in women with increased uterine stretch". Grobman 2018 declared interests for one author: "Dr. Silver reports receiving consulting fees from Gestavision". The authors of these studies reported no other relevant potential conflict of interest. Keulen 2019 also declared interests from one author "BWM is supported by a National Health and Medical Research Council practitioner fellowship (GNT1082548) and reports consultancy for ObsEva, Merck, and Guerbet".
Baev 2017, Miller 2015 and Wennerholm 2019 declared no conflicts of interest.
None of the remaining 28 studies reported any declarations of interest.
Excluded studies
Most of the excluded trials were comparisons of different methods of labour induction (17 trials: Ascher‐Walsh 2000; De Aquino 2003; Evans 1983; Kipikasa 2005; Lee 1997; Lemancewicz 1999; Magann 1999; Mancuso 1998; Meydanli 2003; Misra 1994; Müller 1995; Papageorgiou 1992; Rijnders 2011; Satin 1991; Stenlund 1999; Su 1996; Surbek 1997) or cervical ripening protocols (28 trials: Bell 1993; Berghella 1996; Boulvain 1998; Buttino 1990; Damania 1992; Dare 2002; Doany 1997; Elliott 1984; El‐Torkey 1992; Giacalone 1998; Hage 1993; Ingemarsson 1987; Jenssen 1977; Kadar 1990; Klopper 1969; Lien 1998; Lyons 2001; Magann 1998; Newman 1997; Rayburn 1988; Rayburn 1999; Roberts 1986; Sawai 1991; Sawai 1994; Williams 1990; Wing 2000; Wong 2002; Ziaei 2003). Nine studies were not randomised trials (Amano 1999; Cardozo 1986; Garry 2000; Heden 1991; Hernandez‐Castro 2008; Iqbal 2004; Katz 1983; Knox 1979; Ohel 1996), in two trials pregnancies were not considered low risk (PACTR201805002872322; CTRI/2018/09/015719), and there were a variety of reasons for excluding the remaining 10 studies (Alcalay 1996; Conway 2000; Dunn 1989; Frass 2011; Gregson 2015; Imsuwan 1999; Neri 2014; Nicholson 2008; Paul 1988; Suzuki 1999). More details are provided in the Characteristics of excluded studies tables.
Risk of bias in included studies
Three trials (Chakravarti 2000; Cohn 1992; Suikkari 1983), were available only as abstracts and despite extensive searches we could not locate full publications of the studies, which limited our assessment of their risk of bias.
We judged the majority of included trials to be at low to moderate risk of bias (Figure 2; Figure 3), largely due to a lack of clear reporting.

'Risk of bias' graph: review authors' judgements about each risk of bias item presented as percentages across all included studies.

'Risk of bias' summary: review authors' judgements about each risk of bias item for each included study.
Allocation
We judged 18 trials (Augensen 1987; Baev 2017; Bergsjo 1989; Chanrachkul 2003; Dyson 1987; Grobman 2018; Heimstad 2007; James 2001; Keulen 2019; Martin 1978; Miller 2015; NICHHD 1994; Nielsen 2005; Sahraoui 2005; Sargunam 2019; Walker 2016; Wennerholm 2019; Witter 1987), to be at low risk of selection bias, reporting some form of adequate random sequencing such as a computer‐generated sequence or a list of random numbers. We judged the remaining 16 trials to be at unclear risk of selection bias, as they did not report how a random sequence was generated (Brane 2014; Breart 1982; Chakravarti 2000; Cohn 1992; Cole 1975; Egarter 1989; Gelisen 2005; Hannah 1992; Henry 1969; Herabutya 1992; Martin 1989; Ocon 1997; Roach 1997; Sande 1983; Suikkari 1983; Tylleskar 1979).
Of the 34 included trials, only 11 reported a method of allocation concealment likely to have a low risk of bias ‐ either central randomisation or sequentially numbered sealed opaque envelopes (Baev 2017; Grobman 2018; Hannah 1992; Heimstad 2007; Keulen 2019; Miller 2015; NICHHD 1994; Nielsen 2005; Sargunam 2019; Walker 2016; Wennerholm 2019). Eight trials reported that they used an envelope system with an unclear risk of bias (Brane 2014; Breart 1982; Dyson 1987; Gelisen 2005; James 2001; Martin 1989; Roach 1997; Witter 1987), one trial reported a partial third party system also with unclear risk of bias (Augensen 1987), and 14 trials did not report a method for concealing allocation and were rated as being at unclear risk of bias (Bergsjo 1989; Chakravarti 2000; Chanrachkul 2003; Cohn 1992; Cole 1975; Egarter 1989; Henry 1969; Herabutya 1992; Martin 1978; Ocon 1997; Sahraoui 2005; Sande 1983; Suikkari 1983; Tylleskar 1979).
Blinding
Performance bias
Given the nature of the intervention (induction of labour) and comparison (expectant management), it was not possible or not likely for women or clinicians to be blinded to the treatment group in any of the 34 trials, and thus risk of performance bias was judged to be high for 33 trials and unclear in Sargunam 2019. For the more objective outcomes such as perinatal death, this lack of blinding is unlikely to be a major source of bias.
Detection bias
It would have been possible for outcome assessment to have been undertaken by someone blinded to allocation groups, however, for the vast majority of studies (29), blinding, or lack of blinding, of outcome assessors was not explicitly stated. Keulen 2019 was assessed to be at low risk of detection bias, stating that "The statistician who performed the analyses was blinded to the allocation of the participants and performed the analysis according to a predefined analysis plan" and another trial (Martin 1978) reported blinded outcome assessment (also rated as low risk of bias). One study indicated partial blinding of outcome assessment (Hannah 1992), with an adjudication of abnormal neonatal outcomes undertaken by a neonatologist who was unaware of the mothers' group assignments (rated as unclear risk of bias). Grobman 2018 reported that assessment of neonatal primary outcomes "requiring review" were blinded, however, did not provide information regarding blinding of other outcome assessment (rated as unclear risk of bias). Wennerholm 2019 explicitly reported on the absence of blinding for outcome assessors (caregivers) and was thus rated as high risk of bias.
As above, measurement of objective outcomes such as perinatal death is unlikely to be influenced by lack of blinding.
Incomplete outcome data
We considered the majority of trials (24) (Augensen 1987; Baev 2017; Bergsjo 1989; Breart 1982; Chanrachkul 2003; Dyson 1987; Gelisen 2005; Grobman 2018; Hannah 1992; Heimstad 2007; Henry 1969; Herabutya 1992; James 2001; Keulen 2019; Martin 1989; Miller 2015; NICHHD 1994; Nielsen 2005; Ocon 1997; Roach 1997; Sahraoui 2005; Walker 2016; Wennerholm 2019; Witter 1987) to be at low risk of attrition bias, with minimal/no losses to follow‐up or exclusions. We judged seven trials to be at unclear risk of attrition bias (Brane 2014; Chakravarti 2000; Cohn 1992; Cole 1975; Egarter 1989; Sargunam 2019; Suikkari 1983), commonly due to some post‐randomisation exclusions and/or missing data, or due to insufficient information to determine losses or exclusions (due to publication in abstract form only).
We judged three trials to be at high risk of attrition bias. In both Martin 1978 and Tylleskar 1979, between 25% and 30% of the women randomised were excluded post‐randomisation due to going into labour prior to their planned date of induction (for women in the induction group), due to obstetric abnormalities or failure to go into spontaneous labour before 42 weeks (women in the expectant management group of Martin 1978), going into labour prior to their expected delivery date (women in the expectant management group of Tylleskar 1979). In Sande 1983, a per protocol analysis was performed, where women were not analysed in the group to which they were randomised, rather according to whether they had their labour induced, or delivered spontaneously.
Selective reporting
Only five trials (Grobman 2018; Keulen 2019; Sargunam 2019; Walker 2016; Wennerholm 2019) were judged to be at low risk of reporting bias, with outcomes reported as prespecified in the published protocol. We judged 23 trials (Baev 2017; Brane 2014; Breart 1982; Chakravarti 2000; Chanrachkul 2003; Cohn 1992; Cole 1975; Dyson 1987; Gelisen 2005; Hannah 1992; Heimstad 2007; Henry 1969; Herabutya 1992; James 2001; Martin 1978; Miller 2015; NICHHD 1994; Nielsen 2005; Ocon 1997; Roach 1997; Sahraoui 2005; Suikkari 1983; Witter 1987) to be at unclear risk of reporting bias, largely due to insufficient information to assess selective reporting (i.e. no access to trial protocols and limited detail reported in manuscript methods). We considered six trials (Augensen 1987; Bergsjo 1989; Egarter 1989; Martin 1989; Sande 1983; Tylleskar 1979), to be at high risk of reporting bias, predominately due to the incomplete reporting of outcomes data (such as in text or figures only, with statements such as "no significant difference between groups" made) such that outcome data could not be included in review meta‐analyses.
Other potential sources of bias
Most of the trials (25) (Augensen 1987; Baev 2017; Bergsjo 1989; Brane 2014; Breart 1982; Chanrachkul 2003; Cole 1975; Dyson 1987; Gelisen 2005; Grobman 2018; Hannah 1992; Heimstad 2007; Henry 1969; Herabutya 1992; James 2001; Martin 1989; Miller 2015; NICHHD 1994; Ocon 1997; Roach 1997; Sahraoui 2005; Sargunam 2019; Walker 2016; Wennerholm 2019; Witter 1987), appeared to be free of other potential sources of bias. We judged the other nine trials to be at unclear risk of bias, five trials due to limited reporting (abstract only or limited methodological detail provided) (Chakravarti 2000; Cohn 1992; Martin 1978; Suikkari 1983; Tylleskar 1979); one trial each for imbalance in the numbers of women randomised to each group (Egarter 1989), baseline characteristic imbalance (Nielsen 2005), lack of reporting of baseline characteristics (Sande 1983), and the systematically different care and assessment of neonates between groups (with the induction group receiving obstetrician‐led intrapartum secondary care, and a high proportion of the expectant management group receiving midwifery‐led primary care at both the start of labour and time of birth (Keulen 2019).
Effects of interventions
See: Summary of findings 1 Labour induction versus expectant management (infant/child outcomes); Summary of findings 2 Labour induction versus expectant management (maternal outcomes)
Labour induction versus expectant management (all trials)
Primary outcome
Perinatal death
Fewer perinatal deaths occurred in the labour induction groups than in the expectant management groups: four perinatal deaths occurred in the induction group compared with 25 in the expectant group: risk ratio (RR) 0.31, 95% confidence interval (CI) 0.15 to 0.64; 22 trials; 18,795 infants; high‐certainty evidence; Analysis 1.1.
Interaction tests failed to demonstrate differences between the timing of induction subgroups for perinatal deaths (Chi² = 0.62, P = 0.73, I² = 0%; Analysis 2.1); parity (Chi² = 0.08, P = 0.77, I² = 0%; Analysis 3.1); or for subgroups according to state of cervix (Chi² = 0.01, P = 0.99, I² = 0%; Analysis 4.1). Rates of perinatal death by gestation are also presented in Table 4.
| Week | IOL | Expectant | ||
| rate/1000 | rate/1000 | |||
| 37 | 0 | 0 | 0 | 0 |
| 38 | 0/111 | 0 | 1/117 | 8.5 |
| 39 | 2/3455 | 0.6 | 4/3443 | 1.2 |
| 40‐41 | 0/380 | 0 | 1/380 | 2.6 |
| ≥ 42 | 2/5472 | 0.37 | 19/5437 | 3.5 |
IOL: induction of labour
Two trials reported perinatal death by parity ‐ Keulen 2019 reported three stillbirths (one in a nulliparous woman and one in a multiparous woman in the expectant management group; and one in a multiparous woman in the induction group); and in Wennerholm 2019 all six perinatal deaths (five stillbirths and one neonatal death) occurring in the expectant management group in nulliparous women.
Some trials (e.g. Hannah 1992), excluded perinatal deaths due to congenital anomalies while other trials included these. If the three deaths reported to be due to congenital anomalies in other trials were excluded, there were then a total of three deaths in the labour induction group and 23 in the expectant management group. This made little difference to the overall result (RR 0.30, 95% CI 0.14 to 0.64).
Table 5 details, where known, the respective causes of death (stillbirths and neonatal deaths) for 19 babies, including the stillbirth reported in Martin 1978 (where it was not clear if there were any neonatal deaths).
The number needed to treat for an additional beneficial outcome (NNTB) with a policy of induction of labour in order to prevent one perinatal death was 544 (95% CI 441 to 1042).
Twelve trials, (Baev 2017; Brane 2014; Breart 1982; Chakravarti 2000; Cohn 1992; Miller 2015; Nielsen 2005; Ocon 1997; Roach 1997; Sargunam 2019; Tylleskar 1979; Witter 1987), did not report on perinatal deaths.
Sensitivity analyses
Only 10 of the 34 trials were judged to be of low risk of bias, defined as adequate allocation concealment and low attrition (Baev 2017; Grobman 2018; Hannah 1992; Heimstad 2007; Keulen 2019; Miller 2015; NICHHD 1994; Nielsen 2005; Walker 2016; Wennerholm 2019). We have presented each of the sensitivity analyses under each of the relevant prespecified outcomes.
-
Perinatal death ‐ sensitivity analysis: RR 0.29, 95% CI 0.10 to 0.83; seven trials, 15,539 infants. There were three perinatal deaths in the induction group and 14 perinatal deaths in the expectant management group. This sensitivity analysis was similar to the overall analysis (RR 0.31, 95% CI 0.15 to 0.64), favouring induction over expectant management.
Secondary outcomes for the infant/child
Stillbirth
Eighteen of the 25 perinatal deaths were stillbirths. Two stillbirths occurred in the induction group and 16 stillbirths occurred in the expectant management group (RR 0.30, 95% CI 0.12 to 0.75; 22 trials; 18,795 infants; high‐certainty evidence; Analysis 1.2). Interaction tests failed to demonstrate differences between the timing of induction subgroups (Chi² = 0.49, P = 0.78, I² = 0%; Analysis 2.2) or for subgroups according to by parity (Chi² = 0.13, P = 0.72, I² = 0%; Analysis 3.2) or state of cervix (Chi² = 0.01, P = 0.99, I² = 0%; Analysis 4.2) for the outcome of stillbirth.
Sensitivity analyses
-
Stillbirth ‐ sensitivity analysis: RR 0.27, 95% CI 0.08 to 0.98; seven trials, 15,539 infants, with two stillbirths in the induction group and 10 stillbirths in the expectant management group. This sensitivity analysis was similar to the overall analysis (RR 0.30, 95% CI 0.12 to 0.75), favouring induction over expectant management.
Neonatal death
There were 11 live birth deaths ‐ two of these were in the induction group and nine were in the expectant management groups (RR 0.39, 95% CI 0.13 to 1.14; 21 trials; 18,611 infants; Analysis 1.3).
Birth asphyxia
Rates of birth asphyxia were not clearly different between the induction and expectant management groups (RR 1.66, 95% CI 0.61 to 4.55: four trials; 1456 infants; Analysis 1.4).
Admission to neonatal intensive care unit (NICU)
Rates of NICU admissions were lower when labour induction was compared with expectant management (RR 0.88, 95% CI 0.80 to 0.96; 17 trials; 17,826 infants; high‐certainty evidence; Analysis 1.5).
Interaction tests failed to demonstrate differences between the timing of induction subgroups (Chi² = 1.67, P = 0.43, I² = 0%; Analysis 2.3) or for subgroups according to parity (Chi² = 2.03, P = 0.36, I² = 1.4%; Analysis 3.3) or state of cervix (Chi² = 0.81, P = 0.67, I² = 0%; Analysis 4.3) for the outcome of NICU admission.
Sensitivity analyses
-
Admission to the NICU ‐ sensitivity analysis: RR 0.87, 95% CI 0.79 to 0.96; nine trials, 15,709 infants. This was very similar to the overall analysis (RR 0.88, 95% CI 0.80 to 0.96).
Neonatal convulsions
There were no clear differences in instances of neonatal convulsions when labour induction was compared with expectant management (average RR 1.01, 95% CI 0.15 to 6.67; Tau² = 2.25; Chi² = 7.96, P = 0.05; I² = 62%; 5 trials, 13,216 infants; Analysis 1.6). The heterogeneity may be due to Grobman 2018 (who reported seizures).
Neonatal encephalopathy (HIE)
Two trials reported neonatal encephalopathy (HIE), indicating little or no difference between the induction and expectant groups (RR 0.69, 95% CI 0.37 to 1.31; 8851 infants; low‐certainty evidence; Analysis 1.7).
Use of anticonvulsants
No clear differences between induction and expectant groups were evident for use of anticonvulsants in a single trial (RR 0.34, 95% CI 0.01 to 8.17; 349 infants; Analysis 1.8).
Meconium aspiration syndrome
There was a 25% relative reduction in the risk of meconium aspiration syndrome in the induction groups compared with the expectant management groups (RR 0.75, 95% CI 0.62 to 0.92; 13 trials; 16,622 infants; Analysis 1.9).
Pneumonia
In two trials, there was a possibly decreased incidence of pneumonia in the induction group compared with the expectant management group (RR 0.54, 95% CI 0.27 to 1.06; 8851 infants; Analysis 1.10).
Apgar score less than seven at five minutes
Probably fewer babies had Apgar scores less than seven at five minutes in the induction groups compared with the expectant management groups (RR 0.73, 95% CI 0.56 to 0.96; 20 trials; 18,345 infants; moderate‐certainty evidence; Analysis 1.11). Several trials reported different cut‐offs for Apgar scores but omission of these results made little difference to the overall result.
Birthweight (g)
On average, infants born to mothers in the induction group had lower birthweights than those born to mothers in the expectant management group (mean difference (MD) ‐59.38 g, 95% CI ‐77.03 to ‐41.73; 18 trials; 8817 infants; Analysis 1.12).
Grobman 2018 reported birthweights as median and interquartile ranges (IQR), also showing lower birthweights in the induction group (median 3330 g IQR 3040 to 3565) compared with the expectant management group (median 3380 g IQR 3110 to 3650); P < 0.001.
Birthweight greater than 4000 g
There was a 28% relative reduction in the rate of macrosomia (greater than 4000 g) in the labour induction groups (average RR 0.72, 95% CI 0.54 to 0.96; 8 trials; 5593 infants; Tau² = 0.09; Chi² = 20.84, P = 0.004; I² = 66%; Analysis 1.13) (Hannah 1992 used a cutoff‐of 4500 g rather than 4000 g for this outcome). Removal of Gelisen 2005 from the analysis for this outcome (which still observed a substantial beneficial effect, with 23/300 macrosomic infants born to women in the induction group, versus 74/300 infants to women in the expectant management group), eliminated the observed heterogeneity.
Neonatal (birth) trauma
Meta‐analysis of data from five trials suggests that induction makes little or no differencein rates of birth trauma in newborns and expectant management (RR 0.97, 95% CI 0.63 to 1.49; 13,106 infants; moderate‐quality evidence; Analysis 1.14).
Unreported outcomes
No trials reported on neurodevelopment at childhood follow‐up (although Bergsjo 1989 reported no signs of neurological impairment in children at two years of age).
Secondary outcomes for the mother
Caesarean section
There were probably fewer caesarean sections (a relative reduction of 10%) in the induction groups compared with the expectant management groups on meta‐analysis of data from 31 trials (RR 0.90, 95% CI 0.85 to 0.95; 21,030 women; moderate‐certainty evidence; Analysis 1.15). This equates to a reduction of nearly 2% (from a rate of 18.6% in the expectant management group to 16.7% in the induction group). Subgroup interaction tests did not show clear differences according to timing of induction (Chi² = 3.70, P = 0.16, I² = 45.9%; Analysis 2.4), by parity (Chi² = 1.84, P = 0.40, I² = 0%; Analysis 3.4) or by state of cervix (Chi² = 1.60, P = 0.45, I² = 0%; Analysis 4.4) for this outcome.
Sensitivity analyses
-
Caesarean section sensitivity analysis: RR 0.90, 95% CI 0.84 to 0.96; 10 trials, 16,075 women. These results are very similar to the overall analysis (RR 0.90, 95% CI 0.85 to 0.95).
Operative vaginal birth (forceps or ventouse)
Rates of operative vaginal birth showed little or no difference between the policy of labour induction and expectant management groups (RR 1.03, 95% CI 0.96 to 1.10; 22 trials, 18,584 women; moderate‐certainty evidence; Analysis 1.16). This equates to an increase of 0.4% (from a rate of 13.6% in the expectant management group to 14% in the induction group). Subgroup interaction tests did not show clear differences according to timing of induction (Chi² = 1.14, P = 0.57, I² = 0%; Analysis 2.5), parity (Chi² = 1.62, P = 0.44, I² = 0%; Analysis 3.5) or by state of cervix (Chi² = 0.73, P = 0.70, I² = 0%; Analysis 4.5) for this outcome.
Sensitivity analyses
-
Operative vaginal birth sensitivity analysis: RR 0.99, 95% CI 0.92 to 1.07; 8 trials, 15,565 women. This was similar to the overall analysis (RR 1.03, 95% CI 0.96 to 1.10).
Analgesia used
There was little or no difference in the use of epidural/regional analgesia between induction and expectant management groups (average RR 1.09, 95% CI 0.99 to 1.20; 8 trials, 4579 women; Tau² = 0.01; Chi² = 24.41, P = 0.001; I² = 71%) (Analysis 1.17). A possible increased use of analgesia (variously defined) was observed with labour induction, compared with expectant management (average RR 1.11, 95% CI 1.05 to 1.18; 4 trials, 2352 women) (Analysis 1.17).
Perineal trauma
Probably little or no difference in perineal trauma, assessed as severe perineal tear, was seen between induction and expectant management (RR 1.04, 95% 0.85 to 1.26; 5 trials; 11,589 women; low‐certainty evidence (Analysis 1.18). For episiotomy (RR 0.96, 95% CI 0.84 to 1.11; 2 trials; 1747 women; and obstetrical and sphincter injuries (RR 0.81, 95% CI 0.51 to 1.31; 2 trials; 1698 women) there were probably little or no differences between induction and expectant management (Analysis 1.18).
Interaction tests, performed for perineal trauma (assessed as severe perineal tear), failed to detect any differences for subgroups by timing of induction (Chi² = 1,89, P = 0.17, I² = 47.2% Analysis 2.6), by parity (Chi² = 1.89, P = 0.17, I² = 47.2%; Analysis 3.6) or by state of cervix (tests for subgroup differences: not applicable) for this outcome.
Sensitivity analyses
-
Sensitivity analysis for perineal trauma (severe perineal tear): all five trials reporting this outcome were judged to not be at high risk of bias and so the sensitivity analysis is the same as the overall analysis.
Prolonged labour
The outcome of prolonged labour was reported in several different ways by four trials with 1009 women, with none of the four comparisons showing clear differences between the induction and expectant management groups (Analysis 1.19).
Postpartum haemorrhage
There was probably no or little difference in rates of postpartum haemorrhage (variously defined) for induction and expectant management groups (RR 1.02, 95% CI 0.91 to 1.15; 9 trials, 12,609 women; moderate‐certainty evidence; Analysis 1.20).
Breastfeeding
There was probably no or little differences between induction and expectant groupsfor breastfeeding (at discharge in one trial; and at four to eight weeks after discharge in the other trial) (RR 1.00, 95% CI 0.96 to 1.04; 7487 infants; moderate‐certainty evidence ‐ Analysis 1.21).
Maternal satisfaction
In one trial of 496 women, more women in the induction group said that they would choose the same arm in a future trial compared with women in the expectant management group (RR 1.93, 95% CI 1.62 to 2.30), but in two other trials, similar numbers of women indicated that they preferred the group they had been allocated to (RR 0.99, 95% CI 0.88 to 1.13; 493 women; Analysis 1.22). Sargunam 2019 also reported little or no difference in satisfaction with pregnancy outcomes between groups (RR 0.92 95% CI 0.80 to 1.06; 308 women; Analysis 1.22). Walker 2016 reported little or no difference in Childbirth Experience Questionnaire scores (four‐point scale; higher scores indicate higher satisfaction) between women in the induction or expectant management groups (MD 0.07, 95% CI ‐0.02 to 0.16; 619 women; Analysis 1.23).
Grobman 2018 also reported slightly higher scores on the Labor Agentry Scale, indicating greater perceived control during childbirth in the induction group; and also reported that women in the induction group reported less pain than women in the expectant management group.
Unreported outcomes
No trials reported on anxiety before birth or postnatal depression.
Secondary outcomes relating to health service use
Length of maternal postnatal stay (days)
It is very uncertain whether there is any difference between induction or expectant management for duration of maternal hospital stay (average MD ‐0.19 days, 95% CI ‐0.56 to 0.18; 7 trials; 4120 women; very low‐quality evidence; Analysis 1.24). There was very substantial heterogeneity (Tau² = 0.20; Chi² = 104.20, P < 0.00001; I² = 94%) between the trials for this outcome.
Length of maternal postnatal stay (days, categories)
One trial of 6091 women reported five maternal postnatal stay categories (Grobman 2018) indicating slightly more women in the induction group stayed two days and slightly fewer women in the induction group stayed 3 or 4 days (Analysis 1.25).
Length of neonatal hospital stay (days)
In one trial of 302 babies, there was a slightly shorter mean hospital stay for the induction group compared with the expectant management group (MD ‐0.30 days, 95% CI ‐0.61 to 0.01; Analysis 1.26).
Length of neonatal postnatal stay (days, categories)
One trial of 6091 infants reported length of neonatal postnatal stay as five categories, which we collapsed into ≤ 2 days and ≥ 3 days. Infants in the induction group were more likely to stay ≤ 2 days than those in the expectant group (RR 1.05, 95% CI 1.02 to 1.08) and correspondingly less likely to stay ≥ 3 days (RR 0.86, 95% CI 0.79 to 0.94) (Analysis 1.27).
Length of labour (hours)
Overall, length of labour was shorter for women undergoing induction compared with expectant management (average MD ‐1.08 hours, 95% CI ‐1.67 to ‐0.50; 12 trials; 4025 women; Tau² = 0.84; Chi² = 46.70, P < 0.0001; I² = 72%; Analysis 1.28).
Funnel plots
We assessed funnel plots for the outcomes: perinatal death (Figure 4), stillbirth (Figure 5), neonatal death (Figure 6), admission to NICU (Figure 7), meconium aspiration syndrome (Figure 8), Apgar score less than seven at five minutes (Figure 9), birthweight (Figure 10), caesarean section (Figure 11), operative vaginal birth (Figure 12), postpartum haemorrhage (Figure 13) and length of labour (Figure 14).

Funnel plot of comparison: 1 Labour induction versus expectant management (all trials), outcome: 1.1 Perinatal death.

Funnel plot of comparison: 1 Labour induction versus expectant management (all trials), outcome: 1.2 Stillbirth.

Funnel plot of comparison: 1 Labour induction versus expectant management (all trials), outcome: 1.3 Neonatal death.

Funnel plot of comparison: 1 Labour induction versus expectant management (all trials), outcome: 1.5 Admission to neonatal intensive care unit.

Funnel plot of comparison: 1 Labour induction versus expectant management (all trials), outcome: 1.9 Meconium aspiration syndrome.

Funnel plot of comparison: 1 Labour induction versus expectant management (all trials), outcome: 1.11 Apgar score less than 7 at 5 minutes.

Funnel plot of comparison: 1 Labour induction versus expectant management (all trials), outcome: 1.12 Birthweight (g).

Funnel plot of comparison: 1 Labour induction versus expectant management (all trials), outcome: 1.15 Caesarean section.

Funnel plot of comparison: 1 Labour induction versus expectant management (all trials), outcome: 1.16 Operative vaginal birth (forceps or ventouse).

Funnel plot of comparison: 1 Labour induction versus expectant management (all trials), outcome: 1.20 Postpartum haemorrhage.

Funnel plot of comparison: 1 Labour induction versus expectant management (all trials), outcome: 1.28 Length of labour (hours).
Some visual asymmetry may be apparent for meconium aspiration syndrome (Figure 8); birthweight (Figure 10) and postpartum haemorrhage (Figure 13). Funnel plots for perinatal death (Figure 4), stillbirth (Figure 5), and neonatal death (Figure 6) were difficult to visually interpret.
Discussion
Summary of main results
In this updated review, we included 34 randomised controlled trials (reporting on 21,563 women).
We included pregnant women at or beyond 37 weeks' gestation. Since a risk factor at this stage of pregnancy would normally require an intervention, only trials including women at low risk for complications were eligible. We accepted the trialists' definition of 'low risk'. The trials of induction of labour in women with prelabour rupture of membranes at or beyond 37 weeks were not considered in this review.
A policy of labour induction reduced perinatal deaths (with four perinatal deaths in the labour induction policy group compared with 25 perinatal deaths in the expectant management group) (high‐certainty evidence). When restricted to a policy of induction at later gestational ages (> 41 weeks), there were two and 13 perinatal deaths, respectively. While subgroup interaction tests did not have sufficient power to assess whether perinatal mortality differed by week of gestation, the rate of perinatal deaths in the expectant management compared to the induction group for gestational age > 42 weeks, 3.5 deaths per 1000, was higher than the rate of perinatal deaths for gestational age 40 to 41 weeks (2.6 deaths per 1000) and 39 weeks (1.2 deaths per 1000); see Table 4.
Although some trials excluded deaths from congenital anomalies, other trials did not exclude these deaths. When the three deaths reported to be due to congenital anomalies were excluded, the overall findings remained very similar. Induction of labour also reduced stillbirth compared with expectant management (two versus 16 in the expectant management group), (high‐certainty evidence).
A policy of labour induction probably reduced caesarean section compared with expectant management (moderate‐certainty evidence) and probably had no or little impact on operative vaginal birth compared with expectant management (moderate‐certainty evidence). Induction of labour also reduced neonatal intensive care unit admission (high‐certainty evidence), and probably reduced the occurrence of Apgar scores less than seven at five minutes (moderate‐certainty evidence), compared with expectant management. Induction of labour probably made no or little difference for neonatal trauma, postpartum haemorrhage and breastfeeding compared with expectant management (moderate‐certainty evidence); and may lead to no or little difference in neonatal encephalopathy and perineal trauma (low‐certainty evidence). The effect of labour induction compared with expectant management on length of maternal hospital stay was uncertain (very low‐certainty evidence). Neurodevelopment at childhood follow‐up and postnatal depression were not reported by any of the included trials.
No clear differences by timing of induction (< 40 weeks versus 40 to 41 weeks versus > 41 weeks), cervical status (favourable versus unfavourable versus mixed), or parity (nulliparous versus multiparous versus mixed) were apparent in subgroup analyses for the main outcomes of this review.
For the sensitivity analyses, all six prespecified outcomes demonstrated results in the same direction as the main analyses and there was little material difference in the overall result.
This review evaluates trials where a policy of induction has been compared with a policy of waiting. However, women scheduled to be induced may not have ended up being induced; and women allocated to wait may have ended up being induced (Keirse 2010). For example, about one‐third of the women randomised to the induction policy group in the Hannah trial were not induced; and about one‐third of the women randomised to waiting or expectant management were induced (Hannah 1992).
Overall completeness and applicability of evidence
The body of evidence for this review is now quite extensive, including 34 trials and over 20,000 women. This has been sufficient to detect a difference in perinatal death between the induction and expectant management groups. The decrease seen in caesarean section with a policy of induction has been previously questioned by some authors (Keirse 2010; Mandruzzato 2010). They have suggested that the women in the large Hannah 1992 trial who were induced in the policy of induction group (66% of this group), may have had a more effective cervical ripening regimen (prostaglandin) than the women who were induced in the expectant management group (33% of this group), and that more women in the expectant management group had a caesarean section for fetal distress (8.3% versus 5.7% in the induction group) (Keirse 2010;Mandruzzato 2010). Since review results for caesarean section were similar when the Hannah 1992 trial was omitted, this is not likely to have been the reason for the effect observed.
The trials included in this review employed a wide range and combinations of induction methods (see Characteristics of included studies), and it was not possible to assess differences in outcomes by method of induction through conducting subgroup analyses. Trials were conducted in different countries and consequently this review reflects a range of strategies for both induction of labour, and expectant management, across trials.
Some women with post‐term pregnancies have described this period of unexpected waiting as being in a state of limbo, with increasingly negative feelings as the pregnancy continues, which could be addressed with more information and support from their healthcare professionals (Wessberg 2017). Our review highlighted the lack of information measured and reported by randomised trials to date, with only five (Grobman 2018; Heimstad 2007; Martin 1978; Sargunam 2019; Walker 2016) of the 34 included studies reporting some measure of maternal satisfaction. A recent systematic review of qualitative evidence included five studies addressing women's experiences and perceptions of induction of labour for uncomplicated post‐term pregnancy, highlighting the importance of women's understanding of induction in influencing their choices, decision‐making, and thus satisfaction ‐ and emphasised the need for "in‐depth and clear unbiased individualized information and education on alternatives and details of procedures as well as risks and benefits" (Akuamoah‐Boateng 2018).
As noted above, the randomised trials conducted to date have not provided data regarding longer‐term neurodevelopmental outcomes for children, and cohort studies have shown inconsistent results as to whether post‐term birth has a negative, positive or null impact on childhood development. A large cohort study from Denmark has suggested that more children born at 41 weeks' gestation or later achieved developmental milestones compared with children born at earlier term gestations (39 to 40 weeks) (Olesen 2015). A further large cohort study from Australia demonstrated elevated risks of poor child development at school age with early (at < 39 weeks' gestation) planned birth compared with birth at later gestations (Bentley 2016).
Assessment of intervention cost‐effectiveness was beyond the scope of our review, however, three of the included trials have reported data related to costs. In the Hannah 1992 trial, the mean cost of a woman undergoing induction for a post‐term pregnancy was $193 lower than for a woman managed expectantly, due mainly to the costs of additional monitoring and the significantly higher rates of caesarean section among women assigned to expectant management. Walker 2017 reported that induction of labour at 39 weeks, specifically for nulliparous women aged 35 years and over, is associated with a mean cost saving of £263 and a small additional gain in QALYs (without considering QALY gains from stillbirth prevention). A health utilisation study (based on the Grobman 2018 trial) (Grobman 2020) found that while low risk nulliparous women, assigned to induction of labour at 390 to 394 weeks spent more time on the labour and delivery suite (thus using more resources specific to induction), they had fewer antenatal visits and tests, fewer intrapartum interventions, and shorter postnatal stays, compared with women assigned to expectant management; and concluded "that the health outcome advantages associated with induction of labour are gained without incurring uniformly greater health care resource use".
Quality of the evidence
Included trials were generally at low to moderate risk of bias. Aspects of methodological quality were unclear for many of the included trials (Figure 2; Figure 3).
Most of the outcomes assessed using GRADE had a rating of high‐ or moderate‐certainty evidence (see summary of findings Table 1; summary of findings Table 2) ‐ with downgrading decisions generally due to study limitations such as risk of selection bias, or imprecise effect estimates. Postpartum haemorrhage was downgraded to moderate due to indirectedness.
However, for the majority of outcomes assessed using GRADE, statistical heterogeneity was mostly low, countering claims (e.g. Davey 2016), that some of the trials had unreliable results due to being outdated or flawed. One outcome (length of maternal stay) was downgraded to very low‐certainty evidence (due to inconsistency) and two outcomes (neonatal encephalopathy and perineal trauma (severe perineal tear)) were downgraded for imprecision.
Potential biases in the review process
Due to the rigorous methods used (comprehensive searching, double screening and data extraction, and careful appraisal and analysis), biases are likely to be low.
As mentioned above, there have been several criticisms of trials and reviews on this topic. Wood 2014 and colleagues point out that the decision to perform a caesarean section is often subjective, and anxiety from medical staff about the dangers of a prolonged pregnancy may be a factor in determining when to carry out a caesarean, as could factors such as fetal distress or fetal size. They also make the observation, whatever the reason(s) may be, that this does not change the fact that induction has shown reduced risk of caesarean section in clinical trials of induction of labour versus expectant management in women with intact membranes.
We investigated reporting biases (such as publication bias) using funnel plots for prespecified outcomes, with a small number demonstrating some asymmetry. This could indicate possible reporting bias, with the smaller published trials reporting exaggerated intervention effect estimates, and there remains the possibility that further small trials (including those reporting smaller effect estimates) remain unpublished.
Agreements and disagreements with other studies or reviews
Both observational studies and systematic reviews of randomised controlled trials of timing of induction have shown mixed findings for important outcomes including perinatal death and caesarean section rates (Davey 2016).
Wood 2014 is the most comparable systematic review and meta‐analysis in terms of included studies, though they only reported a single outcome, caesarean section. Across 27 trials in women between 37 and 42 weeks' gestation, they found a similar reduction with a policy of induction as our review. The Mishanina 2014 systematic review and meta‐analysis of induction versus expectant management at any gestational age also found a reduction in caesarean birth for inductions from 37 weeks onwards (but not if induction was at less than 37 weeks), along with an overall reduction in fetal death with induction. The recent Saccone 2019 systematic review and meta‐analysis, included only seven trials (7598 women) in women with uncomplicated singleton pregnancies at term (defined as 390 to 406 weeks) ‐ all seven trials were included in our review. While the authors did not demonstrate reductions in the risks of caesarean section or perinatal death as we have, they stated that they recognised the review was not powered for these outcomes. The Sotiriadis 2019 systematic review and meta‐analysis including women with singleton uncomplicated pregnancies, randomised between 390 and 396 weeks) ‐ a 'subset' of the Saccone 2019 review. Sotiriadis 2019 did demonstrate a reduction in caesarean section as was observed in our review. The difference in findings between Saccone 2019 and Sotiriadis 2019 appear to be largely attributable to the high rate of caesarean section in the induction group in the Miller 2015 trial (25/82 in induction group versus 14/79 in expectant group) (included in Saccone 2019 but not Sotiriadis 2019), which randomised women with an unfavourable cervix at 380 to 386 weeks.
Recent mathematical modelling (Monte Carlo microsimulation) has revealed similar findings to our review, however specifically in relation to nulliparous women at 39 weeks with uncomplicated, singleton, vertex pregnancies (Sinkey 2018). Maternal and neonatal risks (including caesarean section, maternal morbidity, stillbirth, neonatal death and neonatal morbidity) were lower with induction of labour, as compared with expectant management, including induction at 41 weeks if a woman has still not given birth (Sinkey 2018). The Keulen 2018 review was conducted specifically to focus on studies of comparisons of induction within the 41 to 42 weeks' gestation timeframe, to assess the outcomes of perinatal mortality, meconium aspiration syndrome and caesarean section. Only four trials were considered to have comparisons relevant to this timing of induction, and the authors concluded that evidence for the recommendation to induce labour at 41 weeks instead of 42 weeks for improved perinatal outcomes was lacking (Keulen 2018).
While a major concern surrounding elective induction at > 37 weeks, particularly in first pregnancies, has been increased risk of caesarean section (Davey 2016), such studies have been largely observational in nature, and increasingly, there is evidence to the contrary (Souter 2019). In a recent scoping review of clinical indications for induction, 15 studies related to induction of labour for post‐term pregnancy (> 40 weeks) were identified; this included the previous version of our review (Middleton 2018), the Keulen 2018 review, the Keulen 2019 trial, and 12 observational studies (one prospective cohort, nine retrospective cohorts, and two secondary analyses of cohort studies) (Coates 2020). Based on the totality of evidence, the authors concluded that induction of labour beyond 41 to 42 weeks was associated with reductions in perinatal death and caesarean section, though recognising the high NNT for perinatal death.
While the subgroup interaction tests for our main outcomes (perinatal death, stillbirth, admission to NICU, caesarean section, operative vaginal birth, perinatal trauma) did not demonstrate any clear differential effects of induction based on gestational age (< 40 weeks, 40 to 41 weeks, > 41 weeks), over 72% of perinatal deaths reported were in the > 41 week subgroup.
In addition to factors explored in our review's subgroup analysis (gestational age, parity, cervical status), there are various other factors that are likely to impact outcomes following induction (and may explain some discrepancies observed between studies), such as indications for caesarean section, and maternal age. For example, in an Australian retrospective cohort study (17,647 women), among nulliparous women, induction of labour at 38 to 39 weeks was shown to be associated with an increased risk of caesarean section in young women (< 25 years of age), but not associated with caesarean section for slow progress (De Vries 2019). Conversely, induction of labour at 38 to 39 weeks was associated with an increased risk of caesarean section for suspected fetal compromise among nulliparous women < 30 years (De Vries 2019). In a retrospective registry‐based study from Denmark, Finland, Iceland, Norway and Sweden (involving 3,398,586 births), advanced maternal age was associated with an increased risk of caesarean section among women undergoing induction of labour at term with singleton pregnancies without previous caesarean sections; with the absolute risk being three to five times higher across five‐year age groups in nulliparous relative to multiparous women (Bergholt 2020). It is important, however, to distinguish between different methodological approaches where comparing labour induction to spontaneous onset of labour in a retrospective cohort (instead of a prospective assessment of expectant management of pregnancy) which may lead to exaggerated estimates of the risk of caesarean birth, for example (Danilack 2016). Moreover, in our review, there did not appear to be any differential effect of caesarean section by baseline rates of studies.
Many of the current relevant clinical practice guidelines recommend offering women induction of labour after 41 completed weeks of gestation (ACOG 2014; New Zealand Guideline Development Panel 2019; NICE 2008; SOGC 2017; WHO 2018). The most recent WHO guidelines provide a recommendation for induction of labour for women who are known with certainty to have reached 41 weeks; they highlight that the guidance does not apply to settings where gestational age cannot be reliably established and the importance of discussing the potential need for induction with women in advance to provide opportunity for women to understand benefits and possible risks (WHO 2018). These guidelines were based on the previous version of this review (Middleton 2018), in which the evidence for some critical outcomes (including perinatal death, stillbirth, admission to the neonatal intensive care) were judged to be of lower certainty than this update which incorporates new evidence of higher certainty.

Study flow diagram.

'Risk of bias' graph: review authors' judgements about each risk of bias item presented as percentages across all included studies.

'Risk of bias' summary: review authors' judgements about each risk of bias item for each included study.

Funnel plot of comparison: 1 Labour induction versus expectant management (all trials), outcome: 1.1 Perinatal death.

Funnel plot of comparison: 1 Labour induction versus expectant management (all trials), outcome: 1.2 Stillbirth.

Funnel plot of comparison: 1 Labour induction versus expectant management (all trials), outcome: 1.3 Neonatal death.

Funnel plot of comparison: 1 Labour induction versus expectant management (all trials), outcome: 1.5 Admission to neonatal intensive care unit.

Funnel plot of comparison: 1 Labour induction versus expectant management (all trials), outcome: 1.9 Meconium aspiration syndrome.

Funnel plot of comparison: 1 Labour induction versus expectant management (all trials), outcome: 1.11 Apgar score less than 7 at 5 minutes.

Funnel plot of comparison: 1 Labour induction versus expectant management (all trials), outcome: 1.12 Birthweight (g).

Funnel plot of comparison: 1 Labour induction versus expectant management (all trials), outcome: 1.15 Caesarean section.

Funnel plot of comparison: 1 Labour induction versus expectant management (all trials), outcome: 1.16 Operative vaginal birth (forceps or ventouse).

Funnel plot of comparison: 1 Labour induction versus expectant management (all trials), outcome: 1.20 Postpartum haemorrhage.

Funnel plot of comparison: 1 Labour induction versus expectant management (all trials), outcome: 1.28 Length of labour (hours).

Comparison 1: Labour induction versus expectant management (all trials), Outcome 1: Perinatal death

Comparison 1: Labour induction versus expectant management (all trials), Outcome 2: Stillbirth

Comparison 1: Labour induction versus expectant management (all trials), Outcome 3: Neonatal death

Comparison 1: Labour induction versus expectant management (all trials), Outcome 4: Birth asphyxia

Comparison 1: Labour induction versus expectant management (all trials), Outcome 5: Admission to neonatal intensive care unit

Comparison 1: Labour induction versus expectant management (all trials), Outcome 6: Neonatal convulsions

Comparison 1: Labour induction versus expectant management (all trials), Outcome 7: Neonatal encephalopathy (HIE)

Comparison 1: Labour induction versus expectant management (all trials), Outcome 8: Use of anticonvulsants

Comparison 1: Labour induction versus expectant management (all trials), Outcome 9: Meconium aspiration syndrome

Comparison 1: Labour induction versus expectant management (all trials), Outcome 10: Pneumonia

Comparison 1: Labour induction versus expectant management (all trials), Outcome 11: Apgar score less than 7 at 5 minutes

Comparison 1: Labour induction versus expectant management (all trials), Outcome 12: Birthweight (g)

Comparison 1: Labour induction versus expectant management (all trials), Outcome 13: Birthweight > 4000 g

Comparison 1: Labour induction versus expectant management (all trials), Outcome 14: Neonatal (birth) trauma

Comparison 1: Labour induction versus expectant management (all trials), Outcome 15: Caesarean section

Comparison 1: Labour induction versus expectant management (all trials), Outcome 16: Operative vaginal birth (forceps or ventouse)

Comparison 1: Labour induction versus expectant management (all trials), Outcome 17: Analgesia used

Comparison 1: Labour induction versus expectant management (all trials), Outcome 18: Perineal trauma

Comparison 1: Labour induction versus expectant management (all trials), Outcome 19: Prolonged labour

Comparison 1: Labour induction versus expectant management (all trials), Outcome 20: Postpartum haemorrhage

Comparison 1: Labour induction versus expectant management (all trials), Outcome 21: Breastfeeding

Comparison 1: Labour induction versus expectant management (all trials), Outcome 22: Maternal satisfaction

Comparison 1: Labour induction versus expectant management (all trials), Outcome 23: Maternal satisfaction

Comparison 1: Labour induction versus expectant management (all trials), Outcome 24: Length of maternal hospital stay (days)

Comparison 1: Labour induction versus expectant management (all trials), Outcome 25: Length of maternal (postnatal) stay (categories)

Comparison 1: Labour induction versus expectant management (all trials), Outcome 26: Length of neonatal hospital stay (days)

Comparison 1: Labour induction versus expectant management (all trials), Outcome 27: Length of neonatal (postnatal) stay (categories)

Comparison 1: Labour induction versus expectant management (all trials), Outcome 28: Length of labour (hours)

Comparison 2: Labour induction versus expectant management (subgroup analysis by gestational age at induction), Outcome 1: Perinatal death

Comparison 2: Labour induction versus expectant management (subgroup analysis by gestational age at induction), Outcome 2: Stillbirth

Comparison 2: Labour induction versus expectant management (subgroup analysis by gestational age at induction), Outcome 3: Admission to neonatal intensive care unit

Comparison 2: Labour induction versus expectant management (subgroup analysis by gestational age at induction), Outcome 4: Caesarean section

Comparison 2: Labour induction versus expectant management (subgroup analysis by gestational age at induction), Outcome 5: Operative vaginal birth (forceps or ventouse)

Comparison 2: Labour induction versus expectant management (subgroup analysis by gestational age at induction), Outcome 6: Perineal trauma

Comparison 3: Labour induction versus expectant management (subgroup analysis by parity), Outcome 1: Perinatal death

Comparison 3: Labour induction versus expectant management (subgroup analysis by parity), Outcome 2: Stillbirth

Comparison 3: Labour induction versus expectant management (subgroup analysis by parity), Outcome 3: Admission to neonatal intensive care unit

Comparison 3: Labour induction versus expectant management (subgroup analysis by parity), Outcome 4: Caesarean section

Comparison 3: Labour induction versus expectant management (subgroup analysis by parity), Outcome 5: Operative vaginal birth (forceps or ventouse)

Comparison 3: Labour induction versus expectant management (subgroup analysis by parity), Outcome 6: Perineal trauma (severe perineal tear)

Comparison 4: Labour induction versus expectant management (subgroup analysis by status of cervix), Outcome 1: Perinatal death

Comparison 4: Labour induction versus expectant management (subgroup analysis by status of cervix), Outcome 2: Stillbirth

Comparison 4: Labour induction versus expectant management (subgroup analysis by status of cervix), Outcome 3: Admission to neonatal intensive care unit

Comparison 4: Labour induction versus expectant management (subgroup analysis by status of cervix), Outcome 4: Caesarean section

Comparison 4: Labour induction versus expectant management (subgroup analysis by status of cervix), Outcome 5: Operative vaginal birth (forceps or ventouse)

Comparison 4: Labour induction versus expectant management (subgroup analysis by status of cervix), Outcome 6: Perineal trauma
| Induction of labour for improving birth outcomes for women at or beyond 37 weeks gestation | ||||||
| Population: pregnant women at or beyond 37 weeks gestation | ||||||
| Outcomes | Anticipated absolute effects* (95% CI) | Relative effect | № of participants | Quality of the evidence | Comments | |
|---|---|---|---|---|---|---|
| Risk with expectant management | Risk with labour induction | |||||
| Perinatal death (intrauterine deaths plus neonatal deaths in the first week of life) | Study population | RR 0.31 | 18,795 | ⊕⊕⊕⊕ | Exact day of death not reported for all of the nine neonatal deaths but all were likely to have occurred in the first week of life (see Table 5) | |
| 3 per 1000 | 0.4 per 1000 (0.1 to 1.9) | |||||
| Stillbirth | Study population | RR 0.30 | 18,795 | ⊕⊕⊕⊕ | ||
| 2 per 1000 | 1 per 1000 | |||||
| Admission to neonatal intensive care unit | Study population | RR 0.88 | 17,826 | ⊕⊕⊕⊕ | ||
| 95 per 1000 | 83 per 1000 | |||||
| Neonatal encephalopathy | Study population | RR 0.69 (0.37 to 1.31) | 8,851 (2 RCTs) | ⊕⊕⊝⊝ LOW 2 | ||
| 5 per 1000 | 3 per 1000 (2 to 7) | |||||
| Apgar score less than 7 at 5 minutes | Study population | RR 0.73 | 18,345 | ⊕⊕⊕⊝ | ||
| 13 per 1000 | 10 per 1000 | |||||
| Neonatal (birth) trauma | Study population | RR 0.97 | 13,106 | ⊕⊕⊕⊝ | ||
| 7 per 1000 | 7 per 1000 | |||||
| Neurodevelopment at childhood follow‐up | Study population | ‐ | (0 RCTs) | ‐ | No RCTs reported data for this outcome. | |
| see comment | see comment | |||||
| *The risk in the intervention group (and its 95% confidence interval) is based on the assumed risk in the comparison group and the relative effect of the intervention (and its 95% CI). | ||||||
| GRADE Working Group grades of evidence | ||||||
| 1Not downgraded (larger studies (> 1000 participants) are generally at low risk of bias, although some smaller studies have unclear risk of selection bias); not downgraded for lack of blinding as unlikely to have influenced objective outcomes. 2Downgraded 2 levels for very serious concerns regarding imprecision (wide confidence intervals crossing the line of no effect). 3Downgraded 1 level for serious concerns regarding indirectness, with three studies reporting Apgar scores with more stringent cutoffs than < 5 at 7 minutes (see graph footnotes). 4Downgraded 1 level for serious concerns regarding imprecision, with wide confidence intervals crossing line of no effect. | ||||||
| Study | Cause of death | |
| Intervention Group | Control Group (Expectant management) | |
| No deaths | No deaths | |
| 1. Severe malformations (Livebirth) GA at birth and timing of death after birth not reported, but assumed to be early | 1. Malformation (Livebirth) GA at birth and timing of death after birth not reported, but assumed to be early 2. Pneumonia (Livebirth) GA at birth and timing of death after birth not reported, but assumed to be early | |
| No deaths | No deaths | |
| No deaths | 1. Congenital heart condition (Stillbirth) GA at detection of death not reported | |
| No deaths | 1. Meconium aspiration and persistent fetal circulation (Livebirth) GA at birth was 43 + 4 and timing of death after birth was early but not reported in days | |
| No deaths | 1. Cord complication (Stillbirth) GA at detection of fetal death was 40 + 3 weeks | |
| No deaths | 1. Intrauterine fetal death (Stillbirth) GA at death 41 + 5 weeks | |
| Antepartum stillbirth: 1 | Antepartum stillbirth: 1 Intrapartum stillbirth: 0 Neonatal death: 2 early deaths (no other information; time of death not reported) | |
| No deaths | 1. Hypoxic ischaemic encephalopathy (Stillbirth) GA at detection of death not reported in days 2. Massive aspiration of meconium (Stillbirth) GA at detection of death not reported | |
| No deaths | 1. Birth asphyxia secondary to a true knot in the umbilical cord (Livebirth) Birth at 294 days GA; death at 2 days of age | |
| No deaths | 1. Stillbirth in a woman with an abnormal glucose tolerance test (Stillbirth) GA at detection of death not reported 2. Neonatal death from meconium inhalation in a woman with a positive amnioscopy who refused surgical induction of labour (Livebirth) GA at detection of death not reported, but presumed early | |
| No deaths | 1. Congenital anomaly (Livebirth) Birth at 43 weeks; death at 3 days of age | |
| No deaths | No deaths | |
| One fetal death: “The stillbirth in the induction group was in a 30 year old multiparous woman who was randomised at 40 weeks+5 days and scheduled for induction at 41 weeks+1 day. She had reduced fetal movements at 40 weeks+6 days, and fetal death was diagnosed at consultation. She delivered a neonate weighing 3595 g (20th to 50th centiles). Investigations, including a postmortem examination, did not explain the stillbirth.” | 2 fetal deaths: "stillbirth was diagnosed in a 36 year old nulliparous woman at 41 weeks+3 days, when she was admitted to hospital in labour. She delivered a neonate weighing 2945 g (5th to 10th centiles). Investigations, including placental examination, did not explain the stillbirth, and the parents declined a postmortem examination. The second stillbirth in the expectant management group was diagnosed in a 32 year old multiparous woman at 41 weeks+4 days during a regular consultation in secondary care for impending post‐term pregnancy. She delivered a neonate weighing 3715 g (20th to 50th centiles). No postmortem examination was performed, but the placenta showed signs of chorioamnionitis.” | |
| No deaths reported | 1 (Stillbirth) Stillbirth after induction of labour at 42 weeks for postmaturity and meconium | |
| No deaths | No deaths | |
| No deaths | No deaths | |
| No deaths reported | No deaths reported | |
| No deaths | 1 (Intrauterine fetal death) (Stillbirth) Death detected at 42 weeks' GA | |
| No deaths | No deaths | |
| No deaths | No deaths | |
| No deaths | No deaths | |
| No deaths | 6 (5 stillbirths; 1 early neonatal death) One stillborn baby had cardiovascular malformations not considered to be lethal and there were no explanations for the deaths of the other four stillbirths; Cause of the early neonatal death was hypoxic ischaemic encephalopathy in a large for gestational age neonate. | |
| GA: gestational age | ||
| Induction of labour for improving birth outcomes for women at or beyond term | ||||||
| Population: pregnant women at or beyond 37 weeks gestation | ||||||
| Outcomes | Anticipated absolute effects* (95% CI) | Relative effect | № of participants | Quality of the evidence | Comments | |
|---|---|---|---|---|---|---|
| Risk with expectant management | Risk with labour induction | |||||
| Caesarean section | Study population | RR 0.90 | 21,030 | ⊕⊕⊕⊝ | ||
| 186 per 1000 | 167 per 1000 | |||||
| Operative vaginal birth (forceps or ventouse) | Study population | RR 1.03 | 18,584 | ⊕⊕⊕⊝ | ||
| 136 per 1000 | 140 per 1000 | |||||
| Perineal trauma (severe perineal tear) | Study population | RR 1.04 | 11,589 | ⊕⊕⊝⊝ | ||
| 31 per 1000 | 33 per 1000 | |||||
| Postpartum haemorrhage | Study population | RR 1.02 | 12,609 | ⊕⊕⊕⊝ | variously defined | |
| 79 per 1000 | 81 per 1000 | |||||
| Breastfeeding at discharge | Study population | RR 1.00 (0.96 to 1.04) | 7487 (2 RCTs) | ⊕⊕⊕⊝ | ||
| 505 per 1000 | 505 per 1000 (485 to 525) | |||||
| Postnatal depression | Study population | ‐ | (0 RCTs) | ‐ | No RCTs reported data for this outcome. | |
| see comment | see comment | |||||
| Length of maternal hospital stay (days) | ‐ | ‐ | Average MD 0.19 days shorter for women who were induced | 4120 | ⊕⊝⊝⊝ VERY LOW5 | |
| *The risk in the intervention group (and its 95% confidence interval) is based on the assumed risk in the comparison group and the relative effect of the intervention (and its 95% CI). | ||||||
| GRADE Working Group grades of evidence | ||||||
| 1Downgraded 1 level for serious concerns regarding unclear allocation concealment methods for many of the 31 trials included for this outcome. 3Downgraded 1 level for serious concerns regarding indirectness with postpartum haemorrhage defined in different ways for several of the trials. 4Downgraded 1 level for indirectness with one of the two studies reporting breastfeeding 4‐8 weeks after discharge (not at discharge). 5Downgraded 1 level for serious concerns regarding selection bias, with 4 of 5 trials having with unclear allocation concealment; and downgraded 2 levels for very serious concerns regarding inconsistency, with very high statistical heterogeneity (I² = 94%). | ||||||
| Study | At baseline/enrolment (all participants) | At induction (intervention group participants only) Mean [SD] unless otherwise indicated |
| 41 weeks (290‐297 days) | 294.8 days (category: ≥ 41 weeks) | |
| 40+6 weeks (283‐289 days) | 285.35 [0.93] days (category: 40‐41 weeks) | |
| 42 weeks+ (294+ days) | 294+ days, mean NR (category: ≥ 41 weeks) | |
| between 37+0 and 41+6 weeks | 282 [5.9] days (category: 40‐41 weeks) | |
| 37 to 39 weeks (259‐273 days) | 259‐273 days, mean NR (category: < 40 weeks) | |
| < 41 weeks (< 290 days) | < 290 days, mean NR (category: 40‐41 weeks) | |
| 41+3 weeks (290 days) | 290.4 [1.4] days (category: ≥ 41 weeks) | |
| 42+0 weeks (294 days) | 294+ days (category: ≥ 41 weeks) | |
| 39 to 40 weeks (273‐280 days) | 273‐280 days, mean NR (category: < 40 weeks) | |
| 41 weeks+ (287 days+) | 296.3 [2.6] days (category: ≥ 41 weeks) | |
| 40 weeks (280 days) | 280 days (category: 40 to 41 weeks ) | |
| 41 weeks+ 0‐1 | 286‐288 days (category: ≥ 41 weeks) | |
| 380 weeks to 386 (268‐274 days) | 390 weeks to 394 weeks (273‐279 days) (category: < 40 weeks) | |
| 41 weeks+ (287 days+) | 287 days+ mean NR (authors stated that women were induced within 4 days of enrolment, and that 88% of women were 41 weeks GA, (287‐293 days GA), no further details) (category: ≥ 41 weeks) | |
| 406 weeks (286 days) | Mean 289 [0.7] days (category: ≥ 41 weeks) | |
| 41 weeks+ (287 days+) | 287+ days, mean NR (category: ≥ 41 weeks) | |
| 42 weeks+ (294 days+) | 294+ days, mean NR (category: ≥ 41 weeks) | |
| 41 weeks (287 days) | 287+ days, mean NR (category: ≥ 41 weeks) | |
| 405 to 410 weeks (285‐287 days) | 287 to 288 days, mean NR (category: ≥ 41 weeks) | |
| 371 to 376 weeks (260‐266 days) | 273 days (category: < 40 weeks) | |
| 41 weeks (287 days) | 287+ days, mean NR (category: ≥ 41 weeks) | |
| 380 to 386 (266 to 272 days) | 390 to 396 weeks (273‐279 days), mean NR (category: < 40 weeks) | |
| 41 weeks+ (at least 287 days) | 287 days to < 301 days, mean NR (category: ≥ 41 weeks) | |
| 390 to 396 weeks (273‐279 days) | Within a week after enrolment, therefore between 39 and 40 weeks (274 to 280 days) (mean time between enrolment and induction of labour 3.7 days) (category: < 40 weeks) | |
| Unclear (due to incomplete translation of paper) | 42 completed weeks (category: ≥ 41 weeks) | |
| 410 to 416 weeks (287 to 293 days) | 42 completed weeks (category: ≥ 41 weeks) | |
| 410 to 416 weeks (287‐293 days) | 287‐293 days, mean NR (category: ≥ 41 weeks) | |
| 400 and 406 weeks | 280 to 286 days (category: 40 to 41 weeks) | |
| ≥ 39 weeks (≥ 273 days) | ≥ 273 days (category: < 40 weeks) | |
| 10 days or more post‐date | 287+ days (category: ≥ 41 weeks) | |
| At least 37 weeks (259+ days) | 40 weeks, EDD +/‐ 2 days (category: 40 to 41 weeks) | |
| 360 to 396 weeks (252‐279 days) | 390 to 396 weeks (273‐279 days) (category: < 40 weeks) | |
| 406 to 411 weeks (286 to 288 days) | 288.7 [1.1] weeks (category: ≥ 41 weeks) | |
| 41 weeks (293 to 298 days) | 42 weeks (293‐298 days) (category: ≥ 41 weeks) | |
| EDD : estimated due date | ||
| Primiparous | Mixed (primi‐ and multiparous) | Not stated/not available |
| Wennerholm 2019 (perinatal deaths reported by parity) |
| STUDY | START (hospital or home: and type of unit (obstetric or midwife‐led)) | WAITING (hospital or home) |
| Hospital "Women in group 1 (immediate induction) were then referred to the delivery department for induction" | Not reported | |
| Hospital | Not reported | |
| Hospital | Hospital (not explicitly stated that women in the induction group stayed in hospital after induction started). However authors reported that two women in the induction group (who waited up until a week for induction) stayed in hospital after randomisation, due to transport/distance issues). This suggests that some women waited at home. | |
| Hospital (Swedish delivery unit) | Hospital | |
| Unclear (in French) | Unclear (in French) | |
| Not reported | Not reported | |
| Hospital | Hospital | |
| Not reported | Not reported | |
| Hospital | Not reported | |
| Hospital | Home and hospital: women who did not have a regular contractile pattern 45 minutes after induction gel was administered were allowed to go home; those who did were admitted to the hospital. | |
| Not reported | Not reported | |
| Hospital | Hospital | |
| Not reported (A specific induction protocol was not mandated for women who underwent induction in either group). | Not reported | |
| Hospital (community and tertiary) | Not reported, only reported that when induction was started, women were treated as outpatients in the hospital | |
| Hospital | Not reported | |
| Hospital | Not reported | |
| Hospital | Home and hospital or either: women with a Bishop score > 6 stayed in hospital after the induction was performed, and sent to birthing ward; while those with a lower Bishop score were asked to go home and come in the next morning | |
| Hospital | Not reported | |
| Primary care midwifery practices (n = 123) and hospitals (n = 45) (in the Netherlands, care is provided for women with normal risk pregnancies by midwives, and for pregnancies at increased risk by obstetricians or gynaecologists) | "all women in the 41 week induction group received obstetrician led intrapartum secondary care" | |
| Hospital | Hospital | |
| Hospital | Hospital | |
| Hospital | Hospital | |
| Hospital | Hospital | |
| Hospital | Not reported | |
| Unclear (in Spanish) | Unclear (in Spanish) | |
| Hospital | Not reported | |
| Not reported | Not reported | |
| Not reported | Not reported | |
| Hospital Not stated by authors, however implied by the trial inclusion criteria: "persistent contractions after overnight hospitalisation > 8 h" | Not reported | |
| Hospital | Not reported | |
| "Two health clinics" | Health clinic where labour was induced | |
| Not reported: "In the induction group, local policies for induction of labor were followed". | Not reported | |
| Not reported | Not reported | |
| Hospital | Not reported |
| Week | IOL | Expectant | ||
| rate/1000 | rate/1000 | |||
| 37 | 0 | 0 | 0 | 0 |
| 38 | 0/111 | 0 | 1/117 | 8.5 |
| 39 | 2/3455 | 0.6 | 4/3443 | 1.2 |
| 40‐41 | 0/380 | 0 | 1/380 | 2.6 |
| ≥ 42 | 2/5472 | 0.37 | 19/5437 | 3.5 |
| IOL: induction of labour | ||||
| Outcome or subgroup title | No. of studies | No. of participants | Statistical method | Effect size |
| 1.1 Perinatal death Show forest plot | 22 | 18795 | Risk Ratio (M‐H, Fixed, 95% CI) | 0.31 [0.15, 0.64] |
| 1.2 Stillbirth Show forest plot | 22 | 18795 | Risk Ratio (M‐H, Fixed, 95% CI) | 0.30 [0.12, 0.75] |
| 1.3 Neonatal death Show forest plot | 21 | 18611 | Risk Ratio (M‐H, Fixed, 95% CI) | 0.39 [0.13, 1.14] |
| 1.4 Birth asphyxia Show forest plot | 4 | 1456 | Risk Ratio (M‐H, Fixed, 95% CI) | 1.66 [0.61, 4.55] |
| 1.5 Admission to neonatal intensive care unit Show forest plot | 17 | 17826 | Risk Ratio (M‐H, Fixed, 95% CI) | 0.88 [0.80, 0.96] |
| 1.6 Neonatal convulsions Show forest plot | 5 | 13216 | Risk Ratio (M‐H, Random, 95% CI) | 1.01 [0.15, 6.67] |
| 1.7 Neonatal encephalopathy (HIE) Show forest plot | 2 | 8851 | Risk Ratio (M‐H, Fixed, 95% CI) | 0.69 [0.37, 1.31] |
| 1.8 Use of anticonvulsants Show forest plot | 1 | 349 | Risk Ratio (M‐H, Fixed, 95% CI) | 0.34 [0.01, 8.17] |
| 1.9 Meconium aspiration syndrome Show forest plot | 13 | 16622 | Risk Ratio (M‐H, Fixed, 95% CI) | 0.75 [0.62, 0.92] |
| 1.10 Pneumonia Show forest plot | 2 | 8851 | Risk Ratio (M‐H, Fixed, 95% CI) | 0.54 [0.27, 1.06] |
| 1.11 Apgar score less than 7 at 5 minutes Show forest plot | 20 | 18345 | Risk Ratio (M‐H, Fixed, 95% CI) | 0.73 [0.56, 0.96] |
| 1.12 Birthweight (g) Show forest plot | 18 | 8817 | Mean Difference (IV, Fixed, 95% CI) | ‐59.38 [‐77.03, ‐41.73] |
| 1.13 Birthweight > 4000 g Show forest plot | 8 | 5593 | Risk Ratio (M‐H, Random, 95% CI) | 0.72 [0.54, 0.96] |
| 1.14 Neonatal (birth) trauma Show forest plot | 5 | 13106 | Risk Ratio (M‐H, Fixed, 95% CI) | 0.97 [0.63, 1.49] |
| 1.15 Caesarean section Show forest plot | 31 | 21030 | Risk Ratio (M‐H, Fixed, 95% CI) | 0.90 [0.85, 0.95] |
| 1.16 Operative vaginal birth (forceps or ventouse) Show forest plot | 22 | 18584 | Risk Ratio (M‐H, Fixed, 95% CI) | 1.03 [0.96, 1.10] |
| 1.17 Analgesia used Show forest plot | 12 | Risk Ratio (M‐H, Random, 95% CI) | Subtotals only | |
| 1.17.1 Epidural/regional | 8 | 4579 | Risk Ratio (M‐H, Random, 95% CI) | 1.09 [0.99, 1.20] |
| 1.17.2 Other | 4 | 2352 | Risk Ratio (M‐H, Random, 95% CI) | 1.11 [1.05, 1.18] |
| 1.18 Perineal trauma Show forest plot | 7 | Risk Ratio (M‐H, Fixed, 95% CI) | Subtotals only | |
| 1.18.1 Severe perineal tear | 5 | 11589 | Risk Ratio (M‐H, Fixed, 95% CI) | 1.04 [0.85, 1.26] |
| 1.18.2 Episiotomy | 2 | 1747 | Risk Ratio (M‐H, Fixed, 95% CI) | 0.96 [0.84, 1.11] |
| 1.18.3 Obstetrical anal sphincter injuries | 2 | 1698 | Risk Ratio (M‐H, Fixed, 95% CI) | 0.81 [0.51, 1.31] |
| 1.19 Prolonged labour Show forest plot | 4 | Risk Ratio (M‐H, Fixed, 95% CI) | Subtotals only | |
| 1.19.1 First stage | 2 | 648 | Risk Ratio (M‐H, Fixed, 95% CI) | 0.76 [0.49, 1.20] |
| 1.19.2 Second stage | 1 | 508 | Risk Ratio (M‐H, Fixed, 95% CI) | 0.67 [0.36, 1.22] |
| 1.19.3 Third stage | 1 | 249 | Risk Ratio (M‐H, Fixed, 95% CI) | 3.02 [0.12, 73.52] |
| 1.19.4 No definition | 1 | 112 | Risk Ratio (M‐H, Fixed, 95% CI) | 0.35 [0.01, 8.30] |
| 1.20 Postpartum haemorrhage Show forest plot | 9 | 12609 | Risk Ratio (M‐H, Fixed, 95% CI) | 1.02 [0.91, 1.15] |
| 1.21 Breastfeeding Show forest plot | 2 | 7487 | Risk Ratio (M‐H, Fixed, 95% CI) | 1.00 [0.96, 1.04] |
| 1.22 Maternal satisfaction Show forest plot | 3 | Risk Ratio (M‐H, Fixed, 95% CI) | Subtotals only | |
| 1.22.1 Hoping to be randomised to the same trial arm as they had been in this study | 1 | 496 | Risk Ratio (M‐H, Fixed, 95% CI) | 1.93 [1.62, 2.30] |
| 1.22.2 Preferred/satisfied with their allocation | 2 | 493 | Risk Ratio (M‐H, Fixed, 95% CI) | 0.99 [0.88, 1.13] |
| 1.22.3 Satisfaction with pregnancy outcome | 1 | 308 | Risk Ratio (M‐H, Fixed, 95% CI) | 0.92 [0.80, 1.06] |
| 1.23 Maternal satisfaction Show forest plot | 1 | 619 | Mean Difference (IV, Fixed, 95% CI) | 0.07 [‐0.02, 0.16] |
| 1.24 Length of maternal hospital stay (days) Show forest plot | 7 | 4120 | Mean Difference (IV, Random, 95% CI) | ‐0.19 [‐0.56, 0.18] |
| 1.25 Length of maternal (postnatal) stay (categories) Show forest plot | 1 | Risk Ratio (M‐H, Fixed, 95% CI) | Subtotals only | |
| 1.25.1 < 2 days | 1 | 6096 | Risk Ratio (M‐H, Fixed, 95% CI) | 1.01 [0.87, 1.17] |
| 1.25.2 2 days | 1 | 6096 | Risk Ratio (M‐H, Fixed, 95% CI) | 1.04 [1.01, 1.08] |
| 1.25.3 3 days | 1 | 6096 | Risk Ratio (M‐H, Fixed, 95% CI) | 0.88 [0.77, 0.99] |
| 1.25.4 4 days | 1 | 6096 | Risk Ratio (M‐H, Fixed, 95% CI) | 0.78 [0.62, 0.97] |
| 1.25.5 > 4 days | 1 | 6096 | Risk Ratio (M‐H, Fixed, 95% CI) | 0.94 [0.48, 1.82] |
| 1.26 Length of neonatal hospital stay (days) Show forest plot | 1 | 302 | Mean Difference (IV, Fixed, 95% CI) | ‐0.30 [‐0.61, 0.01] |
| 1.27 Length of neonatal (postnatal) stay (categories) Show forest plot | 1 | Risk Ratio (M‐H, Fixed, 95% CI) | Subtotals only | |
| 1.27.1 ≤ 2 days | 1 | 6091 | Risk Ratio (M‐H, Fixed, 95% CI) | 1.05 [1.02, 1.08] |
| 1.27.2 ≥ 3 days | 1 | 6091 | Risk Ratio (M‐H, Fixed, 95% CI) | 0.86 [0.79, 0.94] |
| 1.28 Length of labour (hours) Show forest plot | 12 | 4025 | Mean Difference (IV, Random, 95% CI) | ‐1.08 [‐1.67, ‐0.50] |
| Outcome or subgroup title | No. of studies | No. of participants | Statistical method | Effect size |
| 2.1 Perinatal death Show forest plot | 22 | 18795 | Risk Ratio (M‐H, Fixed, 95% CI) | 0.31 [0.15, 0.64] |
| 2.1.1 < 40 weeks | 4 | 7126 | Risk Ratio (M‐H, Fixed, 95% CI) | 0.50 [0.13, 2.01] |
| 2.1.2 40 to 41 weeks | 3 | 760 | Risk Ratio (M‐H, Fixed, 95% CI) | 0.31 [0.01, 7.45] |
| 2.1.3 ≥ 41 weeks | 15 | 10909 | Risk Ratio (M‐H, Fixed, 95% CI) | 0.26 [0.11, 0.64] |
| 2.2 Stillbirth Show forest plot | 22 | 18795 | Risk Ratio (M‐H, Fixed, 95% CI) | 0.30 [0.12, 0.75] |
| 2.2.1 < 40 weeks | 4 | 7126 | Risk Ratio (M‐H, Fixed, 95% CI) | 0.51 [0.09, 2.76] |
| 2.2.2 40 to 41 weeks | 3 | 760 | Risk Ratio (M‐H, Fixed, 95% CI) | 0.31 [0.01, 7.45] |
| 2.2.3 ≥ 41 weeks | 15 | 10909 | Risk Ratio (M‐H, Fixed, 95% CI) | 0.24 [0.08, 0.78] |
| 2.3 Admission to neonatal intensive care unit Show forest plot | 17 | 17826 | Risk Ratio (M‐H, Fixed, 95% CI) | 0.88 [0.80, 0.96] |
| 2.3.1 < 40 weeks | 5 | 7409 | Risk Ratio (M‐H, Fixed, 95% CI) | 0.90 [0.79, 1.02] |
| 2.3.2 40 to 41 weeks | 3 | 527 | Risk Ratio (M‐H, Fixed, 95% CI) | 1.68 [0.53, 5.29] |
| 2.3.3 ≥ 41 weeks | 9 | 9890 | Risk Ratio (M‐H, Fixed, 95% CI) | 0.84 [0.74, 0.96] |
| 2.4 Caesarean section Show forest plot | 31 | 21030 | Risk Ratio (M‐H, Fixed, 95% CI) | 0.90 [0.85, 0.95] |
| 2.4.1 < 40 weeks | 8 | 8537 | Risk Ratio (M‐H, Fixed, 95% CI) | 0.87 [0.80, 0.95] |
| 2.4.2 40 to 41 weeks | 6 | 1189 | Risk Ratio (M‐H, Fixed, 95% CI) | 1.12 [0.88, 1.43] |
| 2.4.3 ≥ 41 weeks | 17 | 11304 | Risk Ratio (M‐H, Fixed, 95% CI) | 0.90 [0.83, 0.97] |
| 2.5 Operative vaginal birth (forceps or ventouse) Show forest plot | 22 | 18584 | Risk Ratio (M‐H, Fixed, 95% CI) | 1.03 [0.96, 1.10] |
| 2.5.1 < 40 weeks | 7 | 8376 | Risk Ratio (M‐H, Fixed, 95% CI) | 1.04 [0.93, 1.16] |
| 2.5.2 40 to 41 weeks | 4 | 707 | Risk Ratio (M‐H, Fixed, 95% CI) | 1.64 [0.82, 3.29] |
| 2.5.3 ≥ 41 weeks | 11 | 9501 | Risk Ratio (M‐H, Fixed, 95% CI) | 1.01 [0.92, 1.11] |
| 2.6 Perineal trauma Show forest plot | 5 | 11589 | Risk Ratio (M‐H, Fixed, 95% CI) | 1.04 [0.85, 1.26] |
| 2.6.1 < 40 weeks | 2 | 6714 | Risk Ratio (M‐H, Fixed, 95% CI) | 1.18 [0.90, 1.55] |
| 2.6.2 40 to 41 weeks | 0 | 0 | Risk Ratio (M‐H, Fixed, 95% CI) | Not estimable |
| 2.6.3 ≥ 41 weeks | 3 | 4875 | Risk Ratio (M‐H, Fixed, 95% CI) | 0.89 [0.66, 1.19] |
| Outcome or subgroup title | No. of studies | No. of participants | Statistical method | Effect size |
| 3.1 Perinatal death Show forest plot | 22 | 18795 | Risk Ratio (M‐H, Fixed, 95% CI) | 0.31 [0.15, 0.64] |
| 3.1.1 Nulliparous | 3 | 8229 | Risk Ratio (M‐H, Fixed, 95% CI) | 0.26 [0.06, 1.05] |
| 3.1.2 Mixed (primi‐ and multiparous) | 18 | 10470 | Risk Ratio (M‐H, Fixed, 95% CI) | 0.33 [0.14, 0.78] |
| 3.1.3 Not stated | 2 | 96 | Risk Ratio (M‐H, Fixed, 95% CI) | Not estimable |
| 3.2 Stillbirth Show forest plot | 22 | 18795 | Risk Ratio (M‐H, Fixed, 95% CI) | 0.30 [0.12, 0.74] |
| 3.2.1 Nulliparous | 3 | 8229 | Risk Ratio (M‐H, Fixed, 95% CI) | 0.23 [0.04, 1.35] |
| 3.2.2 Mixed (primi‐ and multiparous) | 18 | 10470 | Risk Ratio (M‐H, Fixed, 95% CI) | 0.33 [0.12, 0.97] |
| 3.2.3 Not stated | 2 | 96 | Risk Ratio (M‐H, Fixed, 95% CI) | Not estimable |
| 3.3 Admission to neonatal intensive care unit Show forest plot | 17 | 17826 | Risk Ratio (M‐H, Fixed, 95% CI) | 0.88 [0.80, 0.96] |
| 3.3.1 Nulliparous | 5 | 7312 | Risk Ratio (M‐H, Fixed, 95% CI) | 0.90 [0.79, 1.03] |
| 3.3.2 Mixed (primi‐ and multiparous) | 10 | 10200 | Risk Ratio (M‐H, Fixed, 95% CI) | 0.83 [0.73, 0.95] |
| 3.3.3 Not stated | 2 | 314 | Risk Ratio (M‐H, Fixed, 95% CI) | 1.20 [0.70, 2.06] |
| 3.4 Caesarean section Show forest plot | 31 | 21030 | Risk Ratio (M‐H, Fixed, 95% CI) | 0.90 [0.85, 0.95] |
| 3.4.1 Nulliparous | 6 | 7543 | Risk Ratio (M‐H, Fixed, 95% CI) | 0.89 [0.81, 0.97] |
| 3.4.2 Mixed (primi‐ and multiparous) | 20 | 12877 | Risk Ratio (M‐H, Fixed, 95% CI) | 0.90 [0.83, 0.97] |
| 3.4.3 Not stated | 5 | 610 | Risk Ratio (M‐H, Fixed, 95% CI) | 1.12 [0.81, 1.56] |
| 3.5 Operative vaginal birth (forceps or ventouse) Show forest plot | 22 | 18584 | Risk Ratio (M‐H, Fixed, 95% CI) | 1.03 [0.96, 1.10] |
| 3.5.1 Nulliparous | 4 | 7151 | Risk Ratio (M‐H, Fixed, 95% CI) | 0.96 [0.84, 1.09] |
| 3.5.2 Mixed (primi‐ and multiparous) | 15 | 11224 | Risk Ratio (M‐H, Fixed, 95% CI) | 1.06 [0.97, 1.15] |
| 3.5.3 Not stated | 3 | 209 | Risk Ratio (M‐H, Fixed, 95% CI) | 1.09 [0.58, 2.06] |
| 3.6 Perineal trauma (severe perineal tear) Show forest plot | 5 | 11589 | Risk Ratio (M‐H, Fixed, 95% CI) | 1.04 [0.85, 1.26] |
| 3.6.1 Nulliparous | 2 | 6714 | Risk Ratio (M‐H, Fixed, 95% CI) | 1.18 [0.90, 1.55] |
| 3.6.2 Mixed (primi‐ and multiparous) | 3 | 4875 | Risk Ratio (M‐H, Fixed, 95% CI) | 0.89 [0.66, 1.19] |
| Outcome or subgroup title | No. of studies | No. of participants | Statistical method | Effect size |
| 4.1 Perinatal death Show forest plot | 22 | 18795 | Risk Ratio (M‐H, Fixed, 95% CI) | 0.31 [0.15, 0.64] |
| 4.1.1 Favourable cervix | 3 | 760 | Risk Ratio (M‐H, Fixed, 95% CI) | 0.31 [0.01, 7.45] |
| 4.1.2 Unfavourable cervix | 7 | 4938 | Risk Ratio (M‐H, Fixed, 95% CI) | 0.29 [0.07, 1.17] |
| 4.1.3 Unknown/mixed state of cervix | 12 | 13097 | Risk Ratio (M‐H, Fixed, 95% CI) | 0.32 [0.13, 0.77] |
| 4.2 Stillbirth Show forest plot | 22 | 18795 | Risk Ratio (M‐H, Fixed, 95% CI) | 0.30 [0.12, 0.75] |
| 4.2.1 Favourable cervix | 3 | 760 | Risk Ratio (M‐H, Fixed, 95% CI) | 0.31 [0.01, 7.45] |
| 4.2.2 Unfavourable cervix | 7 | 4938 | Risk Ratio (M‐H, Fixed, 95% CI) | 0.27 [0.05, 1.66] |
| 4.2.3 Unknown/mixed state of cervix | 12 | 13097 | Risk Ratio (M‐H, Fixed, 95% CI) | 0.31 [0.10, 0.95] |
| 4.3 Admission to neonatal intensive care unit Show forest plot | 17 | 17826 | Risk Ratio (M‐H, Fixed, 95% CI) | 0.88 [0.80, 0.96] |
| 4.3.1 Favourable cervix | 2 | 475 | Risk Ratio (M‐H, Fixed, 95% CI) | 3.02 [0.12, 73.52] |
| 4.3.2 Unfavourable cervix | 6 | 4529 | Risk Ratio (M‐H, Fixed, 95% CI) | 0.90 [0.77, 1.05] |
| 4.3.3 Unknown/mixed state of cervix | 9 | 12822 | Risk Ratio (M‐H, Fixed, 95% CI) | 0.86 [0.77, 0.97] |
| 4.4 Caesarean section Show forest plot | 31 | 21030 | Risk Ratio (M‐H, Fixed, 95% CI) | 0.90 [0.85, 0.95] |
| 4.4.1 Favourable cervix | 4 | 906 | Risk Ratio (M‐H, Fixed, 95% CI) | 1.12 [0.76, 1.65] |
| 4.4.2 Unfavourable cervix | 10 | 5361 | Risk Ratio (M‐H, Fixed, 95% CI) | 0.92 [0.83, 1.01] |
| 4.4.3 Unknown/mixed state of cervix | 17 | 14763 | Risk Ratio (M‐H, Fixed, 95% CI) | 0.88 [0.82, 0.95] |
| 4.5 Operative vaginal birth (forceps or ventouse) Show forest plot | 22 | 18584 | Risk Ratio (M‐H, Fixed, 95% CI) | 1.03 [0.96, 1.10] |
| 4.5.1 Favourable cervix | 3 | 655 | Risk Ratio (M‐H, Fixed, 95% CI) | 0.87 [0.42, 1.82] |
| 4.5.2 Unfavourable cervix | 5 | 3799 | Risk Ratio (M‐H, Fixed, 95% CI) | 1.06 [0.95, 1.18] |
| 4.5.3 Unknown/mixed state of cervix | 14 | 14130 | Risk Ratio (M‐H, Fixed, 95% CI) | 1.01 [0.92, 1.11] |
| 4.6 Perineal trauma Show forest plot | 5 | 11589 | Risk Ratio (M‐H, Fixed, 95% CI) | 1.04 [0.85, 1.26] |
| 4.6.1 Unknown/mixed state of cervix | 5 | 11589 | Risk Ratio (M‐H, Fixed, 95% CI) | 1.04 [0.85, 1.26] |