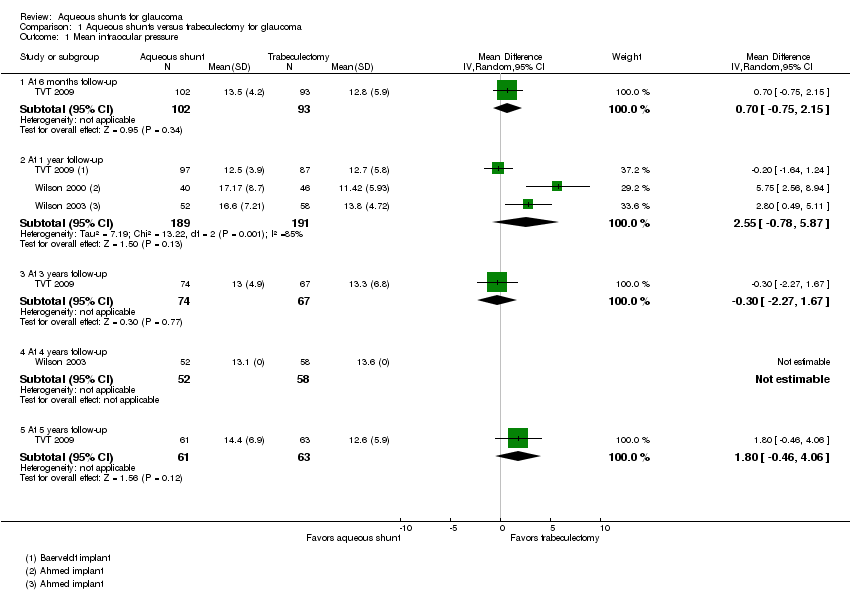
| 1 Mean intraocular pressure Show forest plot | 3 | | Mean Difference (IV, Random, 95% CI) | Subtotals only |
|
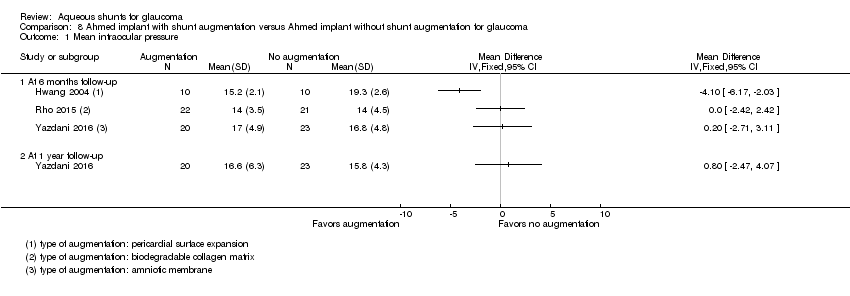
| 1.1 At 6 months follow‐up | 1 | 195 | Mean Difference (IV, Random, 95% CI) | 0.70 [‐0.75, 2.15] |
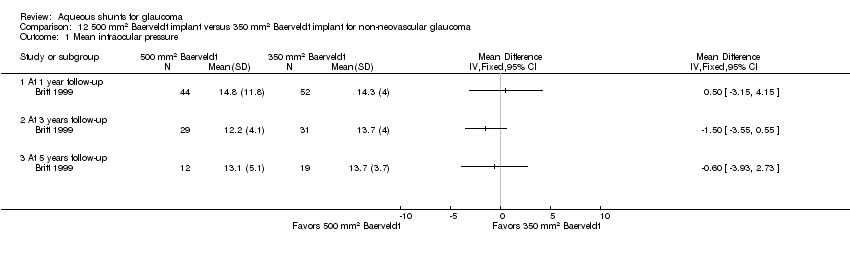
| 1.2 At 1 year follow‐up | 3 | 380 | Mean Difference (IV, Random, 95% CI) | 2.55 [‐0.78, 5.87] |
| 1.3 At 3 years follow‐up | 1 | 141 | Mean Difference (IV, Random, 95% CI) | ‐0.30 [‐2.27, 1.67] |
| 1.4 At 4 years follow‐up | 1 | 110 | Mean Difference (IV, Random, 95% CI) | 0.0 [0.0, 0.0] |
| 1.5 At 5 years follow‐up | 1 | 124 | Mean Difference (IV, Random, 95% CI) | 1.80 [‐0.46, 4.06] |
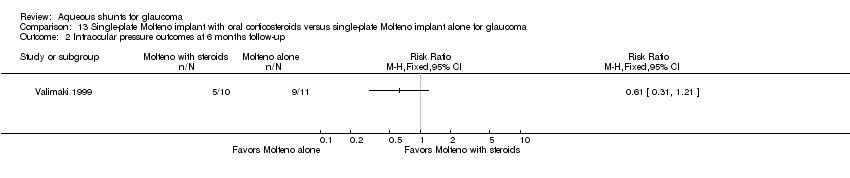
| 2 Intraocular pressure outcomes at 1 year follow‐up Show forest plot | 1 | | Risk Ratio (M‐H, Fixed, 95% CI) | Totals not selected |
|
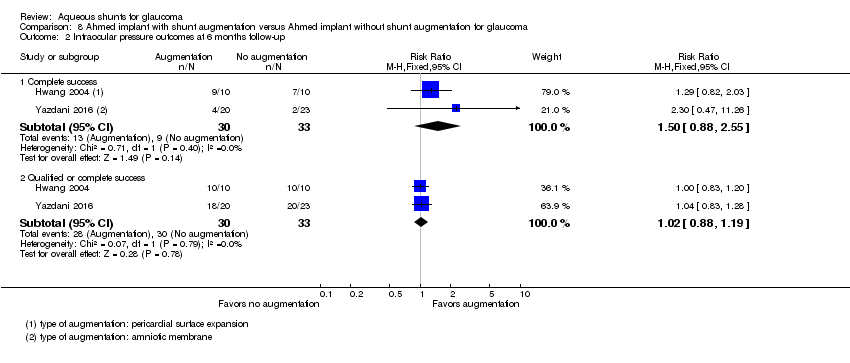
| 2.1 Complete success | 1 | | Risk Ratio (M‐H, Fixed, 95% CI) | 0.0 [0.0, 0.0] |
| 2.2 Qualified or complete success | 1 | | Risk Ratio (M‐H, Fixed, 95% CI) | 0.0 [0.0, 0.0] |
| 3 Intraocular pressure outcomes at 3 years follow‐up Show forest plot | 1 | | Risk Ratio (M‐H, Fixed, 95% CI) | Totals not selected |
|
| 3.1 Complete success | 1 | | Risk Ratio (M‐H, Fixed, 95% CI) | 0.0 [0.0, 0.0] |
| 3.2 Qualified or complete success | 1 | | Risk Ratio (M‐H, Fixed, 95% CI) | 0.0 [0.0, 0.0] |
| 4 Intraocular pressure outcomes at 5 years follow‐up Show forest plot | 1 | | Risk Ratio (M‐H, Fixed, 95% CI) | Totals not selected |
|
| 4.1 Complete success | 1 | | Risk Ratio (M‐H, Fixed, 95% CI) | 0.0 [0.0, 0.0] |
| 4.2 Qualified or complete success | 1 | | Risk Ratio (M‐H, Fixed, 95% CI) | 0.0 [0.0, 0.0] |
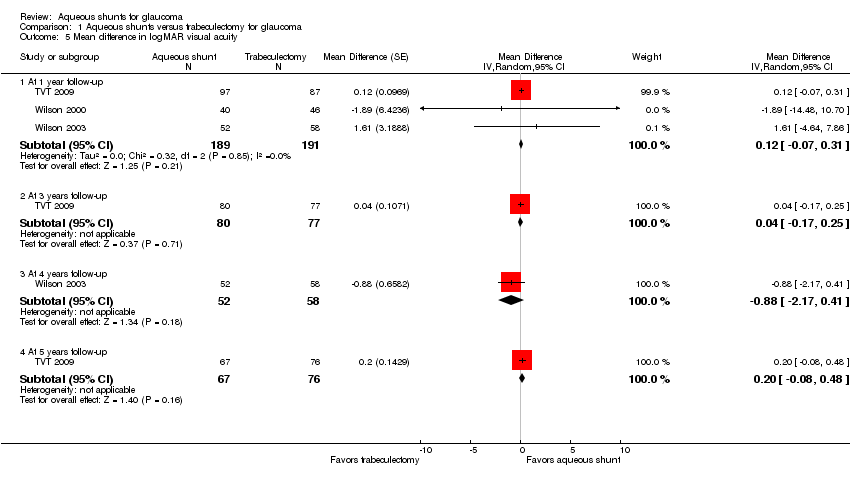
| 5 Mean difference in logMAR visual acuity Show forest plot | 3 | | Mean Difference (Random, 95% CI) | Subtotals only |
|
| 5.1 At 1 year follow‐up | 3 | 380 | Mean Difference (Random, 95% CI) | 0.12 [‐0.07, 0.31] |
| 5.2 At 3 years follow‐up | 1 | 157 | Mean Difference (Random, 95% CI) | 0.04 [‐0.17, 0.25] |
| 5.3 At 4 years follow‐up | 1 | 110 | Mean Difference (Random, 95% CI) | ‐0.88 [‐2.17, 0.41] |
| 5.4 At 5 years follow‐up | 1 | 143 | Mean Difference (Random, 95% CI) | 0.2 [‐0.08, 0.48] |
| 6 Mean change in visual field Show forest plot | 2 | | Mean Difference (IV, Fixed, 95% CI) | Subtotals only |
|
| 6.1 At 1 year follow‐up | 2 | 196 | Mean Difference (IV, Fixed, 95% CI) | ‐0.25 [‐1.91, 1.40] |
| 6.2 At 4 years follow‐up | 1 | 110 | Mean Difference (IV, Fixed, 95% CI) | ‐5.02 [‐5.65, ‐4.39] |
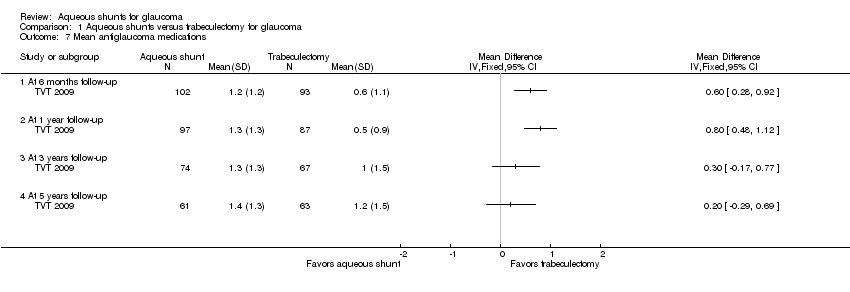
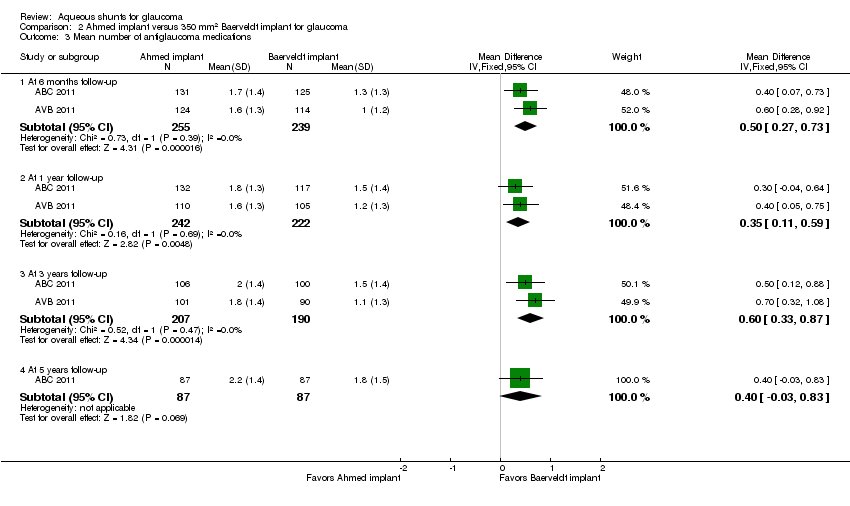
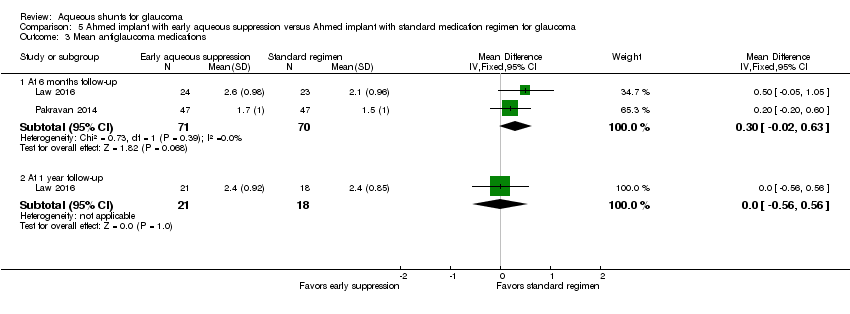
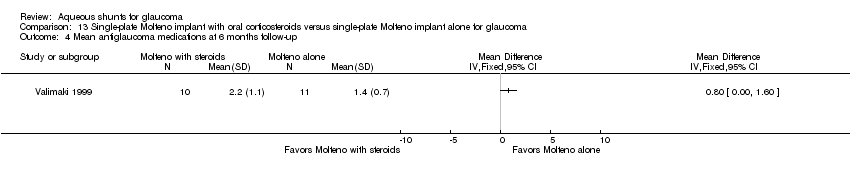
| 7 Mean antiglaucoma medications Show forest plot | 1 | | Mean Difference (IV, Fixed, 95% CI) | Totals not selected |
|
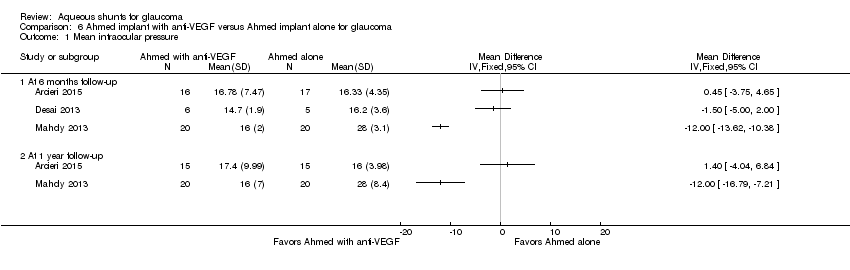
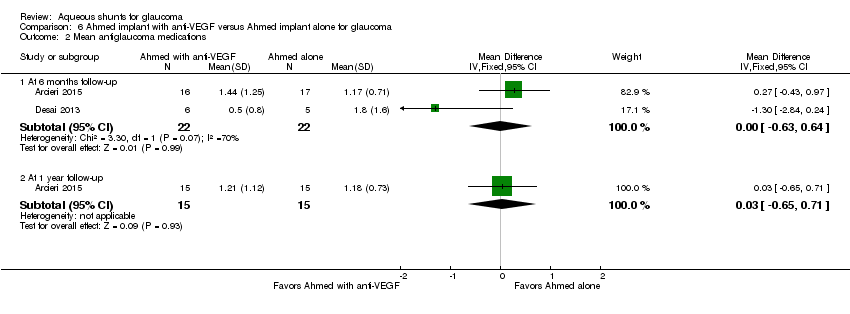
| 7.1 At 6 months follow‐up | 1 | | Mean Difference (IV, Fixed, 95% CI) | 0.0 [0.0, 0.0] |
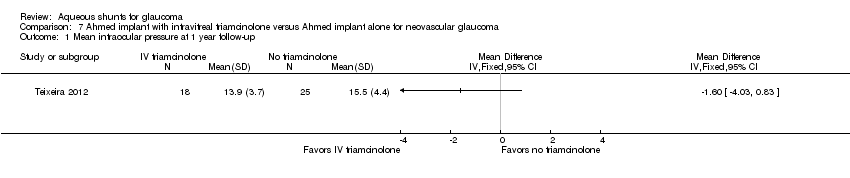
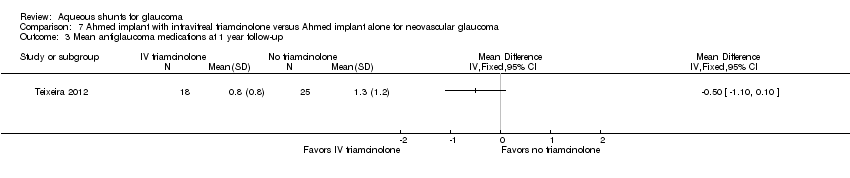
| 7.2 At 1 year follow‐up | 1 | | Mean Difference (IV, Fixed, 95% CI) | 0.0 [0.0, 0.0] |
| 7.3 At 3 years follow‐up | 1 | | Mean Difference (IV, Fixed, 95% CI) | 0.0 [0.0, 0.0] |
| 7.4 At 5 years follow‐up | 1 | | Mean Difference (IV, Fixed, 95% CI) | 0.0 [0.0, 0.0] |
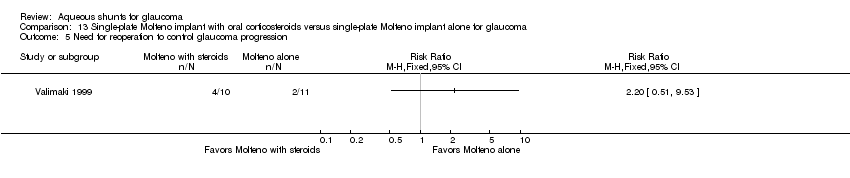
| 8 Need for reoperation to control glaucoma progression Show forest plot | 3 | | Risk Ratio (M‐H, Fixed, 95% CI) | Subtotals only |
|
| 8.1 At 1 year follow‐up | 2 | 329 | Risk Ratio (M‐H, Fixed, 95% CI) | 0.24 [0.04, 1.36] |
| 8.2 At 3 years follow‐up | 1 | 212 | Risk Ratio (M‐H, Fixed, 95% CI) | 0.49 [0.19, 1.26] |
| 8.3 At 4 years follow‐up | 1 | 123 | Risk Ratio (M‐H, Fixed, 95% CI) | 2.17 [0.41, 11.41] |
| 8.4 At 5 years follow‐up | 1 | 212 | Risk Ratio (M‐H, Fixed, 95% CI) | 0.44 [0.20, 0.96] |
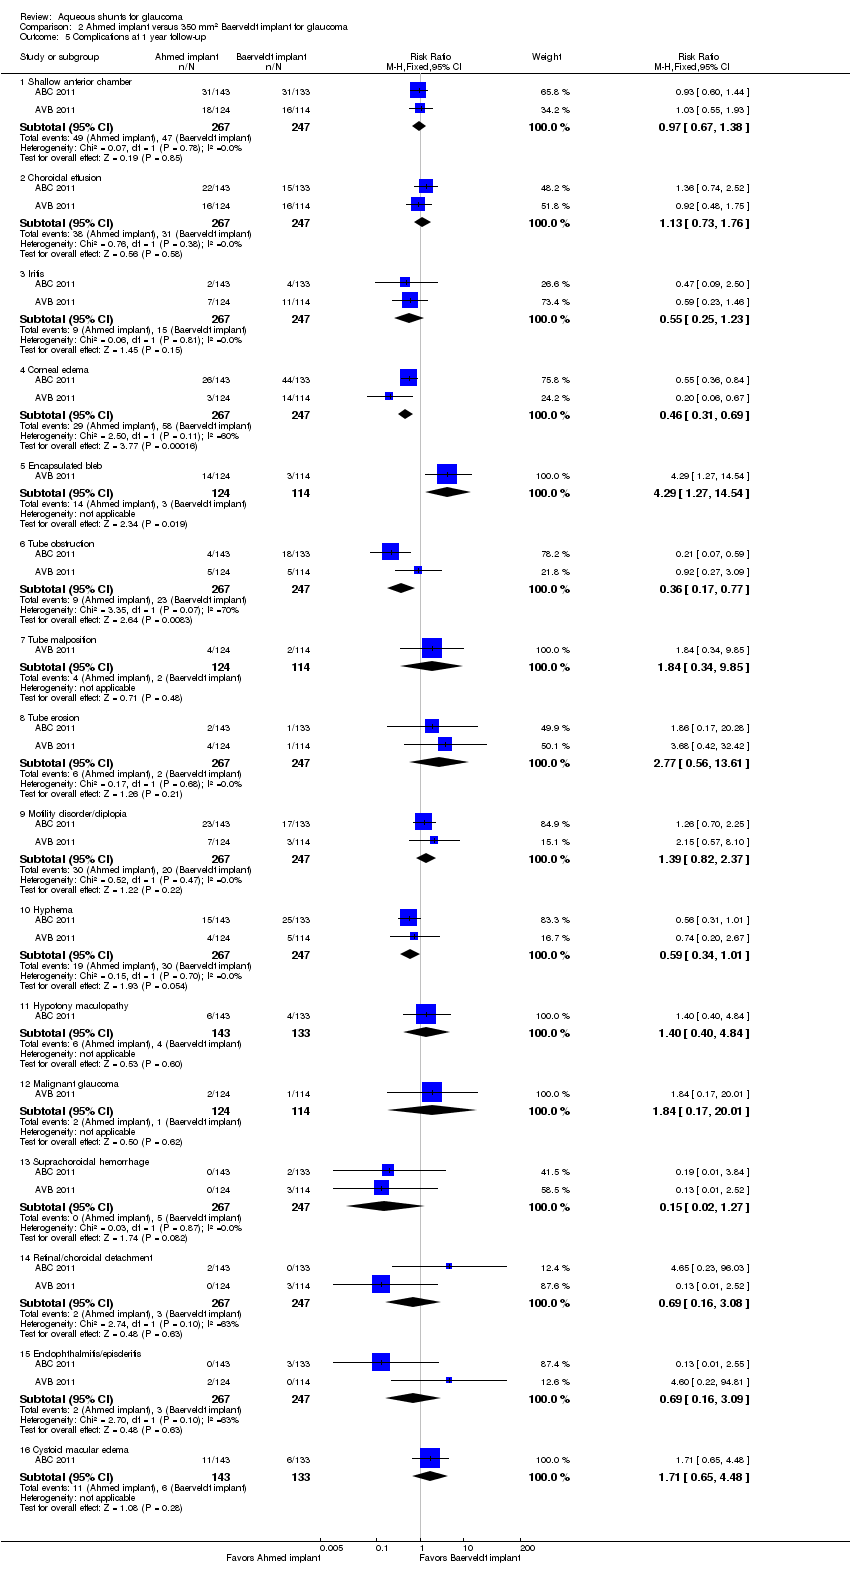
| 9 Complications at 1 year follow‐up Show forest plot | 2 | | Risk Ratio (M‐H, Fixed, 95% CI) | Subtotals only |
|
| 9.1 Total participants with complications | 1 | 212 | Risk Ratio (M‐H, Fixed, 95% CI) | 0.59 [0.43, 0.81] |
| 9.2 Flat anterior chamber | 2 | 329 | Risk Ratio (M‐H, Fixed, 95% CI) | 1.05 [0.62, 1.79] |
| 9.3 Choroidal effusion | 2 | 329 | Risk Ratio (M‐H, Fixed, 95% CI) | 1.67 [0.89, 3.14] |
| 9.4 Hyphema | 1 | 117 | Risk Ratio (M‐H, Fixed, 95% CI) | 1.13 [0.45, 2.80] |
| 9.5 Persistent corneal edema | 1 | 212 | Risk Ratio (M‐H, Fixed, 95% CI) | 2.29 [0.61, 8.62] |
| 9.6 Cystoid macular edema | 1 | 212 | Risk Ratio (M‐H, Fixed, 95% CI) | 1.47 [0.25, 8.63] |
| 9.7 Bleb leak | 2 | 329 | Risk Ratio (M‐H, Fixed, 95% CI) | 0.19 [0.03, 1.06] |
| 9.8 Encapsulated bleb | 1 | 212 | Risk Ratio (M‐H, Fixed, 95% CI) | 0.33 [0.07, 1.58] |
| 9.9 Endophthalmitis/blebitis | 1 | 212 | Risk Ratio (M‐H, Fixed, 95% CI) | 0.33 [0.03, 3.09] |
| 9.10 Chronic/recurrent iritis | 1 | 212 | Risk Ratio (M‐H, Fixed, 95% CI) | 1.96 [0.18, 21.32] |
| 9.11 Corneal ulcer | 1 | 212 | Risk Ratio (M‐H, Fixed, 95% CI) | 0.33 [0.01, 7.94] |
| 9.12 Infection | 1 | 117 | Risk Ratio (M‐H, Fixed, 95% CI) | 0.0 [0.0, 0.0] |
| 9.13 Dysesthesia | 1 | 212 | Risk Ratio (M‐H, Fixed, 95% CI) | 0.14 [0.02, 1.12] |
| 9.14 Persistent diplopia | 1 | 212 | Risk Ratio (M‐H, Fixed, 95% CI) | 10.80 [0.60, 192.83] |
| 9.15 Hypotony | 1 | 117 | Risk Ratio (M‐H, Fixed, 95% CI) | 1.13 [0.07, 17.60] |
| 9.16 Hypotony maculopathy | 1 | 212 | Risk Ratio (M‐H, Fixed, 95% CI) | 0.33 [0.03, 3.09] |
| 9.17 Implant exposure | 1 | 117 | Risk Ratio (M‐H, Fixed, 95% CI) | 5.63 [0.28, 114.68] |
| 9.18 Tube misdirection | 1 | 117 | Risk Ratio (M‐H, Fixed, 95% CI) | 0.0 [0.0, 0.0] |
| 9.19 Retinal detachment | 1 | 212 | Risk Ratio (M‐H, Fixed, 95% CI) | 2.94 [0.12, 71.47] |
| 9.20 Suprachoroidal hemorrhage | 1 | 117 | Risk Ratio (M‐H, Fixed, 95% CI) | 0.0 [0.0, 0.0] |
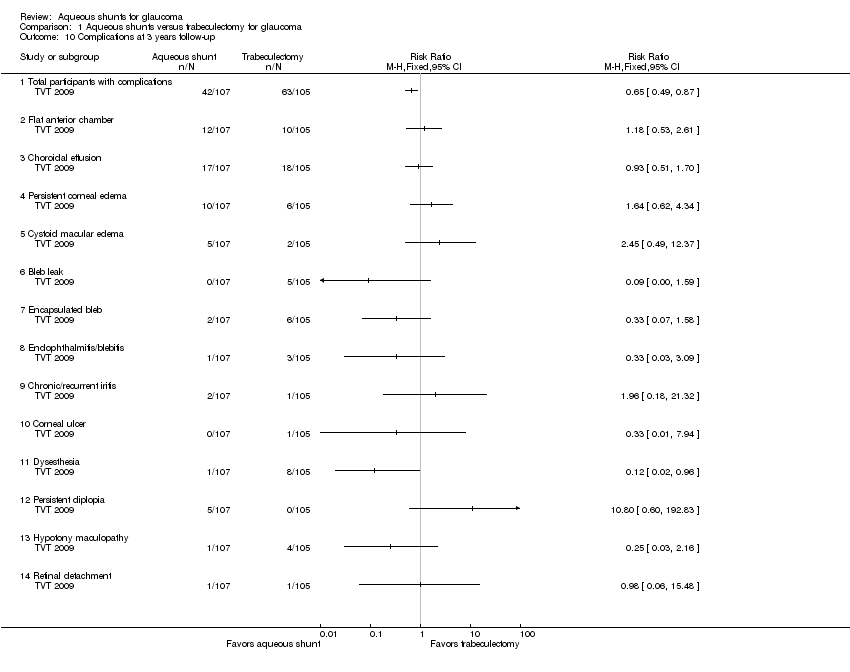
| 10 Complications at 3 years follow‐up Show forest plot | 1 | | Risk Ratio (M‐H, Fixed, 95% CI) | Totals not selected |
|
| 10.1 Total participants with complications | 1 | | Risk Ratio (M‐H, Fixed, 95% CI) | 0.0 [0.0, 0.0] |
| 10.2 Flat anterior chamber | 1 | | Risk Ratio (M‐H, Fixed, 95% CI) | 0.0 [0.0, 0.0] |
| 10.3 Choroidal effusion | 1 | | Risk Ratio (M‐H, Fixed, 95% CI) | 0.0 [0.0, 0.0] |
| 10.4 Persistent corneal edema | 1 | | Risk Ratio (M‐H, Fixed, 95% CI) | 0.0 [0.0, 0.0] |
| 10.5 Cystoid macular edema | 1 | | Risk Ratio (M‐H, Fixed, 95% CI) | 0.0 [0.0, 0.0] |
| 10.6 Bleb leak | 1 | | Risk Ratio (M‐H, Fixed, 95% CI) | 0.0 [0.0, 0.0] |
| 10.7 Encapsulated bleb | 1 | | Risk Ratio (M‐H, Fixed, 95% CI) | 0.0 [0.0, 0.0] |
| 10.8 Endophthalmitis/blebitis | 1 | | Risk Ratio (M‐H, Fixed, 95% CI) | 0.0 [0.0, 0.0] |
| 10.9 Chronic/recurrent iritis | 1 | | Risk Ratio (M‐H, Fixed, 95% CI) | 0.0 [0.0, 0.0] |
| 10.10 Corneal ulcer | 1 | | Risk Ratio (M‐H, Fixed, 95% CI) | 0.0 [0.0, 0.0] |
| 10.11 Dysesthesia | 1 | | Risk Ratio (M‐H, Fixed, 95% CI) | 0.0 [0.0, 0.0] |
| 10.12 Persistent diplopia | 1 | | Risk Ratio (M‐H, Fixed, 95% CI) | 0.0 [0.0, 0.0] |
| 10.13 Hypotony maculopathy | 1 | | Risk Ratio (M‐H, Fixed, 95% CI) | 0.0 [0.0, 0.0] |
| 10.14 Retinal detachment | 1 | | Risk Ratio (M‐H, Fixed, 95% CI) | 0.0 [0.0, 0.0] |
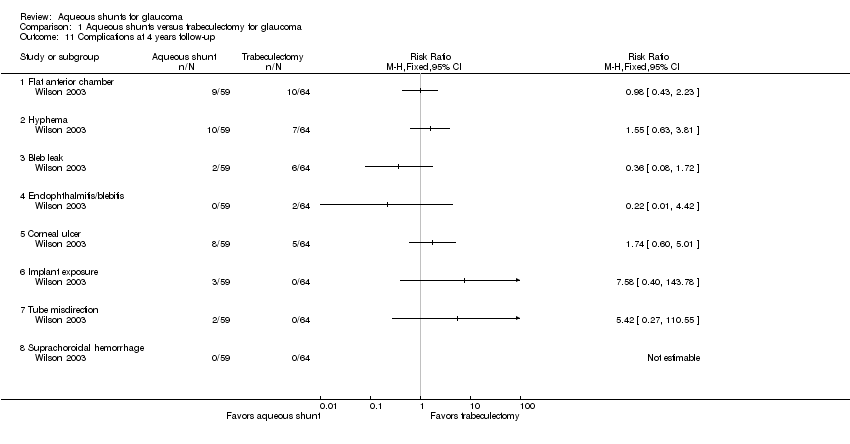
| 11 Complications at 4 years follow‐up Show forest plot | 1 | | Risk Ratio (M‐H, Fixed, 95% CI) | Totals not selected |
|
| 11.1 Flat anterior chamber | 1 | | Risk Ratio (M‐H, Fixed, 95% CI) | 0.0 [0.0, 0.0] |
| 11.2 Hyphema | 1 | | Risk Ratio (M‐H, Fixed, 95% CI) | 0.0 [0.0, 0.0] |
| 11.3 Bleb leak | 1 | | Risk Ratio (M‐H, Fixed, 95% CI) | 0.0 [0.0, 0.0] |
| 11.4 Endophthalmitis/blebitis | 1 | | Risk Ratio (M‐H, Fixed, 95% CI) | 0.0 [0.0, 0.0] |
| 11.5 Corneal ulcer | 1 | | Risk Ratio (M‐H, Fixed, 95% CI) | 0.0 [0.0, 0.0] |
| 11.6 Implant exposure | 1 | | Risk Ratio (M‐H, Fixed, 95% CI) | 0.0 [0.0, 0.0] |
| 11.7 Tube misdirection | 1 | | Risk Ratio (M‐H, Fixed, 95% CI) | 0.0 [0.0, 0.0] |
| 11.8 Suprachoroidal hemorrhage | 1 | | Risk Ratio (M‐H, Fixed, 95% CI) | 0.0 [0.0, 0.0] |
| 12 Complications at 5 years follow‐up Show forest plot | 1 | | Risk Ratio (M‐H, Fixed, 95% CI) | Totals not selected |
|
| 12.1 Flat anterior chamber | 1 | | Risk Ratio (M‐H, Fixed, 95% CI) | 0.0 [0.0, 0.0] |
| 12.2 Choroidal effusion | 1 | | Risk Ratio (M‐H, Fixed, 95% CI) | 0.0 [0.0, 0.0] |
| 12.3 Persistent corneal edema | 1 | | Risk Ratio (M‐H, Fixed, 95% CI) | 0.0 [0.0, 0.0] |
| 12.4 Cystoid macular edema | 1 | | Risk Ratio (M‐H, Fixed, 95% CI) | 0.0 [0.0, 0.0] |
| 12.5 Bleb leak | 1 | | Risk Ratio (M‐H, Fixed, 95% CI) | 0.0 [0.0, 0.0] |
| 12.6 Encapsulated bleb | 1 | | Risk Ratio (M‐H, Fixed, 95% CI) | 0.0 [0.0, 0.0] |
| 12.7 Endophthalmitis/blebitis | 1 | | Risk Ratio (M‐H, Fixed, 95% CI) | 0.0 [0.0, 0.0] |
| 12.8 Chronic/recurrent iritis | 1 | | Risk Ratio (M‐H, Fixed, 95% CI) | 0.0 [0.0, 0.0] |
| 12.9 Corneal ulcer | 1 | | Risk Ratio (M‐H, Fixed, 95% CI) | 0.0 [0.0, 0.0] |
| 12.10 Dysesthesia | 1 | | Risk Ratio (M‐H, Fixed, 95% CI) | 0.0 [0.0, 0.0] |
| 12.11 Persistent diplopia | 1 | | Risk Ratio (M‐H, Fixed, 95% CI) | 0.0 [0.0, 0.0] |
| 12.12 Hypotony maculopathy | 1 | | Risk Ratio (M‐H, Fixed, 95% CI) | 0.0 [0.0, 0.0] |
| 12.13 Retinal detachment | 1 | | Risk Ratio (M‐H, Fixed, 95% CI) | 0.0 [0.0, 0.0] |