Fármacos para el tratamiento del paludismo no complicado en mujeres embarazadas
Referencias
Referencias de los estudios incluidos en esta revisión
Referencias de los estudios excluidos de esta revisión
Referencias de los estudios en curso
Referencias adicionales
Referencias de otras versiones publicadas de esta revisión
Characteristics of studies
Characteristics of included studies [ordered by study ID]
| Methods | Randomized controlled trial Generation of allocation sequence: no method reported Allocation concealment: no method reported Blinding: none Inclusion of all randomized participants: 95% (for treatment failure) | |
| Participants | Number: 60 randomized, 57 analysed Inclusion criteria: pregnant women infected with P. falciparum; gestational age at least 28 weeks; not more than 4% parasitized red blood cells; could be followed up at Srisangwal Hospital; could take and tolerate oral form of the medicine and be admitted to the hospital for at least 7 days Exclusion criteria: former medication with quinine, artesunate (including its derivatives), or mefloquine within 28 days; history of quinine, artesunate, or mefloquine allergy; malaria with complications such as shock, renal failure, pulmonary oedema, or cerebral malaria; mixed malarial infection Age in years (mean): artesunate plus mefloquine group 27.207; quinine group 26.143 Parity (mean): artesunate plus mefloquine group 1.59; quinine group 1.36 Early/late pregnancy: second trimester Symptomatic/asymptomatic malaria: number not reported Anaemia on admission: number not reported | |
| Interventions | 1. Artesunate plus mefloquine 2. Quinine sulfate: 10 mg/kg every 8 hours for at least 7 days (until clinically recovered) | |
| Outcomes | 1. Treatment failure at day 28 Not included in review: | |
| Notes | Location: Mae Hong Son, Thailand Local malaria endemicity/transmission: not reported Local antimalarial drug resistance: multiple‐drug resistance Supervision of treatment: not reported | |
| Methods | Randomized controlled trial Generation of allocation sequence: computer‐generated, random‐number list Allocation concealment: no method reported Blinding: none Inclusion of all randomized participants: 83% (for treatment failure) | |
| Participants | Number: 147 randomized, 122 analysed Inclusion criteria: primigravidae or secundigravidae; gestation 12 to 36 weeks (fundal height < 30 cm); axillary temperature ≥ 37.5 °C; recent history of fever (within 48 hours preceding enrolment); or presence of clinical malaria‐related symptoms; mono‐infection with P. falciparum density ≥ 2000 parasites/mm3 blood; absence of clinical signs of severe malaria; absence of other patent infections; absence of previous severe reaction to chloroquine or sulfadoxine‐pyrimethamine; staying in neighbouring district/village; able to come for follow up; consent Exclusion criteria: other febrile disease than malaria; use of interfering treatment during follow‐up period; high‐risk pregnancy Age in years (median (range)): 20 (15 to 29) Parity: primigravidae and secundigravidae Early/late pregnancy: second and third trimester Symptomatic/asymptomatic malaria: all women symptomatic Anaemia on admission: 81% (21% severe malaria) | |
| Interventions | 1. Sulfadoxine‐pyrimethamine: 25 mg/kg sulfadoxine and 1.25 mg/kg pyrimethamine in 1 dose | |
| Outcomes | 1. Treatment failure at day 14 Not included in review: | |
| Notes | Location: Ouagadougou, Burkina Faso Local malaria endemicity/transmission: endemic but seasonal Local antimalarial drug resistance: increasing resistance to chloroquine; and some resistance to sulfadoxine‐pyrimethamine Supervision of treatment: all treatments were supervised Data awaiting: none Additional notes: trial for monitoring of therapeutic efficacy; women who failed study treatment were given quinine | |
| Methods | Randomized controlled trial Generation of allocation sequence: random‐number list; block randomized Allocation concealment: sealed envelopes Blinding: outcome assessor Inclusion of all randomized participants: 84% (for treatment failure) | |
| Participants | Number: 141 randomized, 118 analysed Inclusion criteria: peripheral parasitaemia; P. falciparum; aged 15 to 49 years; estimated fetal gestational age 14 to 26 weeks; mother had felt fetal movement; available for follow up until delivery Exclusion criteria: multiple gestations; history of chronic disease such as tuberculosis or diabetes; mental health disorder; known allergies to drugs containing sulfonamides; macrolides or pyrimethamine; pregnancy complications; taken antimalarial drugs within 28 days before enrolment Age in years (median (interquartile range)): 20 (17 to 24) Parity: mostly primigravidae, some secundigravidae Early/late pregnancy: mainly third trimester Symptomatic/asymptomatic malaria: not stated Anaemia on admission: not stated | |
| Interventions | 1. Sulfadoxine‐pyrimethamine: 1500 mg sulfadoxine, 75 mg pyrimethamine in 1 dose All treatment courses given twice, at least 4 weeks apart All participants also given 200 mg ferrous sulfate and 0.25 mg folic acid for daily administration, and insecticide‐treated bed nets | |
| Outcomes | 1. Treatment failure at delivery or 40 days Not included in review: | |
| Notes | Location: Mpemba and Madziabango health centres, Blantyre District, Malawi Local malaria endemicity/transmission: perennial, peaks in rainy season Local antimalarial drug resistance: not reported Supervision of treatment: directly observed Additional notes: pilot for larger study of intermittent preventive treatment, therefore two treatment courses given; trial authors report that statistically significantly more women who received sulfadoxine‐pyrimethamine or azithromycin plus sulfadoxine‐pyrimethamine were diagnosed as HIV positive than those who received artesunate plus sulfadoxine‐pyrimethamine (but many women refused the routine testing) | |
| Methods | Quasi‐randomized controlled trial Generation of allocation sequence: alternate allocation Allocation concealment: no method reported Blinding: assessor blinded Inclusion of all randomized participants: 100% (for treatment failure) | |
| Participants | Number: 132 randomized and analysed Inclusion criteria: at least 18 weeks pregnant; 1000 parasites per mm3; no prior antimalarial; not vomiting; consent Exclusion criteria: none reported Average age in years (mean (range)): not reported; most between 17 and 24 (15 to 40) Parity: 0 to 7; most 0 to 1 Early/late pregnancy: at least 18 weeks Symptomatic/asymptomatic malaria: number not reported Anaemia on admission: number not reported | |
| Interventions | 1. Chloroquine plus clindamycin (for 3 days) 2. Chloroquine plus clindamycin (for 5 days) 3. Chloroquine: 10 mg/kg on days 1 and 2; 5 mg/kg on day 3 | |
| Outcomes | 1. Treatment failures at day 14 | |
| Notes | Location: Kinshasa, Democratic Republic of the Congo Local malaria endemicity/transmission: not reported Local antimalarial drug resistance: some resistance to chloroquine, amodiaquine, and quinine Supervision of treatment: not reported Data awaiting: authors contacted 2005, awaiting additional trial data | |
| Methods | Randomized controlled trial Generation of allocation sequence: block randomization Allocation concealment: no method reported Blinding: none Inclusion of all randomized participants: 92% (for treatment failure) and 75% (for low birthweight) | |
| Participants | Number: 115 randomized, 108 analysed (86 and 108 for primary outcomes) Inclusion criteria: pregnant women in their second or third trimester seen at antenatal clinics of Shoklo and Maela camps; microscopy‐confirmed uncomplicated P. falciparum infection; fully informed verbal consent Exclusion criteria: severe complicated malaria; intercurrent infection requiring hospitalization; allergy to quinine or mefloquine; < 12 weeks gestation; history of mental disorder or mefloquine‐induced psychosis Age in years (median (range)): artesunate plus mefloquine group 24 (15 to 37); quinine group 23 (16 to 36) Parity: artesunate plus mefloquine group 18/66 primapara; quinine group 12/42 primapara Early/late pregnancy: second and third trimester Symptomatic/asymptomatic malaria: many women oligosymptomatic or asymptomatic Anaemia on admission: artesunate plus mefloquine group 33/66 anaemic; quinine group 22/42 anaemic | |
| Interventions | 1. Artesunate plus mefloquine 2. Quinine sulfate: 10 mg/kg every 8 hours for 7 days | |
| Outcomes | 1. Treatment failure at day 28 (excludes new infections using PCR) Not included in review: | |
| Notes | Location: Maela and Shoklo camps for displaced people of the Karen ethnic minority on the north‐west border of Thailand Local malaria endemicity/transmission: low and seasonal Local antimalarial drug resistance: multiple‐drug resistance Supervision of treatment: all treatments supervised Data awaiting: authors contacted, awaiting additional trial data Additional notes: Médecins Sans Frontières is the main provider of medicine; treatment failures (up to day 63) were given artesunate for a further 7 days; all mothers requested to deliver at clinic | |
| Methods | Randomized controlled trial Generation of allocation sequence: no method reported Allocation concealment: no method reported Blinding: none Inclusion of all randomized participants: 71% (for treatment failure) and 83% (for low birthweight) | |
| Participants | Number: 131 randomized, 129 analysed (93 and 109 for primary outcomes) Inclusion criteria: pregnant women; second or third trimester; seen at antenatal clinics of Shoklo and Maela camps; microscopy‐confirmed uncomplicated P. falciparum infection; consent Exclusion criteria: severe or complicated malaria; intercurrent infections requiring hospitalization; allergy to quinine, artesunate, clindamycin; major liver or kidney disease; gestation < 12 weeks Age in years (median (range)): artesunate group 25 (15 to 41); quinine plus clindamycin group 24 (15 to 41) Parity: artesunate group 26.2% primipara; quinine plus clindamycin group 26.6% primipara Early/late pregnancy: second and third trimester Symptomatic/asymptomatic malaria: many women are oligosymptomatic or asymptomatic Anaemia on admission: number not reported | |
| Interventions | 1. Artesunate: 2 mg/kg on days 0 to 4; 1 mg/kg on days 5 and 6 | |
| Outcomes | 1. Treatment failure at day 42 Not included in review: | |
| Notes | Location: Maela and Shoklo camps for displaced people of the Karen ethnic minority on the north‐west border of Thailand Local malaria endemicity/transmission: low and seasonal Local antimalarial drug resistance: multiple‐drug resistance Supervision of treatment: all treatments were supervised Data awaiting: authors contacted 2005, awaiting additional trial data Additional notes: Médecins Sans Frontières main provider of medicine; treatment given orally with a small amount of sugar and water; women asked to deliver at clinic (although usually deliver at home) | |
| Methods | Randomized controlled trial Generation of allocation sequence: computer generated in blocks of 10 Allocation concealment: envelopes Blinding: outcome assessor Inclusion of all randomized participants: 99% (for treatment failure) | |
| Participants | Number: 81 randomized, 80 analysed Inclusion criteria: healthy; first episode of (uncomplicated) falciparum or mixed malaria detected by weekly screening; haematocrit level ≥ 20%; second (> 13 weeks) or early third (< 32 weeks) trimester of pregnancy Exclusion criteria: known chronic disease; inability to follow antenatal clinic consultation; history of alcohol abuse; imminent delivery; inability to tolerate oral treatment Age in years (mean (standard deviation)): 26 (7) vs 26 (6) Parity: just under 1/3 primigravida Early/late pregnancy: second and third trimester Symptomatic/asymptomatic malaria: detected by screening so likely to be asymptomatic Anaemia on admission: not severe anaemia | |
| Interventions | 1. Quinine sulfate: 10 mg/kg every 8 hours for 7 days | |
| Outcomes | 1. Treatment failure at day 63 Not included in review: | |
| Notes | Location: Maela and Shoklo camps for displaced people of the Karen ethnic minority on the north‐west border of Thailand Local malaria endemicity/transmission: low and seasonal Local antimalarial drug resistance: multiple‐drug resistance (only artemisinin therapies known to be effective) Supervision of treatment: all treatments supervised Additional notes: treatment given orally with sugar and water (quinine) or chocolate milk (atovaquone proguanil plus artesunate); any women with reappearance of parasites after the primary treatment were retreated with artesunate and clindamycin for 7 days | |
| Methods | Quasi‐randomized controlled trial Generation of allocation sequence: paired, restricted, sequential trial Allocation concealment: no method reported Blinding: none Inclusion of all randomized participants: 74.4% (for treatment failure) | |
| Participants | Number: 43 randomized, 32 analysed Inclusion criteria: uncomplicated P. falciparum malaria; second or third trimester; fully informed consent Exclusion criteria: none reported Average age in years (mean (standard devation)): quinine plus spiramycin group 26 (6.2); quinine plus placebo group 28 (6.8) Parity (median): quinine plus spiramycin group 2; quinine plus placebo group 4 Early/late pregnancy in gestation weeks (median): second and third trimester Symptomatic/asymptomatic malaria: many women oligosymptomatic or asymptomatic Anaemia on admission: number not reported | |
| Interventions | 1. Quinine plus spiramycin 2. Quinine plus placebo | |
| Outcomes | 1. Treatment failure at day 28 | |
| Notes | Location: Shoklo camp, Thai‐Burmese border Local malaria endemicity/transmission: not reported Local antimalarial drug resistance: multiple‐drug resistance (unsupervised 7‐day quinine treatment has a failure rate of 50% in pregnant women with uncomplicated malaria) Supervision of treatment: supervised Data awaiting: authors contacted, awaiting additional trial data Additional notes: despite high resistance, quinine is the only treatment available for pregnant women in the area; quinine was given as a supervised 5‐day course as this is the average actual intake when the standard 7‐day regimen is not supervised (usual practice) | |
| Methods | Randomized controlled trial Generation of allocation sequence: no method reported Allocation concealment: no method reported Blinding: none Inclusion of all randomized participants: 100% (for treatment failure) | |
| Participants | Number: 55 randomized, 55 analysed Inclusion criteria: non‐response to chloroquine or sulfadoxine‐pyrimethamine, or both, as shown by failure of complete clearance of parasitaemia in the 2 weeks following a course of treatment; oral fluid intolerance; no history of allergy to known antimalarial drugs; second or third trimester pregnancy; consent of patients Exclusion criteria: none reported Average age in years (mean (standard deviation; range)): artemether plus mefloquine group 29.9 (6.1; 21 to 41); artemether group 28.9 (5.1; 20 to 40) Parity: mostly primigravidae (29/45) Early/late pregnancy: second and third trimester Symptomatic/asymptomatic malaria: symptomatic Anaemia on admission: number not reported | |
| Interventions | 1. Artemether plus mefloquine 2. Artemether: 3.2 mg/kg intramuscularly on day 0; 1.6 mg/kg daily for next 4 days | |
| Outcomes | 1. Treatment failure at day 14 (for artemether plus mefloquine group) and day 28 (for artemether group) Not included in review: | |
| Notes | Location: Nigeria Local malaria endemicity/transmission: not reported Local antimalarial drug resistance: multiple‐drug resistance (artemether and mefloquine resistance low, no artemisinin―mefloquine cross‐resistance) Supervision of treatment: supervised | |
| Methods | Randomized controlled trial Generation of allocation sequence: randomized‐number list in blocks of 16 Allocation concealment: envelopes Blinding: participant, treatment provider, outcome assessor, and data analyst Inclusion of all randomized participants: 93% (for treatment failure) | |
| Participants | Number: 900 randomized; 838 analysed Inclusion criteria: pregnant; gestational age ≥16 weeks; attended antenatal clinic between March 2003 and September 2004; with peripheral blood parasitaemia Exclusion criteria: multiple pregnancy; severe malaria; enrolled previously in the current study Age in years: roughly 23 Parity: all parities, about half primigravida Early/late pregnancy: 16 weeks plus, second and third trimester Symptomatic/asymptomatic malaria: detected by screening so likely to be asymptomatic Anaemia on admission: number not reported | |
| Interventions | 1. Chloroquine: 600 mg on days 1 and 2; 300 mg on day 3 2. Amodiaquine: 600 mg on days 1 and 2; 300 mg on day 3 3. Sulfadoxine‐pyrimethamine 4. Amodiaquine plus sulfadoxine‐pyrimethamine | |
| Outcomes | 1. Treatment failure at day 14 Not included in review: | |
| Notes | Location: St Theresa's Hospital, Nkoranza, Ghana Local malaria endemicity/transmission: perennial (peaks in rainy season – July and August) Local antimalarial drug resistance: unclear Supervision of treatment: first dose supervised (given by study team) second and third doses taken at home | |
HIV: human immunodeficiency virus; P. falciparum: Plasmodium falciparum; PCR: polymerase chain reaction.
Characteristics of excluded studies [ordered by study ID]
| Study | Reason for exclusion |
| Participants not diagnosed with malaria | |
| Nonrandomized study | |
| Nonrandomized study | |
| Nonrandomized study | |
| No control group | |
| No control group | |
| Some participants not parasitaemic |
Characteristics of ongoing studies [ordered by study ID]
| Trial name or title | "Co‐Artemether in pregnancy ‐ a pilot study (Thailand)" |
| Methods | Randomized controlled trial |
| Participants | Inclusion criteria: pregnant women with uncomplicated falciparum or mixed infection in second or third trimester who have failed after a course of quinine for 7 days; attend the Shoklo Malaria Research Unit AnteNatal Clinics regularly; agree to deliver at the Shoklo Malaria Research Unit Exclusion criteria: splenectomy; known chronic disease (cardiac, renal, hepatic); known haemoglobinopathy; known hepatic or renal impairment; inability to follow AnteNatal Clinics consultation; history of alcohol or narcotic abuse; inability to tolerate oral treatment; severe and complicated malaria; known hypersensitivity to artemisinin derivatives; taking any drug inhibiting the cytochrome enzyme CYP3A4 or drug that is metabolized by cytochrome enzyme CYPD or family; history of sudden death or of prolongation of QTc interval on electrocardiogram; cardiac arrytyhmia, congestive cardiac failure, or bradycardia accompanied by reduced left ventricular function; intake of drugs that prolong QTc interval |
| Interventions | 1. Artesunate: 50 mg tablets (2 mg/kg/day) for 7 days |
| Outcomes | 1. PCR‐adjusted parasitological cure at day 42 or at delivery, depending on which occurs last |
| Starting date | 6 February 2004 Anticipated end date: 1 January 2008 |
| Contact information | Dr Melba Gomes ([email protected]), World Health Organization, Switzerland |
| Notes | Location: Thailand Registration number: ISRCTN86353884 Source of funding: NICEF/UNDP/World Bank/WHO – Special Programme for Research and Training in Tropical Diseases (TDR) |
PCR: polymerase chain reaction.
Data and analyses
| Outcome or subgroup title | No. of studies | No. of participants | Statistical method | Effect size |
| 1 Treatment failure at day 63 Show forest plot | 1 | Risk Ratio (M‐H, Fixed, 95% CI) | Totals not selected | |
| Analysis 1.1  Comparison 1 Artesunate plus atovaquone‐proguanil (AS+AP) vs quinine (QN), Outcome 1 Treatment failure at day 63. | ||||
| 2 Treatment failure at day 63 (excludes new infections, detected by PCR) Show forest plot | 1 | Risk Ratio (M‐H, Fixed, 95% CI) | Totals not selected | |
| Analysis 1.2  Comparison 1 Artesunate plus atovaquone‐proguanil (AS+AP) vs quinine (QN), Outcome 2 Treatment failure at day 63 (excludes new infections, detected by PCR). | ||||
| 3 Anaemia Show forest plot | 1 | Risk Ratio (M‐H, Fixed, 95% CI) | Totals not selected | |
| Analysis 1.3  Comparison 1 Artesunate plus atovaquone‐proguanil (AS+AP) vs quinine (QN), Outcome 3 Anaemia. | ||||
| 4 Tinnitus Show forest plot | 1 | Risk Ratio (M‐H, Fixed, 95% CI) | Totals not selected | |
| Analysis 1.4  Comparison 1 Artesunate plus atovaquone‐proguanil (AS+AP) vs quinine (QN), Outcome 4 Tinnitus. | ||||
| 5 Low birthweight Show forest plot | 1 | Risk Ratio (M‐H, Fixed, 95% CI) | Totals not selected | |
| Analysis 1.5  Comparison 1 Artesunate plus atovaquone‐proguanil (AS+AP) vs quinine (QN), Outcome 5 Low birthweight. | ||||
| 6 Mean birthweight Show forest plot | 1 | Mean Difference (IV, Fixed, 95% CI) | Totals not selected | |
| Analysis 1.6  Comparison 1 Artesunate plus atovaquone‐proguanil (AS+AP) vs quinine (QN), Outcome 6 Mean birthweight. | ||||
| 7 Preterm delivery Show forest plot | 1 | Risk Ratio (M‐H, Fixed, 95% CI) | Totals not selected | |
| Analysis 1.7  Comparison 1 Artesunate plus atovaquone‐proguanil (AS+AP) vs quinine (QN), Outcome 7 Preterm delivery. | ||||
| 8 Gestational age Show forest plot | 1 | Mean Difference (IV, Fixed, 95% CI) | Totals not selected | |
| Analysis 1.8  Comparison 1 Artesunate plus atovaquone‐proguanil (AS+AP) vs quinine (QN), Outcome 8 Gestational age. | ||||
| 9 Intra‐uterine growth retardation Show forest plot | 1 | Risk Ratio (M‐H, Fixed, 95% CI) | Totals not selected | |
| Analysis 1.9  Comparison 1 Artesunate plus atovaquone‐proguanil (AS+AP) vs quinine (QN), Outcome 9 Intra‐uterine growth retardation. | ||||
| 10 Congenital abnormality Show forest plot | 1 | Risk Ratio (M‐H, Fixed, 95% CI) | Totals not selected | |
| Analysis 1.10  Comparison 1 Artesunate plus atovaquone‐proguanil (AS+AP) vs quinine (QN), Outcome 10 Congenital abnormality. | ||||
| Outcome or subgroup title | No. of studies | No. of participants | Statistical method | Effect size |
| 1 Treatment failure at day 63 (excludes new infections, detected by PCR) Show forest plot | 1 | Risk Ratio (M‐H, Fixed, 95% CI) | Totals not selected | |
| Analysis 2.1  Comparison 2 Artesunate plus mefloquine (AS+MQ) vs quinine (QN), Outcome 1 Treatment failure at day 63 (excludes new infections, detected by PCR). | ||||
| 2 Anaemia Show forest plot | 1 | Risk Ratio (M‐H, Fixed, 95% CI) | Totals not selected | |
| Analysis 2.2  Comparison 2 Artesunate plus mefloquine (AS+MQ) vs quinine (QN), Outcome 2 Anaemia. | ||||
| 2.1 On admission | 1 | Risk Ratio (M‐H, Fixed, 95% CI) | 0.0 [0.0, 0.0] | |
| 2.2 Day 7 | 1 | Risk Ratio (M‐H, Fixed, 95% CI) | 0.0 [0.0, 0.0] | |
| 2.3 Day 28 | 1 | Risk Ratio (M‐H, Fixed, 95% CI) | 0.0 [0.0, 0.0] | |
| 2.4 Day 42 | 1 | Risk Ratio (M‐H, Fixed, 95% CI) | 0.0 [0.0, 0.0] | |
| 2.5 Day 63 | 1 | Risk Ratio (M‐H, Fixed, 95% CI) | 0.0 [0.0, 0.0] | |
| 3 Nervous system adverse events Show forest plot | 2 | Risk Ratio (M‐H, Fixed, 95% CI) | Totals not selected | |
| Analysis 2.3  Comparison 2 Artesunate plus mefloquine (AS+MQ) vs quinine (QN), Outcome 3 Nervous system adverse events. | ||||
| 3.1 Abnormal neurology | 1 | Risk Ratio (M‐H, Fixed, 95% CI) | 0.0 [0.0, 0.0] | |
| 3.2 Blurring vision | 1 | Risk Ratio (M‐H, Fixed, 95% CI) | 0.0 [0.0, 0.0] | |
| 3.3 Dizziness | 1 | Risk Ratio (M‐H, Fixed, 95% CI) | 0.0 [0.0, 0.0] | |
| 3.4 Headache | 1 | Risk Ratio (M‐H, Fixed, 95% CI) | 0.0 [0.0, 0.0] | |
| 3.5 Tinnitus | 2 | Risk Ratio (M‐H, Fixed, 95% CI) | 0.0 [0.0, 0.0] | |
| 3.6 Vertigo | 1 | Risk Ratio (M‐H, Fixed, 95% CI) | 0.0 [0.0, 0.0] | |
| 4 Gastrointestinal adverse events Show forest plot | 2 | Risk Ratio (M‐H, Fixed, 95% CI) | Totals not selected | |
| Analysis 2.4  Comparison 2 Artesunate plus mefloquine (AS+MQ) vs quinine (QN), Outcome 4 Gastrointestinal adverse events. | ||||
| 4.1 Abdominal pain | 1 | Risk Ratio (M‐H, Fixed, 95% CI) | 0.0 [0.0, 0.0] | |
| 4.2 Anorexia | 1 | Risk Ratio (M‐H, Fixed, 95% CI) | 0.0 [0.0, 0.0] | |
| 4.3 Nausea | 2 | Risk Ratio (M‐H, Fixed, 95% CI) | 0.0 [0.0, 0.0] | |
| 4.4 Vomiting | 2 | Risk Ratio (M‐H, Fixed, 95% CI) | 0.0 [0.0, 0.0] | |
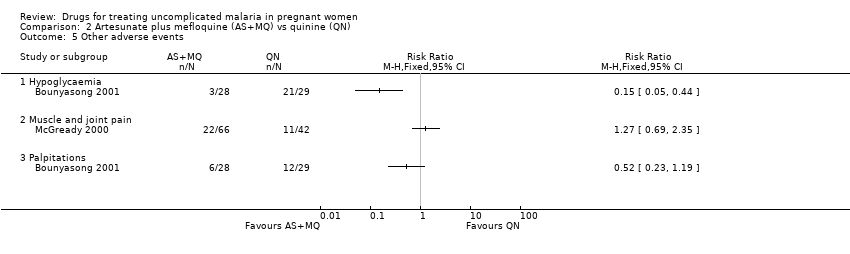
| 5 Other adverse events Show forest plot | 2 | Risk Ratio (M‐H, Fixed, 95% CI) | Totals not selected | |
| Analysis 2.5  Comparison 2 Artesunate plus mefloquine (AS+MQ) vs quinine (QN), Outcome 5 Other adverse events. | ||||
| 5.1 Hypoglycaemia | 1 | Risk Ratio (M‐H, Fixed, 95% CI) | 0.0 [0.0, 0.0] | |
| 5.2 Muscle and joint pain | 1 | Risk Ratio (M‐H, Fixed, 95% CI) | 0.0 [0.0, 0.0] | |
| 5.3 Palpitations | 1 | Risk Ratio (M‐H, Fixed, 95% CI) | 0.0 [0.0, 0.0] | |
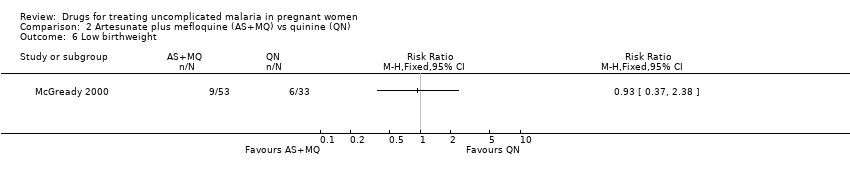
| 6 Low birthweight Show forest plot | 1 | Risk Ratio (M‐H, Fixed, 95% CI) | Totals not selected | |
| Analysis 2.6  Comparison 2 Artesunate plus mefloquine (AS+MQ) vs quinine (QN), Outcome 6 Low birthweight. | ||||
| 7 Mean birthweight Show forest plot | 1 | Mean Difference (IV, Fixed, 95% CI) | Totals not selected | |
| Analysis 2.7  Comparison 2 Artesunate plus mefloquine (AS+MQ) vs quinine (QN), Outcome 7 Mean birthweight. | ||||
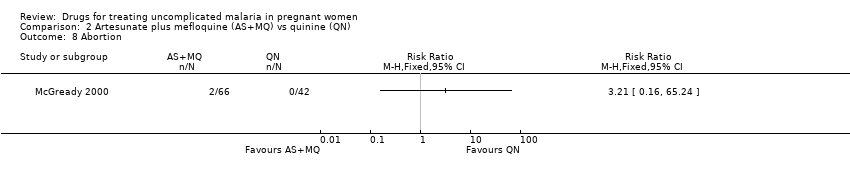
| 8 Abortion Show forest plot | 1 | Risk Ratio (M‐H, Fixed, 95% CI) | Totals not selected | |
| Analysis 2.8  Comparison 2 Artesunate plus mefloquine (AS+MQ) vs quinine (QN), Outcome 8 Abortion. | ||||
| 9 Neonatal jaundice Show forest plot | 1 | Risk Ratio (M‐H, Fixed, 95% CI) | Totals not selected | |
| Analysis 2.9  Comparison 2 Artesunate plus mefloquine (AS+MQ) vs quinine (QN), Outcome 9 Neonatal jaundice. | ||||
| Outcome or subgroup title | No. of studies | No. of participants | Statistical method | Effect size |
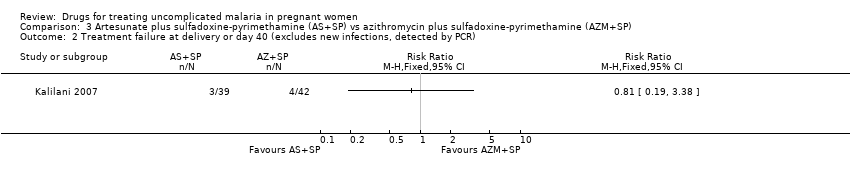
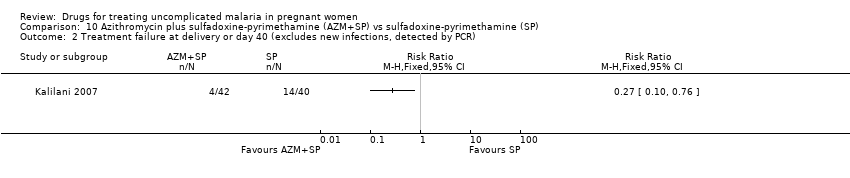
| 1 Treatment failure at delivery or day 40 Show forest plot | 1 | Risk Ratio (M‐H, Fixed, 95% CI) | Totals not selected | |
| Analysis 3.1  Comparison 3 Artesunate plus sulfadoxine‐pyrimethamine (AS+SP) vs azithromycin plus sulfadoxine‐pyrimethamine (AZM+SP), Outcome 1 Treatment failure at delivery or day 40. | ||||
| 2 Treatment failure at delivery or day 40 (excludes new infections, detected by PCR) Show forest plot | 1 | Risk Ratio (M‐H, Fixed, 95% CI) | Totals not selected | |
| Analysis 3.2  Comparison 3 Artesunate plus sulfadoxine‐pyrimethamine (AS+SP) vs azithromycin plus sulfadoxine‐pyrimethamine (AZM+SP), Outcome 2 Treatment failure at delivery or day 40 (excludes new infections, detected by PCR). | ||||
| 3 Maternal anaemia Show forest plot | 1 | Risk Ratio (M‐H, Fixed, 95% CI) | Totals not selected | |
| Analysis 3.3  Comparison 3 Artesunate plus sulfadoxine‐pyrimethamine (AS+SP) vs azithromycin plus sulfadoxine‐pyrimethamine (AZM+SP), Outcome 3 Maternal anaemia. | ||||
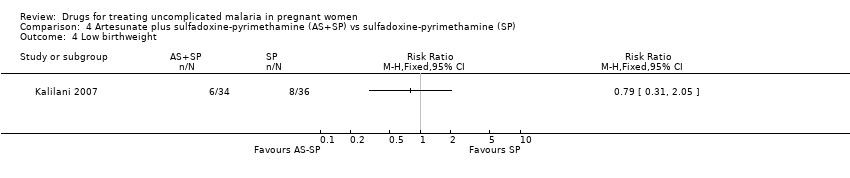
| 4 Low birthweight Show forest plot | 1 | Risk Ratio (M‐H, Fixed, 95% CI) | Totals not selected | |
| Analysis 3.4  Comparison 3 Artesunate plus sulfadoxine‐pyrimethamine (AS+SP) vs azithromycin plus sulfadoxine‐pyrimethamine (AZM+SP), Outcome 4 Low birthweight. | ||||
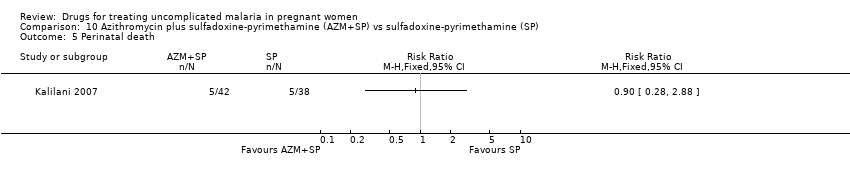
| 5 Perinatal death Show forest plot | 1 | Risk Ratio (M‐H, Fixed, 95% CI) | Totals not selected | |
| Analysis 3.5  Comparison 3 Artesunate plus sulfadoxine‐pyrimethamine (AS+SP) vs azithromycin plus sulfadoxine‐pyrimethamine (AZM+SP), Outcome 5 Perinatal death. | ||||
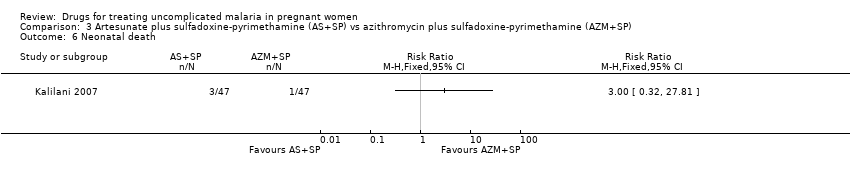
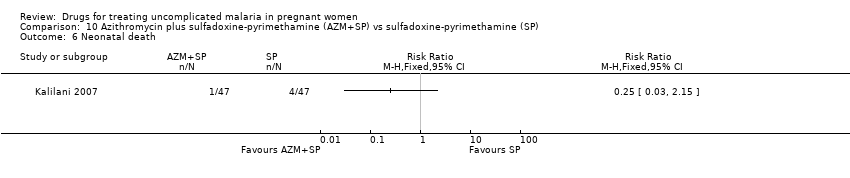
| 6 Neonatal death Show forest plot | 1 | Risk Ratio (M‐H, Fixed, 95% CI) | Totals not selected | |
| Analysis 3.6  Comparison 3 Artesunate plus sulfadoxine‐pyrimethamine (AS+SP) vs azithromycin plus sulfadoxine‐pyrimethamine (AZM+SP), Outcome 6 Neonatal death. | ||||
| Outcome or subgroup title | No. of studies | No. of participants | Statistical method | Effect size |
| 1 Treatment failure at delivery or 40 days Show forest plot | 1 | Risk Ratio (M‐H, Fixed, 95% CI) | Totals not selected | |
| Analysis 4.1  Comparison 4 Artesunate plus sulfadoxine‐pyrimethamine (AS+SP) vs sulfadoxine‐pyrimethamine (SP), Outcome 1 Treatment failure at delivery or 40 days. | ||||
| 2 Treatment failure at delivery or day 40 (excludes new infections, detected by PCR) Show forest plot | 1 | Odds Ratio (M‐H, Fixed, 95% CI) | Totals not selected | |
| Analysis 4.2  Comparison 4 Artesunate plus sulfadoxine‐pyrimethamine (AS+SP) vs sulfadoxine‐pyrimethamine (SP), Outcome 2 Treatment failure at delivery or day 40 (excludes new infections, detected by PCR). | ||||
| 3 Maternal anaemia Show forest plot | 1 | Risk Ratio (M‐H, Fixed, 95% CI) | Totals not selected | |
| Analysis 4.3  Comparison 4 Artesunate plus sulfadoxine‐pyrimethamine (AS+SP) vs sulfadoxine‐pyrimethamine (SP), Outcome 3 Maternal anaemia. | ||||
| 4 Low birthweight Show forest plot | 1 | Risk Ratio (M‐H, Fixed, 95% CI) | Totals not selected | |
| Analysis 4.4  Comparison 4 Artesunate plus sulfadoxine‐pyrimethamine (AS+SP) vs sulfadoxine‐pyrimethamine (SP), Outcome 4 Low birthweight. | ||||
| 5 Perinatal death Show forest plot | 1 | Risk Ratio (M‐H, Fixed, 95% CI) | Totals not selected | |
| Analysis 4.5  Comparison 4 Artesunate plus sulfadoxine‐pyrimethamine (AS+SP) vs sulfadoxine‐pyrimethamine (SP), Outcome 5 Perinatal death. | ||||
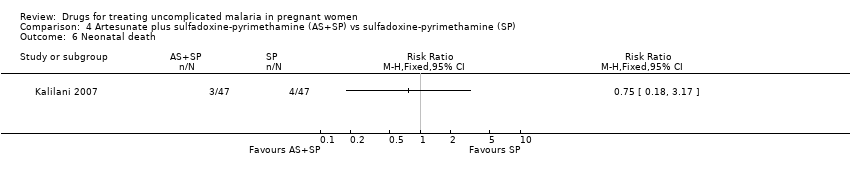
| 6 Neonatal death Show forest plot | 1 | Risk Ratio (M‐H, Fixed, 95% CI) | Totals not selected | |
| Analysis 4.6  Comparison 4 Artesunate plus sulfadoxine‐pyrimethamine (AS+SP) vs sulfadoxine‐pyrimethamine (SP), Outcome 6 Neonatal death. | ||||
| Outcome or subgroup title | No. of studies | No. of participants | Statistical method | Effect size |
| 1 Mean parasite clearance time Show forest plot | 1 | Mean Difference (IV, Fixed, 95% CI) | Totals not selected | |
| Analysis 5.1  Comparison 5 Quinine plus spiramycin (QN+SPI) vs quinine (QN), Outcome 1 Mean parasite clearance time. | ||||
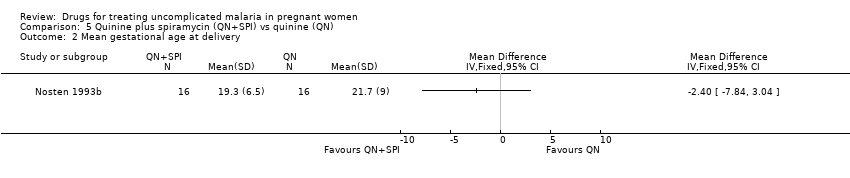
| 2 Mean gestational age at delivery Show forest plot | 1 | Mean Difference (IV, Fixed, 95% CI) | Totals not selected | |
| Analysis 5.2  Comparison 5 Quinine plus spiramycin (QN+SPI) vs quinine (QN), Outcome 2 Mean gestational age at delivery. | ||||
| Outcome or subgroup title | No. of studies | No. of participants | Statistical method | Effect size |
| 1 Treatment failure at 48 hours (excludes new infections, detected by PCR) Show forest plot | 1 | Risk Ratio (M‐H, Fixed, 95% CI) | Totals not selected | |
| Analysis 6.1  Comparison 6 Artesunate (AS) vs quinine plus clindamycin (QN+CLD), Outcome 1 Treatment failure at 48 hours (excludes new infections, detected by PCR). | ||||
| 2 Mean parasite clearance time Show forest plot | 1 | Mean Difference (IV, Fixed, 95% CI) | Totals not selected | |
| Analysis 6.2  Comparison 6 Artesunate (AS) vs quinine plus clindamycin (QN+CLD), Outcome 2 Mean parasite clearance time. | ||||
| 3 Anaemia at day 7 Show forest plot | 1 | Risk Ratio (M‐H, Fixed, 95% CI) | Totals not selected | |
| Analysis 6.3  Comparison 6 Artesunate (AS) vs quinine plus clindamycin (QN+CLD), Outcome 3 Anaemia at day 7. | ||||
| 4 Low birthweight Show forest plot | 1 | Risk Ratio (M‐H, Fixed, 95% CI) | Totals not selected | |
| Analysis 6.4  Comparison 6 Artesunate (AS) vs quinine plus clindamycin (QN+CLD), Outcome 4 Low birthweight. | ||||
| 5 Mean birthweight Show forest plot | 1 | Mean Difference (IV, Fixed, 95% CI) | Totals not selected | |
| Analysis 6.5  Comparison 6 Artesunate (AS) vs quinine plus clindamycin (QN+CLD), Outcome 5 Mean birthweight. | ||||
| 6 Mean gestational age at delivery Show forest plot | 1 | Mean Difference (IV, Fixed, 95% CI) | Totals not selected | |
| Analysis 6.6  Comparison 6 Artesunate (AS) vs quinine plus clindamycin (QN+CLD), Outcome 6 Mean gestational age at delivery. | ||||
| Outcome or subgroup title | No. of studies | No. of participants | Statistical method | Effect size |
| 1 Mean fever clearance time Show forest plot | 1 | Mean Difference (IV, Fixed, 95% CI) | Totals not selected | |
| Analysis 7.1  Comparison 7 Artemether plus mefloquine (ATM+MQ) vs artemether (ATM), Outcome 1 Mean fever clearance time. | ||||
| 2 Mean parasite clearance time Show forest plot | 1 | Mean Difference (IV, Fixed, 95% CI) | Totals not selected | |
| Analysis 7.2  Comparison 7 Artemether plus mefloquine (ATM+MQ) vs artemether (ATM), Outcome 2 Mean parasite clearance time. | ||||
| 3 Adverse events Show forest plot | 1 | Risk Ratio (M‐H, Fixed, 95% CI) | Totals not selected | |
| Analysis 7.3  Comparison 7 Artemether plus mefloquine (ATM+MQ) vs artemether (ATM), Outcome 3 Adverse events. | ||||
| 3.1 Abdominal discomfort | 1 | Risk Ratio (M‐H, Fixed, 95% CI) | 0.0 [0.0, 0.0] | |
| 3.2 Dizziness | 1 | Risk Ratio (M‐H, Fixed, 95% CI) | 0.0 [0.0, 0.0] | |
| 4 Mean birthweight Show forest plot | 1 | Mean Difference (IV, Fixed, 95% CI) | Totals not selected | |
| Analysis 7.4  Comparison 7 Artemether plus mefloquine (ATM+MQ) vs artemether (ATM), Outcome 4 Mean birthweight. | ||||
| Outcome or subgroup title | No. of studies | No. of participants | Statistical method | Effect size |
| 1 Treatment failure at day 28 Show forest plot | 1 | Risk Ratio (M‐H, Fixed, 95% CI) | Totals not selected | |
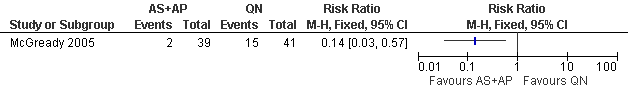
| Analysis 8.1  Comparison 8 Amodiaquine plus sulfadoxine‐pyrimethamine (AQ+SP) vs chloroquine (CQ), Outcome 1 Treatment failure at day 28. | ||||
| 2 Treatment failure at day 28 (excludes new infections, detected by PCR) Show forest plot | 1 | Risk Ratio (M‐H, Fixed, 95% CI) | Totals not selected | |
| Analysis 8.2  Comparison 8 Amodiaquine plus sulfadoxine‐pyrimethamine (AQ+SP) vs chloroquine (CQ), Outcome 2 Treatment failure at day 28 (excludes new infections, detected by PCR). | ||||
| 3 Adverse events Show forest plot | 1 | Risk Ratio (M‐H, Fixed, 95% CI) | Totals not selected | |
| Analysis 8.3  Comparison 8 Amodiaquine plus sulfadoxine‐pyrimethamine (AQ+SP) vs chloroquine (CQ), Outcome 3 Adverse events. | ||||
| 3.1 Any "side effect" at day 3 | 1 | Risk Ratio (M‐H, Fixed, 95% CI) | 0.0 [0.0, 0.0] | |
| 3.2 Any "side effect" at day 7 | 1 | Risk Ratio (M‐H, Fixed, 95% CI) | 0.0 [0.0, 0.0] | |
| 3.3 General weakness at day 3 | 1 | Risk Ratio (M‐H, Fixed, 95% CI) | 0.0 [0.0, 0.0] | |
| 3.4 General weakness at day 7 | 1 | Risk Ratio (M‐H, Fixed, 95% CI) | 0.0 [0.0, 0.0] | |
| 3.5 Dizziness at day 3 | 1 | Risk Ratio (M‐H, Fixed, 95% CI) | 0.0 [0.0, 0.0] | |
| 3.6 Dizziness at day 7 | 1 | Risk Ratio (M‐H, Fixed, 95% CI) | 0.0 [0.0, 0.0] | |
| 3.7 Vomiting day 3 | 1 | Risk Ratio (M‐H, Fixed, 95% CI) | 0.0 [0.0, 0.0] | |
| 3.8 Vomiting at day 7 | 1 | Risk Ratio (M‐H, Fixed, 95% CI) | 0.0 [0.0, 0.0] | |
| 3.9 Itching at day 3 | 1 | Risk Ratio (M‐H, Fixed, 95% CI) | 0.0 [0.0, 0.0] | |
| 3.10 Itching at day 7 | 1 | Risk Ratio (M‐H, Fixed, 95% CI) | 0.0 [0.0, 0.0] | |
| 3.11 Nausea at day 3 | 1 | Risk Ratio (M‐H, Fixed, 95% CI) | 0.0 [0.0, 0.0] | |
| 3.12 Nausea at day 7 | 1 | Risk Ratio (M‐H, Fixed, 95% CI) | 0.0 [0.0, 0.0] | |
| 4 Low birthweight Show forest plot | 1 | Risk Ratio (M‐H, Fixed, 95% CI) | Totals not selected | |
| Analysis 8.4  Comparison 8 Amodiaquine plus sulfadoxine‐pyrimethamine (AQ+SP) vs chloroquine (CQ), Outcome 4 Low birthweight. | ||||
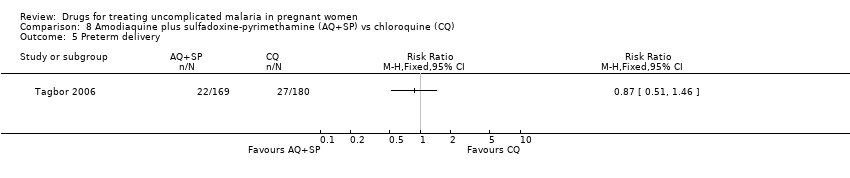
| 5 Preterm delivery Show forest plot | 1 | Risk Ratio (M‐H, Fixed, 95% CI) | Totals not selected | |
| Analysis 8.5  Comparison 8 Amodiaquine plus sulfadoxine‐pyrimethamine (AQ+SP) vs chloroquine (CQ), Outcome 5 Preterm delivery. | ||||
| Outcome or subgroup title | No. of studies | No. of participants | Statistical method | Effect size |
| 1 Treatment failure at day 28 Show forest plot | 1 | Risk Ratio (M‐H, Fixed, 95% CI) | Totals not selected | |
| Analysis 9.1  Comparison 9 Amodiaquine (AQ) vs chloroquine (CQ), Outcome 1 Treatment failure at day 28. | ||||
| 2 Treatment failure at day 28 (excludes new infections, detected by PCR) Show forest plot | 1 | Risk Ratio (M‐H, Fixed, 95% CI) | Totals not selected | |
| Analysis 9.2  Comparison 9 Amodiaquine (AQ) vs chloroquine (CQ), Outcome 2 Treatment failure at day 28 (excludes new infections, detected by PCR). | ||||
| 3 Adverse events Show forest plot | 1 | Risk Ratio (M‐H, Fixed, 95% CI) | Totals not selected | |
| Analysis 9.3  Comparison 9 Amodiaquine (AQ) vs chloroquine (CQ), Outcome 3 Adverse events. | ||||
| 3.1 Any "side effect" at day 3 | 1 | Risk Ratio (M‐H, Fixed, 95% CI) | 0.0 [0.0, 0.0] | |
| 3.2 Any "side effect" at day 7 | 1 | Risk Ratio (M‐H, Fixed, 95% CI) | 0.0 [0.0, 0.0] | |
| 3.3 General weakness at day 3 | 1 | Risk Ratio (M‐H, Fixed, 95% CI) | 0.0 [0.0, 0.0] | |
| 3.4 General weakness at day 7 | 1 | Risk Ratio (M‐H, Fixed, 95% CI) | 0.0 [0.0, 0.0] | |
| 3.5 Dizziness at day 3 | 1 | Risk Ratio (M‐H, Fixed, 95% CI) | 0.0 [0.0, 0.0] | |
| 3.6 Dizziness at day 7 | 1 | Risk Ratio (M‐H, Fixed, 95% CI) | 0.0 [0.0, 0.0] | |
| 3.7 Vomiting at day 3 | 1 | Risk Ratio (M‐H, Fixed, 95% CI) | 0.0 [0.0, 0.0] | |
| 3.8 Vomiting at day 7 | 1 | Risk Ratio (M‐H, Fixed, 95% CI) | 0.0 [0.0, 0.0] | |
| 3.9 Itching at day 3 | 1 | Risk Ratio (M‐H, Fixed, 95% CI) | 0.0 [0.0, 0.0] | |
| 3.10 Itching at day 7 | 1 | Risk Ratio (M‐H, Fixed, 95% CI) | 0.0 [0.0, 0.0] | |
| 3.11 Nausea at day 3 | 1 | Risk Ratio (M‐H, Fixed, 95% CI) | 0.0 [0.0, 0.0] | |
| 3.12 Nausea at day 7 | 1 | Risk Ratio (M‐H, Fixed, 95% CI) | 0.0 [0.0, 0.0] | |
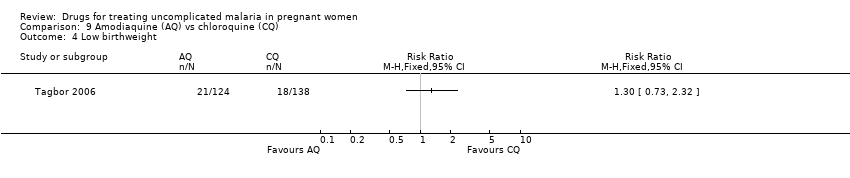
| 4 Low birthweight Show forest plot | 1 | Risk Ratio (M‐H, Fixed, 95% CI) | Totals not selected | |
| Analysis 9.4  Comparison 9 Amodiaquine (AQ) vs chloroquine (CQ), Outcome 4 Low birthweight. | ||||
| 5 Preterm delivery Show forest plot | 1 | Risk Ratio (M‐H, Fixed, 95% CI) | Totals not selected | |
| Analysis 9.5  Comparison 9 Amodiaquine (AQ) vs chloroquine (CQ), Outcome 5 Preterm delivery. | ||||
| Outcome or subgroup title | No. of studies | No. of participants | Statistical method | Effect size |
| 1 Treatment failure at delivery or day 40 Show forest plot | 1 | Risk Ratio (M‐H, Fixed, 95% CI) | Totals not selected | |
| Analysis 10.1  Comparison 10 Azithromycin plus sulfadoxine‐pyrimethamine (AZM+SP) vs sulfadoxine‐pyrimethamine (SP), Outcome 1 Treatment failure at delivery or day 40. | ||||
| 2 Treatment failure at delivery or day 40 (excludes new infections, detected by PCR) Show forest plot | 1 | Risk Ratio (M‐H, Fixed, 95% CI) | Totals not selected | |
| Analysis 10.2  Comparison 10 Azithromycin plus sulfadoxine‐pyrimethamine (AZM+SP) vs sulfadoxine‐pyrimethamine (SP), Outcome 2 Treatment failure at delivery or day 40 (excludes new infections, detected by PCR). | ||||
| 3 Maternal anaemia Show forest plot | 1 | Risk Ratio (M‐H, Fixed, 95% CI) | Totals not selected | |
| Analysis 10.3  Comparison 10 Azithromycin plus sulfadoxine‐pyrimethamine (AZM+SP) vs sulfadoxine‐pyrimethamine (SP), Outcome 3 Maternal anaemia. | ||||
| 4 Low birthweight Show forest plot | 1 | Risk Ratio (M‐H, Fixed, 95% CI) | Totals not selected | |
| Analysis 10.4  Comparison 10 Azithromycin plus sulfadoxine‐pyrimethamine (AZM+SP) vs sulfadoxine‐pyrimethamine (SP), Outcome 4 Low birthweight. | ||||
| 5 Perinatal death Show forest plot | 1 | Risk Ratio (M‐H, Fixed, 95% CI) | Totals not selected | |
| Analysis 10.5  Comparison 10 Azithromycin plus sulfadoxine‐pyrimethamine (AZM+SP) vs sulfadoxine‐pyrimethamine (SP), Outcome 5 Perinatal death. | ||||
| 6 Neonatal death Show forest plot | 1 | Risk Ratio (M‐H, Fixed, 95% CI) | Totals not selected | |
| Analysis 10.6  Comparison 10 Azithromycin plus sulfadoxine‐pyrimethamine (AZM+SP) vs sulfadoxine‐pyrimethamine (SP), Outcome 6 Neonatal death. | ||||
| Outcome or subgroup title | No. of studies | No. of participants | Statistical method | Effect size |
| 1 Treatment failure at day 14 Show forest plot | 2 | 544 | Risk Ratio (M‐H, Fixed, 95% CI) | 0.56 [0.29, 1.09] |
| Analysis 11.1  Comparison 11 Sulfadoxine‐pyrimethamine (SP) vs chloroquine (CQ), Outcome 1 Treatment failure at day 14. | ||||
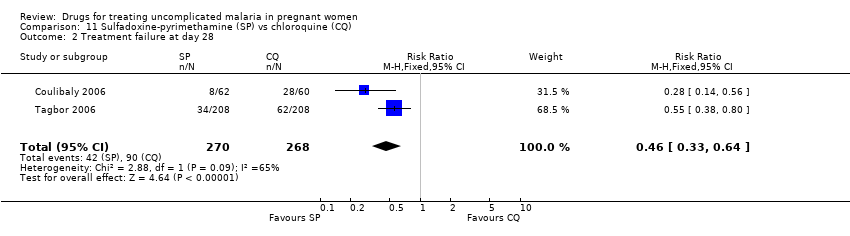
| 2 Treatment failure at day 28 Show forest plot | 2 | 538 | Risk Ratio (M‐H, Fixed, 95% CI) | 0.46 [0.33, 0.64] |
| Analysis 11.2  Comparison 11 Sulfadoxine‐pyrimethamine (SP) vs chloroquine (CQ), Outcome 2 Treatment failure at day 28. | ||||
| 3 Treatment failure at day 28 (excludes new infections, detected by PCR) Show forest plot | 1 | Risk Ratio (M‐H, Fixed, 95% CI) | Totals not selected | |
| Analysis 11.3  Comparison 11 Sulfadoxine‐pyrimethamine (SP) vs chloroquine (CQ), Outcome 3 Treatment failure at day 28 (excludes new infections, detected by PCR). | ||||
| 4 Adverse events Show forest plot | 1 | Risk Ratio (M‐H, Fixed, 95% CI) | Totals not selected | |
| Analysis 11.4  Comparison 11 Sulfadoxine‐pyrimethamine (SP) vs chloroquine (CQ), Outcome 4 Adverse events. | ||||
| 4.1 Any "side effect" at day 3 | 1 | Risk Ratio (M‐H, Fixed, 95% CI) | 0.0 [0.0, 0.0] | |
| 4.2 Any "side effect" at day 7 | 1 | Risk Ratio (M‐H, Fixed, 95% CI) | 0.0 [0.0, 0.0] | |
| 4.3 General weakness at day 3 | 1 | Risk Ratio (M‐H, Fixed, 95% CI) | 0.0 [0.0, 0.0] | |
| 4.4 General weakness at day 7 | 1 | Risk Ratio (M‐H, Fixed, 95% CI) | 0.0 [0.0, 0.0] | |
| 4.5 Dizziness at day 3 | 1 | Risk Ratio (M‐H, Fixed, 95% CI) | 0.0 [0.0, 0.0] | |
| 4.6 Dizziness at day 7 | 1 | Risk Ratio (M‐H, Fixed, 95% CI) | 0.0 [0.0, 0.0] | |
| 4.7 Vomiting at day 3 | 1 | Risk Ratio (M‐H, Fixed, 95% CI) | 0.0 [0.0, 0.0] | |
| 4.8 Vomiting at day 7 | 1 | Risk Ratio (M‐H, Fixed, 95% CI) | 0.0 [0.0, 0.0] | |
| 4.9 Itching at day 3 | 1 | Risk Ratio (M‐H, Fixed, 95% CI) | 0.0 [0.0, 0.0] | |
| 4.10 Itching at day 7 | 1 | Risk Ratio (M‐H, Fixed, 95% CI) | 0.0 [0.0, 0.0] | |
| 4.11 Nausea at day 3 | 1 | Risk Ratio (M‐H, Fixed, 95% CI) | 0.0 [0.0, 0.0] | |
| 4.12 Nausea at day 7 | 1 | Risk Ratio (M‐H, Fixed, 95% CI) | 0.0 [0.0, 0.0] | |
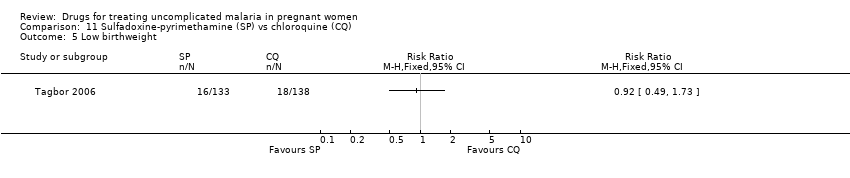
| 5 Low birthweight Show forest plot | 1 | Risk Ratio (M‐H, Fixed, 95% CI) | Totals not selected | |
| Analysis 11.5  Comparison 11 Sulfadoxine‐pyrimethamine (SP) vs chloroquine (CQ), Outcome 5 Low birthweight. | ||||
| 6 Preterm delivery Show forest plot | 1 | Risk Ratio (M‐H, Fixed, 95% CI) | Totals not selected | |
| Analysis 11.6  Comparison 11 Sulfadoxine‐pyrimethamine (SP) vs chloroquine (CQ), Outcome 6 Preterm delivery. | ||||
| Outcome or subgroup title | No. of studies | No. of participants | Statistical method | Effect size |
| 1 Treatment failure at day 14 Show forest plot | 1 | Risk Ratio (M‐H, Fixed, 95% CI) | Totals not selected | |
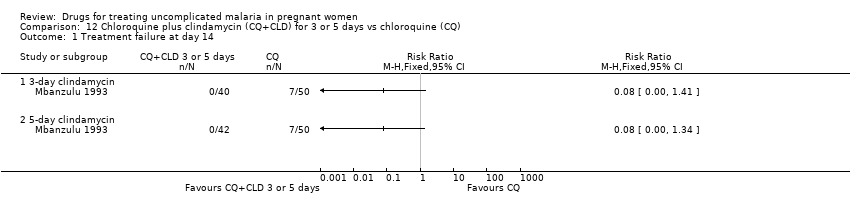
| Analysis 12.1  Comparison 12 Chloroquine plus clindamycin (CQ+CLD) for 3 or 5 days vs chloroquine (CQ), Outcome 1 Treatment failure at day 14. | ||||
| 1.1 3‐day clindamycin | 1 | Risk Ratio (M‐H, Fixed, 95% CI) | 0.0 [0.0, 0.0] | |
| 1.2 5‐day clindamycin | 1 | Risk Ratio (M‐H, Fixed, 95% CI) | 0.0 [0.0, 0.0] | |
| 2 Adverse event: itching Show forest plot | 1 | Risk Ratio (M‐H, Fixed, 95% CI) | Totals not selected | |
| Analysis 12.2  Comparison 12 Chloroquine plus clindamycin (CQ+CLD) for 3 or 5 days vs chloroquine (CQ), Outcome 2 Adverse event: itching. | ||||
| 2.1 3‐day clindamycin | 1 | Risk Ratio (M‐H, Fixed, 95% CI) | 0.0 [0.0, 0.0] | |
| 2.2 5‐day clindamycin | 1 | Risk Ratio (M‐H, Fixed, 95% CI) | 0.0 [0.0, 0.0] | |
| 3 Adverse event: diarrhoea Show forest plot | 1 | Risk Ratio (M‐H, Fixed, 95% CI) | Totals not selected | |
| Analysis 12.3  Comparison 12 Chloroquine plus clindamycin (CQ+CLD) for 3 or 5 days vs chloroquine (CQ), Outcome 3 Adverse event: diarrhoea. | ||||
| 3.1 3‐day clindamycin | 1 | Risk Ratio (M‐H, Fixed, 95% CI) | 0.0 [0.0, 0.0] | |
| 3.2 5‐day clindamycin | 1 | Risk Ratio (M‐H, Fixed, 95% CI) | 0.0 [0.0, 0.0] | |
Artesunate plus atovaquone‐proguanil (AS+AP) vs quinine (QN): Treatment failure at day 63 (excludes new infections, detected by PCR)

Artesunate plus mefloquine (AS+MQ) vs quinine (QN): Treatment failure at day 63 (excludes new infections, detected by PCR)

Artesunate plus sulfadoxine‐pyrimethamine (AS+SP) vs sulfadoxine‐pyrimethamine (SP): Treatment failure at delivery or day 40 (excludes new infections, detected by PCR)
Amodiaquine plus sulfadoxine‐pyrimethamine (AQ+SP) vs chloroquine (CQ): Treatment failure at day 28 (excludes new infections, detected by PCR)

Amodiaquine (AQ) vs chloroquine (CQ): Treatment failure at day 28 (excludes new infections, detected by PCR)

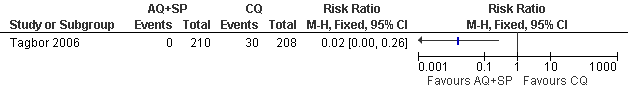
Azithromycin plus sulfadoxine‐pyrimethamine (AZM+SP) vs sulfadoxine‐pyrimethamine (SP): Treatment failure at delivery or day 40 (excludes new infections, detected by PCR)
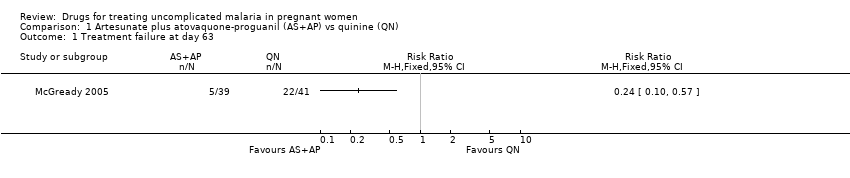
Comparison 1 Artesunate plus atovaquone‐proguanil (AS+AP) vs quinine (QN), Outcome 1 Treatment failure at day 63.

Comparison 1 Artesunate plus atovaquone‐proguanil (AS+AP) vs quinine (QN), Outcome 2 Treatment failure at day 63 (excludes new infections, detected by PCR).

Comparison 1 Artesunate plus atovaquone‐proguanil (AS+AP) vs quinine (QN), Outcome 3 Anaemia.

Comparison 1 Artesunate plus atovaquone‐proguanil (AS+AP) vs quinine (QN), Outcome 4 Tinnitus.

Comparison 1 Artesunate plus atovaquone‐proguanil (AS+AP) vs quinine (QN), Outcome 5 Low birthweight.

Comparison 1 Artesunate plus atovaquone‐proguanil (AS+AP) vs quinine (QN), Outcome 6 Mean birthweight.

Comparison 1 Artesunate plus atovaquone‐proguanil (AS+AP) vs quinine (QN), Outcome 7 Preterm delivery.

Comparison 1 Artesunate plus atovaquone‐proguanil (AS+AP) vs quinine (QN), Outcome 8 Gestational age.

Comparison 1 Artesunate plus atovaquone‐proguanil (AS+AP) vs quinine (QN), Outcome 9 Intra‐uterine growth retardation.

Comparison 1 Artesunate plus atovaquone‐proguanil (AS+AP) vs quinine (QN), Outcome 10 Congenital abnormality.
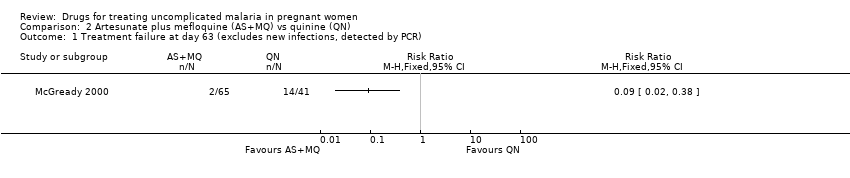
Comparison 2 Artesunate plus mefloquine (AS+MQ) vs quinine (QN), Outcome 1 Treatment failure at day 63 (excludes new infections, detected by PCR).

Comparison 2 Artesunate plus mefloquine (AS+MQ) vs quinine (QN), Outcome 2 Anaemia.

Comparison 2 Artesunate plus mefloquine (AS+MQ) vs quinine (QN), Outcome 3 Nervous system adverse events.

Comparison 2 Artesunate plus mefloquine (AS+MQ) vs quinine (QN), Outcome 4 Gastrointestinal adverse events.
Comparison 2 Artesunate plus mefloquine (AS+MQ) vs quinine (QN), Outcome 5 Other adverse events.
Comparison 2 Artesunate plus mefloquine (AS+MQ) vs quinine (QN), Outcome 6 Low birthweight.

Comparison 2 Artesunate plus mefloquine (AS+MQ) vs quinine (QN), Outcome 7 Mean birthweight.
Comparison 2 Artesunate plus mefloquine (AS+MQ) vs quinine (QN), Outcome 8 Abortion.

Comparison 2 Artesunate plus mefloquine (AS+MQ) vs quinine (QN), Outcome 9 Neonatal jaundice.

Comparison 3 Artesunate plus sulfadoxine‐pyrimethamine (AS+SP) vs azithromycin plus sulfadoxine‐pyrimethamine (AZM+SP), Outcome 1 Treatment failure at delivery or day 40.
Comparison 3 Artesunate plus sulfadoxine‐pyrimethamine (AS+SP) vs azithromycin plus sulfadoxine‐pyrimethamine (AZM+SP), Outcome 2 Treatment failure at delivery or day 40 (excludes new infections, detected by PCR).

Comparison 3 Artesunate plus sulfadoxine‐pyrimethamine (AS+SP) vs azithromycin plus sulfadoxine‐pyrimethamine (AZM+SP), Outcome 3 Maternal anaemia.

Comparison 3 Artesunate plus sulfadoxine‐pyrimethamine (AS+SP) vs azithromycin plus sulfadoxine‐pyrimethamine (AZM+SP), Outcome 4 Low birthweight.

Comparison 3 Artesunate plus sulfadoxine‐pyrimethamine (AS+SP) vs azithromycin plus sulfadoxine‐pyrimethamine (AZM+SP), Outcome 5 Perinatal death.
Comparison 3 Artesunate plus sulfadoxine‐pyrimethamine (AS+SP) vs azithromycin plus sulfadoxine‐pyrimethamine (AZM+SP), Outcome 6 Neonatal death.

Comparison 4 Artesunate plus sulfadoxine‐pyrimethamine (AS+SP) vs sulfadoxine‐pyrimethamine (SP), Outcome 1 Treatment failure at delivery or 40 days.

Comparison 4 Artesunate plus sulfadoxine‐pyrimethamine (AS+SP) vs sulfadoxine‐pyrimethamine (SP), Outcome 2 Treatment failure at delivery or day 40 (excludes new infections, detected by PCR).

Comparison 4 Artesunate plus sulfadoxine‐pyrimethamine (AS+SP) vs sulfadoxine‐pyrimethamine (SP), Outcome 3 Maternal anaemia.
Comparison 4 Artesunate plus sulfadoxine‐pyrimethamine (AS+SP) vs sulfadoxine‐pyrimethamine (SP), Outcome 4 Low birthweight.

Comparison 4 Artesunate plus sulfadoxine‐pyrimethamine (AS+SP) vs sulfadoxine‐pyrimethamine (SP), Outcome 5 Perinatal death.
Comparison 4 Artesunate plus sulfadoxine‐pyrimethamine (AS+SP) vs sulfadoxine‐pyrimethamine (SP), Outcome 6 Neonatal death.

Comparison 5 Quinine plus spiramycin (QN+SPI) vs quinine (QN), Outcome 1 Mean parasite clearance time.
Comparison 5 Quinine plus spiramycin (QN+SPI) vs quinine (QN), Outcome 2 Mean gestational age at delivery.
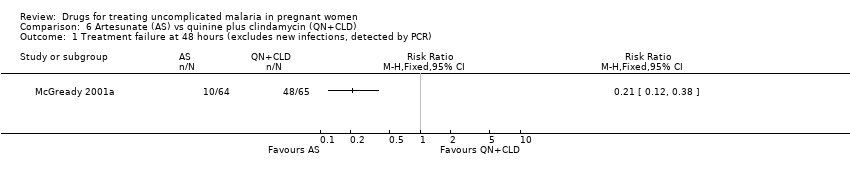
Comparison 6 Artesunate (AS) vs quinine plus clindamycin (QN+CLD), Outcome 1 Treatment failure at 48 hours (excludes new infections, detected by PCR).

Comparison 6 Artesunate (AS) vs quinine plus clindamycin (QN+CLD), Outcome 2 Mean parasite clearance time.
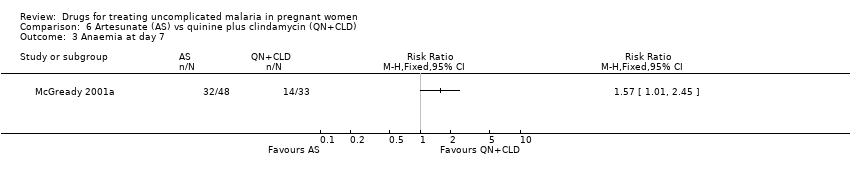
Comparison 6 Artesunate (AS) vs quinine plus clindamycin (QN+CLD), Outcome 3 Anaemia at day 7.

Comparison 6 Artesunate (AS) vs quinine plus clindamycin (QN+CLD), Outcome 4 Low birthweight.

Comparison 6 Artesunate (AS) vs quinine plus clindamycin (QN+CLD), Outcome 5 Mean birthweight.
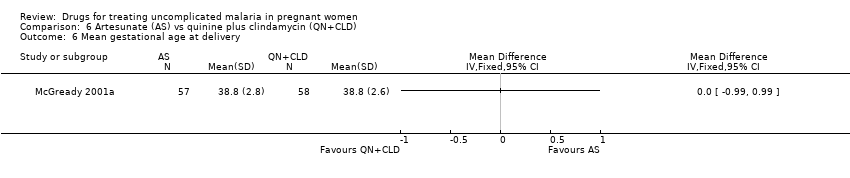
Comparison 6 Artesunate (AS) vs quinine plus clindamycin (QN+CLD), Outcome 6 Mean gestational age at delivery.
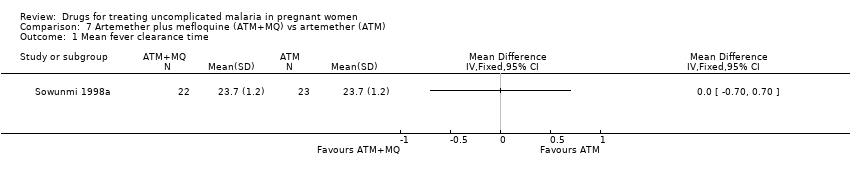
Comparison 7 Artemether plus mefloquine (ATM+MQ) vs artemether (ATM), Outcome 1 Mean fever clearance time.

Comparison 7 Artemether plus mefloquine (ATM+MQ) vs artemether (ATM), Outcome 2 Mean parasite clearance time.

Comparison 7 Artemether plus mefloquine (ATM+MQ) vs artemether (ATM), Outcome 3 Adverse events.

Comparison 7 Artemether plus mefloquine (ATM+MQ) vs artemether (ATM), Outcome 4 Mean birthweight.

Comparison 8 Amodiaquine plus sulfadoxine‐pyrimethamine (AQ+SP) vs chloroquine (CQ), Outcome 1 Treatment failure at day 28.
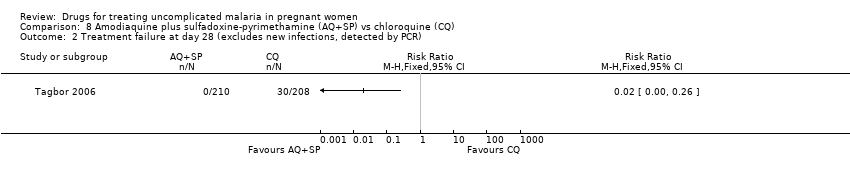
Comparison 8 Amodiaquine plus sulfadoxine‐pyrimethamine (AQ+SP) vs chloroquine (CQ), Outcome 2 Treatment failure at day 28 (excludes new infections, detected by PCR).

Comparison 8 Amodiaquine plus sulfadoxine‐pyrimethamine (AQ+SP) vs chloroquine (CQ), Outcome 3 Adverse events.

Comparison 8 Amodiaquine plus sulfadoxine‐pyrimethamine (AQ+SP) vs chloroquine (CQ), Outcome 4 Low birthweight.
Comparison 8 Amodiaquine plus sulfadoxine‐pyrimethamine (AQ+SP) vs chloroquine (CQ), Outcome 5 Preterm delivery.

Comparison 9 Amodiaquine (AQ) vs chloroquine (CQ), Outcome 1 Treatment failure at day 28.
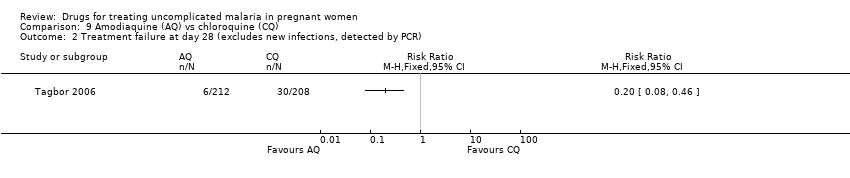
Comparison 9 Amodiaquine (AQ) vs chloroquine (CQ), Outcome 2 Treatment failure at day 28 (excludes new infections, detected by PCR).

Comparison 9 Amodiaquine (AQ) vs chloroquine (CQ), Outcome 3 Adverse events.
Comparison 9 Amodiaquine (AQ) vs chloroquine (CQ), Outcome 4 Low birthweight.

Comparison 9 Amodiaquine (AQ) vs chloroquine (CQ), Outcome 5 Preterm delivery.

Comparison 10 Azithromycin plus sulfadoxine‐pyrimethamine (AZM+SP) vs sulfadoxine‐pyrimethamine (SP), Outcome 1 Treatment failure at delivery or day 40.
Comparison 10 Azithromycin plus sulfadoxine‐pyrimethamine (AZM+SP) vs sulfadoxine‐pyrimethamine (SP), Outcome 2 Treatment failure at delivery or day 40 (excludes new infections, detected by PCR).

Comparison 10 Azithromycin plus sulfadoxine‐pyrimethamine (AZM+SP) vs sulfadoxine‐pyrimethamine (SP), Outcome 3 Maternal anaemia.

Comparison 10 Azithromycin plus sulfadoxine‐pyrimethamine (AZM+SP) vs sulfadoxine‐pyrimethamine (SP), Outcome 4 Low birthweight.
Comparison 10 Azithromycin plus sulfadoxine‐pyrimethamine (AZM+SP) vs sulfadoxine‐pyrimethamine (SP), Outcome 5 Perinatal death.
Comparison 10 Azithromycin plus sulfadoxine‐pyrimethamine (AZM+SP) vs sulfadoxine‐pyrimethamine (SP), Outcome 6 Neonatal death.
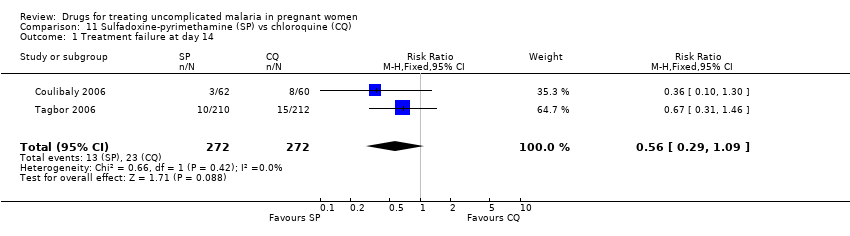
Comparison 11 Sulfadoxine‐pyrimethamine (SP) vs chloroquine (CQ), Outcome 1 Treatment failure at day 14.
Comparison 11 Sulfadoxine‐pyrimethamine (SP) vs chloroquine (CQ), Outcome 2 Treatment failure at day 28.

Comparison 11 Sulfadoxine‐pyrimethamine (SP) vs chloroquine (CQ), Outcome 3 Treatment failure at day 28 (excludes new infections, detected by PCR).

Comparison 11 Sulfadoxine‐pyrimethamine (SP) vs chloroquine (CQ), Outcome 4 Adverse events.
Comparison 11 Sulfadoxine‐pyrimethamine (SP) vs chloroquine (CQ), Outcome 5 Low birthweight.

Comparison 11 Sulfadoxine‐pyrimethamine (SP) vs chloroquine (CQ), Outcome 6 Preterm delivery.
Comparison 12 Chloroquine plus clindamycin (CQ+CLD) for 3 or 5 days vs chloroquine (CQ), Outcome 1 Treatment failure at day 14.

Comparison 12 Chloroquine plus clindamycin (CQ+CLD) for 3 or 5 days vs chloroquine (CQ), Outcome 2 Adverse event: itching.

Comparison 12 Chloroquine plus clindamycin (CQ+CLD) for 3 or 5 days vs chloroquine (CQ), Outcome 3 Adverse event: diarrhoea.
| Search set | CIDG SRa | CENTRAL | MEDLINEb | EMBASEb | LILACSb |
| 1 | malaria | malaria | malaria | malaria | malaria |
| 2 | pregnan* | pregnan* | Exp MALARIA | MALARIA | pregnan* |
| 3 | — | 1 and 2 | pregnan* | pregnan$ | 1 and 2 |
| 4 | — | — | PREGNANCY | PREGNANCY | — |
| 5 | — | — | 1 or 2 | 1 or 2 | — |
| 6 | — | — | 3 or 4 | 3 or 4 | — |
| 7 | — | — | 5 and 6 | 5 and 6 | — |
| 8 | — | — | Limit 7 to human | Limit 7 to human | — |
| aCochrane Infectious Diseases Group Specialized Register. | |||||
| Trial | Generation of allocation sequence | Allocation concealment | Blinding | Inclusion of all randomized participants in the final analysisb |
| Unclear | Unclear | None | Adequate | |
| Adequate | Unclear | None | Inadequate | |
| Adequate | Adequate | Outcome assessor | Inadequate | |
| Inadequate | Unclear | Outcome assessor | Adequate | |
| Adequate | Unclear | None | Adequate | |
| Unclear | Unclear | None | Inadequate | |
| Adequate | Adequate | Outcome assessor | Adequate | |
| Inadequate | Unclear | None | Inadequate | |
| Unclear | Unclear | None | Adequate | |
| Adequate | Adequate | Participant, treatment provider, outcome assessor, data analyst | Adequate | |
| aSee 'Assessment of risk of bias in included studies' for the assessment methods, and the 'Characteristics of included studies' for the methods used in each trial. | ||||
| Outcome or subgroup title | No. of studies | No. of participants | Statistical method | Effect size |
| 1 Treatment failure at day 63 Show forest plot | 1 | Risk Ratio (M‐H, Fixed, 95% CI) | Totals not selected | |
| 2 Treatment failure at day 63 (excludes new infections, detected by PCR) Show forest plot | 1 | Risk Ratio (M‐H, Fixed, 95% CI) | Totals not selected | |
| 3 Anaemia Show forest plot | 1 | Risk Ratio (M‐H, Fixed, 95% CI) | Totals not selected | |
| 4 Tinnitus Show forest plot | 1 | Risk Ratio (M‐H, Fixed, 95% CI) | Totals not selected | |
| 5 Low birthweight Show forest plot | 1 | Risk Ratio (M‐H, Fixed, 95% CI) | Totals not selected | |
| 6 Mean birthweight Show forest plot | 1 | Mean Difference (IV, Fixed, 95% CI) | Totals not selected | |
| 7 Preterm delivery Show forest plot | 1 | Risk Ratio (M‐H, Fixed, 95% CI) | Totals not selected | |
| 8 Gestational age Show forest plot | 1 | Mean Difference (IV, Fixed, 95% CI) | Totals not selected | |
| 9 Intra‐uterine growth retardation Show forest plot | 1 | Risk Ratio (M‐H, Fixed, 95% CI) | Totals not selected | |
| 10 Congenital abnormality Show forest plot | 1 | Risk Ratio (M‐H, Fixed, 95% CI) | Totals not selected | |
| Outcome or subgroup title | No. of studies | No. of participants | Statistical method | Effect size |
| 1 Treatment failure at day 63 (excludes new infections, detected by PCR) Show forest plot | 1 | Risk Ratio (M‐H, Fixed, 95% CI) | Totals not selected | |
| 2 Anaemia Show forest plot | 1 | Risk Ratio (M‐H, Fixed, 95% CI) | Totals not selected | |
| 2.1 On admission | 1 | Risk Ratio (M‐H, Fixed, 95% CI) | 0.0 [0.0, 0.0] | |
| 2.2 Day 7 | 1 | Risk Ratio (M‐H, Fixed, 95% CI) | 0.0 [0.0, 0.0] | |
| 2.3 Day 28 | 1 | Risk Ratio (M‐H, Fixed, 95% CI) | 0.0 [0.0, 0.0] | |
| 2.4 Day 42 | 1 | Risk Ratio (M‐H, Fixed, 95% CI) | 0.0 [0.0, 0.0] | |
| 2.5 Day 63 | 1 | Risk Ratio (M‐H, Fixed, 95% CI) | 0.0 [0.0, 0.0] | |
| 3 Nervous system adverse events Show forest plot | 2 | Risk Ratio (M‐H, Fixed, 95% CI) | Totals not selected | |
| 3.1 Abnormal neurology | 1 | Risk Ratio (M‐H, Fixed, 95% CI) | 0.0 [0.0, 0.0] | |
| 3.2 Blurring vision | 1 | Risk Ratio (M‐H, Fixed, 95% CI) | 0.0 [0.0, 0.0] | |
| 3.3 Dizziness | 1 | Risk Ratio (M‐H, Fixed, 95% CI) | 0.0 [0.0, 0.0] | |
| 3.4 Headache | 1 | Risk Ratio (M‐H, Fixed, 95% CI) | 0.0 [0.0, 0.0] | |
| 3.5 Tinnitus | 2 | Risk Ratio (M‐H, Fixed, 95% CI) | 0.0 [0.0, 0.0] | |
| 3.6 Vertigo | 1 | Risk Ratio (M‐H, Fixed, 95% CI) | 0.0 [0.0, 0.0] | |
| 4 Gastrointestinal adverse events Show forest plot | 2 | Risk Ratio (M‐H, Fixed, 95% CI) | Totals not selected | |
| 4.1 Abdominal pain | 1 | Risk Ratio (M‐H, Fixed, 95% CI) | 0.0 [0.0, 0.0] | |
| 4.2 Anorexia | 1 | Risk Ratio (M‐H, Fixed, 95% CI) | 0.0 [0.0, 0.0] | |
| 4.3 Nausea | 2 | Risk Ratio (M‐H, Fixed, 95% CI) | 0.0 [0.0, 0.0] | |
| 4.4 Vomiting | 2 | Risk Ratio (M‐H, Fixed, 95% CI) | 0.0 [0.0, 0.0] | |
| 5 Other adverse events Show forest plot | 2 | Risk Ratio (M‐H, Fixed, 95% CI) | Totals not selected | |
| 5.1 Hypoglycaemia | 1 | Risk Ratio (M‐H, Fixed, 95% CI) | 0.0 [0.0, 0.0] | |
| 5.2 Muscle and joint pain | 1 | Risk Ratio (M‐H, Fixed, 95% CI) | 0.0 [0.0, 0.0] | |
| 5.3 Palpitations | 1 | Risk Ratio (M‐H, Fixed, 95% CI) | 0.0 [0.0, 0.0] | |
| 6 Low birthweight Show forest plot | 1 | Risk Ratio (M‐H, Fixed, 95% CI) | Totals not selected | |
| 7 Mean birthweight Show forest plot | 1 | Mean Difference (IV, Fixed, 95% CI) | Totals not selected | |
| 8 Abortion Show forest plot | 1 | Risk Ratio (M‐H, Fixed, 95% CI) | Totals not selected | |
| 9 Neonatal jaundice Show forest plot | 1 | Risk Ratio (M‐H, Fixed, 95% CI) | Totals not selected | |
| Outcome or subgroup title | No. of studies | No. of participants | Statistical method | Effect size |
| 1 Treatment failure at delivery or day 40 Show forest plot | 1 | Risk Ratio (M‐H, Fixed, 95% CI) | Totals not selected | |
| 2 Treatment failure at delivery or day 40 (excludes new infections, detected by PCR) Show forest plot | 1 | Risk Ratio (M‐H, Fixed, 95% CI) | Totals not selected | |
| 3 Maternal anaemia Show forest plot | 1 | Risk Ratio (M‐H, Fixed, 95% CI) | Totals not selected | |
| 4 Low birthweight Show forest plot | 1 | Risk Ratio (M‐H, Fixed, 95% CI) | Totals not selected | |
| 5 Perinatal death Show forest plot | 1 | Risk Ratio (M‐H, Fixed, 95% CI) | Totals not selected | |
| 6 Neonatal death Show forest plot | 1 | Risk Ratio (M‐H, Fixed, 95% CI) | Totals not selected | |
| Outcome or subgroup title | No. of studies | No. of participants | Statistical method | Effect size |
| 1 Treatment failure at delivery or 40 days Show forest plot | 1 | Risk Ratio (M‐H, Fixed, 95% CI) | Totals not selected | |
| 2 Treatment failure at delivery or day 40 (excludes new infections, detected by PCR) Show forest plot | 1 | Odds Ratio (M‐H, Fixed, 95% CI) | Totals not selected | |
| 3 Maternal anaemia Show forest plot | 1 | Risk Ratio (M‐H, Fixed, 95% CI) | Totals not selected | |
| 4 Low birthweight Show forest plot | 1 | Risk Ratio (M‐H, Fixed, 95% CI) | Totals not selected | |
| 5 Perinatal death Show forest plot | 1 | Risk Ratio (M‐H, Fixed, 95% CI) | Totals not selected | |
| 6 Neonatal death Show forest plot | 1 | Risk Ratio (M‐H, Fixed, 95% CI) | Totals not selected | |
| Outcome or subgroup title | No. of studies | No. of participants | Statistical method | Effect size |
| 1 Mean parasite clearance time Show forest plot | 1 | Mean Difference (IV, Fixed, 95% CI) | Totals not selected | |
| 2 Mean gestational age at delivery Show forest plot | 1 | Mean Difference (IV, Fixed, 95% CI) | Totals not selected | |
| Outcome or subgroup title | No. of studies | No. of participants | Statistical method | Effect size |
| 1 Treatment failure at 48 hours (excludes new infections, detected by PCR) Show forest plot | 1 | Risk Ratio (M‐H, Fixed, 95% CI) | Totals not selected | |
| 2 Mean parasite clearance time Show forest plot | 1 | Mean Difference (IV, Fixed, 95% CI) | Totals not selected | |
| 3 Anaemia at day 7 Show forest plot | 1 | Risk Ratio (M‐H, Fixed, 95% CI) | Totals not selected | |
| 4 Low birthweight Show forest plot | 1 | Risk Ratio (M‐H, Fixed, 95% CI) | Totals not selected | |
| 5 Mean birthweight Show forest plot | 1 | Mean Difference (IV, Fixed, 95% CI) | Totals not selected | |
| 6 Mean gestational age at delivery Show forest plot | 1 | Mean Difference (IV, Fixed, 95% CI) | Totals not selected | |
| Outcome or subgroup title | No. of studies | No. of participants | Statistical method | Effect size |
| 1 Mean fever clearance time Show forest plot | 1 | Mean Difference (IV, Fixed, 95% CI) | Totals not selected | |
| 2 Mean parasite clearance time Show forest plot | 1 | Mean Difference (IV, Fixed, 95% CI) | Totals not selected | |
| 3 Adverse events Show forest plot | 1 | Risk Ratio (M‐H, Fixed, 95% CI) | Totals not selected | |
| 3.1 Abdominal discomfort | 1 | Risk Ratio (M‐H, Fixed, 95% CI) | 0.0 [0.0, 0.0] | |
| 3.2 Dizziness | 1 | Risk Ratio (M‐H, Fixed, 95% CI) | 0.0 [0.0, 0.0] | |
| 4 Mean birthweight Show forest plot | 1 | Mean Difference (IV, Fixed, 95% CI) | Totals not selected | |
| Outcome or subgroup title | No. of studies | No. of participants | Statistical method | Effect size |
| 1 Treatment failure at day 28 Show forest plot | 1 | Risk Ratio (M‐H, Fixed, 95% CI) | Totals not selected | |
| 2 Treatment failure at day 28 (excludes new infections, detected by PCR) Show forest plot | 1 | Risk Ratio (M‐H, Fixed, 95% CI) | Totals not selected | |
| 3 Adverse events Show forest plot | 1 | Risk Ratio (M‐H, Fixed, 95% CI) | Totals not selected | |
| 3.1 Any "side effect" at day 3 | 1 | Risk Ratio (M‐H, Fixed, 95% CI) | 0.0 [0.0, 0.0] | |
| 3.2 Any "side effect" at day 7 | 1 | Risk Ratio (M‐H, Fixed, 95% CI) | 0.0 [0.0, 0.0] | |
| 3.3 General weakness at day 3 | 1 | Risk Ratio (M‐H, Fixed, 95% CI) | 0.0 [0.0, 0.0] | |
| 3.4 General weakness at day 7 | 1 | Risk Ratio (M‐H, Fixed, 95% CI) | 0.0 [0.0, 0.0] | |
| 3.5 Dizziness at day 3 | 1 | Risk Ratio (M‐H, Fixed, 95% CI) | 0.0 [0.0, 0.0] | |
| 3.6 Dizziness at day 7 | 1 | Risk Ratio (M‐H, Fixed, 95% CI) | 0.0 [0.0, 0.0] | |
| 3.7 Vomiting day 3 | 1 | Risk Ratio (M‐H, Fixed, 95% CI) | 0.0 [0.0, 0.0] | |
| 3.8 Vomiting at day 7 | 1 | Risk Ratio (M‐H, Fixed, 95% CI) | 0.0 [0.0, 0.0] | |
| 3.9 Itching at day 3 | 1 | Risk Ratio (M‐H, Fixed, 95% CI) | 0.0 [0.0, 0.0] | |
| 3.10 Itching at day 7 | 1 | Risk Ratio (M‐H, Fixed, 95% CI) | 0.0 [0.0, 0.0] | |
| 3.11 Nausea at day 3 | 1 | Risk Ratio (M‐H, Fixed, 95% CI) | 0.0 [0.0, 0.0] | |
| 3.12 Nausea at day 7 | 1 | Risk Ratio (M‐H, Fixed, 95% CI) | 0.0 [0.0, 0.0] | |
| 4 Low birthweight Show forest plot | 1 | Risk Ratio (M‐H, Fixed, 95% CI) | Totals not selected | |
| 5 Preterm delivery Show forest plot | 1 | Risk Ratio (M‐H, Fixed, 95% CI) | Totals not selected | |
| Outcome or subgroup title | No. of studies | No. of participants | Statistical method | Effect size |
| 1 Treatment failure at day 28 Show forest plot | 1 | Risk Ratio (M‐H, Fixed, 95% CI) | Totals not selected | |
| 2 Treatment failure at day 28 (excludes new infections, detected by PCR) Show forest plot | 1 | Risk Ratio (M‐H, Fixed, 95% CI) | Totals not selected | |
| 3 Adverse events Show forest plot | 1 | Risk Ratio (M‐H, Fixed, 95% CI) | Totals not selected | |
| 3.1 Any "side effect" at day 3 | 1 | Risk Ratio (M‐H, Fixed, 95% CI) | 0.0 [0.0, 0.0] | |
| 3.2 Any "side effect" at day 7 | 1 | Risk Ratio (M‐H, Fixed, 95% CI) | 0.0 [0.0, 0.0] | |
| 3.3 General weakness at day 3 | 1 | Risk Ratio (M‐H, Fixed, 95% CI) | 0.0 [0.0, 0.0] | |
| 3.4 General weakness at day 7 | 1 | Risk Ratio (M‐H, Fixed, 95% CI) | 0.0 [0.0, 0.0] | |
| 3.5 Dizziness at day 3 | 1 | Risk Ratio (M‐H, Fixed, 95% CI) | 0.0 [0.0, 0.0] | |
| 3.6 Dizziness at day 7 | 1 | Risk Ratio (M‐H, Fixed, 95% CI) | 0.0 [0.0, 0.0] | |
| 3.7 Vomiting at day 3 | 1 | Risk Ratio (M‐H, Fixed, 95% CI) | 0.0 [0.0, 0.0] | |
| 3.8 Vomiting at day 7 | 1 | Risk Ratio (M‐H, Fixed, 95% CI) | 0.0 [0.0, 0.0] | |
| 3.9 Itching at day 3 | 1 | Risk Ratio (M‐H, Fixed, 95% CI) | 0.0 [0.0, 0.0] | |
| 3.10 Itching at day 7 | 1 | Risk Ratio (M‐H, Fixed, 95% CI) | 0.0 [0.0, 0.0] | |
| 3.11 Nausea at day 3 | 1 | Risk Ratio (M‐H, Fixed, 95% CI) | 0.0 [0.0, 0.0] | |
| 3.12 Nausea at day 7 | 1 | Risk Ratio (M‐H, Fixed, 95% CI) | 0.0 [0.0, 0.0] | |
| 4 Low birthweight Show forest plot | 1 | Risk Ratio (M‐H, Fixed, 95% CI) | Totals not selected | |
| 5 Preterm delivery Show forest plot | 1 | Risk Ratio (M‐H, Fixed, 95% CI) | Totals not selected | |
| Outcome or subgroup title | No. of studies | No. of participants | Statistical method | Effect size |
| 1 Treatment failure at delivery or day 40 Show forest plot | 1 | Risk Ratio (M‐H, Fixed, 95% CI) | Totals not selected | |
| 2 Treatment failure at delivery or day 40 (excludes new infections, detected by PCR) Show forest plot | 1 | Risk Ratio (M‐H, Fixed, 95% CI) | Totals not selected | |
| 3 Maternal anaemia Show forest plot | 1 | Risk Ratio (M‐H, Fixed, 95% CI) | Totals not selected | |
| 4 Low birthweight Show forest plot | 1 | Risk Ratio (M‐H, Fixed, 95% CI) | Totals not selected | |
| 5 Perinatal death Show forest plot | 1 | Risk Ratio (M‐H, Fixed, 95% CI) | Totals not selected | |
| 6 Neonatal death Show forest plot | 1 | Risk Ratio (M‐H, Fixed, 95% CI) | Totals not selected | |
| Outcome or subgroup title | No. of studies | No. of participants | Statistical method | Effect size |
| 1 Treatment failure at day 14 Show forest plot | 2 | 544 | Risk Ratio (M‐H, Fixed, 95% CI) | 0.56 [0.29, 1.09] |
| 2 Treatment failure at day 28 Show forest plot | 2 | 538 | Risk Ratio (M‐H, Fixed, 95% CI) | 0.46 [0.33, 0.64] |
| 3 Treatment failure at day 28 (excludes new infections, detected by PCR) Show forest plot | 1 | Risk Ratio (M‐H, Fixed, 95% CI) | Totals not selected | |
| 4 Adverse events Show forest plot | 1 | Risk Ratio (M‐H, Fixed, 95% CI) | Totals not selected | |
| 4.1 Any "side effect" at day 3 | 1 | Risk Ratio (M‐H, Fixed, 95% CI) | 0.0 [0.0, 0.0] | |
| 4.2 Any "side effect" at day 7 | 1 | Risk Ratio (M‐H, Fixed, 95% CI) | 0.0 [0.0, 0.0] | |
| 4.3 General weakness at day 3 | 1 | Risk Ratio (M‐H, Fixed, 95% CI) | 0.0 [0.0, 0.0] | |
| 4.4 General weakness at day 7 | 1 | Risk Ratio (M‐H, Fixed, 95% CI) | 0.0 [0.0, 0.0] | |
| 4.5 Dizziness at day 3 | 1 | Risk Ratio (M‐H, Fixed, 95% CI) | 0.0 [0.0, 0.0] | |
| 4.6 Dizziness at day 7 | 1 | Risk Ratio (M‐H, Fixed, 95% CI) | 0.0 [0.0, 0.0] | |
| 4.7 Vomiting at day 3 | 1 | Risk Ratio (M‐H, Fixed, 95% CI) | 0.0 [0.0, 0.0] | |
| 4.8 Vomiting at day 7 | 1 | Risk Ratio (M‐H, Fixed, 95% CI) | 0.0 [0.0, 0.0] | |
| 4.9 Itching at day 3 | 1 | Risk Ratio (M‐H, Fixed, 95% CI) | 0.0 [0.0, 0.0] | |
| 4.10 Itching at day 7 | 1 | Risk Ratio (M‐H, Fixed, 95% CI) | 0.0 [0.0, 0.0] | |
| 4.11 Nausea at day 3 | 1 | Risk Ratio (M‐H, Fixed, 95% CI) | 0.0 [0.0, 0.0] | |
| 4.12 Nausea at day 7 | 1 | Risk Ratio (M‐H, Fixed, 95% CI) | 0.0 [0.0, 0.0] | |
| 5 Low birthweight Show forest plot | 1 | Risk Ratio (M‐H, Fixed, 95% CI) | Totals not selected | |
| 6 Preterm delivery Show forest plot | 1 | Risk Ratio (M‐H, Fixed, 95% CI) | Totals not selected | |
| Outcome or subgroup title | No. of studies | No. of participants | Statistical method | Effect size |
| 1 Treatment failure at day 14 Show forest plot | 1 | Risk Ratio (M‐H, Fixed, 95% CI) | Totals not selected | |
| 1.1 3‐day clindamycin | 1 | Risk Ratio (M‐H, Fixed, 95% CI) | 0.0 [0.0, 0.0] | |
| 1.2 5‐day clindamycin | 1 | Risk Ratio (M‐H, Fixed, 95% CI) | 0.0 [0.0, 0.0] | |
| 2 Adverse event: itching Show forest plot | 1 | Risk Ratio (M‐H, Fixed, 95% CI) | Totals not selected | |
| 2.1 3‐day clindamycin | 1 | Risk Ratio (M‐H, Fixed, 95% CI) | 0.0 [0.0, 0.0] | |
| 2.2 5‐day clindamycin | 1 | Risk Ratio (M‐H, Fixed, 95% CI) | 0.0 [0.0, 0.0] | |
| 3 Adverse event: diarrhoea Show forest plot | 1 | Risk Ratio (M‐H, Fixed, 95% CI) | Totals not selected | |
| 3.1 3‐day clindamycin | 1 | Risk Ratio (M‐H, Fixed, 95% CI) | 0.0 [0.0, 0.0] | |
| 3.2 5‐day clindamycin | 1 | Risk Ratio (M‐H, Fixed, 95% CI) | 0.0 [0.0, 0.0] | |