Acupuncture for neck disorders
Información
- DOI:
- https://doi.org/10.1002/14651858.CD004870.pub4Copiar DOI

- Base de datos:
-
- Cochrane Database of Systematic Reviews
- Versión publicada:
-
- 04 mayo 2016see what's new
- Tipo:
-
- Intervention
- Etapa:
-
- Review
- Grupo Editorial Cochrane:
-
Grupo Cochrane de Espalda y cuello
- Copyright:
-
- Copyright © 2016 The Cochrane Collaboration. Published by John Wiley & Sons, Ltd.
Cifras del artículo
Altmetric:
Citado por:
Autores
Contributions of authors
Primary reviewers for this review ‐ Trinh K, Graham N, Irnich D, Cameron ID, Forget M.
Statistician ‐ Trinh K, Goldsmith CH (Cervical Overview Group ‐ COG).
Methodological quality assessment ‐ COG Validity Team; Burnie S, Empey B, Forget M, Goldsmith CH, Graham N, LeBlanc F, Szeto G.
Study identification and selection ‐ Brunarski D, Graham N, Gross A, Haines T (COG).
Research librarian ‐ Rice M.
Data abstraction, synthesis, manuscript preparation, public responsibility, grants, administration ‐ primary review authors.
Final synthesis ‐ primary review authors.
Sources of support
Internal sources
-
No sources of support supplied
External sources
-
Candian Institute of Health Research, Canada.
Knowledge Synthesis Grant "Synthesizing Research Evidence into Clinical Recommendations for Managing Neck Pain"
Declarations of interest
D Irnich is an author of two included studies. He did not take part in data extraction.
Use of raters from diverse professional backgrounds (sports medicine physician, rheumatologist, occupational health physician, physiatrist, statistician, physiotherapist, manual therapist, chiropractor, massage therapist) should serve to limit any conflicts of interest that might have been present during the review process.
Acknowledgements
Thank you to the primary authors who responded to requests for information. We also thank our volunteers, our translators and the Cochrane Back Review Group editors.
Version history
| Published | Title | Stage | Authors | Version |
| 2016 Nov 17 | Acupuncture for neck disorders | Review | Kien Trinh, Nadine Graham, Dominik Irnich, Ian D Cameron, Mario Forget | |
| 2016 May 04 | Acupuncture for neck disorders | Review | Kien Trinh, Nadine Graham, Dominik Irnich, Ian D Cameron, Mario Forget | |
| 2006 Jul 19 | Acupuncture for neck disorders | Review | Kien Trinh, Nadine Graham, Anita Gross, Charles H Goldsmith, Ellen Wang, Ian D Cameron, Theresa M Kay, Cervical Overview Group | |
| 2004 Jul 19 | Acupuncture for neck disorders | Protocol | Kien Trinh, Theresa M Kay, Nadine Graham, Anita Gross, Charles H Goldsmith, Ian D Cameron, Ellen Wang, Zevko Radylovic | |
| 2003 Apr 22 | Acupuncture for neck disorders | Protocol | KV Trinh, TM Kay, N Graham, AR Gross, CH Goldsmith, I Cameron, E Wang, Z Radylovic | |
Differences between protocol and review
We included only randomised controlled trials (RCTs) in this update. In the original review, we included RCTs and quasi‐RCTs, as per protocol.
We used the risk of bias assessment tool of the Cochrane Back Review Group (Furlan 2009) for this update. We previously used the assessment tools used in Jadad 1996 and van Tulder 2003.
Keywords
MeSH
Medical Subject Headings (MeSH) Keywords
Medical Subject Headings Check Words
Humans;

Study flow diagram.

Risk of bias summary: review authors' judgements about each risk of bias item for each included study.

Comparison 1 Acupuncture versus sham treatment, Outcome 1 Pain intensity (VAS) immediate post treatment.

Comparison 1 Acupuncture versus sham treatment, Outcome 2 Pain intensity (VAS) short term.

Comparison 1 Acupuncture versus sham treatment, Outcome 3 Pain intensity (VAS) intermediate term.
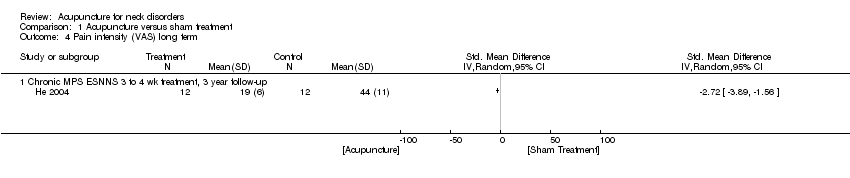
Comparison 1 Acupuncture versus sham treatment, Outcome 4 Pain intensity (VAS) long term.
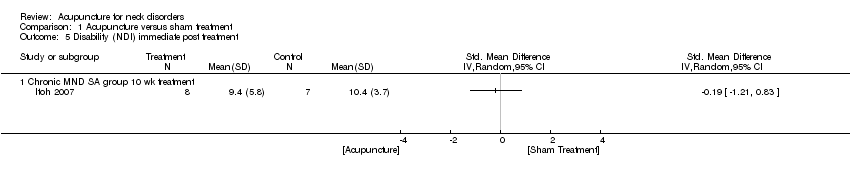
Comparison 1 Acupuncture versus sham treatment, Outcome 5 Disability (NDI) immediate post treatment.

Comparison 1 Acupuncture versus sham treatment, Outcome 6 Disability (NPQ) immediate post treatment.

Comparison 1 Acupuncture versus sham treatment, Outcome 7 Disability (NPQ) short term.

Comparison 1 Acupuncture versus sham treatment, Outcome 8 Disability (NDI) short term.

Comparison 1 Acupuncture versus sham treatment, Outcome 9 Disability (NDI) intermediate term.

Comparison 1 Acupuncture versus sham treatment, Outcome 10 Quality of life (SF‐36) immediate post treatment.

Comparison 1 Acupuncture versus sham treatment, Outcome 11 Quality of life (SF‐36) short term.

Comparison 2 Acupuncture versus inactive control, Outcome 1 Pain intensity (VAS) immediate post treatment.
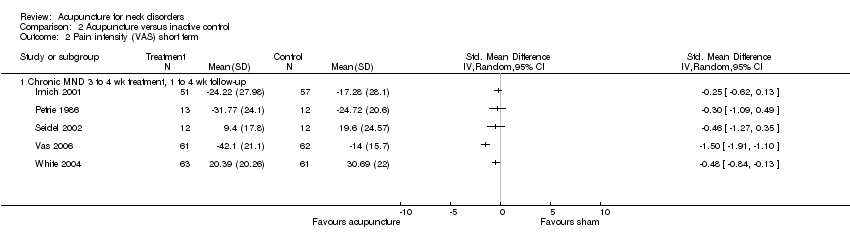
Comparison 2 Acupuncture versus inactive control, Outcome 2 Pain intensity (VAS) short term.

Comparison 2 Acupuncture versus inactive control, Outcome 3 Pain intensity (VAS) intermediate term.
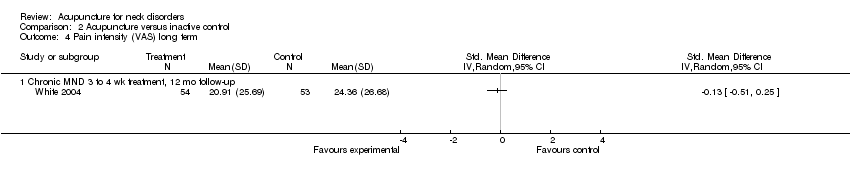
Comparison 2 Acupuncture versus inactive control, Outcome 4 Pain intensity (VAS) long term.

Comparison 2 Acupuncture versus inactive control, Outcome 5 Pain pressure threshold immediate post treatment.
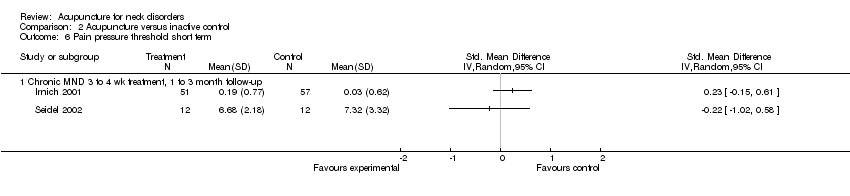
Comparison 2 Acupuncture versus inactive control, Outcome 6 Pain pressure threshold short term.
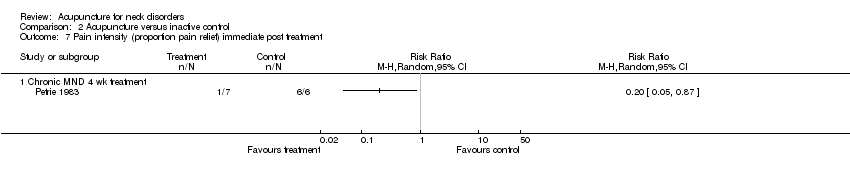
Comparison 2 Acupuncture versus inactive control, Outcome 7 Pain intensity (proportion pain relief) immediate post treatment.
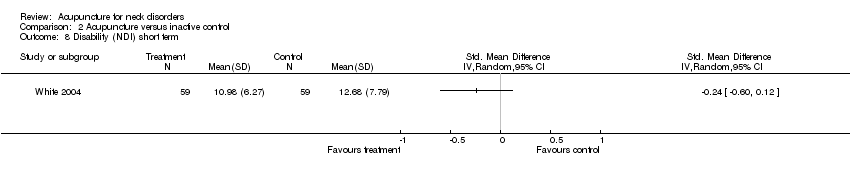
Comparison 2 Acupuncture versus inactive control, Outcome 8 Disability (NDI) short term.

Comparison 2 Acupuncture versus inactive control, Outcome 9 Disability (NDI) intermediate term.

Comparison 2 Acupuncture versus inactive control, Outcome 10 Disability (NDI) long term.
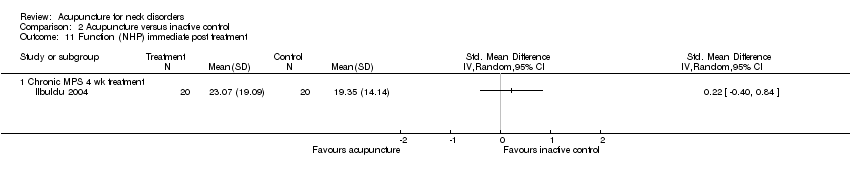
Comparison 2 Acupuncture versus inactive control, Outcome 11 Function (NHP) immediate post treatment.

Comparison 2 Acupuncture versus inactive control, Outcome 12 Function (NHP) intermediate term.
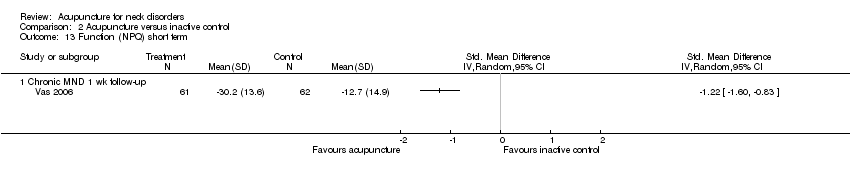
Comparison 2 Acupuncture versus inactive control, Outcome 13 Function (NPQ) short term.

Comparison 2 Acupuncture versus inactive control, Outcome 14 Quality of life (SF‐36, Functional Component) short term.

Comparison 3 Acupuncture versus wait‐list, Outcome 1 Pain intensity (VAS) short term.
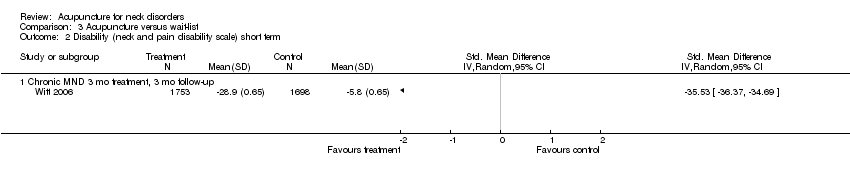
Comparison 3 Acupuncture versus wait‐list, Outcome 2 Disability (neck and pain disability scale) short term.

Comparison 3 Acupuncture versus wait‐list, Outcome 3 Disability (neck and pain disability scale) intermediate term.
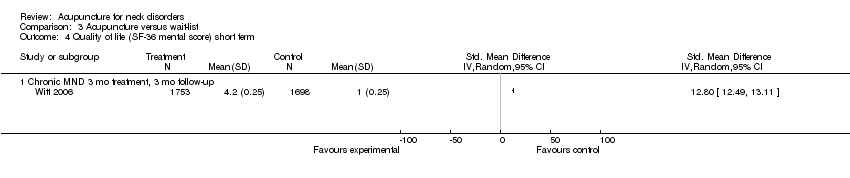
Comparison 3 Acupuncture versus wait‐list, Outcome 4 Quality of life (SF‐36 mental score) short term.

Comparison 3 Acupuncture versus wait‐list, Outcome 5 Quality of life (SF‐36 mental score) intermediate term.

Comparison 3 Acupuncture versus wait‐list, Outcome 6 Quality of life (SF‐36 physical score) intermediate term.
| Acupuncture compared with sham for chronic neck pain | ||||||
| Patient or population: patients with chronic mechanical neck pain (pain for more than 90 days) Settings: varied, mostly at university or hospital clinics Intervention: acupuncture Comparison: sham | ||||||
| Outcomes | Illustrative comparative risks* (95% CI) | Relative effect | Number of participants | Quality of the evidence | Comments | |
| Assumed risk | Corresponding risk | |||||
| Sham | Acupuncture | |||||
| Pain intensity (VAS) short term | Mean pain intensity ranged across sham groups from 3 points on a 0 to 10 scale to 47 points on a 0 to 100 scale | Mean pain intensity in intervention groups was 0.23 standard deviations lower (0.20 to 0.07 higher) | ‐0.23 (‐0.20 to ‐0.07) | 560 (8 studies) | ⊕⊕⊕⊝ Limitations: ‐1 Inconsistency: 0 Indirectness: 0 Imprecision: 0 Other: 0 | Statistical pooling was appropriate in this instance because of statistical homogeneity. Results of the meta‐analysis favoured acupuncture |
| Disability (NPQ) short term | Mean disability ranged across control groups from 24 points on a 0 to 100 scale to 26 points on a 0 to 100 scale | Mean disability in intervention groups was | ‐0.38 (‐0.62 to ‐0.15) | 290 (2 studies) | ⊕⊕⊝⊝ Limitations: ‐1 Inconsistency: 0 Indirectness: 0 Imprecision: ‐1 Other: 0 | Two small trials were in favour of acupuncture. On the basis of the GRADE scale, quality level of evidence was downgraded to low because only 1 of the 2 studies (50%) was at low risk with small sample size |
| Disability (NDI) short term | Mean disability ranged across control groups from | Mean disability in intervention groups ranged from | ‐‐ | 173 | N/A | All 3 studies, 2 with low risk of bias, did not show a statistically significant result in favour of acupuncture |
| Quality of life (SF‐36) short term | Mean quality of life across control groups ranged from 86 points on a 0 to 100 scale to 86 points on a 0 to 100 scale | Mean quality of life in intervention groups ranged from 84 points on a 0 to 100 scale to 85 points on a 0 to 100 scale | ‐‐ | 178 (1 study) | ⊕⊕⊝⊝ Limitations: 0 Inconsistency: 0 Indirectness: ‐1 Imprecision: ‐1 Other: 0 | One study with low risk of bias favoured acupuncture |
| *The basis for the assumed risk (e.g. median control group risk across studies) is provided in footnotes. The corresponding risk (and its 95% confidence interval) is based on the assumed risk in the comparison group and the relative effect of the intervention (and its 95% CI) | ||||||
| Adverse effects were reported in 14 studies and included increased pain, bruising, fainting, worsening of symptoms, local swelling and dizziness. No life‐threatening adverse effects were noted by these studies. GRADE Working Group grades of evidence | ||||||
| Acupuncture compared with inactive treatments for chronic neck pain | ||||||
| Patient or population: patients with chronic neck pain (pain for more than 90 days) Settings: primary care, general practitioners' clinics to secondary care, outpatient pain clinics or speciality clinics Intervention: acupuncture Comparison: inactive treatments | ||||||
| Outcomes | Illustrative comparative risks* (95% CI) | Relative effect | Number of participants | Quality of the evidence | Comments | |
| Assumed risk | Corresponding risk | |||||
| Inactive treatment | Acupuncture | |||||
| Pain intensity (VAS) short term | Mean pain intensity ranged across control groups from 17 points on a 0 to 100 scale to 31 points on a 0 to 100 scale | Mean pain intensity in intervention groups was 17 points on a 0 to 100 scale to 9 points on a 0 to 10 scale | ‐‐ | 404 (5 studies) | ⊕⊕⊕⊝ Limitations: 0 Inconsistency: 0 Indirectness: 0 Imprecision: ‐1 Other: 0 | Five studies (n = 461) assessed participants with mechanical neck disorders. Four were at low risk of bias. Statistical pooling was inappropriate in this instance because of statistical heterogeneity. Four of these studies favoured acupuncture |
| Pain pressure threshold short term | Mean pain pressure threshold ranged across control groups from 0 points on a 0 to 10 scale to 7 points on a 0 to 10 scale | Mean pain pressure threshold in intervention groups ranged from 0.2 points on a 0 to 10 scale to 7 points on a 0 to 10 scale | ‐‐ | 132 (2 studies) | N/A | Two studies with low risk of bias did not favour acupuncture |
| Disability (NDI) short term Function (NPQ) short term | Mean disability ranged across control groups from 12 points on a 0 to 100 scale to 13 points on a 0 to 100 scale Mean function across control groups was 13 points on a 0 to 100 scale | Mean disability in intervention groups ranged from Mean function in intervention groups was 30 points on a 0 to 100 scale | ‐‐ | 118 (1 study) 123 (1 study) | N/A ⊕⊕⊝⊝ Limitations: 0 Inconsistency: 0 Indirectness: ‐1 Imprecision: ‐1 Other: 0 | One study with low risk of bias did not favour acupuncture One study with low risk of bias favoured acupuncture |
| Quality of life (SF‐36, Functional Component) short term | Mean function ranged across control groups from 0.7 points on a 0 to 10 scale to 5 points on a 0 to 10 scale | Mean function in intervention groups ranged from 41 points on a 0 to 100 scale to 9 points on a 0 to 10 scale | ‐‐ | 143 (2 studies) | N/A | Two studies with low risk of bias did not favour acupuncture |
| *The basis for the assumed risk (e.g. median control group risk across studies) is provided in footnotes. The corresponding risk (and its 95% confidence interval) is based on the assumed risk in the comparison group and the relative effect of the intervention (and its 95% CI) | ||||||
| Adverse effects were reported in 14 studies and included increased pain, bruising, fainting, worsening of symptoms, local swelling and dizziness. No life‐threatening adverse effects were noted by these studies. GRADE Working Group grades of evidence | ||||||
| Acupuncture compared with wait‐list control for chronic neck pain | ||||||
| Patient or population: patients with chronic neck pain (pain for more than 90 days) Settings: primary care newspaper advertisement or recruited through participating physicians Intervention: acupuncture Comparison: wait‐list control | ||||||
| Outcomes | Illustrative comparative risks* (95% CI) | Relative effect | Number of participants | Quality of the evidence | Comments | |
| Assumed risk | Corresponding risk | |||||
| Wait‐list control | Acupuncture | |||||
| Pain intensity (VAS) short term | Mean pain intensity across control groups was 5 points on a 0 to 10 scale | Mean pain intensity in intervention groups was | ‐‐ | 30 (1 study) | ⊕⊕⊕⊝ Limitations: 0 Inconsistency: 0 Indirectness: ‐1 Imprecision: 0 Other: 0 | One trial with low risk of bias showed a small reduction in pain. Moderate evidence supporting acupuncture is helpful |
| Disability (neck and pain disability scale) short term | Mean disability across control groups was | Mean disability in intervention groups was 29 points on a 0 to 100 scale | ‐‐ | 3451 (1 study) | ⊕⊕⊕⊝ Limitations: 0 Inconsistency: 0 Indirectness: ‐1 Imprecision: 0 Other: 0 | One large study with low risk of bias favoured acupuncture |
| Quality of life (SF‐36 mental score) short term | Mean quality of life score across control groups was | Mean quality of life score in intervention groups was 4 points on a 0 to 10 scale | ‐‐ | 3451 (1 study) | N/A | One large study showed no statistically significant findings in favour of acupuncture |
| *The basis for the assumed risk (e.g. median control group risk across studies) is provided in footnotes. The corresponding risk (and its 95% confidence interval) is based on the assumed risk in the comparison group and the relative effect of the intervention (and its 95% CI) | ||||||
| Adverse effects were reported in 14 studies and included increased pain, bruising, fainting, worsening of symptoms, local swelling and dizziness. No life‐threatening adverse effects were noted by these studies Cost of care was calculated in 1 study, which found that acupuncture treatment was cost‐effective GRADE Working Group grades of evidence | ||||||
| Outcome or subgroup title | No. of studies | No. of participants | Statistical method | Effect size |
| 1 Pain intensity (VAS) immediate post treatment Show forest plot | 11 | Std. Mean Difference (IV, Random, 95% CI) | Totals not selected | |
| 1.1 Chronic MPS 1 treatment session | 2 | Std. Mean Difference (IV, Random, 95% CI) | 0.0 [0.0, 0.0] | |
| 1.2 Chronic MND 3 to 4 wk treatment | 4 | Std. Mean Difference (IV, Random, 95% CI) | 0.0 [0.0, 0.0] | |
| 1.3 Chronic MPS 12 wk treatment | 1 | Std. Mean Difference (IV, Random, 95% CI) | 0.0 [0.0, 0.0] | |
| 1.4 Chronic MND SA group 10 wk treatment | 1 | Std. Mean Difference (IV, Random, 95% CI) | 0.0 [0.0, 0.0] | |
| 1.5 Cervical osteoarthritis 1 treatment session | 1 | Std. Mean Difference (IV, Random, 95% CI) | 0.0 [0.0, 0.0] | |
| 1.6 Chronic MPS 3 wk treatment, pain with movement scale | 2 | Std. Mean Difference (IV, Random, 95% CI) | 0.0 [0.0, 0.0] | |
| 2 Pain intensity (VAS) short term Show forest plot | 8 | 560 | Std. Mean Difference (IV, Random, 95% CI) | ‐0.23 [‐0.40, ‐0.07] |
| 2.1 Chronic MPS 3 wk treatment, 3 mo follow‐up, pain with movement scale | 1 | 34 | Std. Mean Difference (IV, Random, 95% CI) | 0.0 [‐0.67, 0.67] |
| 2.2 Chronic MND 3 to 4 wk treatment, 1 to 4 wk follow‐up | 1 | 34 | Std. Mean Difference (IV, Random, 95% CI) | ‐0.15 [‐0.82, 0.52] |
| 2.3 Chronic MND 3 to 4 wk treatment, 3 mo follow‐up | 3 | 319 | Std. Mean Difference (IV, Random, 95% CI) | ‐0.18 [‐0.40, 0.04] |
| 2.4 Subacute/chronic WAD 6 wk treatment, 3 mo follow‐up | 1 | 124 | Std. Mean Difference (IV, Random, 95% CI) | ‐0.38 [‐0.73, ‐0.02] |
| 2.5 WAD myofascial 2 to 6 sessions, 6 wk follow‐up | 1 | 34 | Std. Mean Difference (IV, Random, 95% CI) | ‐0.60 [‐1.29, 0.09] |
| 2.6 Chronic MND SA group 10 wk treatment, 3 wk follow‐up | 1 | 15 | Std. Mean Difference (IV, Random, 95% CI) | ‐0.10 [‐1.11, 0.92] |
| 3 Pain intensity (VAS) intermediate term Show forest plot | 2 | Std. Mean Difference (IV, Random, 95% CI) | Totals not selected | |
| 3.1 Chronic MPS ESNS 3 to 4 wk treatment, 6 mo follow‐up | 1 | Std. Mean Difference (IV, Random, 95% CI) | 0.0 [0.0, 0.0] | |
| 3.2 Chronic WAD 6 wk treatment, 6 mo follow‐up | 1 | Std. Mean Difference (IV, Random, 95% CI) | 0.0 [0.0, 0.0] | |
| 4 Pain intensity (VAS) long term Show forest plot | 1 | Std. Mean Difference (IV, Random, 95% CI) | Totals not selected | |
| 4.1 Chronic MPS ESNNS 3 to 4 wk treatment, 3 year follow‐up | 1 | Std. Mean Difference (IV, Random, 95% CI) | 0.0 [0.0, 0.0] | |
| 5 Disability (NDI) immediate post treatment Show forest plot | 1 | Std. Mean Difference (IV, Random, 95% CI) | Totals not selected | |
| 5.1 Chronic MND SA group 10 wk treatment | 1 | Std. Mean Difference (IV, Random, 95% CI) | 0.0 [0.0, 0.0] | |
| 6 Disability (NPQ) immediate post treatment Show forest plot | 3 | Std. Mean Difference (IV, Random, 95% CI) | Totals not selected | |
| 6.1 Chronic MND, 3 wk treatment | 3 | Std. Mean Difference (IV, Random, 95% CI) | 0.0 [0.0, 0.0] | |
| 7 Disability (NPQ) short term Show forest plot | 2 | 290 | Std. Mean Difference (IV, Random, 95% CI) | ‐0.38 [‐0.62, ‐0.15] |
| 7.1 Chronic MND, 3 wk treatment, 3 mo follow‐up | 2 | 290 | Std. Mean Difference (IV, Random, 95% CI) | ‐0.38 [‐0.62, ‐0.15] |
| 8 Disability (NDI) short term Show forest plot | 4 | Std. Mean Difference (IV, Random, 95% CI) | Totals not selected | |
| 8.1 Chronic MND SA group 10 wk treatment, 3 wk follow‐up | 1 | Std. Mean Difference (IV, Random, 95% CI) | 0.0 [0.0, 0.0] | |
| 8.2 Chronic WAD 6 wk treatment, 3 mo follow‐up | 1 | Std. Mean Difference (IV, Random, 95% CI) | 0.0 [0.0, 0.0] | |
| 8.3 WAD II myofascial 2 to 6 treatment, 6 wk follow‐up | 1 | Std. Mean Difference (IV, Random, 95% CI) | 0.0 [0.0, 0.0] | |
| 8.4 Chronic MPS 1 treatment | 1 | Std. Mean Difference (IV, Random, 95% CI) | 0.0 [0.0, 0.0] | |
| 9 Disability (NDI) intermediate term Show forest plot | 1 | Std. Mean Difference (IV, Random, 95% CI) | Totals not selected | |
| 9.1 Chronic WAD 6 wk treatment, 6 mo follow‐up | 1 | Std. Mean Difference (IV, Random, 95% CI) | 0.0 [0.0, 0.0] | |
| 10 Quality of life (SF‐36) immediate post treatment Show forest plot | 1 | Std. Mean Difference (IV, Fixed, 95% CI) | Totals not selected | |
| 10.1 Chronic MND, 3 wk treatment | 1 | Std. Mean Difference (IV, Fixed, 95% CI) | 0.0 [0.0, 0.0] | |
| 11 Quality of life (SF‐36) short term Show forest plot | 1 | Std. Mean Difference (IV, Random, 95% CI) | Totals not selected | |
| 11.1 Chronic MND, 3 wk treatment, 3 mo follow‐up | 1 | Std. Mean Difference (IV, Random, 95% CI) | 0.0 [0.0, 0.0] | |
| Outcome or subgroup title | No. of studies | No. of participants | Statistical method | Effect size |
| 1 Pain intensity (VAS) immediate post treatment Show forest plot | 5 | Std. Mean Difference (IV, Random, 95% CI) | Totals not selected | |
| 1.1 Chronic MPS 4 wk treatment | 1 | Std. Mean Difference (IV, Random, 95% CI) | 0.0 [0.0, 0.0] | |
| 1.2 Chronic MND NLA group 1 treatment session, movement scale | 1 | Std. Mean Difference (IV, Random, 95% CI) | 0.0 [0.0, 0.0] | |
| 1.3 Chronic MND 3 to 4 wk treatment | 2 | Std. Mean Difference (IV, Random, 95% CI) | 0.0 [0.0, 0.0] | |
| 1.4 Cervical osteoarthritis 1 treatment session | 1 | Std. Mean Difference (IV, Random, 95% CI) | 0.0 [0.0, 0.0] | |
| 2 Pain intensity (VAS) short term Show forest plot | 5 | Std. Mean Difference (IV, Random, 95% CI) | Totals not selected | |
| 2.1 Chronic MND 3 to 4 wk treatment, 1 to 4 wk follow‐up | 5 | Std. Mean Difference (IV, Random, 95% CI) | 0.0 [0.0, 0.0] | |
| 3 Pain intensity (VAS) intermediate term Show forest plot | 3 | Std. Mean Difference (IV, Random, 95% CI) | Totals not selected | |
| 3.1 Chronic MPS 4 wk treatment, 6 mo follow‐up | 1 | Std. Mean Difference (IV, Random, 95% CI) | 0.0 [0.0, 0.0] | |
| 3.2 Chronic MND 3 to 4 wk treatment, 6 mo follow‐up | 2 | Std. Mean Difference (IV, Random, 95% CI) | 0.0 [0.0, 0.0] | |
| 4 Pain intensity (VAS) long term Show forest plot | 1 | Std. Mean Difference (IV, Random, 95% CI) | Totals not selected | |
| 4.1 Chronic MND 3 to 4 wk treatment, 12 mo follow‐up | 1 | Std. Mean Difference (IV, Random, 95% CI) | 0.0 [0.0, 0.0] | |
| 5 Pain pressure threshold immediate post treatment Show forest plot | 2 | Std. Mean Difference (IV, Random, 95% CI) | Totals not selected | |
| 5.1 Chronic MND 3 to 4 wk treatment | 2 | Std. Mean Difference (IV, Random, 95% CI) | 0.0 [0.0, 0.0] | |
| 6 Pain pressure threshold short term Show forest plot | 2 | Std. Mean Difference (IV, Random, 95% CI) | Totals not selected | |
| 6.1 Chronic MND 3 to 4 wk treatment, 1 to 3 month follow‐up | 2 | Std. Mean Difference (IV, Random, 95% CI) | 0.0 [0.0, 0.0] | |
| 7 Pain intensity (proportion pain relief) immediate post treatment Show forest plot | 1 | Risk Ratio (M‐H, Random, 95% CI) | Totals not selected | |
| 7.1 Chronic MND 4 wk treatment | 1 | Risk Ratio (M‐H, Random, 95% CI) | 0.0 [0.0, 0.0] | |
| 8 Disability (NDI) short term Show forest plot | 1 | Std. Mean Difference (IV, Random, 95% CI) | Totals not selected | |
| 9 Disability (NDI) intermediate term Show forest plot | 1 | Std. Mean Difference (IV, Random, 95% CI) | Totals not selected | |
| 9.1 Chronic MND 4 wk treatment, 6 mo follow‐up | 1 | Std. Mean Difference (IV, Random, 95% CI) | 0.0 [0.0, 0.0] | |
| 10 Disability (NDI) long term Show forest plot | 1 | Std. Mean Difference (IV, Random, 95% CI) | Totals not selected | |
| 10.1 Chronic MND 4 wk treatment, 12 mo follow‐up | 1 | Std. Mean Difference (IV, Random, 95% CI) | 0.0 [0.0, 0.0] | |
| 11 Function (NHP) immediate post treatment Show forest plot | 1 | Std. Mean Difference (IV, Random, 95% CI) | Totals not selected | |
| 11.1 Chronic MPS 4 wk treatment | 1 | Std. Mean Difference (IV, Random, 95% CI) | 0.0 [0.0, 0.0] | |
| 12 Function (NHP) intermediate term Show forest plot | 1 | Std. Mean Difference (IV, Random, 95% CI) | Totals not selected | |
| 12.1 Chronic MPS 4 wk treatment 6 mo follow‐up | 1 | Std. Mean Difference (IV, Random, 95% CI) | 0.0 [0.0, 0.0] | |
| 13 Function (NPQ) short term Show forest plot | 1 | Std. Mean Difference (IV, Random, 95% CI) | Totals not selected | |
| 13.1 Chronic MND 1 wk follow‐up | 1 | Std. Mean Difference (IV, Random, 95% CI) | 0.0 [0.0, 0.0] | |
| 14 Quality of life (SF‐36, Functional Component) short term Show forest plot | 2 | Std. Mean Difference (IV, Random, 95% CI) | Totals not selected | |
| 14.1 Chronic MND 3 to 4 wk treatment, 8 wk follow‐up | 2 | Std. Mean Difference (IV, Random, 95% CI) | 0.0 [0.0, 0.0] | |
| Outcome or subgroup title | No. of studies | No. of participants | Statistical method | Effect size |
| 1 Pain intensity (VAS) short term Show forest plot | 1 | Std. Mean Difference (IV, Random, 95% CI) | Totals not selected | |
| 1.1 Chronic NDR 4 wk treatment, 8 wk follow‐up | 1 | Std. Mean Difference (IV, Random, 95% CI) | 0.0 [0.0, 0.0] | |
| 2 Disability (neck and pain disability scale) short term Show forest plot | 1 | Std. Mean Difference (IV, Random, 95% CI) | Totals not selected | |
| 2.1 Chronic MND 3 mo treatment, 3 mo follow‐up | 1 | Std. Mean Difference (IV, Random, 95% CI) | 0.0 [0.0, 0.0] | |
| 3 Disability (neck and pain disability scale) intermediate term Show forest plot | 1 | Std. Mean Difference (IV, Random, 95% CI) | Totals not selected | |
| 3.1 Chronic MND 3 mo treatment, 6 mo follow‐up | 1 | Std. Mean Difference (IV, Random, 95% CI) | 0.0 [0.0, 0.0] | |
| 4 Quality of life (SF‐36 mental score) short term Show forest plot | 1 | Std. Mean Difference (IV, Random, 95% CI) | Totals not selected | |
| 4.1 Chronic MND 3 mo treatment, 3 mo follow‐up | 1 | Std. Mean Difference (IV, Random, 95% CI) | 0.0 [0.0, 0.0] | |
| 5 Quality of life (SF‐36 mental score) intermediate term Show forest plot | 1 | Std. Mean Difference (IV, Random, 95% CI) | Totals not selected | |
| 5.1 Chronic MND 3 mo treatment, 6 mo follow‐up | 1 | Std. Mean Difference (IV, Random, 95% CI) | 0.0 [0.0, 0.0] | |
| 6 Quality of life (SF‐36 physical score) intermediate term Show forest plot | 1 | Std. Mean Difference (IV, Random, 95% CI) | Totals not selected | |
| 6.1 Chronic MND 3 mo treatment, 6 mo follow‐up | 1 | Std. Mean Difference (IV, Random, 95% CI) | 0.0 [0.0, 0.0] | |