Scolaris Content Display Scolaris Content Display

Study flow diagram.
Figuras y tablas -
Figure 1

Study flow diagram.

Methodological quality graph: review authors' judgements about each methodological quality item presented as percentages across all included studies.
Figuras y tablas -
Figure 2

Methodological quality graph: review authors' judgements about each methodological quality item presented as percentages across all included studies.

Methodological quality summary: review authors' judgements about each methodological quality item for each included study.
Figuras y tablas -
Figure 3

Methodological quality summary: review authors' judgements about each methodological quality item for each included study.

Comparison 1 oxcarbazepine versus placebo, Outcome 1 clinical response‐ categorical outcome, at least 50% reduction in YMRS.
Figuras y tablas -
Analysis 1.1

Comparison 1 oxcarbazepine versus placebo, Outcome 1 clinical response‐ categorical outcome, at least 50% reduction in YMRS.

Comparison 1 oxcarbazepine versus placebo, Outcome 2 clinical response ‐ categorical outcome, at least 50% reduction in YMRS, children.
Figuras y tablas -
Analysis 1.2

Comparison 1 oxcarbazepine versus placebo, Outcome 2 clinical response ‐ categorical outcome, at least 50% reduction in YMRS, children.

Comparison 1 oxcarbazepine versus placebo, Outcome 3 clinical response‐ categorical outcome, at least 50% reduction in YMRS,adolescents.
Figuras y tablas -
Analysis 1.3

Comparison 1 oxcarbazepine versus placebo, Outcome 3 clinical response‐ categorical outcome, at least 50% reduction in YMRS,adolescents.

Comparison 1 oxcarbazepine versus placebo, Outcome 4 adjusted mean change in YMRS from baseline to endpoint.
Figuras y tablas -
Analysis 1.4

Comparison 1 oxcarbazepine versus placebo, Outcome 4 adjusted mean change in YMRS from baseline to endpoint.

Comparison 1 oxcarbazepine versus placebo, Outcome 5 adjusted mean change in children's depression rating scale from baseline to endpoint.
Figuras y tablas -
Analysis 1.5

Comparison 1 oxcarbazepine versus placebo, Outcome 5 adjusted mean change in children's depression rating scale from baseline to endpoint.

Comparison 1 oxcarbazepine versus placebo, Outcome 6 adjusted mean change in CGI‐S to endpoint.
Figuras y tablas -
Analysis 1.6

Comparison 1 oxcarbazepine versus placebo, Outcome 6 adjusted mean change in CGI‐S to endpoint.

Comparison 1 oxcarbazepine versus placebo, Outcome 7 adjusted mean change in CHQ, global health score.
Figuras y tablas -
Analysis 1.7

Comparison 1 oxcarbazepine versus placebo, Outcome 7 adjusted mean change in CHQ, global health score.

Comparison 1 oxcarbazepine versus placebo, Outcome 8 adjusted mean change in CHQ; global behaviour score.
Figuras y tablas -
Analysis 1.8

Comparison 1 oxcarbazepine versus placebo, Outcome 8 adjusted mean change in CHQ; global behaviour score.

Comparison 1 oxcarbazepine versus placebo, Outcome 9 Total drop out rate from baseline to endpoint (more events:poorer outcome).
Figuras y tablas -
Analysis 1.9

Comparison 1 oxcarbazepine versus placebo, Outcome 9 Total drop out rate from baseline to endpoint (more events:poorer outcome).

Comparison 2 oxcarbazepine versus other mood stabilisers, Outcome 1 clinical response‐categorical outcome, at least 50% reduction in YMRS.
Figuras y tablas -
Analysis 2.1

Comparison 2 oxcarbazepine versus other mood stabilisers, Outcome 1 clinical response‐categorical outcome, at least 50% reduction in YMRS.

Comparison 2 oxcarbazepine versus other mood stabilisers, Outcome 2 mean change in YMRS score from baseline to endpoint: Change score (decrease=good).
Figuras y tablas -
Analysis 2.2

Comparison 2 oxcarbazepine versus other mood stabilisers, Outcome 2 mean change in YMRS score from baseline to endpoint: Change score (decrease=good).

Comparison 2 oxcarbazepine versus other mood stabilisers, Outcome 3 mean change in CGI‐S scores by end of study: Change score (decrease=good).
Figuras y tablas -
Analysis 2.3

Comparison 2 oxcarbazepine versus other mood stabilisers, Outcome 3 mean change in CGI‐S scores by end of study: Change score (decrease=good).

Comparison 2 oxcarbazepine versus other mood stabilisers, Outcome 4 categorical outcome, physician evaluation of tolerability: Good (good to excellent).
Figuras y tablas -
Analysis 2.4

Comparison 2 oxcarbazepine versus other mood stabilisers, Outcome 4 categorical outcome, physician evaluation of tolerability: Good (good to excellent).

Comparison 2 oxcarbazepine versus other mood stabilisers, Outcome 5 categorical outcome, physician global evaluation of tolerability: Poor (moderate to poor).
Figuras y tablas -
Analysis 2.5

Comparison 2 oxcarbazepine versus other mood stabilisers, Outcome 5 categorical outcome, physician global evaluation of tolerability: Poor (moderate to poor).

Comparison 3 Oxcarbazepine as an adjunctive mood stabiliser vs alternative mood stabiliser, Outcome 1 Mean change in YMRS score from baseline to endpoint: Change score (decrease=good).
Figuras y tablas -
Analysis 3.1

Comparison 3 Oxcarbazepine as an adjunctive mood stabiliser vs alternative mood stabiliser, Outcome 1 Mean change in YMRS score from baseline to endpoint: Change score (decrease=good).

Comparison 3 Oxcarbazepine as an adjunctive mood stabiliser vs alternative mood stabiliser, Outcome 2 mean change in MADRS score by endpoint: Change score (decrease=good).
Figuras y tablas -
Analysis 3.2

Comparison 3 Oxcarbazepine as an adjunctive mood stabiliser vs alternative mood stabiliser, Outcome 2 mean change in MADRS score by endpoint: Change score (decrease=good).

Comparison 3 Oxcarbazepine as an adjunctive mood stabiliser vs alternative mood stabiliser, Outcome 3 mean change in HDRS by end of study: Change score (decrease=good).
Figuras y tablas -
Analysis 3.3

Comparison 3 Oxcarbazepine as an adjunctive mood stabiliser vs alternative mood stabiliser, Outcome 3 mean change in HDRS by end of study: Change score (decrease=good).

Comparison 3 Oxcarbazepine as an adjunctive mood stabiliser vs alternative mood stabiliser, Outcome 4 Mean change in CGI‐S Scores by end of study period: Change score (decrease=good).
Figuras y tablas -
Analysis 3.4

Comparison 3 Oxcarbazepine as an adjunctive mood stabiliser vs alternative mood stabiliser, Outcome 4 Mean change in CGI‐S Scores by end of study period: Change score (decrease=good).

Comparison 3 Oxcarbazepine as an adjunctive mood stabiliser vs alternative mood stabiliser, Outcome 5 mean change in CGI‐I score by end of study: Change score (decrease=good).
Figuras y tablas -
Analysis 3.5

Comparison 3 Oxcarbazepine as an adjunctive mood stabiliser vs alternative mood stabiliser, Outcome 5 mean change in CGI‐I score by end of study: Change score (decrease=good).

Comparison 4 oxcarbazepine versus antipsychotics, Outcome 1 physician global evaluation of tolerability.
Figuras y tablas -
Analysis 4.1

Comparison 4 oxcarbazepine versus antipsychotics, Outcome 1 physician global evaluation of tolerability.

Comparison 4 oxcarbazepine versus antipsychotics, Outcome 2 Physician global evaluation of tolerability, moderate to poor.
Figuras y tablas -
Analysis 4.2

Comparison 4 oxcarbazepine versus antipsychotics, Outcome 2 Physician global evaluation of tolerability, moderate to poor.

Table 1. Description of ICD and DSM codes

Description of condition

ICD codes

DSM codes

Hypomania or mania with or without psychotic symptoms

F30.0 and F31.0‐31.2*

296.40 or 296.41‐4*

Mixed affective disorder, with or without psychotic symptoms

F31.6*

296.61‐4*

Depressive episodes, with or without psychotic symptoms

F31.3‐31.5*

296.21‐4 and 296.31‐4*

Figuras y tablas -
Table 1. Description of ICD and DSM codes
Table 2. description of rating scales

Name of rating scale

Description

Bech and Refaelsen mania rating scale (BRMAS) Bech 1979

This is an 11 item scoring scale: each symptom is measured from 0 to 4, increasing from not present to severe. The items included activity (motor and verbal), flight of thought, voice level, hostility/destructiveness, mood, self esteem, contact, sleep, sexual interest and work.

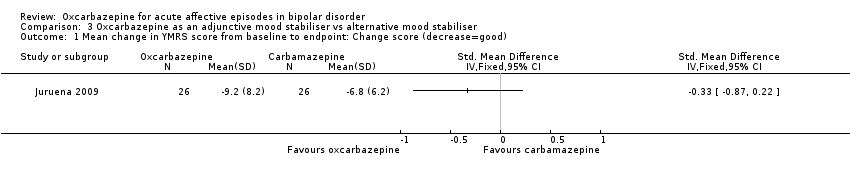
Young Mania Rating Scale (YMRS) Young 1978

This scale has 11 items which are rated after a clinical interview. Irritability, speech rate and amount, content of thought and disruptive behaviour items are given extra weight in the total by being scored from 0‐8, whereas the remaining items are scored from 0‐4. Higher scores indicate more symptoms.

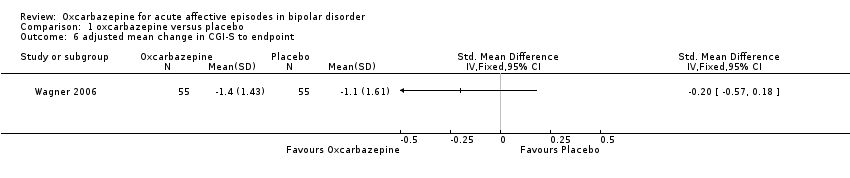
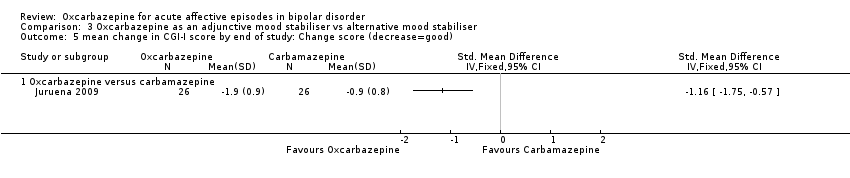
Clinical Global Improvement (CGI) Guy 1976

The scale assesses both severity of illness and clinical improvement by comparing the condition of the subject standardised against others with the same diagnosis. The seven point scoring system is usually employed, with low scores showing decreased severity and overall improvement.

Clinical Global Improvement, Bipolar Version (CGI‐BP) Spearing 1997

This is a modified version of the scale which includes the correction of perceived inconsistencies in scaling, detailed definitions of illness severity and change, the inclusion of time frames and the separation of the assessment of improvement in illness from the assessment of the adverse effects of treatment. Previous phases of illness are also used as comparators for the assessed period. A CGI score of greater than three is often taken to indicate a clinical response.

Child Health Questionnaire (CHQ) Landgraf 1999

The scale is a quality of life questionnaire which has both physical and psychosocial components. It assesses a child's physical, emotional, and social well‐being from the perspective of a parent or guardian {CHQ‐PF50 and PF‐28 (short form)} or, in some instances, the child directly (CHQ‐CF87, for children ten years of age and older). There are 14 domains, with scores aggregated to derive two summary component scores of physical and psychosocial health. Scores can then be transformed to a 0‐100 scale.

Hamilton Depression Rating Scale‐21 (HDRS) Hamilton 1960

The HDRS (also known as the Ham‐D) is a widely used clinician‐administered depression assessment scale. The original version contains 17 items (HDRS17) pertaining to symptoms of depression experienced over the past
week. The HDRS17 has 17 items which can be graded from 0 to 4 based on a semi structured interview. A later 21‐item version (HDRS21) included four items for definition of subtype of depression.

Montgomery‐Asberg Depression Rating Scale (MADRS) Montgomery 1979

This scale is a 10 item depression rating score which has a fixed scaling of seven points (from 0 through 6). Compared to the HAM‐D the MADRS is supposed to capture pure psychiatric symptoms better. The HAM‐D and MADRS have been found to have high level of correlation with each other and hence they are both usually applied together.

Brief Psychiatric Rating Scale (BPRS) Overall 1962

The Brief Psychiatric rating scale (BPRS) assesses the level of 18 symptom constructs of psychosis such as hostility, suspicion, hallucination and grandiosity. It is based on the clinician's interview with the patient and observations of the patient's behavior over the previous 2–3 days.

Children's depression rating scale (CDRS) Poznaski 1984

The Children’s Depression Rating Scale (CDRS) is a 16‐item measure used to determine the severity of depression in children 6‐12 years of age.Items are measured on 3‐, 4‐, 5‐, and 6‐point scales. The CDRS is derived from the Hamilton Rating Scale for Depression (HAM‐D); a score of 15 on the CDRS is equivalent to a score of 0 on the HAM‐D. Assessment information is based on parent, child and schoolteacher interviews.

Figuras y tablas -
Table 2. description of rating scales
Table 3. Side effect profile by body systems

Control Drug

Body System

Side Effects

N of Comparisons

N of Participants

Adverse event rate (%) in oxcarbazepine group

Adverse event rate (%) in comparison group

Versus Placebo

Neuropsychiatric

Dizziness

1

115

39.0

10.7

Somnolence

1

115

20.3

3.6

Diplopia

1

115

18.6

0.0

Fatigue

1

115

16.9

7.1

Dermatological

Rash

1

115

10.2

1.8

Gastrointestinal

Nausea

1

115

30.5

10.7

Psychiatric‐ leading to

hospital admission

exacerbation of bipolar disorder

1

115

5.5

0.0

aggressive outburst

1

115

1.8

0.0

suicide attempt

1

115

1.8

0.0

inappropriate sexual behaviour

1

115

1.8

0.0

Versus Haloperidol

Neuropsychiatric

Muscular stiffness

1

37

0.0

10.0

Apathy

1

37

0.0

5.0

Lack of co‐ordination

1

37

5.8

0.0

Nervousness

1

37

0.0

5.0

Parkinsonian symptoms

1

37

5.8

10.0

Acute dystonia

1

37

0.0

5.0

Extrapyramidal symptoms

1

37

0.0

5.0

Eye cramps

1

37

0.0

5.0

Genito‐urinary

Loss of libido

1

37

0.0

5.0

Endocrine

Lactation

1

37

0.0

5.0

Gastrointestinal

Vomiting

1

37

5.8

0.0

Versus Lithium

Cardiovascular

Hypotension

1

56

6.9

0.0

Gastrointestinal

Dysphagia

1

56

0.0

3.7

Heartburn

1

56

0.0

3.7

Neuropsychiatric

Depression

1

56

3.5

0.0

Vertigo

1

56

3.5

0.0

Parkinsonian symptoms

1

56

3.5

0.0

Sleep disturbance

1

56

3.5

0.0

Oculogyric crisis

1

56

3.5

0.0

Slurred speech

1

56

3.5

0.0

Hypokinesia

1

56

0.0

3.7

Muscular stiffness

1

56

0.0

3.7

Akathisia

1

56

3.5

3.7

Lack of co‐ordination

1

56

0.0

3.7

Somnolence

1

56

3.5

3.7

Tremor

1

56

0.0

3.7

Oral

Sialorrhea

1

56

6.9

3.7

Hypersalivation

1

56

0.0

3.7

Dermatological

Skin rash

1

56

3.5

0.0

Versus Valproate

Neuropsychiatric

Dizzines

1

60

10.0

23.3

Headache

1

60

10.0

20.0

Sedation

1

60

10.0

16.7

Gastrointestinal

Nausea

1

60

16.7

23.3

Vomiting

1

60

13.3

20.0

Increased appetite

1

60

0.0

10.0

Pain abdomen

1

60

0.0

16.7

Dyspepsia

1

60

10.0

10.0

Constipation

1

60

0.0

10.0

Diarrhoea

1

60

0.0

6.7

Oral

Dry mouth

1

60

3.3

6.7

Blood

Thrombocytopenia

1

60

0.0

3.3

Dermatological

Rash

1

60

0.0

3.3

Alopecia

1

60

0.0

3.3

Others

Weight gain

1

60

0.0

13.3

Versus Carbamazepine

Data not extractable

Figuras y tablas -
Table 3. Side effect profile by body systems
Comparison 1. oxcarbazepine versus placebo

Outcome or subgroup title

No. of studies

No. of participants

Statistical method

Effect size

1 clinical response‐ categorical outcome, at least 50% reduction in YMRS Show forest plot

1

Odds Ratio (M‐H, Random, 95% CI)

Totals not selected

2 clinical response ‐ categorical outcome, at least 50% reduction in YMRS, children Show forest plot

1

Odds Ratio (M‐H, Random, 95% CI)

Totals not selected

3 clinical response‐ categorical outcome, at least 50% reduction in YMRS,adolescents Show forest plot

1

Odds Ratio (M‐H, Random, 95% CI)

Totals not selected

4 adjusted mean change in YMRS from baseline to endpoint Show forest plot

1

Std. Mean Difference (IV, Fixed, 95% CI)

Totals not selected

5 adjusted mean change in children's depression rating scale from baseline to endpoint Show forest plot

1

Std. Mean Difference (IV, Fixed, 95% CI)

Totals not selected

6 adjusted mean change in CGI‐S to endpoint Show forest plot

1

Std. Mean Difference (IV, Fixed, 95% CI)

Totals not selected

7 adjusted mean change in CHQ, global health score Show forest plot

1

Std. Mean Difference (IV, Fixed, 95% CI)

Totals not selected

8 adjusted mean change in CHQ; global behaviour score Show forest plot

1

Std. Mean Difference (IV, Fixed, 95% CI)

Totals not selected

9 Total drop out rate from baseline to endpoint (more events:poorer outcome) Show forest plot

1

Odds Ratio (M‐H, Random, 95% CI)

Totals not selected

Figuras y tablas -
Comparison 1. oxcarbazepine versus placebo
Comparison 2. oxcarbazepine versus other mood stabilisers

Outcome or subgroup title

No. of studies

No. of participants

Statistical method

Effect size

1 clinical response‐categorical outcome, at least 50% reduction in YMRS Show forest plot

1

Odds Ratio (M‐H, Random, 95% CI)

Totals not selected

2 mean change in YMRS score from baseline to endpoint: Change score (decrease=good) Show forest plot

2

Std. Mean Difference (IV, Fixed, 95% CI)

Subtotals only

2.1 Oxcarbazepine versus valproate

2

90

Std. Mean Difference (IV, Fixed, 95% CI)

0.18 [‐0.24, 0.59]

3 mean change in CGI‐S scores by end of study: Change score (decrease=good) Show forest plot

1

Std. Mean Difference (IV, Fixed, 95% CI)

Totals not selected

3.1 Oxcarbazepine versus valproate

1

Std. Mean Difference (IV, Fixed, 95% CI)

0.0 [0.0, 0.0]

4 categorical outcome, physician evaluation of tolerability: Good (good to excellent) Show forest plot

1

Odds Ratio (M‐H, Random, 95% CI)

Totals not selected

5 categorical outcome, physician global evaluation of tolerability: Poor (moderate to poor) Show forest plot

1

Odds Ratio (M‐H, Random, 95% CI)

Totals not selected

Figuras y tablas -
Comparison 2. oxcarbazepine versus other mood stabilisers
Comparison 3. Oxcarbazepine as an adjunctive mood stabiliser vs alternative mood stabiliser

Outcome or subgroup title

No. of studies

No. of participants

Statistical method

Effect size

1 Mean change in YMRS score from baseline to endpoint: Change score (decrease=good) Show forest plot

1

Std. Mean Difference (IV, Fixed, 95% CI)

Totals not selected

2 mean change in MADRS score by endpoint: Change score (decrease=good) Show forest plot

1

Std. Mean Difference (IV, Fixed, 95% CI)

Totals not selected

3 mean change in HDRS by end of study: Change score (decrease=good) Show forest plot

1

Std. Mean Difference (IV, Fixed, 95% CI)

Totals not selected

4 Mean change in CGI‐S Scores by end of study period: Change score (decrease=good) Show forest plot

1

Std. Mean Difference (IV, Fixed, 95% CI)

Totals not selected

5 mean change in CGI‐I score by end of study: Change score (decrease=good) Show forest plot

1

Std. Mean Difference (IV, Fixed, 95% CI)

Totals not selected

5.1 Oxcarbazepine versus carbamazepine

1

Std. Mean Difference (IV, Fixed, 95% CI)

0.0 [0.0, 0.0]

Figuras y tablas -
Comparison 3. Oxcarbazepine as an adjunctive mood stabiliser vs alternative mood stabiliser
Comparison 4. oxcarbazepine versus antipsychotics

Outcome or subgroup title

No. of studies

No. of participants

Statistical method

Effect size

1 physician global evaluation of tolerability Show forest plot

1

Odds Ratio (M‐H, Random, 95% CI)

Totals not selected

1.1 physician global evaluation of tolerability, good to excellent

1

Odds Ratio (M‐H, Random, 95% CI)

0.0 [0.0, 0.0]

2 Physician global evaluation of tolerability, moderate to poor Show forest plot

1

Odds Ratio (M‐H, Random, 95% CI)

Totals not selected

Figuras y tablas -
Comparison 4. oxcarbazepine versus antipsychotics