Probióticos para la prevención de la diarrea asociada a los antibióticos en niños
Resumen
Antecedentes
Los antibióticos alteran el equilibrio microbiano, lo que suele provocar diarrea asociada a los antibióticos (DAA). Los probióticos pueden prevenir la DAA al proporcionar una barrera intestinal, la restauración de la microflora intestinal y otros mecanismos de acción potenciales.
Objetivos
Los objetivos primarios fueron evaluar la eficacia y la seguridad de los probióticos (cualquier cepa o dosis especificada) utilizados para la prevención de la DAA en niños.
Métodos de búsqueda
MEDLINE, Embase, CENTRAL, CINAHL y en la Web of Science (desde su inicio hasta el 28 de mayo 2018), junto con registros como ISRCTN y Clinicaltrials.gov. También se realizaron búsquedas en la base de datos de NICE Evidence Services y en las listas de referencias de los artículos pertinentes.
Criterios de selección
Se consideraron para la inclusión los ensayos controlados aleatorizados paralelos en niños (0 a 18 años) que recibieron antibióticos, que compararan los probióticos con placebo, profilaxis alternativa activa, o ningún tratamiento y midieran la incidencia de diarrea secundaria al uso de antibióticos.
Obtención y análisis de los datos
Dos autores de la revisión realizaron la selección de estudios, la extracción de datos y la evaluación del riesgo de sesgo de forma independiente. Los datos dicotómicos (incidencia de DAA, eventos adversos) se combinaron mediante un cociente de riesgos (CR) agrupado o una diferencia de riesgos (DR), y los datos continuos (duración media de la diarrea) como diferencia de medias (DM), junto con el intervalo de confianza del 95% (IC del 95%) correspondiente. Cuando fue apropiado se calculó el número necesario a tratar para un resultado beneficioso adicional (NNTB). Para los estudios que informaron de las características microbianas mediante resultados heterogéneos, los resultados se describen de forma narrativa. La calidad de la evidencia se evaluó mediante los criterios GRADE.
Resultados principales
Se incluyeron 33 estudios (6352 participantes). Los probióticos evaluados incluyeron Bacillus spp., Bifidobacterium spp., Clostridium butyricum, Lactobacilli spp., Lactococcus spp., Leuconostoc cremoris, Saccharomyces spp., o Streptococcus spp., solos o en combinación. Se determinó que el riesgo de sesgo fue alto en 20 estudios y bajo en 13 estudios. Los resultados de los casos completos (los pacientes que no finalizaron los estudios no se incluyeron en el análisis) de 33 ensayos que informaron sobre la incidencia de diarrea muestran un beneficio preciso de los probióticos en comparación con el control activo, el placebo o el control con ningún tratamiento.
Después de cinco días a 12 semanas de seguimiento, la incidencia de DAA en el grupo de probióticos fue del 8% (259/3232) en comparación con el 19% (598/3120) en el grupo de control (CR 0,45; IC del 95%: 0,36 a 0,56; I² = 57%, 6352 participantes; NNTB 9; IC del 95%: 7 a 13; evidencia de certeza moderada). Diecinueve estudios tuvieron pérdidas durante el seguimiento que oscilaron entre el 1% y el 46%. Después de hacer suposiciones para las pérdidas, el beneficio observado todavía fue estadísticamente significativo mediante un análisis de intención de tratar (ITT, por sus siglas en inglés) altamente convincente, en que la incidencia de DAA en el grupo de probióticos fue del 12% (436/3551) en comparación con el 19% (664/3468) en el grupo de control (7019 participantes; CR 0,61; IC del 95%: 0,49 a 0,77; P < 0,00001; I² = 70%). Un análisis de subgrupos de casos disponibles a priori que exploró la heterogeneidad indicó que la dosis alta (≥ 5 mil millones de UFC por día) es más efectiva que la dosis baja de probióticos (< 5 mil millones de UFC por día), valor de p para la interacción = 0,01. Para los estudios de dosis altas, la incidencia de DAA en el grupo de probióticos fue del 8% (162/2029) en comparación con el 23% (462/2009) en el grupo de control (4038 participantes; CR 0,37; IC del 95%: 0,30 a 0,46; p = 0,06; evidencia de certeza moderada). Para los estudios de dosis baja la incidencia de DAA en el grupo de probióticos fue del 8% (97/1155) en comparación con el 13% (133/1059) en el grupo de control (2214 participantes; CR 0,68; IC del 95: 0,46 a 1,01; P = 0,02). Una vez más, las suposiciones para las pérdidas durante el seguimiento utilizando un análisis ITT altamente convincente fueron estadísticamente significativas. Para los estudios de dosis altas, la incidencia de DAA en el grupo de probióticos fue del 13% (278/2218) en comparación con el 23% (503/2207) en el grupo de control (4425 participantes; CR 0,54; IC del 95%: 0,42 a 0,70; P < 0,00001; I² = 68%; evidencia de certeza moderada).
Ninguno de los 24 ensayos (4415 participantes) que informaron sobre los eventos adversos informó de eventos adversos graves atribuibles a los probióticos. Las tasas de eventos fueron bajas. Después de 5 días a 4 semanas de seguimiento, el 4% (86/2229) de los participantes que recibieron probióticos tuvieron un evento adverso en comparación con el 6% (121/2186) de los participantes del grupo de control (DR 0,00; IC del 95%: ‐0,01 a 0,01; p < 0,00001; I² = 75%; evidencia de certeza baja). Los eventos adversos comunes incluyeron erupción, náuseas, gases, flatulencias, distensión abdominal y estreñimiento.
Después de 10 días a 12 semanas de seguimiento, ocho estudios registraron datos sobre el resultado secundario, la duración media de la diarrea, y se observó que los probióticos redujeron la duración de la diarrea en casi un día (DM ‐0,91; IC del 95%: ‐1,38 a ‐0,44; P < 0,00001; evidencia de certeza baja). Un estudio informó sobre las características microbianas y no informó de diferencias en los cambios con el uso concurrente de antibióticos y probióticos.
Conclusiones de los autores
La evidencia general indica un efecto protector moderado de los probióticos para la prevención de la DAA (NNTB 9, IC del 95%: 7 a 13). Al utilizar cinco criterios para evaluar la credibilidad del análisis de subgrupos de la dosis de probióticos, los resultados indican que el efecto del subgrupo basado en la dosis (≥ 5 mil millones de UFC por día) fue creíble. Sobre la base de las dosis altas de probióticos, el NNTB para prevenir un caso de diarrea es 6 (IC del 95%: 5 a 9). La certeza general de la evidencia para la variable de evaluación primaria, la incidencia de DAA, sobre la base de los probióticos en dosis altas, fue moderada debido a problemas menores relacionados con el riesgo de sesgo y la inconsistencia a causa de la diversidad de agentes probióticos utilizados. La evidencia también sugiere que los probióticos pueden reducir de forma moderada la duración de la diarrea, una reducción de casi un día. El beneficio de los probióticos en dosis alta (Lactobacillus rhamnosus o Saccharomyces boulardii) debe confirmarse mediante un ensayo aleatorizado amplio, bien diseñado y multicéntrico. Es prematuro establecer conclusiones sólidas acerca de la eficacia y la seguridad de "otros" agentes probióticos como complemento de los antibióticos en los niños. Las tasas de eventos adversos fueron bajas y ningún evento adverso grave fue atribuible a los probióticos. Aunque no se observaron eventos adversos graves entre los niños hospitalizados y ambulatorios, incluidos los estudios pequeños realizados en la unidad de cuidados intensivos y en la unidad neonatal, los estudios observacionales no incluidos en esta revisión han informado de eventos adversos graves en niños con debilidad o compromiso inmunológico grave y con factores de riesgo subyacentes, como el uso de catéteres venosos centrales y trastornos asociados con la translocación bacteriana/fúngica.
PICO
Resumen en términos sencillos
Probióticos para la prevención de la diarrea asociada a los antibióticos en niños
¿Qué es la diarrea asociada a los antibióticos?
La diarrea asociada con antibióticos (DAA) ocurre cuando los antibióticos perturban el equilibrio natural de las bacterias "buenas" y "malas" en el tracto intestinal y causan una multiplicación de las bacterias perjudiciales más allá de las cifras normales. Los síntomas de la DAA incluyen evacuaciones intestinales acuosas frecuentes y dolor abdominal en forma de calambre.
¿Qué son los probióticos?
Los probióticos se encuentran en los suplementos dietéticos o los yogures y contienen bacterias o levaduras potencialmente beneficiosas. Los probióticos pueden restaurar el equilibrio natural de las bacterias en el tracto intestinal.
¿Qué examinaron los investigadores?
Los investigadores estudiaron si los probióticos previenen la DAA en niños que reciben antibioticoterapia y si los probióticos provocan efectos perjudiciales (efectos secundarios). Los investigadores realizaron búsquedas en la literatura médica de forma extensiva hasta el 28 de mayo 2018.
¿Qué encontraron los investigadores?
Se revisaron 33 estudios y se proporcionó la mejor evidencia disponible. Los estudios realizaron pruebas en 6352 niños (entre 3 días y 17 años de edad) que recibieron probióticos coadministrados con antibióticos para prevenir la DAA. Los participantes recibieron probióticos (Lactobacilli spp., Bifidobacterium spp., Streptococcus spp., o Saccharomyces boulardii solos o en combinación), placebo (pastillas que no incluían probióticos), otros tratamientos para prevenir la DAA (es decir, diosmectita o leche maternizada) o ningún tratamiento. Los estudios se realizaron a corto plazo, y la duración varió de 5 días a 12 semanas. Los análisis demostraron que los probióticos son efectivos para prevenir la DAA. La incidencia de DAA en el grupo de probióticos fue del 8% (259/3232) en comparación con el 19% (598/3120) en el grupo de control, lo cual demuestra una reducción moderada (11% menos sufrirá diarrea). Por cada nueve niños tratados, los probióticos prevendrán un caso de diarrea. Además, la evidencia sugiere que las dosis más altas de probióticos (≥ 5 mil millones de UFC por día) reducen la incidencia de DAA. El 8% (162/2029) del grupo de probióticos en dosis altas tuvo DAA en comparación con el 23% (462/2009) en el grupo de control, lo cual demuestra una reducción moderada a grande (15% menos sufren diarrea). En general, los probióticos presentaron buena tolerabilidad y los efectos secundarios menores (p.ej. erupción cutánea, náuseas, gases, flatulencias, distensión abdominal, estreñimiento) ocurrieron con poca frecuencia. La evidencia indicó que los probióticos son efectivos para lograr una reducción moderada en la duración de la diarrea (casi un día). Entre los diversos probióticos evaluados, Lactobacillus rhamnosus o Saccharomyces boulardii en 5 mil millones a 40 mil millones de unidades formadoras de colonias por día parecen ser los más apropiados para prevenir la DAA en los niños que reciben antibióticos. Es prematuro establecer conclusiones acerca de la eficacia y la seguridad de «otros» agentes probióticos para la prevención de la DAA. Aunque no se observaron efectos secundarios graves relacionados con los probióticos en los niños mayormente sanos que participaron en los estudios, se informó de efectos secundarios graves en estudios observacionales no incluidos en esta revisión, como niños con debilidad o compromiso inmunológico grave y con factores de riesgo subyacentes, incluido el uso de un catéter venoso central (un tubo flexible utilizado para administrar medicamentos) y trastornos asociados con la translocación bacteriana o fúngica (el paso de las bacterias desde el intestino a otras áreas del cuerpo).
Authors' conclusions
Summary of findings
| Probiotics as an adjunct to antibiotics for the prevention of antibiotic‐associated diarrhea in children | |||||||
| Patient or population: Children receiving antibiotic treatment between 4 and 28 days duration for a variety of infections Settings: Inpatient and outpatient Intervention: Probiotics treatment with either Bacillus spp., Bifidobacterium spp., Clostridium butyricum spp., Lactobacilli spp., Lactococcus spp., Leuconostoc cremoris spp., Saccharomyces spp., or Streptococcus spp., alone or in combination Comparison: Control (placebo or non‐active control) | |||||||
| Outcomes | Anticipated absolute effects * (95% CI) | Relative effect | No of Participants | Quality of the evidence | Comments | ||
| Baseline risk | Corresponding risk | ||||||
| Risk in Control | Risk with Probiotics | Risk Difference | |||||
| Incidence of AAD | 190 per 10001 | 86 per 1000 | 104 fewer AAD cases per 1000 | RR 0.45 (0.36 to 0.56) | 6352 | ⊕⊕⊕⊝ | |
| Incidence of AAD: Probiotic dose (≥5 billion CFUs of probiotics/day) Follow‐up: 5 days to 12 weeks | 190 per 10001 | 70 per 1000 | 120 fewer AAD cases per 1000 | RR 0.37 (0.30 to 0.46) | 4038 | ⊕⊕⊕⊝ | Based on our a priori subgroup analyses, high‐dose probiotics (≥5 billion CFUs/day) are most effective Low dose probiotics (<5 billion CFUs of probiotics per day) were not as effective as high dose probiotics (RR 0.68, 95% CI 0.46 to 1.01; low certainty evidence) |
| Adverse events Follow‐up: 5 days to 4 weeks | 55 per 10007 | 39 per 1000 | 16 fewer adverse events per 1000 | RD ‐0.00 (‐0.01 to 0.01) | 4415 | ⊕⊕⊝⊝ | |
| Duration of diarrhea (days) Follow‐up: 10 days to 12 weeks | MD 0.91 fewer | 1263 | ⊕⊕⊝⊝ | ||||
| Microbiome characteristics Follow‐up: one day to one month after cessation of antibiotic therapy | 40 | ⊕⊝⊝⊝ | |||||
| *The basis for the baseline risk (e.g. the median control group risk across studies) is provided in footnotes. The corresponding risk (and its 95% confidence interval) is based on the assumed risk in the comparison group and the relative effect of the intervention (and its 95% CI). | |||||||
| GRADE Working Group grades of evidence | |||||||
| 1 Baseline/control group risk estimates come from pooled estimates of control group among 33 included studies. | |||||||
Background
Description of the condition
More than 400 species of bacteria inhabit the human gut, and a balance of these micro‐organisms is important for normal gastrointestinal function (Madsen 2001). Antibiotic treatment may disturb the colonization resistance of gastrointestinal flora, resulting in a range of symptoms, most notably, diarrhea. In particular, antibiotics such as aminopenicillins, cephalosporins and clindamycin that act on anaerobes are most commonly associated with diarrhea (McFarland 2008; Owens 2008; Wistrom 2001). In addition to frequent watery bowel movements, urgency and crampy abdominal pain, antibiotic‐associated diarrhea (AAD) is associated with altered intestinal microflora, mucosal integrity and vitamin/mineral metabolism (Saavedra 1999). If severe, AAD may lead to electrolyte disturbances, volume depletion, pseudomembranous colitis, toxic megacolon and rarely death (Arvola 1999; Berrington 2004). Reports in the general population indicate that the incidence of AAD ranges from 5 to 62%, occurring at any point from the initiation of therapy to two months after the end of treatment (LaRosa 2003; McFarland 1998; McFarland 2008; Wistrom 2001). The incidence of diarrhea in children receiving broad spectrum antibiotics has been reported in the range of 11 to 40% (Elstner 1983; Turck 2003). The overgrowth of many enteropathogens has been associated with antibiotic‐induced diarrhea. Clostridium difficile (C. difficile) overgrowth is the bacterial agent most associated with AAD (Bartlett 1978; McFarland 1998; McFarland 2008). C. difficile diarrhea is associated with the most serious adverse events, and occurs most often in older, immunocompromised, hospitalized adults, but also occurs in children (Gogate 2005).
The definition of AAD varies across trials. Although the World Health Organization (WHO) defines diarrhea as three or more loose or liquid stools per 24 hours, the definition in pediatric trials ranges from one to three abnormally loose stools per 24 to 48 hours (Johnston 2010). Additionally, stool frequency is more difficult to quantify in diaper‐aged children with diarrhea and may vary substantially between infants and older children.
Description of the intervention
Probiotics refer to so‐called "friendly" non‐pathogenic bacterial or yeast microbiota intended to benefit the host via altering the microflora by implantation or colonization (Schrezenmeir 2001). Probiotics have been administered both prophylactically and therapeutically in an attempt to modify the mucosal, epithelial, intestinal and systemic immune activity in ways that may benefit human health. Probiotics are reported to improve microbial balance in the intestinal tract and display both antibacterial and immune regulatory effects in humans (Gibson 1998; Goldin 1998). Probiotics commonly administered in randomized controlled trials of AAD are: Lactobacillus acidophilus, Lactobacillus bulgaris, Lactobacillus casei, Lactobacillus rhamnosus, Bifidobacteria bifidum, Bifidobacteria longum, Streptococcus thermophilus, Saccharomyces boulardii and Clostridium butyicum.
How the intervention might work
The rationale behind probiotic administration is based on re‐inoculation and normalization of unbalanced indigenous microflora using specific probiotic strains.
Why it is important to do this review
Previously we demonstrated the efficacy and safety of probiotics used together with antibiotics for the prevention of AAD among 23 studies including 3938 otherwise healthy children (Goldenberg 2015). This review seeks to update our 2015 review, and to further explore the study setting (e.g. inpatient, outpatient) and intervention characteristics (e.g. dose, strain(s)) that may be most effective and safe, particularly given recent concerns about inadequate reporting on the safety of probiotics in randomized trials (Bafeta 2018; Suez 2018).
SAFETY OF PROBIOTICS
Based on the bulk of the literature, the safety of diverse probiotic interventions does not appear to be a concern in healthy individuals (Borriello 2003; Hammerman 2006; Hempel 2011; Whelan 2010). Infections (e.g. bacteremia, endocarditis, septicemia, pneumonia, deep abdominal abscesses) resulting from probiotic use have been reported in neonates, and in severely debilitated and immuno‐compromised individuals (Hata 1988; Land 2005; Mackay 1999; McFarland 1998; Piarroux 1999; Rautio 1999; Salminen 1998; Salminen 2004; Saxelin 1996; Sussman 1986). There is still debate on the safety of probiotics in these patients. Nevertheless, prospective studies have demonstrated the safety of probiotics in immuno‐compromised adults and children with HIV and preterm neonates, with no infections secondary to probiotics reported (Bin‐Nun 2005; Cunningham‐Rundles 2000; Lin 2005; Salminen 2004).
Five systematic reviews have addressed the safety of Saccharomyces boulardii (S. boulardii) and other probiotics (Didary 2014; Hassan 2018; Hempel 2011; McFarland 2010; Whelan 2010). In a review of the safety of various probiotic strains and doses reported in controlled clinical trials, as well as cases series and case reports from 1984 to 2013, Didary 2014 reported two bacteraemia cases associated with Lactobacillus GG and three fungemia cases in critically ill patients in the intensive care unit who had received S. boulardii. Hassan 2018 provided safety data for a total 2242 adults and children (25 studies) with cancer. An estimated 237 adverse events (AEs) occurred among those consuming probiotics and 314 AEs in those not consuming probiotics. Five case reports identified probiotic‐related bacteraemia, fungaemia or positive blood cultures. However, based on these reviews it cannot be concluded with certainty that the observed infections were directly attributable to the probiotic consumed. A systematic review of randomized controlled trials (RCTs), reports on a wide diversity of adult patients randomized to S. boulardii as part of a clinical trial (traveler’s diarrhea, n = 1596; AAD, n = 958; acute diarrhea, n = 156; enteral tube feeding, n = 103; IBD, n = 66; IBS, n = 16, HIV‐related diarrhea, n = 18 and giardia infections, n = 50). These studies provide safety data for a total of 2963 adult patients. The only adverse reactions associated with S. boulardii were thirst (n = 5 patients) and constipation (n = 8 patients) in a trial of patients with C. difficile infections (McFarland 1998). No case of S. boulardii fungemia has been reported in these diverse patient populations (McFarland 2010).
A larger systematic review of case reports, randomized and non‐randomized trials of probiotic safety in patients receiving nutritional support, such as enteral nutrition or parenteral nutrition, included 53 trials involving 4131 patients receiving probiotics. Most trials demonstrated either no effect or a positive effect on outcomes related to safety (e.g. infections, mortality). Three trials reported increased complications, which were largely noninfectious in nature and specific to patients with pancreatitis or undergoing transplant (Whelan 2010). The systematic review also reported 20 case reports of adverse events in 32 patients, 27 of which were infections due to S. boulardii (strain unspecified) or Lactobacillus rhamnosus GG (n = 5). Of the 32 patients having been administered S. boulardii with subsequent infections (i.e. fungemia, bacteremia), 11 of these were in children (either preterm neonates, severely debilitated or immuno‐compromised children with underlying risk factors including central venous catheter use and disorders associated with bacterial or fungal translocation). Each of the children recovered after S. boulardii orLactobacillus GG was discontinued, after removal of the central venous catheter (n = 7) and after an antibiotic or anti‐fungal was administered (n = 11). The authors of the study reported that these case reports likely reflect the wide use of S boulardii and Lactobacillus GG in clinical settings, rather than increased virulence (Whelan 2010). The largest and most comprehensive systematic review to date, assessed the safety of probiotics in human participants (with no restrictions on participant type) and included both randomized and non‐randomized studies (387 studies including 24,615 total participants). Based on short‐term probiotic use (compared to control group participants) the results of 208 RCTs showed no difference in the overall number of adverse events (RR 1.00; 95% CI: 0.93, 1.07), including serious adverse events (RR 1.06; 95% CI: 0.97, 1.16; 66 RCTs primarily based on Lactobacillus species) (Hempel 2011).
Objectives
PRIMARY
1) To systematically assess whether probiotics (any specified strain or dose) co‐administered with antibiotics (any agent) reduce the incidence of antibiotic‐associated diarrhea in children.
2) To systematically assess adverse events of probiotics when co‐administered with antibiotics in children.
SECONDARY
1) To systematically assess which probiotic strain(s) and dose(s) yield the most beneficial results in reducing the incidence of diarrhea.
2) To systematically assess whether probiotics (any specified strain or dose) co‐administered with antibiotics (any agent) reduce the duration of diarrhea.
3) To systematically assess whether probiotics (any specified strain or dose) co‐administered with antibiotics (any agent) impact microbiome characteristics.
Methods
Criteria for considering studies for this review
Types of studies
All randomized controlled trials irrespective of language or publication status, in which a specified probiotic agent has been compared to placebo, active, or no treatment control were considered for inclusion.
Types of participants
Children (0 to 18 years of age), male or female of any ethnic group being administered antibiotic therapy for any reason were considered for inclusion.
Types of interventions
Intervention group: specific, identified probiotic in any form (e.g. capsule, sachet, yogurt). Trials investigating non‐specific probiotic or yogurt agents (e.g. products that do not label the probiotic strain and dose) were not considered. Trials combining probiotics with prebiotics were included if the prebiotic dose was less than 2.5 grams, as this was judged to be of limited impact to alter the gut milieu (Davis 2010; Gibson 2004; Roberfroid 1998). Control group: placebo, active, or no treatment control. All studies comparing probiotics to conventional care (i.e. diosmectite, loperamide) or probiotics plus conventional care versus conventional care plus placebo or no treatment were considered for the review.
Types of outcome measures
Primary outcomes
The primary outcomes included:
1. Incidence of diarrhea using the primary investigators' definition (i.e. frequency, consistency of bowel movements); and
2. Number and type of adverse events (e.g. bacteremia, meningitis).
Secondary outcomes
The secondary outcomes included:
1. Mean duration of diarrhea; and
2. Microbiome characteristics.
Search methods for identification of studies
Electronic searches
We searched the following databases from inception to 28 May 2018: The Cochrane Central Register of Controlled Trials (CENTRAL) on the Cochrane Library, MEDLINE, Embase, CINAHL, and Web of Science. There were no limitations on publication status or language. We also searched NICE Evidence Services (Formerly NHS Evidence) as well as ongoing trials through ClinicalTrials.gov and the ISRCTN (International Standard Randomized Controlled Trial Number Register). The search strategies are reported in Appendix 1.
Searching other resources
We searched the bibliographies of randomised controlled trials and review articles for additional studies not identified by the electronic searches.
Data collection and analysis
Selection of studies
Two authors (QG, CH) independently screened the search results using titles of papers, and when available, abstracts. The full‐text of the selected articles was retrieved and independently assessed for inclusion by QG and CH according to pre‐specified selection criteria. Disagreement was resolved by discussion and consensus. In the event of disagreement, a third author (BJ) was consulted.
Data extraction and management
Using a standardized data extraction form two authors (QG, CH) independently extracted the following data: author, year of publication, language, study setting, funding source, definition and diagnostic criteria for diarrhea, inclusion and exclusion criteria for participants, patient characteristics (age, gender, diagnosis, socioeconomic status), number of patients allocated to each group, presence/absence of intention to treat analysis (whether patients for whom data were available were analyzed as randomized), participants lost to follow‐up (LTFU), if so, reasons for LTFU described and information about methods of imputation, measures of compliance, specified antibiotic, specified probiotic, duration, dosage and schedule of antibiotic, duration, dosage and schedule of probiotic, and outcome measures (incidence of diarrhea, number of adverse events, mean duration of diarrhea, and microbiome characteristics. For articles published in abstract form only, we obtained further information by contacting corresponding authors.
Assessment of risk of bias in included studies
Quality components for each included RCT were assessed for selection, detection, performance, reporting and loss to follow‐up bias. Each of the included studies was independently evaluated by two authors (QG, CH) using the risk of bias instrument to assess each of the following domains: sequence generation, allocation concealment, blinding, incomplete outcome data, selective outcome reporting, and other sources of bias (Hartling 2009). Disagreement was resolved by discussion or a third arbitrator. We assumed that studies that had three or more domains at high or unclear risk of bias were at high risk of bias overall.
Measures of treatment effect
Using a random‐effects model, dichotomous data are presented as risk ratios (RR), and continuous data as mean difference (MD), along with corresponding 95% confidence interval (95% CI). Using control event risks from the included trials, the number needed to treat for an additional beneficial outcome (NNTB) or the number needed to treat for an additional harmful outcome (NNTH) was calculated for statistically significant dichotomous outcomes. Adverse events were summarized using risk difference (RD) since these events were rare.
Unit of analysis issues
If a trial had multiple intervention arms (such as two different strains compared to placebo), we combined the two probiotic arms to make a single pair wise comparison to avoid unit of analysis errors.
Dealing with missing data
When authors neglected to report PICO related items of interest, we contacted them via email. To assess the potential influence of missing outcome responses (e.g. children lost to follow‐up), sensitivity analyses were applied for the primary outcomes, incidence of diarrhea and adverse events. Although many approaches exist for evaluating the sensitivity of results for missing outcome data (Akl 2009; Hollis 1999), we elected to make assumptions about the missing data which were extreme but still plausible (i.e. 60% of children loss to follow‐up in probiotic group and 20% loss to follow‐up in the control group had diarrhea). See sensitivity analysis section below.
Assessment of heterogeneity
Heterogeneity was investigated using the I² statistic (Higgins 2003). Meta‐regression or the Chi² test for heterogeneity ‐ depending on the number of trials included ‐ were used to address a priori hypotheses explaining heterogeneity. To explore possible explanations for heterogeneity, a priori subgroup analyses were explored including: a) inpatient versus outpatient, b) diagnosis, c) probiotic species or strain(s) (when two or more trials administered the same strains), d) single strain versus multi‐strain probiotics, e) dosage of probiotic (≥5 billion colony forming units of live bacteria/yeast, <5 billion colony forming units of live bacteria/yeast), f) definition of diarrhea, g) diagnostic criteria for diarrhea (moderate diarrhea was assumed to be ≥ 3 watery/liquid stools per 24 hrs, whereas mild diarrhea was deemed to be 1 to 2 watery/liquid stools per 24 hrs), h) industry sponsorship, and i) quality criterion (i.e. risk of bias). We also explored heterogeneity with a post hoc subgroup based on age (0‐2 years [≤24 months] versus more than 2 years of age or older [>24 months]).
Assessment of reporting biases
To evaluate the potential for publication bias, a funnel plot, was applied to the main efficacy outcome, incidence of diarrhea. If publication bias was apparent, adjustment of the pooled estimates was considered using the trim and fill method (Duval 2001).
Data synthesis
We conducted a meta‐analysis as described in the measures of treatment effect and assessments of heterogeneity sections described in detail above.
We employed the GRADE system for rating overall certainty of evidence for each of the outcomes. In particular, randomized trials begin as high quality evidence, but may be rated down by one or more of five categories of limitations: (1) risk of bias, (2) consistency, (3) directness, (4) imprecision, and (5) reporting bias. The quality of evidence for each main outcome can be determined after considering each of these elements, and categorized as either high (we are very confident that the true effect lies close to that of the estimate of the effect); moderate (we are moderately confident in the effect estimate: the true effect is likely to be close to the estimate of the effect, but there is a possibility that it is substantially different); low (our confidence in the effect estimate is limited: the true effect may be substantially different from the estimate of the effect); very low (we have very little confidence in the effect estimate: the true effect is likely to be substantially different from the estimate of effect) (Guyatt 2008).
Subgroup analysis and investigation of heterogeneity
We investigated subgroups of interest as described in the 'assessment of heterogeneity' section, detailed above.
Sensitivity analysis
We conducted sensitivity analyses using a fixed‐effect model as compared to random‐effects, and we assessed the potential influence of missing participant outcome data as compared to a complete case analysis, with the latter described in 'dealing with missing data' section above.
Results
Description of studies
Results of the search
A previous literature search conducted in August 2006 identified 10 relevant studies for inclusion (7 English, 2 Italian, 1 French) and is described in detail elsewhere (Johnston 2007). For this review update, we searched five primary electronic databases from inception to 28 May 2018. We identified a total of 3159 studies (Medline 939, EMBASE 1282, CENTRAL 512, CINAHL 14, Web of Science 412). Additionally, a grey literature search of the NICE Evidence Services database, ISRCTN and ClinicalTrials.gov registries, as well as bibliographic review of eligible randomized trials and meta‐analyses identified an additional 14 relevant studies (See Figure 1).

Study flow diagram.
Of all of these studies, 1036 were identified as duplicates, leaving 2137 abstracts and titles identified as original publications. Independent review of these titles and abstracts identified 87 potentially relevant studies for full‐text review. Three authors independently assessed these studies and identified 33 trials that met the inclusion criteria, eleven of which were new since the previous version of this review (Goldenberg 2015). Five ongoing studies were also identified. Excluded studies are described below.
Included studies
Design
All included studies were prospective, randomized, controlled trials with placebo, active or no treatment control arms.
Patient population
For the purposes of this systematic review LTFU can be understood as incomplete ascertainment of the primary outcome for some participants in an RCT. Patients for whom data were not available for the primary outcome were classified as LTFU. After accounting for LTFU the 33 eligible studies included a total of 6352 patients (3232 treatment, 3120 controls). Patients in the trials were treated with antibiotics for upper and lower respiratory tract, or ear infections (Arvola 1999; Kotowska 2005; LaRosa 2003; Merenstein 2009; Peng 2014; Zheng 2012), Helicobacter pylori infection (Kodadad 2013; Saneeyan 2011; Szajewska 2009; Sykora 2005; Zhang 2015; Zhao 2014), mixed infections (Destura unpublished; Fox 2015; Georgieva 2015; Jindal 2017; Kolodziej 2018; Olek 2017; Ruszczynski 2008; Shan 2013; Szymanski 2008; Tankanow 1990; Vanderhoof 1999; Wan 2017; Zakordonets 2016), impetigo (Dharani 2017), hypospadias repair (Esposito 2017) and meningitis or septicemia (Jirapinyo 2002). In four studies the type of infection that necessitated antibiotic therapy was not specified (Benhamou 1999; Conway 2007; Correa 2005; Erdeve 2004). The health care setting was reported in 29 studies and consisted of: private primary care practices (Benhamou 1999; Conway 2007; Merenstein 2009; Olek 2017; Tankanow 1990; Vanderhoof 1999), hospitalized inpatients (Correa 2005; Esposito 2017; Georgieva 2015; Jirapinyo 2002; King 2010; Peng 2014; Szajewska 2009; Shan 2013; Wan 2017; Zakordonets 2016; Zheng 2012), an outpatient university teaching hospital (Arvola 1999; Dharani 2017; Jindal 2017; Kotowska 2005; Saneeyan 2011), and both inpatient and outpatient hospital populations (Destura unpublished; Kolodziej 2018; Zhao 2014). Three studies recruited from a hospital but it was unclear if the participants were inpatient or outpatient (Kodadad 2013; Sykora 2005; Zhang 2015). In addition to inpatient and outpatient hospital populations, Ruszczynski 2008 also enrolled from a private practice, and Szymanski 2008 also enrolled from outpatient clinics. King 2010 was the only trial which was conducted among hospitalized patients in the Intensive Care Unit.
Children enrolled were from families of diverse socioeconomic status, and included 17 countries: Poland (Kolodziej 2018; Kotowska 2005; Olek 2017; Ruszczynski 2008; Szymanski 2008; Szajewska 2009), the United States of America (King 2010; Merenstein 2009; Tankanow 1990; Vanderhoof 1999), China (Peng 2014; Shan 2013; Wan 2017; Zhang 2015; Zhao 2014; Zheng 2012), Iran (Kodadad 2013; Saneeyan 2011), Italy (Esposito 2017; LaRosa 2003), India (Dharani 2017; Jindal 2017), Finland (Arvola 1999), France (Benhamou 1999), England (Conway 2007), Australia (Fox 2015), Brazil (Correa 2005), the Philippines (Destura unpublished), Turkey (Erdeve 2004), Bulgaria (Georgieva 2015), Thailand (Jirapinyo 2002), Ukraine (Zakordonets 2016), and the Czech Republic (Sykora 2005). Children ranged from 3 days to 18 years of age. Twenty‐six studies provided information regarding the participants' mean age: 4.5 years (Arvola 1999), 2.4 years (Benhamou 1999), 1.8 years (Correa 2005), treatment 4.1 years and control 4 years (Destura unpublished), treatment 6.8 years and control 6.3 years (Fox 2015), 8.9 years (Georgieva 2015), 9.1 years (Kodadad 2013), 1.3 years treatment and 1.2 years control (Esposito 2017), 8.5 years treatment and 8.6 years control (Zhang 2015), 11.1 days treatment and 10.9 days control (Peng 2014), 7 years treatment and 9 years control (Zhao 2014), 1.1 years (Wan 2017), 0.96 years treatment and 4.7 years control (King 2010), 5.1 years treatment and 5.2 years control (Olek 2017), 2.1 years treatment and 2.1 years control (Kolodziej 2018), 4.8 years (Kotowska 2005), 6.6 years (LaRosa 2003), 2.9 years treatment and 3.2 years control (Merenstein 2009), treatment 4.6 years and control 4.5 years (Ruszczynski 2008), treatment 8.2 years and control 9.5 years (Saneeyan 2011), 2 years (Shan 2013), treatment 12.6 years and control 12.9 years (Sykora 2005), 12.3 years treatment and 11.9 years control (Szajewska 2009), 2.5 years (Tankanow 1990), 4 years (Vanderhoof 1999), and 1.2 years (Zheng 2012). Three studies provided only the age range of enrolled participants: 3 to 14 years (Zakordonets 2016), 1 to 15 years (Dharani 2017), 6 months to 12 years (Jindal 2017), and 1 month to 3 years (Jirapinyo 2002). One study provided median age with a range: 7 years (range 1 to 15) (Szymanski 2008). Twenty‐six studies included both males and females (2395 males and 1943 females), one study only included males (Esposito 2017) and seven studies did not state sufficient information regarding sex (Arvola 1999; Benhamou 1999; Conway 2007; Erdeve 2004; Jindal 2017; Jirapinyo 2002; Zhang 2015).
Interventions
Overall the trials provided between 3 and 30 days of antibiotic therapy. Most trials provided oral antibiotics.Two trials provided intravenous antibiotics to all patients (King 2010; Wan 2017). Three trials administered intravenous antibiotics to some patients (e.g. cefuroxime): 60/246 (24.3%) (Kotowska 2005); 87/240 (36.3%) (Ruszczynski 2008); 6/78 (7.7%) (Szymanski 2008). Ruszczynski 2008 also provided intravenous (IV) antibiotics followed by oral antibiotics (17/240; 7.1%) and intramuscular (IM) antibiotics (2/240; 0.8%). In five trials it was unclear what antibiotic or route was used (Conway 2007; Destura unpublished; Georgieva 2015; Merenstein 2009; Peng 2014). Six of 33 trials provided triple antibiotic therapy for H. Pylori and also followed patients for AAD (Kodadad 2013; Saneeyan 2011; Sykora 2005; Szajewska 2009; Zhang 2015; Zhao 2014).
One study provided oral amoxicillin alone (Tankanow 1990), using a standard pediatric dosage range (20 to 50 mg/kg/day), whereas the remaining trials provided a mixture of oral antibiotic agents including: bactericidal cephalosporins (e.g., cefotaxime, cefprozil), bacteriostatic macrolides (e.g., clarithromycin, erythromycin), and the bactericidal beta‐lactams/penicillins. In particular, nine studies described the antibiotic classes administered. Four studies administered a host of cephalosporins (n = 341) and beta‐lactams/penicillins (n = 931) (Benhamou 1999; Correa 2005; Destura unpublished; Kotowska 2005), one study provided cephalosporins (n = 49), beta‐lactams/penicillins in the form of amoxicillin‐clavulanate (n = 36) and macrolides in the form of erythromycin (n = 34) (LaRosa 2003), one study provided beta‐lactams (n = 64), macrolides (n = 5), and tetracyclines (n = 1) (Fox 2015), and one study provided beta‐lactams/penicillins in the form of sulbactam‐ampicillin (n = 234) and macrolides in the form of azithromycin (n = 232) (Erdeve 2004). Kodadad 2013 provided all participants (n = 66) with amoxicillin and furazolidone. Saneeyan 2011, Sykora 2005, Szajewska 2009, and Zhao 2014 provided all participants (n = 680) with amoxicillin and clarithromycin. Zhang 2015 provided participants with amoxicillin and clarithromycin or metronidazole if patients were allergic to penicillin. Dharani 2017 provided all participants (n = 100) with azithromycin, using a dose with 10 mg/kg/day, for 5 days. Esposito 2017 provided participants (84/90, 93%) with amoxicillin in combination with clavulanate, which the first therapeutic dose (50 mg/ kg) was given 30 min before surgery and a prophylactic dosage (20 mg/kg/day) was given after surgery. Szymanski 2008 provided cephalosporins (n = 20); beta‐lactams/penicillins in the forms of penicillin, amoxicillin, or amoxicillin+clavulanate (n = 39); macrolides (n = 18); and aminoglycosides (n = 1). Zakordonets 2016 provided all participants with Ceftriaxone (n = 40). Ruszczynski 2008 provided cephalosporins (n = 89); beta‐lactams/penicillins in the forms of penicillin, ampicillin, amoxicillin, or amoxicillin+clavulanate (n = 134); macrolides (n = 15); and clindamycin (n = 2). Shan 2013 provided cephalosporins (n = 173), beta lactams (n = 88), and macrolides (n = 46). Jindal 2017 provided co‐amoxyclav (n = 120, 25‐45 mg/kg/day), cefpodoxime (n = 120, 10 mg/kg/day), cefdinir (n = 120, 14 mg/kg/day), cefixime (n = 120, 8 mg/kg/day), and cephalaxin (n = 120, 25 to 50 mg/kg/day). Zheng 2012 provided beta‐lactams (n = 33), cephalosporins (n = 172), and macrolides (n = 22). Olek 2017 provided penicillins (n = 186), cephalosporins (n = 118), sulfometoksazole and trimethoprim (n = 32), and macrolides (n = 101). Kolodziej 2018 provided aminopenicillins (n = 63), cephalosporins 2nd generation (n = 149), cephalosporins third generation (n = 28), macrolides (n = 9), and lincosamides (n = 1).
Trials included treatment with either Bacillus spp., Bifidobacterium spp., Clostridium butyricum, Lactobacilli spp., Lactococcus spp., Leuconostoc cremoris, Saccharomyces spp., orStreptococcus spp. The species or strain(s) and daily dosage of the probiotic interventions included: Lactobacillus GG, 1 billion colony forming units (CFUs) bacteria/day (Szajewska 2009); Lactobacillus GG, 20 to 40 billion CFUs bacteria per day (Arvola 1999); Lactobacillus GG, 3 billion CFUs per day (King 2010);Lactobacillus plantarum DSM 9843, 10 billion CFUs per day (Olek 2017); Lactobacillus reuteri DSM 19738, 0.2 billion CFUs per day (Kolodziej 2018); Lactobacillus rhamnosus GG ATCC53103, 5 billion CFUs per day (Esposito 2017); Lactobacillus GG and inulin (a prebiotic), 10 to 20 billion CFUs bacteria/day equalling 100 mg and 225 mg of the prebiotic inulin/day (the only study to use a weight‐based approach) (Vanderhoof 1999); Saccharomyces boulardii, 4.5 billion yeast/day (Benhamou 1999); Lactobacillus acidophilus and Bifidobacterium bifidus; Bifidobacterium lactis and Streptococcus thermophilus, 825 million CFUs bacteria/day (Correa 2005); Bacillus clausii, 4 billion CFUs bacteria/day (Destura unpublished);Saccharomyces boulardii, 5 billion CFUs yeast/day (Erdeve 2004; Peng 2014; Wan 2017); Lactobacillus acidophilus and Bifidobacterium infantis, dose not reported (Jirapinyo 2002); Saccharomyces boulardii, 10 billion CFUs of yeast/day (Jindal 2017; Kotowska 2005; Shan 2013; Zhang 2015; Zhao 2014); Lactobacillus sporogenes and fructo‐oligosaccharide (a prebiotic); 5.5 billion CFUs bacteria/day and 250 mg prebiotic/day (LaRosa 2003); Lactococcus lactis, L. plantarum, L. rhamnosus, L. casei, L. lactis subspecies diacetylactis, Leuconostoc cremoris, Bifidobacterium longum, B. breve, Lactobacillus acidophilus, and Saccharomyces florentinus, at least half of a 150 ml drink containing 7 to 10 billion CFUs bacteria and yeast/day (Merenstein 2009); Lactobacilluss rhamnosus, 40 billion CFUs bacteria/day (Ruszczynski 2008);Bifidobacterium longum PL03,Lactobacillus rhamnosus KL53A, and Lactobacillus plantarum PL02, 200 million CFUs bacteria/day (Szymanski 2008); Lactobacillus acidophilus and Lactobacillus bulgaricus, 2 billion CFUs bacteria/day (Tankanow 1990); Streptococcus thermophillus, Lactobacillus acidophilus, and Bifidobacteria anamalis subsp. lactus or Streptococcus thermophillus and Lactobacillus delbrueckii subsp. bulgaris, 1 billion CFUs bacteria/day (Conway 2007); Lactobacillus GG, 5.2 billion CFUs/day; Bifidobacterium bifidus, 5.9 billion CFUs/day, Lactobacillus acidophilus 8.3 billion CFUs/day (Fox 2015); Lactobacillus reuteri 100 million CFUs/day (Georgieva 2015); Lactobacillus acidophilus, Lactobacillus rhamnosus, Lactobacillus bulgaricus, Lactobacillus casei, Streptococcus thermophilus, Bifidobacterium infantis and Bifidobacterium breve for a total of 1 billion CFUs/day (Kodadad 2013); Lactobacilli and Lactococci, Bifidobacterium, propionate‐oxidising bacteria and acetic acid bacteria, 2 trillion CFUs/day (Zakordonets 2016); 50 million spores of Lactobacillus sporegen and 30 million spores of Streptococcus faecalis, 2 million spores of Clostridium butyricum and 1 million spores of Bacillus mesentericus , 166 million spores per day (Dharani 2017); Lactobasillus casei, Lactobacillus acidophilus, Lactobasillus reuteri, Lactobasillus bulgaricus, Streptococcus, Bifidobacterium bifidum, Bifidobacterium infantis for a total of 1 billion CFUs/day (Saneeyan 2011); Lactobacillus casei 10 billion CFUs/day (Sykora 2005); and finally Clostridium Butyricum andBifidobacterium at 2.2 billion CFUs/day (Zheng 2012).
Comparison
In 15 studies, the probiotic(s) intervention was compared to a placebo control group, two trials compared probiotics to conventional care including formula and diosmectite (Correa 2005; Benhamou 1999), eleven trials compared probiotics to no treatment (Destura unpublished; Dharani 2017; Erdeve 2004; Jindal 2017; Peng 2014; Shan 2013; Wan 2017; Zakordonets 2016; Zhang 2015; Zhao 2014; Zheng 2012), one trial compared a live probiotic drink to a heat‐killed probiotics drink (Merenstein 2009), and one trial used three arms: 'bioyogurt,' commercial yogurt, and no yogurt (Conway 2007). In order to avoid unit of analysis errors, for the purposes of this review we grouped the two yogurt arms of the latter trial together. In one placebo‐controlled trial, contact with authors revealed that the placebo contained an inert amount of inulin (325 mg) ‐ a prebiotic used as capsule filler (Vanderhoof 1999). Five additional placebo‐controlled trials provided information on the choice of comparison stating that the placebos contained maltodextrine, non‐fat milk and saccharose, saccharum lactis,and potato starch respectively (Esposito 2017; Kotowska 2005; Olek 2017; Ruszczynski 2008; Szajewska 2009). Three trials provided information about the placebo containing sugar, lactose, and glucose respectively (Esposito 2017; Jirapinyo 2002; Tankanow 1990). Kolodziej 2018 provided the information on the placebo which consisted of 'pharmaceutical grade medium chain triglycerides and sunflower oil together with pharmaceutical grade silicon dioxide.' King 2010 did not specify details of the placebo. For the two trials involving active controls with conventional care, one trial administered diosmectite (an antidiarrheal gastrointestinal protectant drug) (Benhamou 1999), and the second administered a formula containing vitamins, minerals and protein (Correa 2005).
Outcomes
Thirty‐three studies (n = 6352) provided data on the incidence of diarrhea, 24 (n = 4415) reported on adverse events, and 8 studies (n = 1263) reported on the mean duration of diarrhea. Twenty‐seven studies reported the definition of diarrhea or AAD. The criteria for defining the incidence of diarrhea varied among the studies and ranged from clinical determination of diarrheal incidence (Merenstein 2009); one or more abnormally loose bowel movements per day (Tankanow 1990); at least two liquid stools per day (LaRosa 2003); two or more liquid stools per day on at least two occasions during the course of the study (Vanderhoof 1999; Wan 2017); three or more liquid/watery stools per day (Benhamou 1999; Correa 2005; Erdeve 2004; Esposito 2017; Jindal 2017; King 2010; Olek 2017; Peng 2014; Zhang 2015 ), three or more watery/loose/liquid stools per day for two consecutive days (Arvola 1999; Conway 2007; Kotowska 2005; Zakordonets 2016); change in bowel habits with the passage of three or more liquid stools per day for at least two consecutive days 48 hours after initiation of antibiotic therapy (Destura unpublished); to greater than or equal to three loose or watery stools per day for a minimum of 48 hrs, occurring during or up to two weeks after the end of the antibiotic therapy (Georgieva 2015; Ruszczynski 2008; Saneeyan 2011; Shan 2013; Szajewska 2009; Szymanski 2008). Two trials used different definitions of diarrhea (Fox 2015; Kolodziej 2018). One trial used various definitions of diarrhea which included (A) stool consistency ≥ 5 (as measured by the Bristol Stool Scale) and stool frequency ≥2/day for more than 2 days; (B) stool consistency ≥5 and stool frequency ≥3/day for more than 2 days; (C) stool consistency ≥ 6 and stool frequency ≥ 2/day for more than two days; and (D) stool consistency ≥ 6 and stool frequency ≥ 3/day for more than two days (Fox 2015). The second trial used three different definitions of diarrhea which included (A) ≥3 loose or watery stools per day for a minimum of 48 hours (strictest definition); (B) ≥3 loose or watery stools per day for a minimum of 24 hours; and (C) ≥2 loose or watery stools per day for a minimum of 24 hours (Kolodziej 2018). One study defined diarrhea as two or more bowel movements over the patient's baseline number of bowel movements (Zheng 2012).
Five studies reported on viral and bacterial analysis of fecal samples to exclude other causes of diarrhea (Arvola 1999; Destura unpublished; Kolodziej 2018; Kotowska 2005; Wan 2017). Along with viral and bacterial fecal analysis, one trial reported on the metabolic activity of gut microflora: fecal urease, ß‐glucosidase and ß‐glucuronidase activity (Arvola 1999) and one study reported fecal microflora compositional three different time points (Zakordonets 2016). Three trials reported on frequencies of retroviral diarrhea, salmonella diarrhea, shigella diarrhea and C. difficile diarrhea (Kolodziej 2018; Kotowska 2005; Ruszczynski 2008). Other outcomes of potential interest included mean diarrhea incubation and percentage suffering from dehydration reported in one study (Correa 2005), fecal lactoferrin (Destura unpublished), and the need for IV rehydration, hospitalisation of outpatients, or discontinuation of antibiotic treatment (Kolodziej 2018; Ruszczynski 2008; Szymanski 2008). Additionally, six studies reported on H. pylori outcomes such as positive rapid urea test, positive histopathology for H. pylori, and positive C13 urea breath test (Kodadad 2013; Saneeyan 2011; Sykora 2005; Szajewska 2009; Zhang 2015; Zhao 2014). No studies reported on cost‐effectiveness related to absenteeism from the workplace, daycare or school between treatment and control groups.
Excluded studies
Forty‐nine studies were excluded for not meeting the inclusion criteria. Reasons for exclusion are listed in the Characteristics of excluded studies tables.
Risk of bias in included studies
Loss to follow‐up was substantial (i.e. > 20%) in 6/33 trials reporting on the incidence of diarrhea (Arvola 1999; Benhamou 1999; Erdeve 2004; King 2010; Szajewska 2009; Tankanow 1990). In particular, LTFU was 46% in King 2010, 37% in Tankanow 1990 and 29% in Arvola 1999. Ten trials provided a flow diagram to track participants some of which included details regarding drop‐outs (Conway 2007; Kodadad 2013; Kolodziej 2018; Kotowska 2005; Merenstein 2009; Olek 2017; Ruszczynski 2008; Szajewska 2009; Szymanski 2008; Zhang 2015). All studies were randomized parallel group designs. Twenty‐one studies reported using a 'double‐blind' procedure. The risk of bias assessment determined that patients in the Conway 2007 and Tankanow 1990 studies were likely unblinded during treatment. Six trials were open label (Destura unpublished; Jindal 2017; Shan 2013; Zakordonets 2016; Zhang 2015; Zheng 2012). The validated risk of bias instrument categorizes risk into three categories: high risk of bias, low risk of bias and unclear. Thirteen trials were categorized as low risk (Destura unpublished; Fox 2015; Georgieva 2015; Kodadad 2013; Kolodziej 2018; Kotowska 2005; LaRosa 2003; Merenstein 2009; Olek 2017; Ruszczynski 2008; Sykora 2005; Szajewska 2009; Szymanski 2008) and 20 trials were categorized as high risk ( Arvola 1999; Benhamou 1999; Conway 2007; Correa 2005; Dharani 2017; Erdeve 2004; Esposito 2017; Jindal 2017; Jirapinyo 2002; King 2010; Peng 2014; Saneeyan 2011; Shan 2013; Tankanow 1990; Vanderhoof 1999; Wan 2017; Zakordonets 2016; Zhang 2015; Zhao 2014; Zheng 2012). See Figure 2 and Figure 3 for the overall results of the risk of bias assessment.

Risk of bias graph: review authors' judgements about each risk of bias item presented as percentages across all included studies.

Risk of bias summary: review authors' judgements about each risk of bias item for each included study.
Effects of interventions
Incidence of diarrhea
To allow for a heterogeneous definition of diarrhea, data (as a binary outcome) were included based on the primary authors' definition of the presence or absence of diarrhea. Thirty‐three studies (n = 6352) reported on the incidence of diarrhea. Using an complete case (i.e. patients who did not complete the studies were not included in the analysis) approach as the primary analysis, seven placebo‐controlled studies showed probiotics may reduce (P < 0.05) the incidence of AAD (Esposito 2017; Fox 2015; Kotowska 2005; LaRosa 2003; Ruszczynski 2008; Saneeyan 2011; Vanderhoof 1999); one active‐controlled study (formula) suggested probiotics may reduce the incidence of AAD (Correa 2005), and eight 'no treatment‐control' study demonstrated that probiotics may reduce the incidence of AAD (Erdeve 2004; Jindal 2017; Peng 2014; Shan 2013; Wan 2017; Zhang 2015; Zhao 2014; Zheng 2012). Twelve placebo‐controlled studies (Arvola 1999; Georgieva 2015; Jirapinyo 2002; King 2010; Kodadad 2013; Kolodziej 2018; Merenstein 2009; Olek 2017; Sykora 2005; Szajewska 2009; Szymanski 2008; Tankanow 1990), four no treatment‐control studies (Conway 2007; Destura unpublished; Dharani 2017; Zakordonets 2016), and one active‐control (diosmectite) study (Benhamou 1999), showed no difference in the incidence of AAD. The overall pooled results using a complete case analysis showed that the use of probiotics probably produce a reduction in the incidence of AAD. After 5 days to 12 weeks of follow‐up, the incidence of AAD in the probiotic group was 8% (259/3232) compared to 19% (598/3120) in the active, placebo or no treatment control group (6352 participants; RR 0.45; 95% CI 0.36 to 0.56; P < 0.00001; random‐effects). However, substantial heterogeneity was detected (P < 0.00001) and this was moderate with respect to per cent variability due to between (or inter ‐) study variability (I² = 57%) (Higgins 2003). A GRADE analysis indicated that the overall quality of evidence for the outcome incidence of diarrhea was moderate due to minor issues with risk of bias and inconsistency (see summary of findings Table for the main comparison).
Adverse events
None of the studies specifically defined adverse events a priori. Among 33 included studies, 25 followed and reported on adverse events including 13 studies reporting that no adverse events were observed (Conway 2007; Destura unpublished; Jindal 2017; Jirapinyo 2002; King 2010; Kotowska 2005; Ruszczynski 2008; Shan 2013; Szymanski 2008; Vanderhoof 1999; Wan 2017; Zakordonets 2016; Zheng 2012), and twelve trials reported a variety of adverse events, typically mild to moderate in nature (Correa 2005; Dharani 2017; Fox 2015; Kodadad 2013; Kolodziej 2018; Merenstein 2009; Olek 2017; Peng 2014; Sykora 2005; Szajewska 2009; Tankanow 1990; Zhao 2014). Among the 12 studies having reported specific adverse events, 11 reported incidence rates while 1 reported a rate ratio (Zhao 2014). For the purpose of meta‐analysis, we only included studies reporting incidence rates.
The characteristics of the 11 studies reporting incidence data follows. Correa 2005 reported five participants with adverse events in the treatment group. These adverse events were related to the tolerability of a baby formula supplemented with probiotics. Dharani 2017 reported five adverse events in the treatment and nine adverse events in the control group, including flatulence, abdominal discomfort and vomiting. Fox 2015 reported 14 participants with adverse events (i.e. abdominal pain, loss of appetite, nausea, vomiting and headache) with more adverse events reported in the control group than the probiotic group. Kodadad 2013 reported 18 participants with adverse events including nausea, vomiting, and abdominal bloating, again with more adverse events occurring in the control group than the probiotic group. Kolodziej 2018 reported three adverse events in probiotic group and seven adverse events in control group. In both groups adverse events included abdominal pain, regurgitation and 'flexing'. Merenstein 2009 reported a case of emesis in the treatment group and a case of constipation in the control group. Sykora 2005 reported seven adverse events in the probiotic group and nine adverse events in the control group. However, eight of the reported adverse events were diarrhea (four in each group) which we counted as our primary outcome. This left four participants with non‐diarrhea adverse events in each group. No difference in adverse events was found between groups (P < 0.0001). Olek 2017 reported 155 adverse events in 99/447 participants randomized, of which 39 participants in treatment group and 60 participants in control group experienced at least 1 adverse event. The incidence of participants with at least one adverse event was significantly lower in the treatment group compared with the placebo‐control group. Szajewska 2009 reported 18 adverse events in the treatment group and 13 in the control group. In both groups adverse events included nausea, vomiting, constipation, flatulence, taste disturbance, and low appetite. Peng 2014 reported adverse events including antibiotic allergic reaction and mycotic stomatitis. However, it was assumed for the purpose of our meta‐analysis that the antibiotic allergic reaction was not related to the probiotics. Therefore, three adverse events were found in the control group and zero adverse events were found in the treatment group. Tankanow 1990 reported 14 adverse events experienced by 3 patients including rash, gas, vomiting, increased phlegm and chest pain. However, for each of the 14 events it was not clear in which group (treatment or control) the adverse events occurred. Based on the study report, it appears that the 14 adverse events occurred in 3 participants receiving probiotic.
The characteristics of the one trial reporting a rate ratio are as follows. Among 240 patients randomized, Zhao 2014 reported 95/120 adverse events in treatment group and 140/120 adverse events in control group. The adverse events including nausea, vomiting, stomatitis, abdominal pain and constipation. However, the author did not report evidence of association between observed adverse events and probiotic. We contacted the author for the number of patients with at least one or more adverse events in each group (treatment and control) and no response was received.
Meta‐analysis of 24 trials (4415 participants) that followed participants for adverse events demonstrated no differences in the incidence of adverse events. After 5 days to 4 weeks of follow‐up, 4% (86/2229) of participants in probiotic group had adverse events compared to 6% (121/2186) of participants in control group (RD 0.00; 95% CI ‐0.01 to 0.01, P < 0.00001), demonstrating that there were slightly more adverse events in the control group. A GRADE analysis indicated that the overall quality of evidence for this outcome was low due to imprecision (sparse data, only 207 events), indirectness related to intervention and measurement of adverse outcomes, inconsistency (I² = 75%) and potential selective reporting given that only 25 of 33 studies reported AEs (see summary of findings Table for the main comparison).
Mean duration of diarrhea
Eight studies recorded the mean duration of diarrhea (Arvola 1999; Correa 2005; Destura unpublished; Esposito 2017; LaRosa 2003; Peng 2014; Vanderhoof 1999; Zhang 2015). The standard deviation (SD) for two of the eight trials was not reported (Esposito 2017; Vanderhoof 1999). The SD of the two trials (Esposito 2017; Vanderhoof 1999), was imputed based on median of observed SD values from other 6 trials (Arvola 1999; Correa 2005; Destura unpublished; LaRosa 2003; Peng 2014; Zhang 2015). A post hoc sensitivity analysis was conducted to test the robustness of the mean duration results both before and after imputing data. The MD was statistically significant both before including Vanderhoof 1999 (MD ‐0.80; 95% CI ‐1.42 to ‐0.18; 1015 participants) and after imputing the SD data (MD ‐0.91, 95% ‐1.38 to ‐0.44; 1263 participants). Substantial heterogeneity was detected (P < 0.00001) and this was high with respect to per cent variability due to between (or inter ‐) study variability (I² = 84%, P < 0.00001) (Higgins 2003). A GRADE analysis indicated that the overall quality of evidence for this outcome was low due to serious inconsistency (I² = 84%) and potential selective reporting bias given that only 8 of 33 trials reported on duration of diarrhea (see summary of findings Table for the main comparison).
Microbiome characteristics
One study reported on metabolic activity of the gut microflora (i.e. fecal urease, beta‐glucuronidase, beta‐glucosidase) at baseline, three weeks, one month and three months (Arvola 1999), however, authors did not report changes between groups. Since the Arvola 1999 data are specific to enzymatic activity of the microflora, we did not consider this directly relevant to microbiome characteristics. A second study that assessed five probiotic species including Lactobacilli, Lactococci, Bifidobacterium (strain not specified) versus no treatment (antibiotic only) reported fecal microflora composition changes in microbiome at baseline, one day after discontinuation of antibiotic, and one month after discontinuation (Zakordonets 2016). Authors reported that probiotics may lead to differences between the probiotic and the antibiotic only group with respect to total E. coli, lactose (‐) and hemolytic E. coli, and Staphylloccus aureas at one day after discontinuation of antibiotic (P<0.05). At one month, authors also reported probiotics may lead to slight differences in lactose (‐) and hemolytic E. coli, Staphylloccus aureas, Candida spp and Klebsiella pneumoniae (P < 0.05). There were no differences in changes in Lactobacillus spp or Bifidobacterium spp (P < 0.05). No studies reported 16SrRNA or other microbiome analyses. GRADE analysis indicated that overall quality of evidence for this outcome was very low due to selective reporting, imprecision, and indirectness (outcome not of importance to patients).
A PRIORI SUBGROUPS
1. Inpatient versus outpatient
Twenty‐three studies clearly delineated whether or not their populations were inpatient or outpatient. Eleven studies were conducted in an outpatient setting (Benhamou 1999; Conway 2007; Correa 2005; Dharani 2017; Fox 2015; Jindal 2017; Merenstein 2009; Olek 2017; Saneeyan 2011; Tankanow 1990; Vanderhoof 1999). Ten studies were conducted amongst inpatient populations (Esposito 2017; Georgieva 2015; Jirapinyo 2002; King 2010; Peng 2014; Shan 2013; Szajewska 2009; Wan 2017; Zakordonets 2016; Zheng 2012). Seven studies had mixed inpatients and outpatient populations (Arvola 1999; Destura unpublished; Kolodziej 2018; Kotowska 2005; Ruszczynski 2008; Szymanski 2008; Zhao 2014). Both outpatient studies and inpatient studies showed a statistically significant effect. Seven per cent (54/750) of inpatients in the probiotic group had diarrhea compared to 24% (171/719) of inpatients in the control group (RR 0.34; 95% CI 0.26 to 0.45). Eight per cent (99/1273) of outpatients in the probiotic group had diarrhea compared to 17% (200/1207) of outpatients in the control group (RR 0.54; 95% CI 0.33 to 0.88); in both instances probiotics reduced diarrhea. A test for interaction between in and outpatient trials was not statistically significant (P = 0.21; I² = 57.7%).
2. Diagnosis
Twenty‐nine studies reported on the participants' diagnoses which had necessitated the antibiotics. Dharani 2017 was limited to patients with impetigo. Esposito 2017 was limited to hypospadias. Six studies (n = 1064) were limited to respiratory infections (Arvola 1999; Merenstein 2009; LaRosa 2003; Kotowska 2005; Peng 2014; Zheng 2012), of which 16% (58/532) of patients diagnosed with respiratory infections in probiotic group had diarrhea compared to 26% (136/532) in control group (RR 0.44; 95% CI 0.33 to 0.61; P < 0.00001). Six studies (n = 700) were limited to participants with H. pylori infections (Kodadad 2013; Saneeyan 2011; Sykora 2005; Szajewska 2009; Zhang 2015; Zhao 2014), of which 14% (49/353) of patients diagnosed with H. pylori infection in probiotic group had diarrhea compared to 30% (105/347) in control group (RR 0.48; 95% CI 0.35 to 0.64; P < 0.00001). Fifteen studies (n = 3083) had participants with a variety of infections (Destura unpublished; Fox 2015; Georgieva 2015; Jindal 2017; Jirapinyo 2002; King 2010; Kolodziej 2018; Olek 2017; Ruszczynski 2008; Shan 2013; Szymanski 2008; Tankanow 1990; Vanderhoof 1999; Wan 2017; Zakordonets 2016), of which 6% (89/1542) of patients in probiotic group had diarrhea compared to 17% (258/1541) in control group (RR 0.43; 95% CI 0.27 to 0.67; P <0.0001). A test for interaction was not statistically significant (P = 0.91; I² = 0%).
3. Probiotic species
Six of 33 trials administered Lactobacillus rhamnosus species (five using strain Lactobacillus GG: Arvola 1999; Esposito 2017; King 2010; Szajewska 2009; Vanderhoof 1999; and one using strains E/N, Oxy, and Pen: Ruszczynski 2008), while nine studied the yeast Saccharomyces boulardii (Benhamou 1999; Erdeve 2004; Jindal 2017; Kotowska 2005; Peng 2014; Shan 2013; Wan 2017; Zhang 2015; Zhao 2014). Combined results from six L. rhamnosus studies (n = 686) showed a statistically significant protective effect. Eight per cent (27/345) of L. rhamnosus participants had diarrhea compared to 22% (76/341) of the control group, (RR 0.37, 95% CI 0.24 to 0.55; P < 0.0001; I² = 0%). The summary statistic for Saccharomyces boulardii trials (n = 3165) was statistically significant as well indicating a protective effect. Eight per cent (125/1620) of Saccharomyces boulardii participants had diarrhea compared to 21% (329/1545) in control group (RR 0.36; 95% CI 0.24 to 0.54; P <0.0001; I² = 76%). A test of interaction for species related heterogeneity between L. rhamnosus species and S. boulardii revealed no statistically significant difference ( P = 0.94, I² = 0%).
4. Single strain versus multi‐strain probiotics
Of the 33 studies reporting on incidence of diarrhea, 20 studies used a single strain (Arvola 1999; Benhamou 1999; Destura unpublished; Erdeve 2004; Esposito 2017; Georgieva 2015; Jindal 2017; King 2010; Kolodziej 2018; Kotowska 2005; LaRosa 2003; Olek 2017; Peng 2014; Shan 2013; Sykora 2005; Szajewska 2009; Vanderhoof 1999; Wan 2017; Zhang 2015; Zhao 2014), four studies used two strains (Correa 2005; Jirapinyo 2002; Tankanow 1990; Zheng 2012), three studies used three strains (Fox 2015; Ruszczynski 2008; Szymanski 2008), three studies used four strains (Conway 2007; Dharani 2017; Zakordonets 2016), two studies used seven strains (Kodadad 2013; Saneeyan 2011), and one study used 10 strains (Merenstein 2009). Single strain probiotics (20 studies, n = 4900) and multi‐strain probiotics (13 studies, n = 1452) showed a statistically significant effect. Seven per cent (184/2483) of single strain participants had diarrhea compared to 18% (446/2417) of the control group (RR 0.42, 95% CI 0.32 to 0.56; P < 0.00001). Ten per cent (75/749) of multi‐strain participants had diarrhea compared to 22% (152/703) of the control group (RR 0.53; 95% CI 0.37 to 0.75; P = 0.0003). A test for interaction between these two groups was not statistically significant (P = 0.34; I² = 0%).
5. Probiotic dose
The daily dosage of probiotic(s) varied greatly from 100 million to 2 trillion CFUs/day. Thirty‐two of 33 studies that reported on the incidence of diarrhea, provided dosage information (Arvola 1999; Benhamou 1999; Conway 2007; Correa 2005; Destura unpublished; Erdeve 2004; Esposito 2017; Fox 2015; Georgieva 2015; Jindal 2017; Jirapinyo 2002; King 2010; Kodadad 2013; Kolodziej 2018; Kotowska 2005; LaRosa 2003; Merenstein 2009; Olek 2017; Peng 2014; Ruszczynski 2008; Saneeyan 2011; Shan 2013; Sykora 2005; Szajewska 2009; Szymanski 2008; Tankanow 1990; Vanderhoof 1999; Wan 2017; Zakordonets 2016; Zhang 2015; Zhao 2014; Zheng 2012). The a priori subgroup analyses on dose compared < 5 billion CFUs/day versus ≥ 5 billion CFUs/day. Twenty studies (n = 4038) providing children with 5 billion to 2 trillion bacteria/yeast cells per day showed evidence for the preventative effects of probiotics (Arvola 1999; Erdeve 2004; Esposito 2017; Fox 2015; Jindal 2017; Kotowska 2005; LaRosa 2003; Merenstein 2009; Olek 2017; Peng 2014; Ruszczynski 2008; Shan 2013; Sykora 2005; Vanderhoof 1999; Wan 2017; Zakordonets 2016; Zhang 2015; Zhao 2014). For the high dose studies, the pooled incidence of AAD in the probiotic group was 8% (162/2029) compared to 23% (462/2009) in the active, placebo or no treatment control group (RR 0.37, 95% CI 0.30 to 0.46, P < 0.00001, I² = 36%, moderate certainty evidence; See summary of findings Table for the main comparison). Twelve studies (n = 2214) providing < 5 billion CFUs bacteria/yeast per day: 825 million CFUs/day (Correa 2005), 200 million CFUs/day (Kolodziej 2018; Szymanski 2008), 100 million CFUs/day (Georgieva 2015), 4.5 billion CFUs/day (Benhamou 1999), 4 billion CFUs/day (Destura unpublished), 2.2 billion CFUs/day (Zheng 2012), 2 billion CFUs/day (Tankanow 1990), and 1 billion CFUs/day (Conway 2007; Szajewska 2009; Saneeyan 2011; Kodadad 2013), and demonstrated statistically non‐significant results when combined. For the low dose studies the pooled incidence of AAD in the probiotic group was 8% (97/1155) compared to 13% (133/1059) in the active, placebo or no treatment control group (RR 0.68; 95% CI 0.46 to 1.01; P = 0.06; I² = 53%). A test for interaction revealed a statistically significant dose‐related heterogeneity ( P = 0.01; I² = 85.1%). Using 5 criteria to evaluate the credibility of the subgroup analysis, the results indicate that the subgroup effect based on dose (≥ 5 billion CFUs/day) was convincing (Sun 2014; See Appendix 2).
6. Definition of diarrhea
Among the 27 studies reporting on the definition of diarrhea onset (diagnosis), we assessed for subgroup differences based on the variability of the definition. Among studies (13 studies, n = 1873) defining diarrhea as 3 or more loose/water/liquid stools per day for at least 2 consecutive days, 6% (58/956) of the probiotic group had diarrhea compared to 19% (170/917) of the control group (RR 0.36, 95% CI 0.25 to 0.50; P < 0.00001; I² = 15%). Among studies (9 studies, n = 2748) defining diarrhea as ≥ 3 watery/liquid stools per 24 hours, 8% (106/1408) of the probiotic group had diarrhea compared to 17% (228/1340) of the control group (RR 0.48, 95% CI 0.31 to 0.76; P = 0.0002; I² = 73%). A test for interaction by diarrhea definition was not statistically significant (P = 0.30, I² = 7%).
7. Strictness of definition of diarrhea (mild vs moderate)
Similarly, we assessed for subgroup differences based on categorizing the study definition of AAD as either mild or moderate severity. Among studies (20 studies, n = 4303) defining diarrhea as moderate severity, 7% (148/2207) of the probiotic group had diarrhea compared to 17% (365/2097) of the control group (RR 0.40, 95% CI 0.31 to 0.53; P < 0.00001; I² = 46%). Among studies (5 studies, n = 1104) defining diarrhea as mild severity, 9% (51/562) in probiotic group had diarrhea compared to 25% (134/542) in control group (RR 0.41, 95% CI 0.22 to 0.77; P = 0.005, I² = 81%). A test for interaction by strictness was not statistically significant (P = 0.95, I² = 0%).
8. Industry sponsorship
Seventeen studies clearly reported on study sponsorship or funding. Of these, 9 studies (n = 1627) were funded by industry (Correa 2005; Destura unpublished; Merenstein 2009; Olek 2017; Ruszczynski 2008; Sykora 2005; Tankanow 1990; Vanderhoof 1999; Zakordonets 2016) and 8 (n = 1315) were not (Conway 2007; Dharani 2017; Fox 2015; Jindal 2017; Kolodziej 2018; Saneeyan 2011; Szajewska 2009; Szymanski 2008). Industry sponsored studies showed statistically significant effects as did non‐industry sponsored studies. Among industry sponsored studies, 8% (62/804) of the probiotic group had diarrhea compared to 15% (126/823) of the control group (RR 0.58, 95% CI 0.40 to 0.82; P = 0.003; I² = 39%). Among non‐industry sponsored studies 6% (44/680) of the probiotic group had diarrhea compared to 18% (112/635) in control group (RR 0.43; 95% CI 0.18 to 1.00; P = 0.05, I² = 70%). A test for interaction between these two groups was not statistically significant (P = 0.52, I² = 0%).
9. Risk of bias
Of the 33 studies reporting on incidence of diarrhea, 13 studies (n = 2170) were rated as having a low risk of bias (Destura unpublished; Fox 2015; Georgieva 2015; Kodadad 2013; Kolodziej 2018; Kotowska 2005; LaRosa 2003; Merenstein 2009; Olek 2017; Ruszczynski 2008; Sykora 2005; Szajewska 2009; Szymanski 2008), and 20 studies (n = 4182) were rated as having a high risk of bias (Arvola 1999; Benhamou 1999; Conway 2007; Correa 2005; Dharani 2017; Erdeve 2004; Esposito 2017; Jindal 2017; Jirapinyo 2002; King 2010; Peng 2014; Saneeyan 2011; Shan 2013; Tankanow 1990; Vanderhoof 1999; Wan 2017; Zakordonets 2016; Zhang 2015; Zhao 2014; Zheng 2012). A subgroup analysis of those trials rated as a low risk of bias versus those rated as exhibiting a high risk of bias showed statistically significant results for the low risk of bias studies and the high risk of bias studies. Among low risk of bias studies, 7% (70/1076) of the probiotic group had diarrhea versus 13% (139/1094) of the control group (RR 0.53; 95% CI 0.37 to 0.77; P = 0.0007, I² = 32%). Among high risk of bias studies 9% (189/2158) of the probiotic group had diarrhea compared to 23% (459/2024) of the control group (RR 0.42; 95% CI 0.31 to 0.56; P < 0.00001, I² = 66%). A test for interaction was not statistically significant (P = 0.30; I² = 8.7%).
POST HOC SUBGROUPS
Age ≤24 months versus > 24 months
Thirty‐two (n = 5752) of 33 studies reported on age. Based on the largest prospective cohort study we are aware of (Turck 2003), the risk of AAD based 650 outpatient children prescribed antibiotics is 18% in children ≤ 24 months, and 3% in children > 24 months. We assessed for subgroup difference based on these age groups. Of these, six studies (n = 1127) reported on the participants' age ≤ 24 months (Correa 2005; Esposito 2017; Jirapinyo 2002; Peng 2014; Wan 2017; Zheng 2012), while 26 studies (n=4625) enrolled participants > 24 months of age (Arvola 1999; Benhamou 1999; Conway 2007; Destura unpublished; Dharani 2017; Erdeve 2004; Fox 2015; Georgieva 2015; King 2010; Kodadad 2013; Kolodziej 2018; Kotowska 2005; LaRosa 2003; Merenstein 2009; Olek 2017; Ruszczynski 2008; Saneeyan 2011; Shan 2013; Sykora 2005; Szajewska 2009; Szymanski 2008; Tankanow 1990; Vanderhoof 1999; Zakordonets 2016; Zhang 2015; Zhao 2014). For the participants ≤ 24 months of age the pooled incidence of AAD in the probiotic group was 9% (50/580) compared to 25% (136/547) in the active, placebo or no treatment control group (RR 0.37; 95% CI 0.26 to 0.53; P = 0.24; I² = 26%). For those participants > 24 months of age the pooled incidence of AAD in the probiotic group was 8% (193/2354) compared to 17% (390/2271) in the active, placebo or no treatment control group (RR 0.50; 95% CI 0.39 to 0.66; P = 0.0006; I² = 54%). A test for interaction was not statistically significant (P = 0. 18; I² = 43.3%).
SENSITIVITY ANALYSES
Random‐effects versus fixed‐effect
A sensitivity analysis using random‐effects (RR 0.45; 95% CI 0.36 to 0.56; P < 0.00001; I² = 57%) versus fixed‐effect models (RR 0.43; 95% CI 0.37 to 0.49; P <0.00001, I² = 57%) for the incidence of diarrhea, indicated limited differences between the risk ratio and corresponding 95% confidence intervals. Nonetheless, because the I² statistic demonstrated moderate heterogeneity within and between studies, a random‐effects model was used for all statistical analyses.
Imputation for missing outcome data analysis
Incidence of diarrhea analysis
There were 6352 pediatric participants originally randomized in the 33 trials reporting on the primary outcome (incidence of diarrhea). Twenty of 33 trials reported LTFU of which six reported substantial attrition concerns. Loss to follow‐up was 20%, 21%, 28%, 28%, 36% and 46.4% in the Szajewska 2009; Arvola 1999; Benhamou 1999; Erdeve 2004; Tankanow 1990 and King 2010 studies respectively. We elected to make assumptions about the missing data which were extreme but still plausible. If no information was reported on the number of patients randomized to each group, or the number LTFU from each group (e.g. not reported in the published trial or unsuccessful contact with authors) was available, it was assumed that the LTFU in the treatment and control groups were as even as possible (e.g. block randomization). After imputing data for the missing responses, an extreme‐plausible analysis (60% of children loss to follow‐up in probiotic group and 20% loss to follow‐up in the control group had diarrhea) resulted in a probable slight reduction in the incidence of AAD. For this sensitivity analysis, the pooled incidence of AAD in the probiotic group was 12% (436/3551) compared to 19% (664/3468) in the active, placebo or no treatment control group (RR 0.61; 95% CI 0.49 to 0.77; P <0.00001; I² = 70%). For high dose probiotics, the extreme plausible analysis for LTFU also showed that the probiotics probably reduce the incidence of AAD (RR 0.54; 95% CI 0.42 to 0.70; P <0.00001; I² = 68%).
Adverse event analysis
Assuming that patients LTFU in each of the trials may have had adverse events, we conducted a sensitivity analysis to test the robustness of the primary available case analysis. To do so, we decided that a reasonable assumption to make for those who were LTFU was that LTFU had the same adverse event rate as those followed up in their respective randomization groups. In particular, among the 24 trials that did report on adverse events, the proportion of adverse events was 3.9% (86/2229) in the treatment group and 121/2186 (5.5%) in the control group. For trials that reported LTFU, we assigned the same adverse event rate as those followed up in their respective randomization groups, that is 3.8% (88/2331) and 5.4% (123/2264) were assumed to have adverse events among treatment and control groups, respectively. Our primary complete case analysis (RD ‐0.00; 95% CI ‐0.01 to 0.01; P < 0.00001) yielded the same pooled estimate as the same event rate assumptions analysis (RD 0.00; 95% CI ‐0.01 to 0.01; P < 0.00001).
Publication bias
A funnel plot analysis provided no compelling visual indication of publication bias showing general symmetry of the funnel for the relationship between risk ratio and standard error (See Figure 4 and Figure 5). Because of the heterogeneity in our sample (Tau² = 0.21), we followed recently proposed guidelines and chose not to run statistical tests of publication bias such as Egger's regression test (Sterne 2011).

Funnel plot of comparison: 1 any specific probiotic versus control (placebo, active or no treatment), outcome: 1.6 Incidence of Diarrhea: Complete case ‐ fixed effects
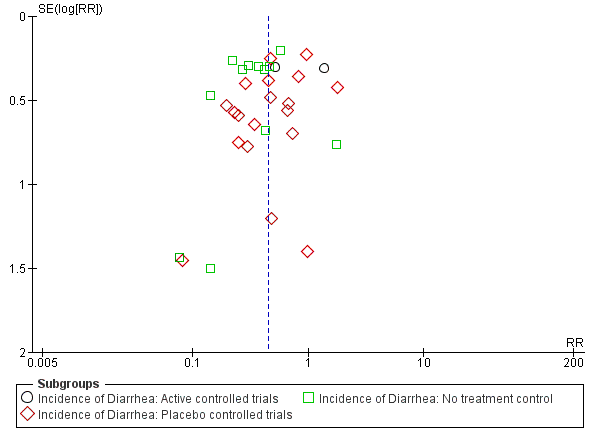
Funnel plot of comparison: 1 Probiotics versus control, outcome: 1.1 Incidence of diarrhea: Complete case.
Discussion
Summary of main results
The primary objective of this review was to determine if the co‐administration of probiotics with antibiotics prevents the incidence of antibiotic‐associated diarrhea in children. Thirty‐three eligible studies included treatment with Bacillus spp., Bifidobacterium spp., Clostridium butyricum, Lactobacilli spp., Lactococcus spp., Leuconostoc cremoris, Saccharomyces spp., or Streptococcus spp., alone or in combination. Fifteen of 33 trials tested S. boulardii or Lactobacillus rhamnosus spp. Complete case analysis (i.e. patients who did not complete the studies were not included in the analysis) results from 33 trials reporting on the incidence of diarrhea, demonstrated a precise benefit with an incidence of AAD of 8% (259/3232) in the probiotic group compared to 19% (598/3120) in the control group (RR 0.45, 95% CI 0.36 to 0.56, P < 0.00001, I² = 57%; Figure 6). The NNTB to prevent one case of diarrhea is nine (NNTB 9; 95% CI 7 to 13), a moderate treatment effect.
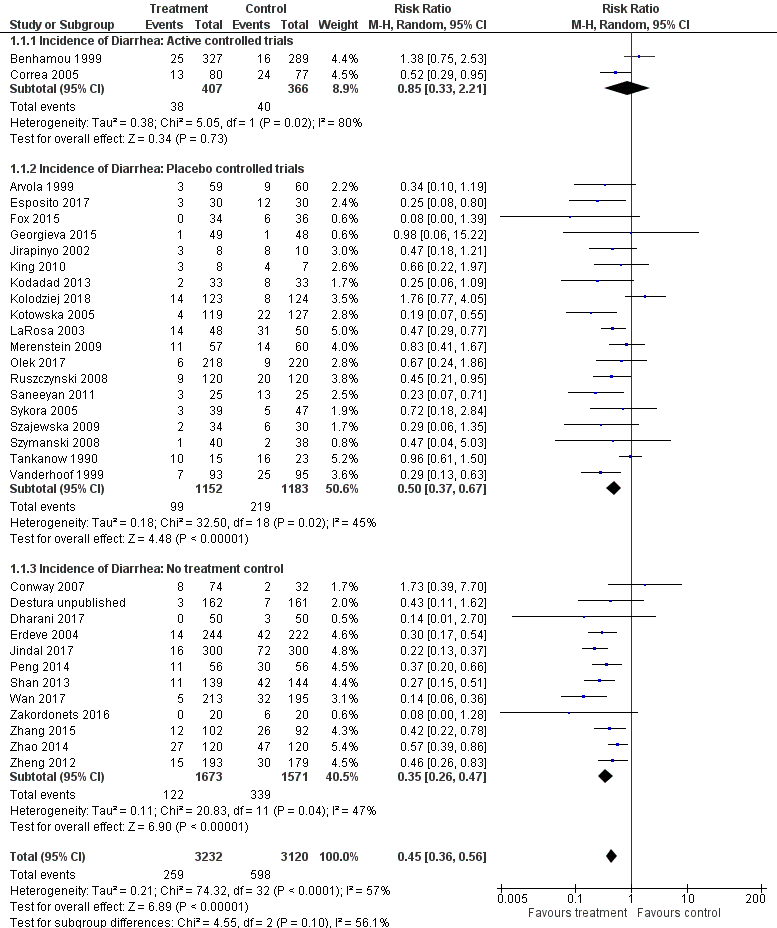
Forest plot of comparison: 1 Probiotics versus control, outcome: 1.1 Incidence of diarrhea: Complete case.
To test the robustness of our complete case analysis, we elected to make assumptions about the missing outcome data which were extreme but arguably plausible. Nineteen of 33 trials had loss to follow‐up ranging from 1.2% to 46.4%. After imputing data for the missing responses, an extreme‐plausible analysis (60% of children loss to follow‐up in probiotic group and 20% loss to follow‐up in the control group had diarrhea) still indicated a probable benefit for probiotics (7019 participants, RR 0.61, 95% CI 0.49 to 0.77, P < 0.0001; I² = 70%).
Statistical heterogeneity was moderate. We specified nine a priori subgroup hypotheses to explore the heterogeneity in our results, including inpatient versus outpatient, diagnosis type, probiotic species or strain, single versus multi strain, probiotic dose, definition of diarrhea, strictness of definition (mild versus moderate severity), industry sponsorship, and risk of bias (e.g. allocation concealment, blinding). We also conducted a post hoc subgroup analysis which included age (≤ 24 months versus > 24 months). A test for heterogeneity was significant for one subgroup: probiotic dose, providing evidence that a dose‐response gradient is the most likely explanation for the statistical heterogeneity. The test for interaction for potential dose‐associated heterogeneity was statistically significant (P = 0.01). Using 5 criteria to evaluate the credibility of the subgroup analysis, the results indicate that the subgroup effect based on dose (≥ 5 billion CFUs per day) was convincing (Sun 2014); see Appendix 2). This represents an important finding as dosage recommendations for products containing probiotics available in pharmacies and health food stores have a wide range (e.g. 0.2 billion to 2 trillion CFUs per day). Dosages approaching the lower range may not confer a benefit (Ouwehand 2017; Raza 1995), while doses in the upper range may be associated with an increased risk of adverse events. Given our review included trials testing 19 different probiotics (single or multi‐agent species), amongst a diverse clinical population, with nearly all demonstrating favourable results; for the purposes of clinical use and future research, our findings suggest that the minimal effective dose may be 5 billion CFUs per day, with an upper range of 40 billion CFUs/day considered efficacious in otherwise healthy children (RR 0.37, 95% CI 0.30 to 0.46; NNTB 6, 95% CI 5 to 9). Further, although we did not observe a statistically significant effect based on our post‐hoc subgroup on age, evidence from the largest cohort study we are aware of assessing the risk for AAD among 650 outpatient children in France suggests a six‐fold increased risk of AAD in children ≤2 years of age (18% risk of AAD) versus children > 2 years (3% risk of AAD) of age (Turck 2003). Based on the RR from trials administering ≥5 billion CFUs/day, for children ≤2 years of age the absolute risk reduction is 113 fewer AAD cases per 1000 children followed (95% CI 97 to 126 fewer cases), while for children > 2 years of age the absolute risk reduction is 19 fewer AAD cases per 1000 children followed (95% CI 16 to 21 fewer cases). These results, although post‐hoc, suggest that probiotics are substantially more effective in younger children.
Regarding safety, 24/33 trials reported on adverse events, none having reported a serious adverse event. Meta‐analysis demonstrated no substantial differences in the incidence of any adverse events between treatment and control (RD 0.00, 95% CI ‐0.01 to 0.01, P < 0.59; I² = 75%).
Overall completeness and applicability of evidence
We included 33 trials of children (n=6352), both male and female aged from 3 days to 18 years (6 studies in those ≤2 years, 26 studies in those >2 years) from diverse socioeconomic status across 17 countries including both developed country and developing countries. We believe the population is varied enough for results to be generalized to healthy children receiving antibiotics. However, only one study included newborns and one study with just 15 participants was conducted in the Intensive Care Unit (ICU), thus the applicability of our results to newborns and ICU children is unknown.
Studies used 19 different probiotic interventions including different species and/or strain(s), as well as dosages versus placebo (19 studies), no probiotics (12 studies) and active control (2 studies). We did subgroup analysis to explore the different interventions, both species and strain and the results demonstrated no difference in the prevention of AAD, suggesting enhanced generalizability of our findings. For the dosage of probiotics, a test for interaction revealed that the subgroup effect based on high dose (≥ 5 billion CFUs/day) probiotics was superior to low dose, suggesting that high dose interventions of various probiotics are most likely to be beneficial (particularly Lactobacillus GG and Saccharomyces boulardii, the most studied products).
The outcome, incidence of AAD, was reported in all included studies, while 24 studies (n = 4415) reported on the potential for adverse events. However, our findings are not representative of all available data on adverse events as we only included randomized trials, whereas observational studies may suggest the potential for harm in some pediatric populations. With respect to secondary outcomes, only 9 studies reported on duration of diarrhea (n=1263) and one study reported the microbiome characteristics. Although the results of microbiome characteristics are generally unaddressed and may be helpful to understanding the probiotic mechanism of action, we believe the data on AAD and adverse event outcomes directly answer the question that clinicians and researchers have.
Quality of the evidence
Using the Cochrane risk of bias tool, we rated 13 trials as low risk of bias (Destura unpublished; Fox 2015; Georgieva 2015; Kodadad 2013; Kolodziej 2018; Kotowska 2005; LaRosa 2003; Merenstein 2009; Olek 2017; Ruszczynski 2008; Sykora 2005; Szajewska 2009; Szymanski 2008). Twenty trials were rated as high risk of bias (Arvola 1999; Benhamou 1999; Conway 2007; Correa 2005; Dharani 2017; Erdeve 2004; Esposito 2017; Jindal 2017; Jirapinyo 2002; King 2010; Peng 2014; Saneeyan 2011; Shan 2013; Tankanow 1990; Vanderhoof 1999; Wan 2017; Zakordonets 2016; Zhang 2015; Zhao 2014; Zheng 2012). The most common reasons for a high risk of bias rating were lack of blinding and incomplete outcome data.
The certainty of evidence supporting each outcome was determined using the GRADE criteria (Guyatt 2008). For the main efficacy outcome, incidence of diarrhea, the certainty of the evidence was rated as moderate (the true effect is likely to be close to the estimate of the effect, but there is a possibility that it is substantially different) because of the minor issues with risk of bias related to poor reporting regarding allocation concealment, blinding and incomplete data, as well as inconsistency related to the diversity of probiotics used. For the incidence of adverse events the certainty of the evidence was rated as low (we have very little confidence in the effect estimate: The true effect is likely to be substantially different from the effect estimate). However, probiotics were generally well tolerated and no serious adverse events attributable to probiotics were reported and we feel confident that the absolute effect, if it exists, is small.
Concerning the secondary outcome mean duration of diarrhea (eight trials, n = 1263), using a complete case analysis, probiotics decreased the mean duration of diarrhea by almost one day (MD ‐0.91; 95% CI ‐1.38 to ‐0.44), representing a moderate treatment effect. The certainty of the evidence was rated as low owing to inconsistency (i.e. large statistical heterogeneity with I² of > 77%, low P value [P < 0.06], point estimates and confidence intervals varied considerably) and imprecision (e.g. confidence intervals include effect estimates that are of questionable patient importance). Furthermore, results for mean duration of diarrhea may be misleading given our suspicion of selective reporting bias. In particular, the majority of studies fail to report results for this key outcome that otherwise would be expected to have been evaluated. A previous systematic review of the methods used in RCTs evaluating acute diarrhea reported that duration of diarrhea was the most common primary outcome (72/138 trials, 52% of trials) and this was reported in almost all trials as either a primary or secondary outcome (Johnston 2010). In this review, only 8 of 33 trials assessing probiotics for the prevention of pediatric AAD reported on duration of diarrhea as a primary or secondary outcome.
With respect to microbiome characteristics, only one study reported such an analysis. Zakordonets 2016 used five probiotic species including Lactobacilli, Lactococci, Bifidobacterium (strain not specified) versus no treatment (antibiotic only) and reported on fecal microflora composition changes in microbiome at baseline, one day after discontinuation of antibiotic, and one month after discontinuation of antibiotic. The authors reported slight differences between the probiotic and the antibiotic only group with respect to total E. coli, lactose (‐) and hemolytic E. coli, and Staphylloccus aureas at one day after discontinuation of antibiotic (P < 0.05). At one month, Zakordonets 2016 also reported slight differences in lactose (‐) and Hemolytic E. coli, Staphylloccus aureas, Candida spp and Klebsiella pneumoniae (P < 0.05). There were no changes in Lactobacillus spp or Bifidobacterium spp (P < 0.05). No studies reported on 16S rRNA or other microbiome analyses. GRADE analysis indicated that overall quality of evidence for this outcome was very low due to selective reporting, imprecision, and indirectness (outcome not of importance to patients).
Potential biases in the review process
This systematic review has several strengths. We asked a clear and relevant clinical question and the search strategy for this review was comprehensive including all relevant trials irrespective of language or publication status (i.e. we included unpublished data from Destura unpublished and abstract data from King 2010; and we obtained pediatric specific data from Conway 2007). Additional strengths of the review include the independent application of the GRADE criteria to assess the certainty of evidence for each of the outcomes (Guyatt 2008), and the rigorous evaluation of nine a priori subgroups (e.g. inpatient versus outpatient, diagnosis type, probiotic species, single versus multi strain, probiotic dose, definition of diarrhea, strictness of definition (mild versus moderate), industry sponsorship, and risk of bias) using the five criteria for assessing subgroup credibility (Sun 2014).
This review also has some limitations. First, although we previously did a more comprehensive search of the grey literature, for our update search we did not search conference proceedings or dissertation abstracts. Second, some readers may question the pooling of different probiotic species. In keeping with the justification for the combining of probiotic species used in two trials included in this review (Tankanow 1990 administered both L. acidophilus with L. bulgaricus; Jirapinyo 2002 administered both L. acidophilus with B. infantis; Szymanski 2008 administered a cocktail ofB. longum, L. rhamnosus andL. plantarum), data were pooled because the probiotics used in each trial share the recommended characteristics of a viable probiotic: non‐pathogenic properties (noting that further study is needed on L. sporogenes), the ability to survive transit through the gastrointestinal tract, adherence to intestinal epithelium, colonization in the intestinal tract, production of antimicrobial substances, and a good shelf life in food or powdered form (Goldin 1998). To assess differences that may exist between species and strains, we conducted a priori subgroup analyses and found no statistically significant differences between species or strains. Third, only one study assessed changes in microbiome characteristics before and after antibiotic and probiotic administration demonstrating no important differences. However, our findings are not representative of all available data on the topic as we only included randomized trials that assessed AAD as an outcome. For instance, a recent non‐randomized controlled trial examined the potential effects of an 11 strain probiotic versus fecal transplantation versus no treatment on the microbiome after broad‐spectrum antibiotic use in 21 healthy adults (Suez 2018). Probiotics were associated with a delay in transcriptome reconstitution of indigenous stool and mucosal microbiome configuration, while transplantation was associated with a quick and complete recovery after just a few days. Although Suez 2018 did not examine concurrent use of probiotics with antibiotics, nor did they examine children, their findings raise questions about the use of probiotics after antibiotic use. Unfortunately, there are many examples of early findings from laboratory experiments such as this with apparent harmful or salutary physiological effects, yet with subsequent clinical studies there is no apparent affect when assessing more patient‐important outcomes (Ferreira 2007). Hence, focusing on the findings from Suez 2018 can only provide indirect low quality evidence for clinical outcomes of importance to patients such as diarrhea or quality of life (Johnston 2013).
Finally, our findings are based on an aggregate data meta‐analysis and this does not allow us to fully explore participants (e.g. sex) and intervention level variables (e.g. number of antibiotics prescribed) that may be associated with AAD. To explore this issue in meta‐analysis, one would require individual patient data which we do not currently have access to.
Agreements and disagreements with other studies or reviews
At least thirteen systematic reviews and meta‐analyses have addressed the use of probiotics, alone or in combination, for the prevention of AAD in adults and children. The results of diverse probiotic agents co‐administered with antibiotics favoured probiotics (RR 0.43; 95% CI 0.31 to 0.58; McFarland 2006; RR 0.48; 95% CI 0.35 to 0.65; Sazawal 2006; RR 0.40; 95% CI 0.28 to 0.57; Cremonini 2002 and OR 0.37; 95% CI 0.26 to 0.53; D'Souza 2002). Additionally, meta‐analyses addressing the use of a single probiotic agent to prevent AAD examining Saccharomyces boulardii (S. boulardii) andLactobacillus have also favoured probiotic treatment (RR 0.35, 95% CI 0.19 to 0.67; Kale‐Pradhan 2010; RR 0.47, 95% CI: 0.35 to 0.63; McFarland 2010; and RR 0.43; 95% CI: 0.23 to 0.78; Szajewska 2005). Six meta‐analyses of randomized trials evaluating the efficacy of probiotics for preventing antibiotic‐induced diarrhea in children have also suggested benefit (RR 0.43; 95% CI 0.25 to 0.75; Johnston 2006; RR 0.52, 95% CI 0.38 to 0.72; Johnston 2011; RR 0.46; 95% CI 0.35 to 0.61; Goldenberg 2015; RR 0.43; 95% CI 0.33 to 0.56; McFarland 2015; RR 0.44; 95% CI 0.25 to 0.77; Szajewska 2006; RR 0.48; 95% CI 0.26 to 0.89; Szajewska 2015). This systematic review is an update of a previously published Cochrane review (Johnston 2007; Johnston 2011; Goldenberg 2015). This updated Cochrane review identified an additional 11 trials reporting on AAD, thus increasing the precision of our earlier results.
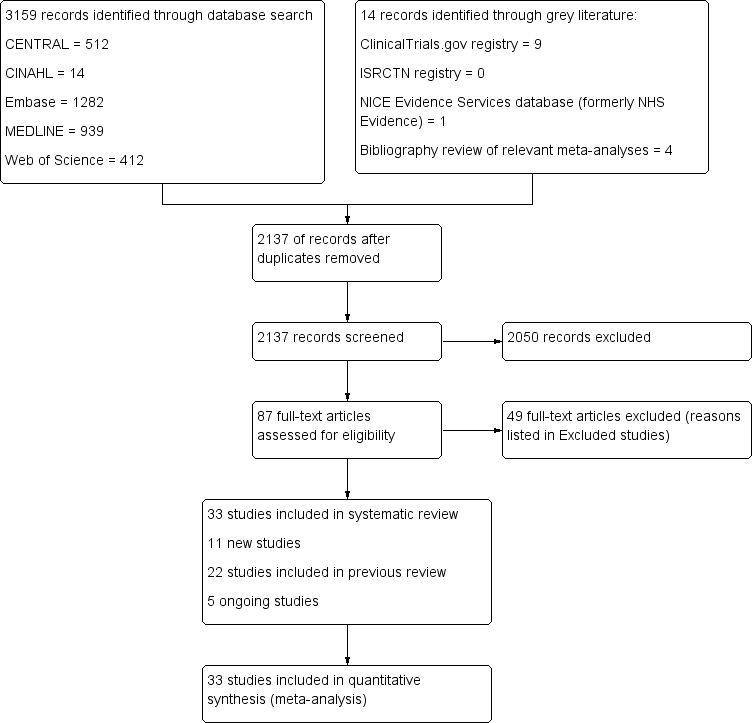
Study flow diagram.

Risk of bias graph: review authors' judgements about each risk of bias item presented as percentages across all included studies.

Risk of bias summary: review authors' judgements about each risk of bias item for each included study.

Funnel plot of comparison: 1 any specific probiotic versus control (placebo, active or no treatment), outcome: 1.6 Incidence of Diarrhea: Complete case ‐ fixed effects

Funnel plot of comparison: 1 Probiotics versus control, outcome: 1.1 Incidence of diarrhea: Complete case.

Forest plot of comparison: 1 Probiotics versus control, outcome: 1.1 Incidence of diarrhea: Complete case.

Comparison 1 Probiotics versus control, Outcome 1 Incidence of diarrhea: Complete case.

Comparison 1 Probiotics versus control, Outcome 2 Incidence of diarrhea: Inpatient versus outpatient.
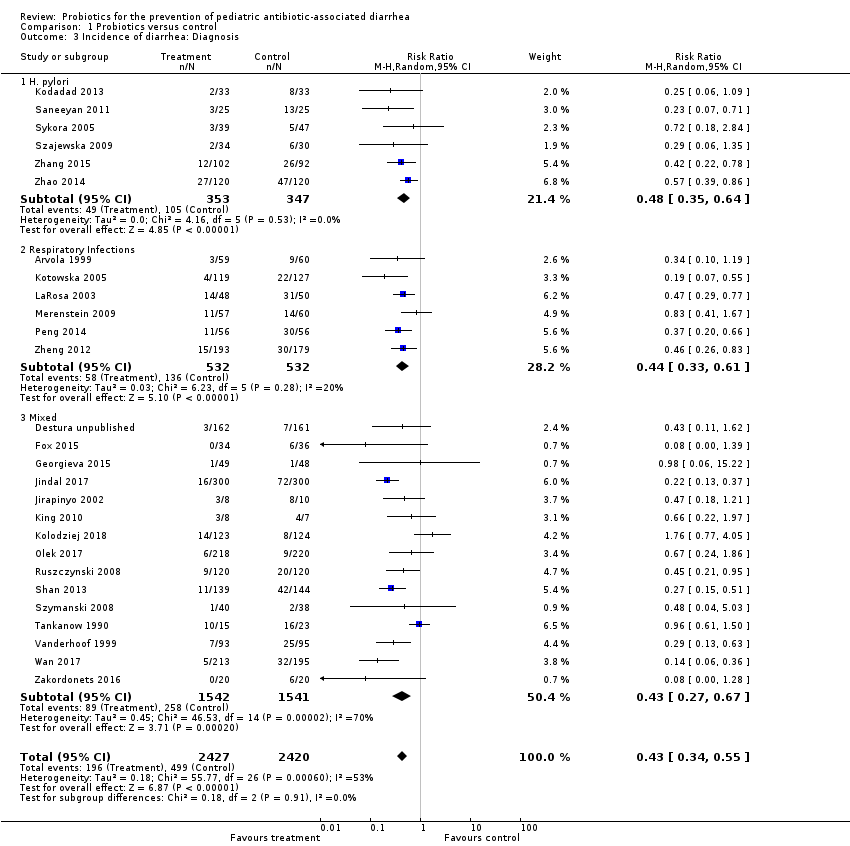
Comparison 1 Probiotics versus control, Outcome 3 Incidence of diarrhea: Diagnosis.

Comparison 1 Probiotics versus control, Outcome 4 Incidence of diarrhea: Probiotic species.
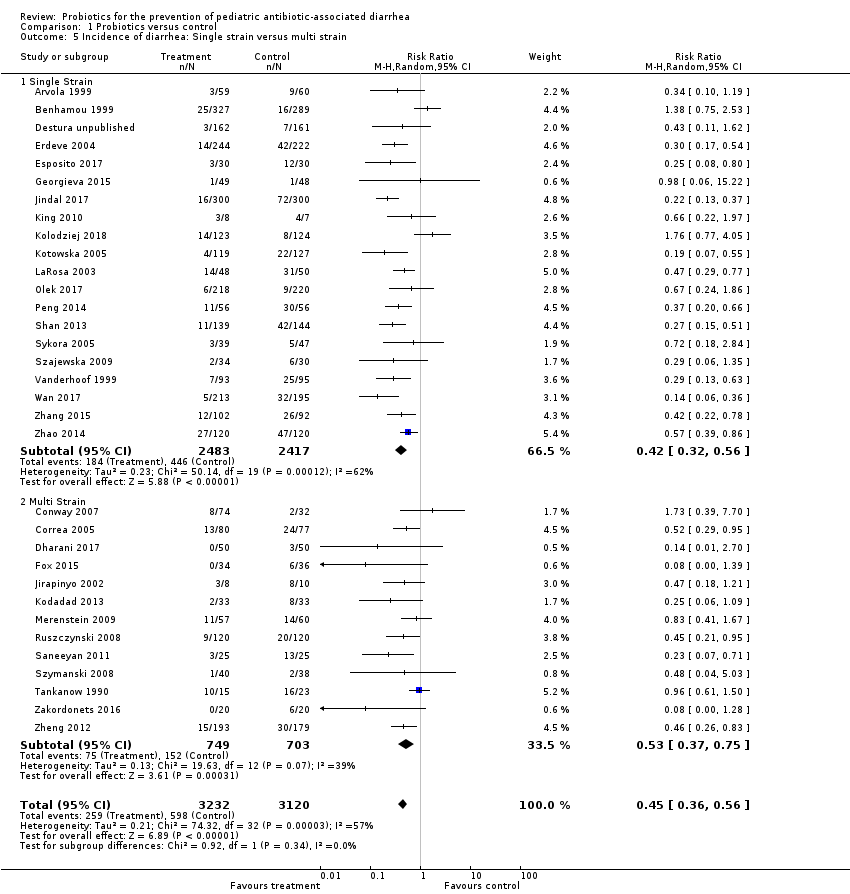
Comparison 1 Probiotics versus control, Outcome 5 Incidence of diarrhea: Single strain versus multi strain.

Comparison 1 Probiotics versus control, Outcome 6 Incidence of diarrhea: Probiotic dose.

Comparison 1 Probiotics versus control, Outcome 7 Incidence of diarrhea: Definition of diarrhea.

Comparison 1 Probiotics versus control, Outcome 8 Incidence of diarrhea: Strictness of definition (mild vs moderate).

Comparison 1 Probiotics versus control, Outcome 9 Incidence of diarrhea: Industry sponsorship.

Comparison 1 Probiotics versus control, Outcome 10 Incidence of diarrhea: Risk of bias.

Comparison 1 Probiotics versus control, Outcome 11 Incidence of diarrhea: age.
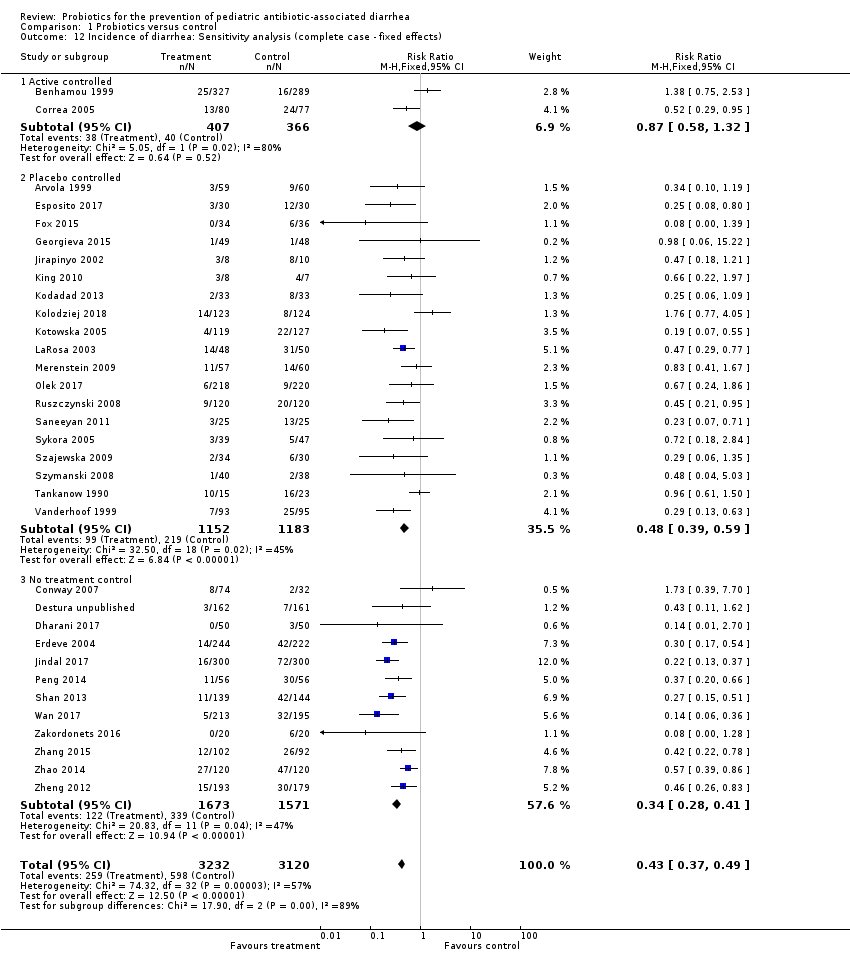
Comparison 1 Probiotics versus control, Outcome 12 Incidence of diarrhea: Sensitivity analysis (complete case ‐ fixed effects).
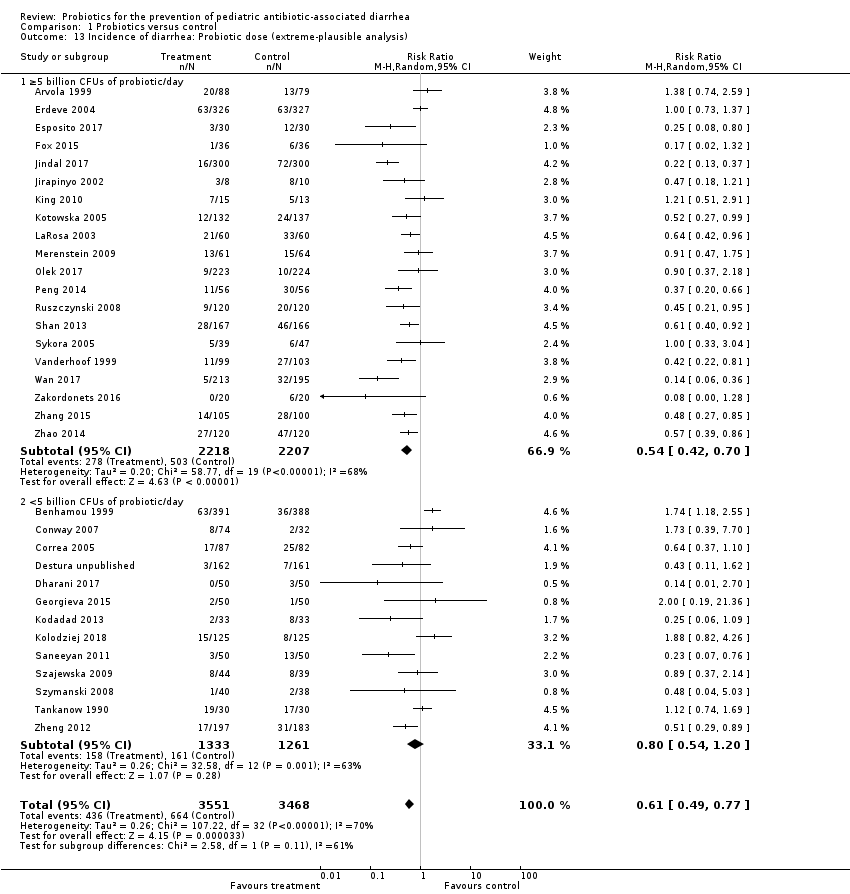
Comparison 1 Probiotics versus control, Outcome 13 Incidence of diarrhea: Probiotic dose (extreme‐plausible analysis).

Comparison 1 Probiotics versus control, Outcome 14 Incidence of diarrhea: Sensitivity analysis (missing outcome data ‐ extreme plausible analysis).

Comparison 1 Probiotics versus control, Outcome 15 Adverse events: Complete case.
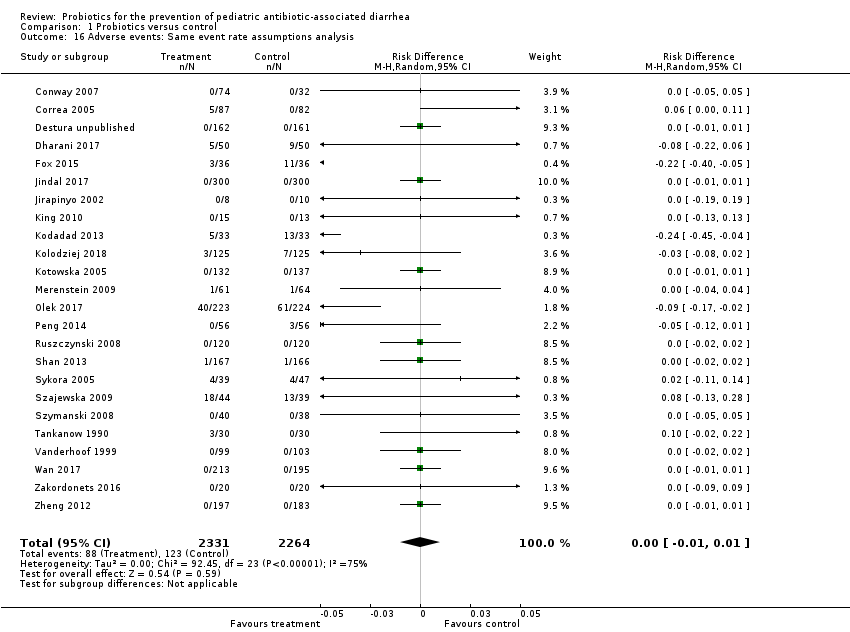
Comparison 1 Probiotics versus control, Outcome 16 Adverse events: Same event rate assumptions analysis.

Comparison 1 Probiotics versus control, Outcome 17 Adverse events: Risk of bias.

Comparison 1 Probiotics versus control, Outcome 18 Mean duration of diarrhea: Complete case.
| Probiotics as an adjunct to antibiotics for the prevention of antibiotic‐associated diarrhea in children | |||||||
| Patient or population: Children receiving antibiotic treatment between 4 and 28 days duration for a variety of infections Settings: Inpatient and outpatient Intervention: Probiotics treatment with either Bacillus spp., Bifidobacterium spp., Clostridium butyricum spp., Lactobacilli spp., Lactococcus spp., Leuconostoc cremoris spp., Saccharomyces spp., or Streptococcus spp., alone or in combination Comparison: Control (placebo or non‐active control) | |||||||
| Outcomes | Anticipated absolute effects * (95% CI) | Relative effect | No of Participants | Quality of the evidence | Comments | ||
| Baseline risk | Corresponding risk | ||||||
| Risk in Control | Risk with Probiotics | Risk Difference | |||||
| Incidence of AAD | 190 per 10001 | 86 per 1000 | 104 fewer AAD cases per 1000 | RR 0.45 (0.36 to 0.56) | 6352 | ⊕⊕⊕⊝ | |
| Incidence of AAD: Probiotic dose (≥5 billion CFUs of probiotics/day) Follow‐up: 5 days to 12 weeks | 190 per 10001 | 70 per 1000 | 120 fewer AAD cases per 1000 | RR 0.37 (0.30 to 0.46) | 4038 | ⊕⊕⊕⊝ | Based on our a priori subgroup analyses, high‐dose probiotics (≥5 billion CFUs/day) are most effective Low dose probiotics (<5 billion CFUs of probiotics per day) were not as effective as high dose probiotics (RR 0.68, 95% CI 0.46 to 1.01; low certainty evidence) |
| Adverse events Follow‐up: 5 days to 4 weeks | 55 per 10007 | 39 per 1000 | 16 fewer adverse events per 1000 | RD ‐0.00 (‐0.01 to 0.01) | 4415 | ⊕⊕⊝⊝ | |
| Duration of diarrhea (days) Follow‐up: 10 days to 12 weeks | MD 0.91 fewer | 1263 | ⊕⊕⊝⊝ | ||||
| Microbiome characteristics Follow‐up: one day to one month after cessation of antibiotic therapy | 40 | ⊕⊝⊝⊝ | |||||
| *The basis for the baseline risk (e.g. the median control group risk across studies) is provided in footnotes. The corresponding risk (and its 95% confidence interval) is based on the assumed risk in the comparison group and the relative effect of the intervention (and its 95% CI). | |||||||
| GRADE Working Group grades of evidence | |||||||
| 1 Baseline/control group risk estimates come from pooled estimates of control group among 33 included studies. | |||||||
| Outcome or subgroup title | No. of studies | No. of participants | Statistical method | Effect size |
| 1 Incidence of diarrhea: Complete case Show forest plot | 33 | 6352 | Risk Ratio (M‐H, Random, 95% CI) | 0.45 [0.36, 0.56] |
| 1.1 Incidence of Diarrhea: Active controlled trials | 2 | 773 | Risk Ratio (M‐H, Random, 95% CI) | 0.85 [0.33, 2.21] |
| 1.2 Incidence of Diarrhea: Placebo controlled trials | 19 | 2335 | Risk Ratio (M‐H, Random, 95% CI) | 0.50 [0.37, 0.67] |
| 1.3 Incidence of Diarrhea: No treatment control | 12 | 3244 | Risk Ratio (M‐H, Random, 95% CI) | 0.35 [0.26, 0.47] |
| 2 Incidence of diarrhea: Inpatient versus outpatient Show forest plot | 21 | 3949 | Risk Ratio (M‐H, Random, 95% CI) | 0.44 [0.31, 0.61] |
| 2.1 Inpatient | 10 | 1469 | Risk Ratio (M‐H, Random, 95% CI) | 0.34 [0.26, 0.45] |
| 2.2 Outpatient | 11 | 2480 | Risk Ratio (M‐H, Random, 95% CI) | 0.54 [0.33, 0.88] |
| 3 Incidence of diarrhea: Diagnosis Show forest plot | 27 | 4847 | Risk Ratio (M‐H, Random, 95% CI) | 0.43 [0.34, 0.55] |
| 3.1 H. pylori | 6 | 700 | Risk Ratio (M‐H, Random, 95% CI) | 0.48 [0.35, 0.64] |
| 3.2 Respiratory Infections | 6 | 1064 | Risk Ratio (M‐H, Random, 95% CI) | 0.44 [0.33, 0.61] |
| 3.3 Mixed | 15 | 3083 | Risk Ratio (M‐H, Random, 95% CI) | 0.43 [0.27, 0.67] |
| 4 Incidence of diarrhea: Probiotic species Show forest plot | 33 | 6352 | Risk Ratio (M‐H, Random, 95% CI) | 0.45 [0.36, 0.56] |
| 4.1 Lactobacillus rhamnosus (strains: GG, ATCC53103 and E/N, Oxy, Pen) | 6 | 686 | Risk Ratio (M‐H, Random, 95% CI) | 0.37 [0.24, 0.55] |
| 4.2 L. acidophilus & L. bulgaricus | 1 | 38 | Risk Ratio (M‐H, Random, 95% CI) | 0.96 [0.61, 1.50] |
| 4.3 L. acidophilus and Bifidobacterium infantis | 1 | 18 | Risk Ratio (M‐H, Random, 95% CI) | 0.47 [0.18, 1.21] |
| 4.4 L. sporogenes | 1 | 98 | Risk Ratio (M‐H, Random, 95% CI) | 0.47 [0.29, 0.77] |
| 4.5 Saccharomyces boulardii | 9 | 3165 | Risk Ratio (M‐H, Random, 95% CI) | 0.36 [0.24, 0.54] |
| 4.6 Bifidobacterium. lactis & Streptococcus. thermophilus | 1 | 157 | Risk Ratio (M‐H, Random, 95% CI) | 0.52 [0.29, 0.95] |
| 4.7 Bacillus clausii | 1 | 323 | Risk Ratio (M‐H, Random, 95% CI) | 0.43 [0.11, 1.62] |
| 4.8 Lactococcus lactis, L. plantarum, L. rhamnosus, L. casei, L. lactis subspecies diacetylactis, Leuconostoc cremoris, Bifidobacterium longum, B. breve, Lactobacillus acidophilus, and Saccharomyces florentinus | 1 | 117 | Risk Ratio (M‐H, Random, 95% CI) | 0.83 [0.41, 1.67] |
| 4.9 Bifidobacterium longum PL03, Lactobacillus rhamnosus KL53A, and Lactobacillus plantarum PL02 | 1 | 78 | Risk Ratio (M‐H, Random, 95% CI) | 0.48 [0.04, 5.03] |
| 4.10 Streptococcus thermophillus, L. acidophilus, B. anamalis subsp. lactus, L. delbrueckii subsp. bulgaris | 1 | 106 | Risk Ratio (M‐H, Random, 95% CI) | 1.73 [0.39, 7.70] |
| 4.11 Lactobacillus rhamnosus GG, Bifidobacterium animalis subsp. Lactis Bv‐12, L. acidophilus LA‐5 | 1 | 70 | Risk Ratio (M‐H, Random, 95% CI) | 0.08 [0.00, 1.39] |
| 4.12 Lactobasillus casei, Lactobacillus acidophilus, Lactobasillus reuteri, Lactobasillus bulgaricus, Streptococcus, Bifidobacterium bifidum, Bifidobacterium infantis | 1 | 50 | Risk Ratio (M‐H, Random, 95% CI) | 0.23 [0.07, 0.71] |
| 4.13 Lactobacillus reuteri DSM 17938 | 2 | 344 | Risk Ratio (M‐H, Random, 95% CI) | 1.68 [0.76, 3.72] |
| 4.14 Lactobacillus acidophilus, Lactobacillus rhamnosus, Lactobacillus bulgaricus, Lactobacillus casei, Streptococcus thermophilus, Bifidobacterium infantis and Bifidobacterium breve | 1 | 66 | Risk Ratio (M‐H, Random, 95% CI) | 0.25 [0.06, 1.09] |
| 4.15 L. casei DN‐114 001 | 1 | 86 | Risk Ratio (M‐H, Random, 95% CI) | 0.72 [0.18, 2.84] |
| 4.16 Clostridium Butyricum and Bifidobacterium | 1 | 372 | Risk Ratio (M‐H, Random, 95% CI) | 0.46 [0.26, 0.83] |
| 4.17 Lactobacillus plantarum DSM 9843 | 1 | 438 | Risk Ratio (M‐H, Random, 95% CI) | 0.67 [0.24, 1.86] |
| 4.18 Lactobacilli and Lactococci, Bifidobacterium, propionate‐oxidising bacteria and acetic acid bacteria | 1 | 40 | Risk Ratio (M‐H, Random, 95% CI) | 0.08 [0.00, 1.28] |
| 4.19 Lactobacillus sporegens, Streptococcus faecalis, clostridium butyricum and Bacillus mesentericus | 1 | 100 | Risk Ratio (M‐H, Random, 95% CI) | 0.14 [0.01, 2.70] |
| 5 Incidence of diarrhea: Single strain versus multi strain Show forest plot | 33 | 6352 | Risk Ratio (M‐H, Random, 95% CI) | 0.45 [0.36, 0.56] |
| 5.1 Single Strain | 20 | 4900 | Risk Ratio (M‐H, Random, 95% CI) | 0.42 [0.32, 0.56] |
| 5.2 Multi Strain | 13 | 1452 | Risk Ratio (M‐H, Random, 95% CI) | 0.53 [0.37, 0.75] |
| 6 Incidence of diarrhea: Probiotic dose Show forest plot | 32 | 6252 | Risk Ratio (M‐H, Random, 95% CI) | 0.45 [0.36, 0.57] |
| 6.1 ≥5 billion CFUs of probiotic/day | 20 | 4038 | Risk Ratio (M‐H, Random, 95% CI) | 0.37 [0.30, 0.46] |
| 6.2 <5 billion CFUs of probiotic/day | 12 | 2214 | Risk Ratio (M‐H, Random, 95% CI) | 0.68 [0.46, 1.01] |
| 7 Incidence of diarrhea: Definition of diarrhea Show forest plot | 27 | 6499 | Risk Ratio (M‐H, Random, 95% CI) | 0.41 [0.31, 0.54] |
| 7.1 3 or more watery/liquid stools for more than 2 days | 2 | 317 | Risk Ratio (M‐H, Random, 95% CI) | 0.50 [0.02, 11.75] |
| 7.2 3 or more loose/watery/liquid stools per day for at least 2 consecutive days | 13 | 1873 | Risk Ratio (M‐H, Random, 95% CI) | 0.36 [0.25, 0.50] |
| 7.3 ≥3 watery/liquid stools per 24 hours | 9 | 2748 | Risk Ratio (M‐H, Random, 95% CI) | 0.48 [0.31, 0.76] |
| 7.4 ≥2 liquid stools per day on at least 2 occasions during study | 2 | 258 | Risk Ratio (M‐H, Random, 95% CI) | 0.24 [0.09, 0.65] |
| 7.5 ≥2 loose/watery/liquid stools for more than 2 days | 2 | 478 | Risk Ratio (M‐H, Random, 95% CI) | 0.12 [0.05, 0.27] |
| 7.6 ≥2 liquid stools per 24 hr | 2 | 345 | Risk Ratio (M‐H, Random, 95% CI) | 0.65 [0.32, 1.30] |
| 7.7 ≥1 abnormally loose bowel movement per 24 hrs | 1 | 38 | Risk Ratio (M‐H, Random, 95% CI) | 0.96 [0.61, 1.50] |
| 7.8 2 or more BM over the patient's normal | 1 | 372 | Risk Ratio (M‐H, Random, 95% CI) | 0.46 [0.26, 0.83] |
| 7.9 "Any of Above (Fox)" | 1 | 70 | Risk Ratio (M‐H, Random, 95% CI) | 0.04 [0.01, 0.27] |
| 8 Incidence of diarrhea: Strictness of definition (mild vs moderate) Show forest plot | 25 | 5408 | Risk Ratio (M‐H, Random, 95% CI) | 0.41 [0.32, 0.53] |
| 8.1 Moderate diarrhea | 20 | 4304 | Risk Ratio (M‐H, Random, 95% CI) | 0.40 [0.31, 0.53] |
| 8.2 Mild diarrhea | 5 | 1104 | Risk Ratio (M‐H, Random, 95% CI) | 0.41 [0.22, 0.77] |
| 9 Incidence of diarrhea: Industry sponsorship Show forest plot | 17 | 2942 | Risk Ratio (M‐H, Random, 95% CI) | 0.51 [0.34, 0.75] |
| 9.1 Industry Sponsored | 9 | 1627 | Risk Ratio (M‐H, Random, 95% CI) | 0.58 [0.40, 0.82] |
| 9.2 Non‐Industry | 8 | 1315 | Risk Ratio (M‐H, Random, 95% CI) | 0.43 [0.18, 1.00] |
| 10 Incidence of diarrhea: Risk of bias Show forest plot | 33 | 6352 | Risk Ratio (M‐H, Random, 95% CI) | 0.45 [0.36, 0.56] |
| 10.1 Low Risk | 13 | 2170 | Risk Ratio (M‐H, Random, 95% CI) | 0.53 [0.37, 0.77] |
| 10.2 High Risk | 20 | 4182 | Risk Ratio (M‐H, Random, 95% CI) | 0.42 [0.31, 0.56] |
| 11 Incidence of diarrhea: age Show forest plot | 32 | 5752 | Risk Ratio (M‐H, Random, 95% CI) | 0.47 [0.37, 0.58] |
| 11.1 0‐2 years (≤ 24 months) | 6 | 1127 | Risk Ratio (M‐H, Random, 95% CI) | 0.37 [0.26, 0.53] |
| 11.2 > 2 years (>24 months) | 26 | 4625 | Risk Ratio (M‐H, Random, 95% CI) | 0.50 [0.39, 0.66] |
| 12 Incidence of diarrhea: Sensitivity analysis (complete case ‐ fixed effects) Show forest plot | 33 | 6352 | Risk Ratio (M‐H, Fixed, 95% CI) | 0.43 [0.37, 0.49] |
| 12.1 Active controlled | 2 | 773 | Risk Ratio (M‐H, Fixed, 95% CI) | 0.87 [0.58, 1.32] |
| 12.2 Placebo controlled | 19 | 2335 | Risk Ratio (M‐H, Fixed, 95% CI) | 0.48 [0.39, 0.59] |
| 12.3 No treatment control | 12 | 3244 | Risk Ratio (M‐H, Fixed, 95% CI) | 0.34 [0.28, 0.41] |
| 13 Incidence of diarrhea: Probiotic dose (extreme‐plausible analysis) Show forest plot | 33 | 7019 | Risk Ratio (M‐H, Random, 95% CI) | 0.61 [0.49, 0.77] |
| 13.1 ≥5 billion CFUs of probiotic/day | 20 | 4425 | Risk Ratio (M‐H, Random, 95% CI) | 0.54 [0.42, 0.70] |
| 13.2 <5 billion CFUs of probiotic/day | 13 | 2594 | Risk Ratio (M‐H, Random, 95% CI) | 0.80 [0.54, 1.20] |
| 14 Incidence of diarrhea: Sensitivity analysis (missing outcome data ‐ extreme plausible analysis) Show forest plot | 33 | 7019 | Risk Ratio (M‐H, Random, 95% CI) | 0.61 [0.49, 0.77] |
| 14.1 Active controlled | 2 | 948 | Risk Ratio (M‐H, Random, 95% CI) | 1.07 [0.40, 2.86] |
| 14.2 Placebo controlled | 19 | 2571 | Risk Ratio (M‐H, Random, 95% CI) | 0.71 [0.54, 0.92] |
| 14.3 No treatment control | 12 | 3500 | Risk Ratio (M‐H, Random, 95% CI) | 0.46 [0.31, 0.66] |
| 15 Adverse events: Complete case Show forest plot | 24 | 4415 | Risk Difference (M‐H, Random, 95% CI) | ‐0.00 [‐0.01, 0.01] |
| 16 Adverse events: Same event rate assumptions analysis Show forest plot | 24 | 4595 | Risk Difference (M‐H, Random, 95% CI) | ‐0.00 [‐0.01, 0.01] |
| 17 Adverse events: Risk of bias Show forest plot | 24 | 4415 | Risk Difference (M‐H, Random, 95% CI) | ‐0.00 [‐0.01, 0.01] |
| 17.1 Low RoB | 11 | 1978 | Risk Difference (M‐H, Random, 95% CI) | ‐0.02 [‐0.05, 0.01] |
| 17.2 High/Unclear | 13 | 2437 | Risk Difference (M‐H, Random, 95% CI) | 0.00 [‐0.00, 0.00] |
| 18 Mean duration of diarrhea: Complete case Show forest plot | 8 | 1263 | Mean Difference (IV, Random, 95% CI) | ‐0.91 [‐1.38, ‐0.44] |