Probiotics for the prevention of pediatric antibiotic‐associated diarrhea
Information
- DOI:
- https://doi.org/10.1002/14651858.CD004827.pub5Copy DOI

- Database:
-
- Cochrane Database of Systematic Reviews
- Version published:
-
- 30 April 2019see what's new
- Type:
-
- Intervention
- Stage:
-
- Review
- Cochrane Editorial Group:
-
Cochrane Gut Group
- Copyright:
-
- Copyright © 2019 The Cochrane Collaboration. Published by John Wiley & Sons, Ltd.
Article metrics
Altmetric:
Cited by:
Authors
Contributions of authors
This version of the review:
Qin Guo: Screening, inclusion/exclusion, data extraction, quality assessment, data analysis, manuscript preparation, administrative and technical support.
Joshua Z. Goldenberg: Concept, screening, inclusion/exclusion, data extraction, quality assessment, data analysis, manuscript preparation, administrative and technical support.
Claire Humphrey: Data extraction, quality assessment, manuscript preparation.
Regina El Dib: Screening, data interpretation, manuscript preparation.
Bradley C. Johnston: Concept, developed review protocol, search strategy, screening, inclusion/exclusion, data extraction, quality assessment, data analysis, manuscript preparation, administrative and technical support.
Previous versions of the review: Please refer to the 2007, 2011 and 2015 versions of the Cochrane review for previous contributions (Johnston 2007; Johnston 2011; Goldenberg 2015).
Sources of support
Internal sources
-
No sources of support supplied
External sources
-
Hospital for Sick Kids Foundation, Toronto, Ontario, Canada.
Declarations of interest
Qin Guo: None known.
Joshua Z Goldenberg: None known.
Claire Humphrey: None known.
Regina El Dib: None known.
Bradley C Johnston: None known.
Acknowledgements
We would like to thank John K MacDonald (Cochrane IBD Review Group) for his excellent ongoing support and our colleagues (Guoguang Xiao) that verified our data extraction of the Chinese studies. We also wish to thank Leah Boulos at the Martime SPOR Support Unit for revising the search strategy and running the updated search.
Funding for the Cochrane IBD Group (May 1, 2017 ‐ April 30, 2022) has been provided by Crohn's and Colitis Canada (CCC).
Version history
| Published | Title | Stage | Authors | Version |
| 2019 Apr 30 | Probiotics for the prevention of pediatric antibiotic‐associated diarrhea | Review | Qin Guo, Joshua Z Goldenberg, Claire Humphrey, Regina El Dib, Bradley C Johnston | |
| 2015 Dec 22 | Probiotics for the prevention of pediatric antibiotic‐associated diarrhea | Review | Joshua Z Goldenberg, Lyubov Lytvyn, Justin Steurich, Patricia Parkin, Sanjay Mahant, Bradley C Johnston | |
| 2011 Nov 09 | Probiotics for the prevention of pediatric antibiotic‐associated diarrhea | Review | Bradley C Johnston, Joshua Z Goldenberg, Per O Vandvik, Xin Sun, Gordon H Guyatt | |
| 2007 Apr 18 | Probiotics for the prevention of pediatric antibiotic‐associated diarrhea | Review | Brad C Johnston, Alison L Supina, Maria Ospina, Sunita Vohra | |
| 2004 Apr 19 | Probiotics for the prevention of pediatric antibiotic‐associated diarrhea | Protocol | Brad C. Johnston, Natasha Wiebe, Ellen Crumley, Alison L Supina, Sunita Vohra | |
Differences between protocol and review
1. In our previous 2015 review, we abstracted data on mean stool frequency and mean stool consistency. Since there were very limited data available on these outcomes (i.e. only 4 studies reported stool frequency, none reported stool consistency independently) and given that this outcome overlaps with AAD (a more patient important outcome), we have removed these outcomes. In this update review, we have included microbiome characteristics as an outcome given the clinical communities interest in the impact of antibiotics and probiotics on the microbiome.
2. In our previous 2015 review, we assessed the effectiveness of probiotics for AAD prevention based on the definition of diarrhea using two subgroups: 1. strictness of definition, 2. definition of diarrhea. For 'strictness of diarrhea', we previously used two categories '> or = to moderate' versus '< moderate'. For this update, we have revised the wording to 'moderate' versus 'mild' AAD.
3. In our previous 2015 review, we referred to diagnosis, inpatient versus outpatient, single versus multiple species and industry sponsorship as post hoc subgroup analyses as these were generated based on peer‐review feedback. In this update review, we have considered each of these as a priori subgroups. We now have nine a priori subgroups in total.
4. Based on prospective observational data that provides the best estimate of the baseline risk of AAD in children, in this review we have added one new post‐hoc subgroup on age < 24 months versus > 24 months.
Notes
To assess risk of bias for blinding and to generate Figure 3, we collapsed both blinding domains (participants/personnel and outcome assessors). If both domains were low risk of bias, the risk of bias for blinding was low. If one domain was high and one low, we assumed risk of bias for blinding was high overall. If one domain was low and one unclear, we assumed risk of bias for blinding was low overall.
Keywords
MeSH
Medical Subject Headings (MeSH) Keywords
Medical Subject Headings Check Words
Adolescent; Child; Child, Preschool; Female; Humans; Infant; Infant, Newborn; Male;
PICOs


Risk of bias graph: review authors' judgements about each risk of bias item presented as percentages across all included studies.

Risk of bias summary: review authors' judgements about each risk of bias item for each included study.

Funnel plot of comparison: 1 any specific probiotic versus control (placebo, active or no treatment), outcome: 1.6 Incidence of Diarrhea: Complete case ‐ fixed effects
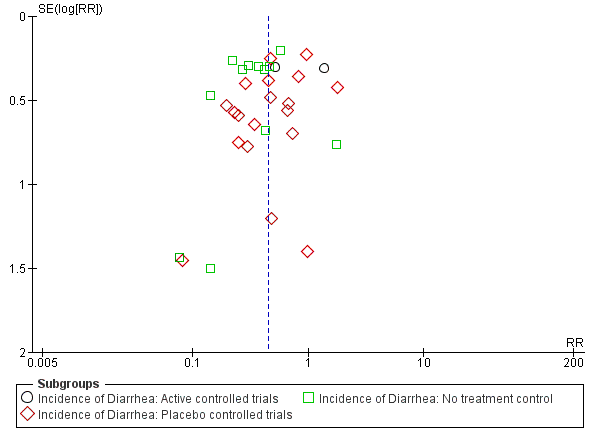
Funnel plot of comparison: 1 Probiotics versus control, outcome: 1.1 Incidence of diarrhea: Complete case.
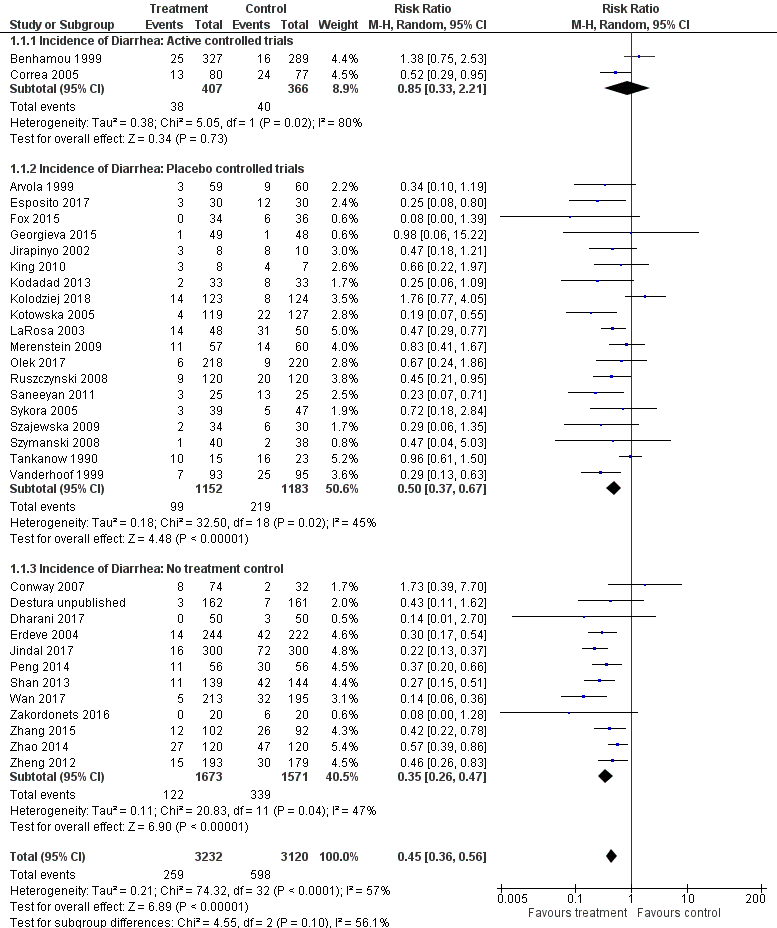
Forest plot of comparison: 1 Probiotics versus control, outcome: 1.1 Incidence of diarrhea: Complete case.

Comparison 1 Probiotics versus control, Outcome 1 Incidence of diarrhea: Complete case.

Comparison 1 Probiotics versus control, Outcome 2 Incidence of diarrhea: Inpatient versus outpatient.

Comparison 1 Probiotics versus control, Outcome 3 Incidence of diarrhea: Diagnosis.

Comparison 1 Probiotics versus control, Outcome 4 Incidence of diarrhea: Probiotic species.

Comparison 1 Probiotics versus control, Outcome 5 Incidence of diarrhea: Single strain versus multi strain.

Comparison 1 Probiotics versus control, Outcome 6 Incidence of diarrhea: Probiotic dose.

Comparison 1 Probiotics versus control, Outcome 7 Incidence of diarrhea: Definition of diarrhea.

Comparison 1 Probiotics versus control, Outcome 8 Incidence of diarrhea: Strictness of definition (mild vs moderate).

Comparison 1 Probiotics versus control, Outcome 9 Incidence of diarrhea: Industry sponsorship.

Comparison 1 Probiotics versus control, Outcome 10 Incidence of diarrhea: Risk of bias.

Comparison 1 Probiotics versus control, Outcome 11 Incidence of diarrhea: age.

Comparison 1 Probiotics versus control, Outcome 12 Incidence of diarrhea: Sensitivity analysis (complete case ‐ fixed effects).

Comparison 1 Probiotics versus control, Outcome 13 Incidence of diarrhea: Probiotic dose (extreme‐plausible analysis).

Comparison 1 Probiotics versus control, Outcome 14 Incidence of diarrhea: Sensitivity analysis (missing outcome data ‐ extreme plausible analysis).

Comparison 1 Probiotics versus control, Outcome 15 Adverse events: Complete case.

Comparison 1 Probiotics versus control, Outcome 16 Adverse events: Same event rate assumptions analysis.

Comparison 1 Probiotics versus control, Outcome 17 Adverse events: Risk of bias.

Comparison 1 Probiotics versus control, Outcome 18 Mean duration of diarrhea: Complete case.
| Probiotics as an adjunct to antibiotics for the prevention of antibiotic‐associated diarrhea in children | |||||||
| Patient or population: Children receiving antibiotic treatment between 4 and 28 days duration for a variety of infections Settings: Inpatient and outpatient Intervention: Probiotics treatment with either Bacillus spp., Bifidobacterium spp., Clostridium butyricum spp., Lactobacilli spp., Lactococcus spp., Leuconostoc cremoris spp., Saccharomyces spp., or Streptococcus spp., alone or in combination Comparison: Control (placebo or non‐active control) | |||||||
| Outcomes | Anticipated absolute effects * (95% CI) | Relative effect | No of Participants | Quality of the evidence | Comments | ||
| Baseline risk | Corresponding risk | ||||||
| Risk in Control | Risk with Probiotics | Risk Difference | |||||
| Incidence of AAD | 190 per 10001 | 86 per 1000 | 104 fewer AAD cases per 1000 | RR 0.45 (0.36 to 0.56) | 6352 | ⊕⊕⊕⊝ | |
| Incidence of AAD: Probiotic dose (≥5 billion CFUs of probiotics/day) Follow‐up: 5 days to 12 weeks | 190 per 10001 | 70 per 1000 | 120 fewer AAD cases per 1000 | RR 0.37 (0.30 to 0.46) | 4038 | ⊕⊕⊕⊝ | Based on our a priori subgroup analyses, high‐dose probiotics (≥5 billion CFUs/day) are most effective Low dose probiotics (<5 billion CFUs of probiotics per day) were not as effective as high dose probiotics (RR 0.68, 95% CI 0.46 to 1.01; low certainty evidence) |
| Adverse events Follow‐up: 5 days to 4 weeks | 55 per 10007 | 39 per 1000 | 16 fewer adverse events per 1000 | RD ‐0.00 (‐0.01 to 0.01) | 4415 | ⊕⊕⊝⊝ | |
| Duration of diarrhea (days) Follow‐up: 10 days to 12 weeks | MD 0.91 fewer | 1263 | ⊕⊕⊝⊝ | ||||
| Microbiome characteristics Follow‐up: one day to one month after cessation of antibiotic therapy | 40 | ⊕⊝⊝⊝ | |||||
| *The basis for the baseline risk (e.g. the median control group risk across studies) is provided in footnotes. The corresponding risk (and its 95% confidence interval) is based on the assumed risk in the comparison group and the relative effect of the intervention (and its 95% CI). | |||||||
| GRADE Working Group grades of evidence | |||||||
| 1 Baseline/control group risk estimates come from pooled estimates of control group among 33 included studies. | |||||||
| Outcome or subgroup title | No. of studies | No. of participants | Statistical method | Effect size |
| 1 Incidence of diarrhea: Complete case Show forest plot | 33 | 6352 | Risk Ratio (M‐H, Random, 95% CI) | 0.45 [0.36, 0.56] |
| 1.1 Incidence of Diarrhea: Active controlled trials | 2 | 773 | Risk Ratio (M‐H, Random, 95% CI) | 0.85 [0.33, 2.21] |
| 1.2 Incidence of Diarrhea: Placebo controlled trials | 19 | 2335 | Risk Ratio (M‐H, Random, 95% CI) | 0.50 [0.37, 0.67] |
| 1.3 Incidence of Diarrhea: No treatment control | 12 | 3244 | Risk Ratio (M‐H, Random, 95% CI) | 0.35 [0.26, 0.47] |
| 2 Incidence of diarrhea: Inpatient versus outpatient Show forest plot | 21 | 3949 | Risk Ratio (M‐H, Random, 95% CI) | 0.44 [0.31, 0.61] |
| 2.1 Inpatient | 10 | 1469 | Risk Ratio (M‐H, Random, 95% CI) | 0.34 [0.26, 0.45] |
| 2.2 Outpatient | 11 | 2480 | Risk Ratio (M‐H, Random, 95% CI) | 0.54 [0.33, 0.88] |
| 3 Incidence of diarrhea: Diagnosis Show forest plot | 27 | 4847 | Risk Ratio (M‐H, Random, 95% CI) | 0.43 [0.34, 0.55] |
| 3.1 H. pylori | 6 | 700 | Risk Ratio (M‐H, Random, 95% CI) | 0.48 [0.35, 0.64] |
| 3.2 Respiratory Infections | 6 | 1064 | Risk Ratio (M‐H, Random, 95% CI) | 0.44 [0.33, 0.61] |
| 3.3 Mixed | 15 | 3083 | Risk Ratio (M‐H, Random, 95% CI) | 0.43 [0.27, 0.67] |
| 4 Incidence of diarrhea: Probiotic species Show forest plot | 33 | 6352 | Risk Ratio (M‐H, Random, 95% CI) | 0.45 [0.36, 0.56] |
| 4.1 Lactobacillus rhamnosus (strains: GG, ATCC53103 and E/N, Oxy, Pen) | 6 | 686 | Risk Ratio (M‐H, Random, 95% CI) | 0.37 [0.24, 0.55] |
| 4.2 L. acidophilus & L. bulgaricus | 1 | 38 | Risk Ratio (M‐H, Random, 95% CI) | 0.96 [0.61, 1.50] |
| 4.3 L. acidophilus and Bifidobacterium infantis | 1 | 18 | Risk Ratio (M‐H, Random, 95% CI) | 0.47 [0.18, 1.21] |
| 4.4 L. sporogenes | 1 | 98 | Risk Ratio (M‐H, Random, 95% CI) | 0.47 [0.29, 0.77] |
| 4.5 Saccharomyces boulardii | 9 | 3165 | Risk Ratio (M‐H, Random, 95% CI) | 0.36 [0.24, 0.54] |
| 4.6 Bifidobacterium. lactis & Streptococcus. thermophilus | 1 | 157 | Risk Ratio (M‐H, Random, 95% CI) | 0.52 [0.29, 0.95] |
| 4.7 Bacillus clausii | 1 | 323 | Risk Ratio (M‐H, Random, 95% CI) | 0.43 [0.11, 1.62] |
| 4.8 Lactococcus lactis, L. plantarum, L. rhamnosus, L. casei, L. lactis subspecies diacetylactis, Leuconostoc cremoris, Bifidobacterium longum, B. breve, Lactobacillus acidophilus, and Saccharomyces florentinus | 1 | 117 | Risk Ratio (M‐H, Random, 95% CI) | 0.83 [0.41, 1.67] |
| 4.9 Bifidobacterium longum PL03, Lactobacillus rhamnosus KL53A, and Lactobacillus plantarum PL02 | 1 | 78 | Risk Ratio (M‐H, Random, 95% CI) | 0.48 [0.04, 5.03] |
| 4.10 Streptococcus thermophillus, L. acidophilus, B. anamalis subsp. lactus, L. delbrueckii subsp. bulgaris | 1 | 106 | Risk Ratio (M‐H, Random, 95% CI) | 1.73 [0.39, 7.70] |
| 4.11 Lactobacillus rhamnosus GG, Bifidobacterium animalis subsp. Lactis Bv‐12, L. acidophilus LA‐5 | 1 | 70 | Risk Ratio (M‐H, Random, 95% CI) | 0.08 [0.00, 1.39] |
| 4.12 Lactobasillus casei, Lactobacillus acidophilus, Lactobasillus reuteri, Lactobasillus bulgaricus, Streptococcus, Bifidobacterium bifidum, Bifidobacterium infantis | 1 | 50 | Risk Ratio (M‐H, Random, 95% CI) | 0.23 [0.07, 0.71] |
| 4.13 Lactobacillus reuteri DSM 17938 | 2 | 344 | Risk Ratio (M‐H, Random, 95% CI) | 1.68 [0.76, 3.72] |
| 4.14 Lactobacillus acidophilus, Lactobacillus rhamnosus, Lactobacillus bulgaricus, Lactobacillus casei, Streptococcus thermophilus, Bifidobacterium infantis and Bifidobacterium breve | 1 | 66 | Risk Ratio (M‐H, Random, 95% CI) | 0.25 [0.06, 1.09] |
| 4.15 L. casei DN‐114 001 | 1 | 86 | Risk Ratio (M‐H, Random, 95% CI) | 0.72 [0.18, 2.84] |
| 4.16 Clostridium Butyricum and Bifidobacterium | 1 | 372 | Risk Ratio (M‐H, Random, 95% CI) | 0.46 [0.26, 0.83] |
| 4.17 Lactobacillus plantarum DSM 9843 | 1 | 438 | Risk Ratio (M‐H, Random, 95% CI) | 0.67 [0.24, 1.86] |
| 4.18 Lactobacilli and Lactococci, Bifidobacterium, propionate‐oxidising bacteria and acetic acid bacteria | 1 | 40 | Risk Ratio (M‐H, Random, 95% CI) | 0.08 [0.00, 1.28] |
| 4.19 Lactobacillus sporegens, Streptococcus faecalis, clostridium butyricum and Bacillus mesentericus | 1 | 100 | Risk Ratio (M‐H, Random, 95% CI) | 0.14 [0.01, 2.70] |
| 5 Incidence of diarrhea: Single strain versus multi strain Show forest plot | 33 | 6352 | Risk Ratio (M‐H, Random, 95% CI) | 0.45 [0.36, 0.56] |
| 5.1 Single Strain | 20 | 4900 | Risk Ratio (M‐H, Random, 95% CI) | 0.42 [0.32, 0.56] |
| 5.2 Multi Strain | 13 | 1452 | Risk Ratio (M‐H, Random, 95% CI) | 0.53 [0.37, 0.75] |
| 6 Incidence of diarrhea: Probiotic dose Show forest plot | 32 | 6252 | Risk Ratio (M‐H, Random, 95% CI) | 0.45 [0.36, 0.57] |
| 6.1 ≥5 billion CFUs of probiotic/day | 20 | 4038 | Risk Ratio (M‐H, Random, 95% CI) | 0.37 [0.30, 0.46] |
| 6.2 <5 billion CFUs of probiotic/day | 12 | 2214 | Risk Ratio (M‐H, Random, 95% CI) | 0.68 [0.46, 1.01] |
| 7 Incidence of diarrhea: Definition of diarrhea Show forest plot | 27 | 6499 | Risk Ratio (M‐H, Random, 95% CI) | 0.41 [0.31, 0.54] |
| 7.1 3 or more watery/liquid stools for more than 2 days | 2 | 317 | Risk Ratio (M‐H, Random, 95% CI) | 0.50 [0.02, 11.75] |
| 7.2 3 or more loose/watery/liquid stools per day for at least 2 consecutive days | 13 | 1873 | Risk Ratio (M‐H, Random, 95% CI) | 0.36 [0.25, 0.50] |
| 7.3 ≥3 watery/liquid stools per 24 hours | 9 | 2748 | Risk Ratio (M‐H, Random, 95% CI) | 0.48 [0.31, 0.76] |
| 7.4 ≥2 liquid stools per day on at least 2 occasions during study | 2 | 258 | Risk Ratio (M‐H, Random, 95% CI) | 0.24 [0.09, 0.65] |
| 7.5 ≥2 loose/watery/liquid stools for more than 2 days | 2 | 478 | Risk Ratio (M‐H, Random, 95% CI) | 0.12 [0.05, 0.27] |
| 7.6 ≥2 liquid stools per 24 hr | 2 | 345 | Risk Ratio (M‐H, Random, 95% CI) | 0.65 [0.32, 1.30] |
| 7.7 ≥1 abnormally loose bowel movement per 24 hrs | 1 | 38 | Risk Ratio (M‐H, Random, 95% CI) | 0.96 [0.61, 1.50] |
| 7.8 2 or more BM over the patient's normal | 1 | 372 | Risk Ratio (M‐H, Random, 95% CI) | 0.46 [0.26, 0.83] |
| 7.9 "Any of Above (Fox)" | 1 | 70 | Risk Ratio (M‐H, Random, 95% CI) | 0.04 [0.01, 0.27] |
| 8 Incidence of diarrhea: Strictness of definition (mild vs moderate) Show forest plot | 25 | 5408 | Risk Ratio (M‐H, Random, 95% CI) | 0.41 [0.32, 0.53] |
| 8.1 Moderate diarrhea | 20 | 4304 | Risk Ratio (M‐H, Random, 95% CI) | 0.40 [0.31, 0.53] |
| 8.2 Mild diarrhea | 5 | 1104 | Risk Ratio (M‐H, Random, 95% CI) | 0.41 [0.22, 0.77] |
| 9 Incidence of diarrhea: Industry sponsorship Show forest plot | 17 | 2942 | Risk Ratio (M‐H, Random, 95% CI) | 0.51 [0.34, 0.75] |
| 9.1 Industry Sponsored | 9 | 1627 | Risk Ratio (M‐H, Random, 95% CI) | 0.58 [0.40, 0.82] |
| 9.2 Non‐Industry | 8 | 1315 | Risk Ratio (M‐H, Random, 95% CI) | 0.43 [0.18, 1.00] |
| 10 Incidence of diarrhea: Risk of bias Show forest plot | 33 | 6352 | Risk Ratio (M‐H, Random, 95% CI) | 0.45 [0.36, 0.56] |
| 10.1 Low Risk | 13 | 2170 | Risk Ratio (M‐H, Random, 95% CI) | 0.53 [0.37, 0.77] |
| 10.2 High Risk | 20 | 4182 | Risk Ratio (M‐H, Random, 95% CI) | 0.42 [0.31, 0.56] |
| 11 Incidence of diarrhea: age Show forest plot | 32 | 5752 | Risk Ratio (M‐H, Random, 95% CI) | 0.47 [0.37, 0.58] |
| 11.1 0‐2 years (≤ 24 months) | 6 | 1127 | Risk Ratio (M‐H, Random, 95% CI) | 0.37 [0.26, 0.53] |
| 11.2 > 2 years (>24 months) | 26 | 4625 | Risk Ratio (M‐H, Random, 95% CI) | 0.50 [0.39, 0.66] |
| 12 Incidence of diarrhea: Sensitivity analysis (complete case ‐ fixed effects) Show forest plot | 33 | 6352 | Risk Ratio (M‐H, Fixed, 95% CI) | 0.43 [0.37, 0.49] |
| 12.1 Active controlled | 2 | 773 | Risk Ratio (M‐H, Fixed, 95% CI) | 0.87 [0.58, 1.32] |
| 12.2 Placebo controlled | 19 | 2335 | Risk Ratio (M‐H, Fixed, 95% CI) | 0.48 [0.39, 0.59] |
| 12.3 No treatment control | 12 | 3244 | Risk Ratio (M‐H, Fixed, 95% CI) | 0.34 [0.28, 0.41] |
| 13 Incidence of diarrhea: Probiotic dose (extreme‐plausible analysis) Show forest plot | 33 | 7019 | Risk Ratio (M‐H, Random, 95% CI) | 0.61 [0.49, 0.77] |
| 13.1 ≥5 billion CFUs of probiotic/day | 20 | 4425 | Risk Ratio (M‐H, Random, 95% CI) | 0.54 [0.42, 0.70] |
| 13.2 <5 billion CFUs of probiotic/day | 13 | 2594 | Risk Ratio (M‐H, Random, 95% CI) | 0.80 [0.54, 1.20] |
| 14 Incidence of diarrhea: Sensitivity analysis (missing outcome data ‐ extreme plausible analysis) Show forest plot | 33 | 7019 | Risk Ratio (M‐H, Random, 95% CI) | 0.61 [0.49, 0.77] |
| 14.1 Active controlled | 2 | 948 | Risk Ratio (M‐H, Random, 95% CI) | 1.07 [0.40, 2.86] |
| 14.2 Placebo controlled | 19 | 2571 | Risk Ratio (M‐H, Random, 95% CI) | 0.71 [0.54, 0.92] |
| 14.3 No treatment control | 12 | 3500 | Risk Ratio (M‐H, Random, 95% CI) | 0.46 [0.31, 0.66] |
| 15 Adverse events: Complete case Show forest plot | 24 | 4415 | Risk Difference (M‐H, Random, 95% CI) | ‐0.00 [‐0.01, 0.01] |
| 16 Adverse events: Same event rate assumptions analysis Show forest plot | 24 | 4595 | Risk Difference (M‐H, Random, 95% CI) | ‐0.00 [‐0.01, 0.01] |
| 17 Adverse events: Risk of bias Show forest plot | 24 | 4415 | Risk Difference (M‐H, Random, 95% CI) | ‐0.00 [‐0.01, 0.01] |
| 17.1 Low RoB | 11 | 1978 | Risk Difference (M‐H, Random, 95% CI) | ‐0.02 [‐0.05, 0.01] |
| 17.2 High/Unclear | 13 | 2437 | Risk Difference (M‐H, Random, 95% CI) | 0.00 [‐0.00, 0.00] |
| 18 Mean duration of diarrhea: Complete case Show forest plot | 8 | 1263 | Mean Difference (IV, Random, 95% CI) | ‐0.91 [‐1.38, ‐0.44] |