Scolaris Content Display Scolaris Content Display

Study flow diagram.
Figuras y tablas -
Figure 1

Study flow diagram.

Risk of bias summary: review authors' judgements about each risk of bias item for each included study.
Figuras y tablas -
Figure 2

Risk of bias summary: review authors' judgements about each risk of bias item for each included study.

Forest plot of comparison: 1 Antibiotics versus no antibiotics/placebo for wet cough in children, outcome: 1.1 Children not cured or not substantially improved at follow‐up (using intention‐to‐treat analysis).
Figuras y tablas -
Figure 3

Forest plot of comparison: 1 Antibiotics versus no antibiotics/placebo for wet cough in children, outcome: 1.1 Children not cured or not substantially improved at follow‐up (using intention‐to‐treat analysis).

In the control group, 75/100 people had not been cured over two weeks, compared to 31/100 (95% CI 17 to 48) for the active treatment group. Number needed to treat for an additional beneficial outcome 3 (95% CI 2 to 4).
Figuras y tablas -
Figure 4

In the control group, 75/100 people had not been cured over two weeks, compared to 31/100 (95% CI 17 to 48) for the active treatment group. Number needed to treat for an additional beneficial outcome 3 (95% CI 2 to 4).

Forest plot of comparison: 1 Antibiotics versus no antibiotics/placebo for wet cough in children, outcome: 1.4 Illness progression: participants with progression of disease resulting in additional medical therapy required.
Figuras y tablas -
Figure 5

Forest plot of comparison: 1 Antibiotics versus no antibiotics/placebo for wet cough in children, outcome: 1.4 Illness progression: participants with progression of disease resulting in additional medical therapy required.

Comparison 1 Antibiotics versus no antibiotics/placebo for wet cough in children, Outcome 1 Children not cured or not substantially improved at follow‐up (using intention‐to‐treat analysis).
Figuras y tablas -
Analysis 1.1

Comparison 1 Antibiotics versus no antibiotics/placebo for wet cough in children, Outcome 1 Children not cured or not substantially improved at follow‐up (using intention‐to‐treat analysis).

Comparison 1 Antibiotics versus no antibiotics/placebo for wet cough in children, Outcome 2 Illness progression: participants with progression of disease resulting in additional antibiotic therapy required (available data only).
Figuras y tablas -
Analysis 1.2

Comparison 1 Antibiotics versus no antibiotics/placebo for wet cough in children, Outcome 2 Illness progression: participants with progression of disease resulting in additional antibiotic therapy required (available data only).

Comparison 1 Antibiotics versus no antibiotics/placebo for wet cough in children, Outcome 3 Children experiencing adverse effects of antibiotics (vomiting, diarrhoea, rash).
Figuras y tablas -
Analysis 1.3

Comparison 1 Antibiotics versus no antibiotics/placebo for wet cough in children, Outcome 3 Children experiencing adverse effects of antibiotics (vomiting, diarrhoea, rash).

Comparison 1 Antibiotics versus no antibiotics/placebo for wet cough in children, Outcome 4 Children not cured or not substantially improved at follow‐up (excluding those known to have B pertussis).
Figuras y tablas -
Analysis 1.4

Comparison 1 Antibiotics versus no antibiotics/placebo for wet cough in children, Outcome 4 Children not cured or not substantially improved at follow‐up (excluding those known to have B pertussis).

Comparison 1 Antibiotics versus no antibiotics/placebo for wet cough in children, Outcome 5 Subgroup analysis (placebo controlled): children not cured or substantially improved at follow‐up.
Figuras y tablas -
Analysis 1.5

Comparison 1 Antibiotics versus no antibiotics/placebo for wet cough in children, Outcome 5 Subgroup analysis (placebo controlled): children not cured or substantially improved at follow‐up.

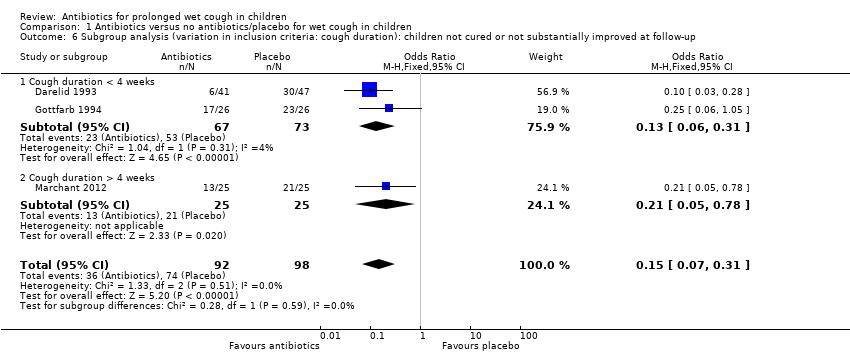
Comparison 1 Antibiotics versus no antibiotics/placebo for wet cough in children, Outcome 6 Subgroup analysis (variation in inclusion criteria: cough duration): children not cured or not substantially improved at follow‐up.
Figuras y tablas -
Analysis 1.6

Comparison 1 Antibiotics versus no antibiotics/placebo for wet cough in children, Outcome 6 Subgroup analysis (variation in inclusion criteria: cough duration): children not cured or not substantially improved at follow‐up.

Comparison 1 Antibiotics versus no antibiotics/placebo for wet cough in children, Outcome 7 Subgroup analysis (antibiotics used): children not cured or not substantially improved at follow‐up.
Figuras y tablas -
Analysis 1.7

Comparison 1 Antibiotics versus no antibiotics/placebo for wet cough in children, Outcome 7 Subgroup analysis (antibiotics used): children not cured or not substantially improved at follow‐up.

Comparison 1 Antibiotics versus no antibiotics/placebo for wet cough in children, Outcome 8 Sensitivity analysis: children not cured or not substantially improved at follow‐up (using available data only).
Figuras y tablas -
Analysis 1.8

Comparison 1 Antibiotics versus no antibiotics/placebo for wet cough in children, Outcome 8 Sensitivity analysis: children not cured or not substantially improved at follow‐up (using available data only).

Summary of findings for the main comparison. Antibiotics compared to placebo for prolonged wet cough in children

Antibiotics compared to placebo for prolonged wet cough in children

Patient or population: prolonged wet cough in children
Setting: paediatric outpatients
Intervention: antibiotics
Comparison: placebo

Outcomes

Anticipated absolute effects* (95% CI)

Relative effect
(95% CI)

№ of participants
(studies)

Quality of the evidence
(GRADE)

Comments

Risk with placebo

Risk with antibiotics

Children not cured or substantially improved at follow‐up (using intention‐to‐treat analysis) (measured as proportion of participants)

Follow‐up: range 7–14 days

76 per 100

32 per 100
(18 to 49)

OR 0.15
(0.07 to 0.31)

190
(3 RCTs)

⊕⊕⊕⊝
Moderatea

Children with progression of the disease resulting in additional medical therapy (complications) (measured as proportion of participants)

Follow‐up: range 7–14 days

36 per 100

5 per 100
(17 to 163)

OR 0.10
(0.03 to 0.34)

125
(2 RCTs)

⊕⊕⊕⊝
Moderateb

Children experiencing adverse effects of antibiotics (e.g. diarrhoea, nausea, skin rash, allergic reactions (measured as proportion of participants))

5 per 100

10 per 100
(3 to 25)

OR 1.88
(0.62 to 5.69)

190
(3 RCTs)

⊕⊕⊝⊝
Lowc

*The risk in the intervention group (and its 95% confidence interval) is based on the assumed risk in the comparison group and the relative effect of the intervention (and its 95% CI).

CI: confidence interval; OR: odds ratio; RCT: randomised controlled trial.

GRADE Working Group grades of evidence
High quality: we are very confident that the true effect lies close to that of the estimate of the effect.
Moderate quality: we are moderately confident in the effect estimate: the true effect is likely to be close to the estimate of the effect, but there is a possibility that it is substantially different.
Low quality: our confidence in the effect estimate is limited: the true effect may be substantially different from the estimate of the effect.
Very low quality: we have very little confidence in the effect estimate: the true effect is likely to be substantially different from the estimate of effect.

aOne study carrying 46% of the analysis weight was at high risk of bias due to lack of blinding. Downgraded one level for risk of bias (Darelid 1993).

bOne study carrying 87% of the analysis weight was at high risk of bias due to lack of blinding. Downgraded one level for risk of bias (Darelid 1993).

cOne study carrying 10% of the analysis weight was at high risk of bias due to lack of blinding and the result has been downgraded for imprecision due to wide CIs. Downgraded two levels for risk of bias and imprecision.

Figuras y tablas -
Summary of findings for the main comparison. Antibiotics compared to placebo for prolonged wet cough in children
Comparison 1. Antibiotics versus no antibiotics/placebo for wet cough in children

Outcome or subgroup title

No. of studies

No. of participants

Statistical method

Effect size

1 Children not cured or not substantially improved at follow‐up (using intention‐to‐treat analysis) Show forest plot

3

190

Odds Ratio (M‐H, Fixed, 95% CI)

0.15 [0.07, 0.31]

2 Illness progression: participants with progression of disease resulting in additional antibiotic therapy required (available data only) Show forest plot

2

125

Odds Ratio (M‐H, Fixed, 95% CI)

0.10 [0.03, 0.34]

3 Children experiencing adverse effects of antibiotics (vomiting, diarrhoea, rash) Show forest plot

3

190

Odds Ratio (M‐H, Fixed, 95% CI)

1.88 [0.62, 5.69]

4 Children not cured or not substantially improved at follow‐up (excluding those known to have B pertussis) Show forest plot

2

128

Odds Ratio (M‐H, Fixed, 95% CI)

0.13 [0.05, 0.30]

5 Subgroup analysis (placebo controlled): children not cured or substantially improved at follow‐up Show forest plot

3

190

Odds Ratio (M‐H, Fixed, 95% CI)

0.15 [0.07, 0.31]

5.1 Placebo controlled

2

102

Odds Ratio (M‐H, Fixed, 95% CI)

0.22 [0.08, 0.60]

5.2 No placebo used

1

88

Odds Ratio (M‐H, Fixed, 95% CI)

0.10 [0.03, 0.28]

6 Subgroup analysis (variation in inclusion criteria: cough duration): children not cured or not substantially improved at follow‐up Show forest plot

3

190

Odds Ratio (M‐H, Fixed, 95% CI)

0.15 [0.07, 0.31]

6.1 Cough duration < 4 weeks

2

140

Odds Ratio (M‐H, Fixed, 95% CI)

0.13 [0.06, 0.31]

6.2 Cough duration > 4 weeks

1

50

Odds Ratio (M‐H, Fixed, 95% CI)

0.21 [0.05, 0.78]

7 Subgroup analysis (antibiotics used): children not cured or not substantially improved at follow‐up Show forest plot

3

190

Odds Ratio (M‐H, Fixed, 95% CI)

0.15 [0.07, 0.31]

7.1 Amoxicilin/clavulanic acid use

2

102

Odds Ratio (M‐H, Fixed, 95% CI)

0.22 [0.08, 0.60]

7.2 Other antibiotics used

1

88

Odds Ratio (M‐H, Fixed, 95% CI)

0.10 [0.03, 0.28]

8 Sensitivity analysis: children not cured or not substantially improved at follow‐up (using available data only) Show forest plot

3

171

Odds Ratio (M‐H, Fixed, 95% CI)

0.14 [0.07, 0.29]

Figuras y tablas -
Comparison 1. Antibiotics versus no antibiotics/placebo for wet cough in children