Consumer‐providers of care for adult clients of statutory mental health services
Abstract
Background
In mental health services, the past several decades has seen a slow but steady trend towards employment of past or present consumers of the service to work alongside mental health professionals in providing services. However the effects of this employment on clients (service recipients) and services has remained unclear.
We conducted a systematic review of randomised trials assessing the effects of employing consumers of mental health services as providers of statutory mental health services to clients. In this review this role is called 'consumer‐provider' and the term 'statutory mental health services' refers to public services, those required by statute or law, or public services involving statutory duties. The consumer‐provider's role can encompass peer support, coaching, advocacy, case management or outreach, crisis worker or assertive community treatment worker, or providing social support programmes.
Objectives
To assess the effects of employing current or past adult consumers of mental health services as providers of statutory mental health services.
Search methods
We searched the Cochrane Central Register of Controlled Trials (CENTRAL, The Cochrane Library 2012, Issue 3), MEDLINE (OvidSP) (1950 to March 2012), EMBASE (OvidSP) (1988 to March 2012), PsycINFO (OvidSP) (1806 to March 2012), CINAHL (EBSCOhost) (1981 to March 2009), Current Contents (OvidSP) (1993 to March 2012), and reference lists of relevant articles.
Selection criteria
Randomised controlled trials of current or past consumers of mental health services employed as providers ('consumer‐providers') in statutory mental health services, comparing either: 1) consumers versus professionals employed to do the same role within a mental health service, or 2) mental health services with and without consumer‐providers as an adjunct to the service.
Data collection and analysis
Two review authors independently selected studies and extracted data. We contacted trialists for additional information. We conducted analyses using a random‐effects model, pooling studies that measured the same outcome to provide a summary estimate of the effect across studies. We describe findings for each outcome in the text of the review with considerations of the potential impact of bias and the clinical importance of results, with input from a clinical expert.
Main results
We included 11 randomised controlled trials involving 2796 people. The quality of these studies was moderate to low, with most of the studies at unclear risk of bias in terms of random sequence generation and allocation concealment, and high risk of bias for blinded outcome assessment and selective outcome reporting.
Five trials involving 581 people compared consumer‐providers to professionals in similar roles within mental health services (case management roles (4 trials), facilitating group therapy (1 trial)). There were no significant differences in client quality of life (mean difference (MD) ‐0.30, 95% confidence interval (CI) ‐0.80 to 0.20); depression (data not pooled), general mental health symptoms (standardised mean difference (SMD) ‐0.24, 95% CI ‐0.52 to 0.05); client satisfaction with treatment (SMD ‐0.22, 95% CI ‐0.69 to 0.25), client or professional ratings of client‐manager relationship; use of mental health services, hospital admissions and length of stay; or attrition (risk ratio 0.80, 95% CI 0.58 to 1.09) between mental health teams involving consumer‐providers or professional staff in similar roles.
There was a small reduction in crisis and emergency service use for clients receiving care involving consumer‐providers (SMD ‐0.34 (95%CI ‐0.60 to ‐0.07). Past or present consumers who provided mental health services did so differently than professionals; they spent more time face‐to‐face with clients, and less time in the office, on the telephone, with clients' friends and family, or at provider agencies.
Six trials involving 2215 people compared mental health services with or without the addition of consumer‐providers. There were no significant differences in psychosocial outcomes (quality of life, empowerment, function, social relations), client satisfaction with service provision (SMD 0.76, 95% CI ‐0.59 to 2.10) and with staff (SMD 0.18, 95% CI ‐0.43 to 0.79), attendance rates (SMD 0.52 (95% CI ‐0.07 to 1.11), hospital admissions and length of stay, or attrition (risk ratio 1.29, 95% CI 0.72 to 2.31) between groups with consumer‐providers as an adjunct to professional‐led care and those receiving usual care from health professionals alone. One study found a small difference favouring the intervention group for both client and staff ratings of clients' needs having been met, although detection bias may have affected the latter. None of the six studies in this comparison reported client mental health outcomes.
No studies in either comparison group reported data on adverse outcomes for clients, or the financial costs of service provision.
Authors' conclusions
Involving consumer‐providers in mental health teams results in psychosocial, mental health symptom and service use outcomes for clients that were no better or worse than those achieved by professionals employed in similar roles, particularly for case management services.
There is low quality evidence that involving consumer‐providers in mental health teams results in a small reduction in clients' use of crisis or emergency services. The nature of the consumer‐providers' involvement differs compared to professionals, as do the resources required to support their involvement. The overall quality of the evidence is moderate to low. There is no evidence of harm associated with involving consumer‐providers in mental health teams.
Future randomised controlled trials of consumer‐providers in mental health services should minimise bias through the use of adequate randomisation and concealment of allocation, blinding of outcome assessment where possible, the comprehensive reporting of outcome data, and the avoidance of contamination between treatment groups. Researchers should adhere to SPIRIT and CONSORT reporting standards for clinical trials.
Future trials should further evaluate standardised measures of clients' mental health, adverse outcomes for clients, the potential benefits and harms to the consumer‐providers themselves (including need to return to treatment), and the financial costs of the intervention. They should utilise consistent, validated measurement tools and include a clear description of the consumer‐provider role (eg specific tasks, responsibilities and expected deliverables of the role) and relevant training for the role so that it can be readily implemented. The weight of evidence being strongly based in the United States, future research should be located in diverse settings including in low‐ and middle‐income countries.
Plain language summary
Involving adults who use mental health services as providers of mental health services to others
Past or present consumers of mental health services can work in partnership with mental health professionals in 'consumer‐provider' roles, when providing mental health services to others. Their roles may include peer support, coaching, advocacy, specialists or peer interviewers, case management or outreach, crisis worker or assertive community treatment worker, or providing social support programmes. Until now, the effects of employing past or present consumers of mental health services, in providing services to adult clients of these services, have not been assessed rigorously.
We conducted a systematic review, comprehensively searching databases and other materials to identify randomised controlled trials which involved past or present consumers of mental health services employed as providers of mental healthcare services for adult clients. To be included, studies had to make one of two comparisons: 1) consumer‐providers versus professionals employed to do the same role within a mental health service, or 2) mental health services with and without consumer‐providers as an adjunct to the service.
We found 11 randomised controlled trials involving approximately 2796 people. The quality of the evidence is moderate to low; it was unclear in many cases whether steps were taken to minimise bias, both in the way that participants were allocated to groups, and in how the outcomes were assessed and reported.
Five of the 11 trials involving 581 people compared consumer‐providers to professionals who occupied similar roles within mental health services (case management roles (4 trials), and facilitating group therapy (1 trial)). There were no significant differences between the two groups, in terms of client (care recipient) quality of life, mental health symptoms, satisfaction, use of mental health services, or on the numbers of people withdrawing from the study. People receiving care from past or present users of mental health services used crisis and emergency services slightly less than those receiving care from professional staff. Past or present consumers who provided mental health services did so differently than professionals; they spent more time face‐to‐face with clients, and less time in the office, on the telephone, with clients' friends and family, or at provider agencies.
Six of the 11 trials, involving 2215 people, compared mental health services with or without the addition of consumer‐providers. There were no significant differences in quality of life, empowerment, function and social relations, in client satisfaction, attendance rates, hospital use, or in the numbers of people withdrawing from the study, between groups with consumer‐providers as an adjunct to professional care and those receiving usual care by health professionals alone. None of these six studies reported on clients' mental health symptoms. None of the studies reported on adverse outcomes (harms) for clients, or on the costs of providing the services.
Overall, we concluded that employing past or present consumers of mental health services as providers of mental health services achieves psychosocial, mental health symptom and service use outcomes that are no better or worse than those achieved by professional staff in providing care.
There is no evidence that the involvement of consumer‐providers is harmful. More high‐quality and well‐reported randomised trials are needed, particularly to evaluate mental health outcomes, adverse outcomes for clients, the potential benefits and harms to the consumer‐providers themselves (including a need to return to treatment), and whether it is cost‐effective to employ them. Future researchers should include a clear description of the consumer‐provider role and relevant training for the role so that it can be readily implemented, and should investigate consumer‐providers in settings outside the United States.
Authors' conclusions
Background
Terms used in this review
In mental health services, the last 30 to 40 years has seen a slow but steady trend towards employment of past or present consumers of the service to work alongside mental health professionals. In this review, we call this role 'consumer‐provider', and use the term 'statutory mental health services' to refer to public services, those required by statute or law, or public services which involve statutory duties (i.e. specific duties required by law). In Appendix 1 we define key terms for this review, and describe our rationale for the choice of the term 'consumer‐provider'. We also explain the issues associated with the use of other terms (eg service users, survivors, peers).
The role of consumer‐providers can encompass peer support (Davidson 2012), coaching, advocacy, case management or outreach roles, crisis worker or assertive community treatment team, or providing clinical or social support programmes (Mowbray 1998). Past or present clients of mental health services can play other roles, such as providing a wholly consumer‐run or operated service (Segal 2011), including self‐help groups (Segal 1995) (sometimes known as consumer‐operated service providers (COSPs)) but our review does not assess this form of intervention. Nor does this review examine the role of consumers as trainers for professionals providing mental health services, or as researchers designing or conducting service evaluations (Coulter 2011); both of these interventions are important, however, and are the subject of companion reviews (Simpson 2003a; Simpson 2003b).
The protocol for this review was written by Emma Simpson and colleagues (Simpson 2003c) but they were unable to complete the review. The current authors completed the review using the scope of the original protocol because this is the standard expected of Cochrane reviews (see Acknowledgements). Referees of the review identified the need for a review of the evidence of user‐controlled consumer services, as well as an evaluation of the impact of service provision on consumer‐providers themselves, but these topics could not be assessed by this current review.
User involvement in mental health services
The consumer participation and self‐help movements have driven an increase in user involvement in mental health services, since at least the 1970s (Doughty 2011; Wright‐Berryman 2011). Providers of mental health services, like other health service providers, increasingly involve service users. Health policies often recommend the involvement of users in services, for example the United Kingdom (UK) Department of Health has an emphasis on patient and public involvement (Department 1999; Department 2001). Legislation also now may require such involvement (Campbell 2008a); an example is the UK Health and Social Care Act 2001. User involvement is often seen as intrinsically worthwhile (van Vugt 2012), but it can also have measurable effects (positive or negative) on client and service outcomes.
Despite encouragement of user involvement in service planning in Western Europe and North America, there are few rigorous assessments of its effects (Crawford 2002). Users have been involved as consumer‐providers internationally, including in the UK, Australia, the United States of America (USA) and Canada (Church 1989; Mowbray 1988; O'Donnell 1998; Perkins 1997; Salzer 2010). Data are limited on how widespread this practice is (Crawford 2003; Geller 1998), but there are indications that the consumer‐provider workforce is growing (Salzer 2010), spurred, for instance, by government funding and advocacy organisation support for service provision by peers (Segal 2011). The 2003 USA report of the President's New Freedom Commission on Mental Health (President 2003) helped to stimulate powerfully the "transformation of mental health services to a recovery orientation", in which consumer involvement is considered to be central.
How the intervention might work
This review assesses partnership approaches to service provision in the context of mental health, where service users work in partnership with mental health professionals in consumer‐provider roles integrated within statutory mental health services. Users can be involved as consumer‐providers within adult mental health services in a variety of ways. They can be employed in roles specifically designated for them, such as peer support specialists or peer interviewers (Lecomte 1999; Mowbray 1996; Salzer 2010; Pfeiffer 2011). Users can also be appointed to roles that apply to both users or non‐users, such as case management or outreach roles (Fisk 2000; Sherman 1991). Alternatively, user‐run programmes may be integrated into the mental health system that are closely linked with professional services, for example user‐run drop‐in centres (Brown 2010), or social support programmes for service users discharged from hospital (Chinman 2001; Kaufmann 1993).
Potential benefits and harms
van Vugt 2012 describes a fundamental belief that "involving consumers improves the health and quality of life of clients". However clients of mental health services can have divergent perceptions of the involvement of consumer‐providers. Some clients may prefer to receive services from consumer‐providers because they believe it will provide hope, or lead to more patient‐centred care, better understanding, or empathy with their condition (Chinman 2010; van Vugt 2012). However other clients may prefer to receive care from mental health professionals because they believe they have a greater capacity to meet their health needs (described by Campbell 2008a as a "credibility gap"). Consumer‐providers and mental health professionals may also differ in the outcomes they consider important for clients. While health professionals may be interested in therapeutic outcomes such as mental health symptoms, consumer‐providers and clients may have a greater interest in their overall quality of life.
Differences in the nature of consumer‐provider involvement compared to health professionals may also be important regarding how and where they spend their time and the potential impact this may have on relationships between clients and staff, use of available resources, or job satisfaction for staff (Salzer 2010). Services involving consumer‐providers may be seen as more engaging and accessible to clients (President 2003; van Vugt 2012), and may also be seen as empowering local communities (Greenfield 2008).
Why it is important to do this review
Involving consumers in mental health services has the potential to produce a number of benefits but there is also potential for harm. Mechanisms of involving consumer‐providers need to be carefully considered, and practice needs to be guided by evidence on effectiveness. Such evidence can be found from comparisons of services provided by consumers with services provided by mental health professionals. We aimed to assess current evidence from randomised controlled trials regarding the benefits and harms for clients of consumer‐providers in mental health services. We also aimed to look at service provision patterns when consumers are involved in service delivery.
The current review overlaps with an earlier review (Simpson 2002) of involving consumers as providers of mental health services. The earlier review identified eight trials for inclusion, of which three met our inclusion criteria. The current review updates the section in Simpson 2002 on employing users as providers, and additionally uses Cochrane systematic review methods.
A number of related Cochrane reviews exist. The most relevant is the planned review Van Ginneken 2011, which will examine the effects of non‐specialist health workers (NSHWs) such as doctors, nurses and lay providers, and professionals with other health roles (such as teachers and community workers) for providing mental health care in low and middle income countries. The main distinctions between Van Ginneken 2011 and the present review are the intervention provider and setting; we focus only on current or past clients of mental health services, as providers, and van Ginneken focuses only on low and middle income country settings. Nilsen 2006 examines the involvement of consumers in health policy and research, guideline development and patient information materials, but not in service provision. Dale 2008 assessed care provided by peers via telephone and found that it can be effective for certain health‐related concerns; some of the included studies assessed peer supporters versus healthcare professionals as callers, whilst others assessed peer support callers versus usual care (no telephone call). Lewin 2010 examines lay health workers in primary and community health care for improving maternal and child health and the management of infectious diseases.
This review is one of a suite of three reviews designed to assess different aspects of consumer involvement in mental health services, namely service provision, research (Simpson 2003a) and training (Simpson 2003b).
Objectives
To assess the effects of employing adults who are current or past consumers of mental health services, as providers of statutory mental health services.
Methods
Criteria for considering studies for this review
Types of studies
Randomised controlled trials (RCTs).
Types of participants
Clients of statutory mental health services (ie. care recipients) who were 18 years and older and diagnosed with a mental health condition.
Types of interventions
Adults with current or past use of mental health services, involved as consumer‐providers, working in statutory services or in services that are integrated within statutory mental health services. Services needed to be specifically targeted for mental health purposes. (See Appendix 1 for definitions of key terms).
We considered that there was evidence of 'integration' in mental health services when:
-
mental health professionals and consumers worked together in a team; or
-
there was formal consultation between consumer‐providers and mental health professionals as part of the mental health service; or
-
there was recruitment, training, supervision or payment of consumer‐providers by statutory organisations.
Studies involving unpaid users as volunteers were also considered eligible if user roles were within, or integrated with, statutory mental health services.
Comparisons
We included:
-
studies comparing the effect of having a consumer‐provider in a role that would otherwise be occupied by a professional in a mental health service (consumer‐provider versus professional staff); and
-
studies comparing the effect of involving a consumer‐provider in addition to the usual mental health service (usual care plus a consumer‐provider as adjunct versus usual care) (see Figure 1).

Graphical representation of comparisons 1 and 2
Exclusions
We excluded social services (such as employment or housing), befriending services, and forensic services for people with mental health conditions.
We excluded studies in which consumer involvement was limited to service planning or policy committees, or if consumers were involved in self‐help services that were run independently of statutory mental health services, or provided services that were not specifically mental health services.
Types of outcome measures
We present a detailed description of standard tools used to measure outcomes in the included studies in Table 1.
| Tool | Abbreviation | Reference/s | Description | Outcome | Assessor | Studies |
| Lehman Quality of Life (also in Brief Version) | QOLI (and QOLI‐Brief) | Subjective subscales: Life satisfaction, Daily activities, Family contact, Social relations, Finances, Health, Safety (score 1‐7). Objective subscales: Family contacts, Social relations (score 1‐5), Daily activities, Finances (score 0‐1). Higher scores better. | Quality of life | Client self‐report (interview) | ||
| Quality of Life Index for Mental Health | QOLIMH | A brief 25‐item questionnaire | Quality of life | Client self‐report | ||
| Making Decisions Empowerment | MDE | 28 items (score 1‐4). Responses are summed. Higher scores better (individual scale values reversed). | Empowerment | Client self‐report | ||
| Personal Empowerment | PE | 20 items with two sub‐scales; 1) choice and 2) reduction in chance. Choice sub‐scale employs four point Likert scale . Reduction in Chance sub‐scale employs five‐point scale. Responses are summed. Higher scores better (individual scale values reversed). | Empowerment | Client self‐report | ||
| Life Skills Profile | LSP | A 39‐item measure of function | Function | Case managers and families | ||
| Significant Others Scale | SOS | Interview assesses size of social network and ratings of qualitative aspects of support provided by individuals in the network. | Social | Client self‐report (interview) | ||
| Hopkins Symptoms Checklist‐58 | HSCL‐58 | 58‐items on a four‐point scale. Higher scores worse. | Symptoms | Client self‐report | ||
| Brief Symptom Inventory | BSI | Measures clinically relevant symptoms (score 1‐5). Higher scores better. | Symptoms | Client self‐report | ||
| Brief Psychiatric Rating Scale (also expanded version) | BPRS | 18 items (expanded version has 24 items) rated on seven point scale. Higher scores worse. | Symptoms | Trained interviewer | ||
| Symptom Check List‐90 | SCL‐90 | Self‐administered check list of 90 items rated on a five point scale (0 = not at all; 4 = extremely), eight sub scale scores were computed and three global indices, global severity index, positive symptoms distress index, and positive symptom total. | Symptoms | Client self‐report | ||
| Beck Depression Inventory | BDI | 21‐item scale. Each item consists of four statements of depressive symptoms (score 0‐3) and assesses respondents mood in the past week. Maximum score 63 (≥19 indicates significant depressive symptoms). Higher scores worse. | Depression | Client self‐report | ||
| Hamilton Rating Scale for Depression (revised) | HRSD | Observer‐rated scale for depressive symptomatology following clinical interview taking into account patient behaviour in the immediate preceding week (score 0‐52; 30 = severe illness). Higher scores worse. | Depression | Clinician | ||
| Behavioral Health Care Rating of Satisfaction | BHCRS | Client satisfaction with clinical staff and services (score 1‐6). Higher scores better. | Satisfaction | Client | ||
| Verona Service Satisfaction Scale | VSSS | 54 questions that cover seven dimensions: | Satisfaction | Client | ||
| Client Service Satisfaction Questionnaire | CSQ | Modified nine‐item scale. Higher scores better. | Satisfaction | Client | ||
| Satisfaction with treatment | Hoult 1983, modifying Stein 1980 | Interview based 16 item scale to measure client satisfaction with all MH treatment (not case management services alone) on a 4‐point scale. Higher scores associated with greater satisfaction, authors note that they used a modified version of the instrument for assessing community treatment team approach | Satisfaction | Trained interviewer | ||
| Camberwell Assessment of Needs | CAN | Sum score (possible score 0‐22). Higher scores worse. | Satisfaction | Can be rated independently by staff and clients | ||
| Barrett‐Lennard Relationship Inventory | BLRI | 64 items, six point scale (1=definitely false, 6=definitely true). Higher score better. | client‐counselor relationship | client self‐report | ||
| Working Alliance Inventory | WAI | 36 items (score 1‐7) equally divided across 3 subscales: Goals, Tasks, and Bonds. Higher scores better. | Client‐manager relationship | Client and case managers |
Primary outcomes
Outcomes for clients (those receiving services)
1) Standardised measures of psychosocial outcomes (eg quality of life, function, social relations, empowerment)
2) Standardised measures of mental health (eg general symptoms, depression)
3) Adverse outcomes for clients, not captured in other primary outcomes
We intended to include client subjective descriptions where these were treated as data in the study, for example with a set proportion of participants from both groups given the opportunity to comment.
Outcomes for service provision
4) Client satisfaction with service provision (or client‐manager relationship)
5) Use of services (eg uptake or drop‐out rates, crisis or emergency services use)
6) Service provision patterns (such as time spent by employees on various tasks, or times and locations of meetings with clients)
Secondary outcomes
7) Professionals' attitudes
8) Financial costs of service provision
Search methods for identification of studies
Electronic searches
We searched the following bibliographic databases using the terms and strategies listed in Appendices 2 to 7.
-
Cochrane Central Register of Controlled Trials (CENTRAL, The Cochrane Library, 2009, Issue 1)
-
MEDLINE (OvidSP): 1950 to March week 3, 2009
-
EMBASE (OvidSP): 1988 to week 11, 2009
-
PsycINFO (OvidSP): 1806 to March week 3, 2009
-
CINAHL (EBSCO): 1981 to March week 3, 2009
-
Current Contents (OvidSP): 1993 week 27 to week 12, 2009
For unpublished and ongoing trials, we contacted authors and other researchers in the field.
We updated searches in March 2012, as follows, using the abovementioned strategies unchanged with the exception of the PsycINFO strategy, the updated version of which is reported in Appendix 8:
-
Cochrane Central Register of Controlled Trials (CENTRAL, The Cochrane Library, 2012, Issue 3)
-
MEDLINE (OvidSP): 2009 to March 2012
-
EMBASE (OvidSP): 2009 to March 2012
-
PsycINFO (OvidSP): 2009 to March 2012 (Appendix 8).
-
Current Contents (OvidSP): 2009 to March 2012.
We were unable to update the search of CINAHL (EbscoHOST) in 2012, as the database was not working reliably.
Searching other resources
We searched the reference lists of potentially‐relevant articles that we obtained in full text.
Data collection and analysis
Selection of studies
The citations returned by the electronic searches were transferred into an Endnote library and the titles and abstracts were screened for inclusion independently by three review authors (RR, VP, DL) using the pre‐specified criteria. Review authors were not blinded to author names during the screening process. We obtained all potentially relevant articles in full text to assess their eligibility for inclusion (see Criteria for considering studies for this review). Disagreements regarding study eligibility were discussed between VP and DL (2009) or MP and DL (2012) until consensus was reached, or a third review author was consulted for a final decision. We provide reasons for the exclusion of potentially‐relevant studies in the Characteristics of excluded studies.
Data extraction and management
Data were collected from each of the included studies by one review author (DL, RR or VP) using a data extraction form specifically designed for this review. We extracted data on study design, settings, methods, participant characteristics, provider characteristics, interventions and outcomes. All data were checked by a second review author (DL, VP, RR or LB) and any discrepancies were discussed and corrected upon agreement. If there had been any unresolved disagreements, a third review author (MP) would have been involved through discussion until consensus was reached.
The data extraction sheet recorded:
-
study design;
-
numbers of participants in each treatment group;
-
characteristics of trial participants (including diagnoses and demographics of clients);
-
description of the service or setting of consumer‐provider involvement;
-
characteristics of consumer‐providers (number involved, diagnoses, demographics);
-
the mechanism of involving consumer‐providers (role description, training provided, support available);
-
details of mental health service provided to the intervention and comparison groups; and
-
outcomes (list of outcomes assessed, tools used, information regarding validity of tools, time points assessed, outcome data).
Outcomes were separated independently by two review authors (VP, DL) into those prespecified as primary and secondary outcomes for this review and those which did not appear to fit within our prespecified categories of outcomes. One of the review authors (SEH) provided clinical expertise to assess whether any of the additional outcomes identified should be included in the review. This rigorous process of data extraction and selection was necessary due to the large number of outcomes measured in multiple ways in the included trials.
Where data were not available in published reports of studies, we contacted study authors for further information.
Assessment of risk of bias in included studies
For each of the included studies, we assessed the following items to identify risk of bias in study outcomes and presented the findings in Risk of bias tables (see Characteristics of included studies), in accordance with Cochrane Handbook guidance (Higgins 2011):
-
adequate sequence generation
-
allocation concealment
-
blinding (blinding of participants for self‐reported outcomes, blinding of all other outcomes)
-
incomplete outcome data (reported separately for outcomes measured up to six months and outcomes measured after six months)
-
selective outcome reporting
-
comparability of groups at baseline
-
contamination between treatment groups
We contacted trial authors where information required to assess risk of bias was not reported. Any disagreements in assessment were resolved by discussion between VP and DL or by consulting a third author (MP) for a final decision.
Although blinding of participants was assessed for each study, it is important to acknowledge that the declared consumer status of the consumer‐provider is part of the intervention, therefore any impact on the results due to unblinded participants is attributed to the effects of the intervention rather than bias.
Measures of treatment effect
Based on the Criteria for considering studies for this review, we identified two possible pairwise comparisons for this review:
-
Comparison 1: Studies comparing the effect of having a consumer‐provider in a role that would otherwise be occupied by a professional in a mental health service (consumer‐provider versus professional staff); and
-
Comparison 2: Studies comparing the effect of involving a consumer‐provider in addition to the usual mental health service (usual care plus a consumer‐provider as adjunct versus usual care).
Figure 1 depicts these comparisons graphically.
We did not anticipate in advance there would be sufficient homogeneity of interventions and outcome measures to warrant meta‐analysis. However we found that several studies did report similar outcome measures, and we have presented pooled analyses wherever appropriate, as well as presenting individual study results using forest plots wherever sufficient data were available to do so.
For dichotomous outcomes, we analysed data based on the number of events and the number of people assessed in the intervention and comparison groups. We used the Mantel‐Haenszel method (random‐effects model) to calculate the risk ratio (RR) and 95% confidence interval (CI).
For continuous measures, we analysed data based on the mean, standard deviation (SD) and number of people assessed for both the intervention and comparison groups to calculate mean difference (MD) and 95% CI. If more than one study measured the same outcome using different tools, we calculated the standardised mean difference (SMD) and 95% CI using the inverse variance method in Review Manager 5 (random‐effects model). As SMD is not easily interpreted, pooled effect estimates expressed as SMD were back transformed by multiplying the SMD with an SD of a standard instrument used to measure the outcome (ie points on the Hopkins Symptoms Checklist (HSCL)‐58 scale). We imputed SD values using the average baseline SD values from the intervention and comparison arms of a trial that used the standard instrument of interest.
Where the same outcome was reported as dichotomous or continuous measures in separate studies (eg crisis/emergency service use), we pooled these outcomes using the generic inverse variance method in Review Manager 5. We calculated the SMD and standard error (SE) for each study (dichotomous outcomes were expressed as an odds ratio (OR) and converted to SMD) using standard formulae described in sections 7.7.7 and 9.4.6 of the Cochrane Handbook (Higgins 2011).
Dealing with missing data
We attempted to contact study authors for any information we were unable to collect from the published articles we had identified in our search. This included clarification of the involvement of consumer‐providers within studies, descriptions of how studies were conducted (eg method of random sequence generation, method of allocating participants to treatment groups), and requesting unpublished data for measured outcomes.
For outcomes assessed using measurement scales (eg quality of life scales, Brief Psychiatric Rating Scale) we presented overall scores wherever possible. If no overall score was provided, we reported results of sub‐scales considered to be most relevant to the outcome of interest, as recorded in the Notes section of the Characteristics of included studies.
If the number of people assessed for each outcome was not specified, this was imputed based on the number of people originally randomised to the treatment groups. For continuous measures, we imputed missing SD values based on reported values for standard error multiplied by the square root of the number of people assessed for the outcome. For dichotomous outcomes, percentages were used to impute missing raw data for the number of events or the number of people assessed. We recorded all data imputations in the Notes section of the Characteristics of included studies.
Assessment of heterogeneity
We assessed statistical heterogeneity visually using forest plots. Where more than one study measured the same outcome, the consistency of results across studies was assessed based on the degree of overlapping confidence intervals. We intended to explore any heterogeneity by referring to the characteristics of individual studies such as the population and type of intervention to try to account for any observed differences in outcomes. We chose not to consider the Chi2 statistic to measure statistical heterogeneity, given that this test has low power in meta‐analyses involving small sample size or few studies (Higgins 2011, section 9.5.2)
Assessment of reporting biases
We attempted to identify potential outcome reporting bias using a matrix listing the outcomes measured in each of the studies (based on outcome assessments described in the published articles). We compared whether sufficient data were available for meta‐analysis or whether data were incompletely reported or not available in the published articles. We present this information in Table 2.
| Outcome | Studies assessed outcome | n studies with outcome data (total N included in analysis) | n studies with incomplete data (total N randomised) |
| COMPARISON 1 (n = 5) | |||
| Primary outcomes | |||
| QOL | 3 | 1 (130) | 2 (233) |
| Function | 3 | 1 (130) | 2 (233) |
| Social | 3 | 1 (130) | 2 (233) |
| Symptoms | 3 | 2 (197) | 1(96) |
| Depression | 2 | 1(67) | 1(96) |
| Satisfaction | 2 | 2 (213) | 0 |
| Client manager relationship | 2 | 2 (160) | 0 |
| Use of mental health services | 3 | 2 (227) | 1 (137) |
| Client attrition | 5 | 3 (333) | 2 (250) |
| Hospital admissions | 2 | 1 (114) | 1 (96) |
| Crisis/Emergency services | 3 | 2 (250) | 1 (96) |
| Length of stay | 2 | 1 (136) | 1 (96) |
| Secondary outcomes | |||
| Providers' attitudes | 1 | 1 (96) | 0 |
| COMPARISON 2 (n = 6) | |||
| Primary outcomes | |||
| QOL | 1 | 0 | 1 (84) |
| Function | 3 | 1 (45) | 2 (208) |
| Social | 2 | 1 (45) | 1 (89) |
| Symptoms | 1 | 0 | 1 (90) |
| Sense of community | 1 | 0 | 1 (89) |
| Motivation for change | 1 | 0 | 1 (89) |
| Self‐determination | 1 | 0 | 1 (89) |
| Hope | 1 | 0 | 1 (89) |
| Satisfaction | 2 | 2 (125) | 0 |
| Client manager relationship | 1 | 0 | 1 (89) |
| Use of mental health services | 1 | 1 (45) | 0 |
| Client attrition | 3 (218) | 3 (199) | |
| Hospital admissions | 3 (199) | 1 (84) | |
| Crisis/emergency services | 1 | 0 | 1 (84) |
| Length of stay | 4 | 3(199) | 1 (84) |
| Secondary outcomes | |||
| Providers' attitudes | 3 | 1 (45) | 2 (173) |
Data synthesis
We calculated estimated effects of the intervention and CIs for all primary and secondary outcomes wherever possible. We anticipated that interventions were likely to be heterogeneous across studies, and therefore we planned to conduct analyses using a random‐effects model. If more than one study measured the same outcome, we pooled the results to provide a summary estimate of the effect across studies. We planned to report findings for the different comparison groups separately. For each comparison, we planned to report measures of treatment effect as point estimates with 95% CIs wherever possible, and acknowledge instances where outcomes may have been measured but we were unable to calculate a summary estimate. Where outcomes were measured at multiple time points within individual studies, we have presented outcome data collected at the longest follow up point. We describe findings for each outcome in the text of the review with consideration of the potential impact of bias on the size or direction of the effect. We interpreted results that reached statistical significance with respect to clinical importance based on input from a clinical expert (SEH).
Consumer participation
This draft review was sent to two mental health consumers (one consumer‐researcher and one consumer‐employee) in the UK and Australia as part of the Cochrane Consumers and Communication Review Group's refereeing process. Their feedback was particularly helpful in prompting clarification of terminology and concepts described in this review.
Results
Description of studies
See Characteristics of included studies; Characteristics of excluded studies.
Results of the search
Searches run in March 2009 generated 9815 records. We removed duplicate records and screened the titles and abstracts of all citations to identify 196 articles that were potentially eligible for inclusion. We reviewed these in full text against the selection criteria, and identified ten studies that met the inclusion criteria. Seven of these ten studies were reported in multiple publications (see Additional Table 3).
| Study | Other papers reporting study |
| Herinckx 1997; Paulson 1996; Paulson 1999 | |
| Doherty 2004 | |
| Edmunson 1982; Edmunson 1984; Gordon 1979b | |
| O'Donnell 1998 | |
| Johnsen 2005 | |
| Jewell 2006; Sells 2008 | |
| Solomon 1994a; Solomon 1994b; Solomon 1995b; Solomon 1995c; Solomon 1995d; Solomon 1996a; Solomon 1996b |
We attempted to contact authors of each of the included studies to obtain additional information, but we were only able to clarify details for three studies (Bright 1999; Craig 2004; Sells 2006).
One author (MP) updated the searches in March 2012, resulting in 3776 records. After duplicates were removed, 2691 records remained. These were initially screened by one author (MP) and 1902 records were excluded as clearly not meeting the inclusion criteria. Two authors (DL, MP) assessed the remaining 789 records and rejected 755 as clearly not meeting the inclusion criteria. The authors obtained the remaining 34 papers in full text. These 34 papers reported on 26 studies. Five were reviews and 2 were book chapters not reporting particular trials; 2 studies were already included in the review (Rogers 2007; Sells 2006); 11 studies were excluded as not meeting the inclusion criteria; 2 studies had already been excluded; 2 studies are ongoing (Chinman 2012; Tondora 2010); 1 newly‐identified study awaits further information in order to be classified (Kroon 2011); 1 study was included (Sledge 2011). A further study identified through the reference list in Gordon 1979 is awaiting further information in order to be classified (Stone 1979) .
Included studies
Eleven trials met the selection criteria for this review. Of these, five trials compared an intervention where the only difference was the involvement of a consumer‐provider in the intervention group in a role that was fulfilled by a professional in the comparison group (Comparison 1: Bright 1999; Clarke 2000; Rivera 2007; Sells 2006; Solomon 1995). Six studies compared groups receiving usual care with groups receiving services from consumer‐providers in addition to usual care (Comparison 2: Craig 2004; Gordon 1979; Kaufmann 1995; O'Donnell 1999; Rogers 2007; Sledge 2011).
Three of the 11 included studies had three‐armed comparisons (Clarke 2000; O'Donnell 1999; Rivera 2007). We included for analysis only the arms that met the inclusion criteria. For more information see Characteristics of included studies.
Sample sizes
Sample sizes ranged from 45 to 1827 participants, with a total of 2796 participants in the 11 studies addressing the 2 main comparisons in this review.
Setting
Trials were conducted in state‐ or community‐based outpatient clinics within statutory mental health services. Two studies involved statutory services linked with consumer‐operated service providers (COSPs) (Rogers 2007; Sells 2006). Nine studies were conducted in the USA (Bright 1999; Clarke 2000; Gordon 1979; Kaufmann 1995; Rivera 2007; Rogers 2007; Sells 2006; Sledge 2011; Solomon 1995); two of these were multi‐site trials (Rogers 2007; Sells 2006). One study was conducted in the United Kingdom (Craig 2004) and one in Australia (O'Donnell 1999).
Participants
Participants (clients receiving services) in the 11 included studies were adult clients of statutory mental health services, who had severe mental health diagnoses including psychotic illnesses and major mood disorders. Bright 1999 included participants with a score of ten or higher on the Hamilton Rating Scale for Depression, and meeting the Structured Clinical Interview DSM‐III‐R criteria for current episode of definite major depressive disorder, dysthymia, or depression not otherwise specified. The remaining ten trials all involved participants with severe mental illnesses. Of these, three studies did not specify the type of illness (Craig 2004; Gordon 1979; Solomon 1995) and seven studies included people with both psychotic and mood disorders (Clarke 2000; Kaufmann 1995; O'Donnell 1999; Rivera 2007; Rogers 2007; Sells 2006; Sledge 2011).
Four studies did not describe any participant exclusion criteria (Gordon 1979; Rivera 2007; Sells 2006; Solomon 1995). The other seven studies (Bright 1999; Clarke 2000; Craig 2004; Kaufmann 1995; O'Donnell 1999; Rogers 2007; Sledge 2011) had varying exclusion criteria for potential participants (see Characteristics of included studies.)
Interventions
In all 11 trials, the interventions were delivered by consumer‐providers within statutory mental health settings, or as an adjunct to statutory mental health services. We provide a detailed description of interventions in the Characteristics of included studies.
Of the five studies comparing consumer‐providers and professional staff in the same role (Comparison 1), four of the studies involved consumer‐providers in a case management role within a mental health team (Clarke 2000; Rivera 2007; Sells 2006; Solomon 1995). The remaining study trained consumer‐providers as facilitators of mutual support group therapy or cognitive behavioural therapy sessions that were otherwise facilitated by professional staff (Bright 1999).
Of the six studies assessing consumer‐providers as an adjunct to usual care (Comparison 2), four studies involved consumer‐providers in mentoring or advocacy roles (Craig 2004; Gordon 1979; O'Donnell 1999; Sledge 2011) and two studies referred clients to consumer‐operated services that were integrated with traditional mental health services in addition to usual care (Kaufmann 1995; Rogers 2007).
Consumer‐providers
Consumer‐providers were recruited through formal advertising (Sledge 2011), mental health services (Gordon 1979; O'Donnell 1999) or from existing self‐help groups (Bright 1999), consumer‐operated drop in centres (Clarke 2000), peer advocacy programs (Rivera 2007) and peer engagement projects (Sells 2006). Four studies did not describe how consumer‐providers were recruited (Craig 2004; Kaufmann 1995; Rogers 2007; Solomon 1995). The number of consumer‐providers in the included studies ranged from two to nine, with no studies providing a rationale for the number recruited.
The employment history and other relevant experience of consumer‐providers was reported only in Bright 1999 (with half having previously led self‐help groups and most holding a bachelor degree) and Craig 2004 (with consumer‐providers having been unemployed for some years at the time of employment) (see Characteristics of included studies). Their diagnoses were reported in Clarke 2000 (self‐identified mental health consumers with a DSM‐III‐R axis I diagnosis); Rivera 2007 (history of multiple hospitalisations for mood or psychotic disorders, eligible for disability benefits, reliant on medication and having three to eight years of stability in the community); and Sells 2006 (some had a history of co‐occurring drug use disorder).
In O'Donnell 1999, those delivering the intervention initially comprised present or past consumers of mental health services, 'secondary' consumers (carers or siblings of primary consumers), or lay individuals. After a brief period, as a result of employee turnover, only primary consumers were employed.
Consumer‐provider training and support
Studies varied in the degree of training and ongoing support given to consumer‐providers. Most studies described an initial intensive training period lasting for between two days and six weeks, followed by ongoing supervision (weekly or monthly sessions) and support (eg telephone debriefing).
Excluded studies
We list the 48 studies excluded from this review, with reasons, at Characteristics of excluded studies. Eleven of these studies appeared to meet the review's selection criteria, but were later excluded. These studies investigated mental health services involving consumer‐providers that were compared to a different mental health service that did not involve consumer‐providers (Cook 2012a; Forchuk 2005; Greenfield 2008; Jonikas 2011; Lafave 1996; Lehman 1997; Liberman 1998; Quinlivan 1995; Reynolds 2004; Salyers 2010; Sytema 2007). We excluded these studies as we were unable to disentangle the effects of consumer‐providers in studies comparing two different complex interventions (see 11 studies listed as "comparison group differed on more factors than consumer‐provider alone" in Characteristics of excluded studies).
The main reasons for excluding studies were:
-
the intervention was not integrated within statutory mental health services (17 studies);
-
the comparison group differed by more factors than the consumer‐provider role (11 studies);
-
allocation to treatment groups was not randomised (or not adequately randomised) (9 studies).
Risk of bias in included studies
We present 'Risk of bias' Information in Characteristics of included studies and Figure 2 and Figure 3.

Risk of bias summary: review authors' judgements about each risk of bias item for each included study.

Risk of bias graph: review authors' judgements about each risk of bias item presented as percentages across all included studies.
Allocation
All of the five studies comparing consumer‐providers to professionals in the same role (Comparison 1) describe random assignment of participants to treatment groups but do not provide enough information about whether participants were truly randomised or whether group allocations were concealed.
Three of the six studies assessing consumer‐providers as an adjunct to usual care (Comparison 2) describe adequate randomisation methods (Craig 2004; Rogers 2007; Sledge 2011). Two of these describe concealment of allocation (Craig 2004; Sledge 2011).
Overall, there is an unclear risk of selection bias in the trials' results.
Blinding
Participants and providers
None of the clients or care providers in any of the studies was considered blind to treatment assignment, because disclosure of consumer‐provider status was an important part of the intervention. Because the primary outcomes of the review rely largely on self‐reported assessments (eg quality of life, function, social interaction, mental health symptoms, and service satisfaction) the clients' beliefs about consumer‐providers' effectiveness were likely to have affected their assessment of these outcomes.
Outcome assessors
Only two (Bright 1999; Rivera 2007) of the five studies in Comparison 1 stated that outcome assessors were blind to group assignment. Data reported for service use outcomes (eg hospital admissions, crisis/emergency service) may be subject to detection bias where outcome assessors were not blinded. Clarke 2000 and Rivera 2007 both reported data for these outcomes, however Clarke 2000 did not blind outcome assessors.
Only one study (Kaufmann 1995) in Comparison 2 stated that outcome assessors were unaware of group assignment, but we were unable to obtain data from this study for inclusion in this review. Craig 2004; Gordon 1979 and Sledge 2011 reported service use data; outcome assessors were not blind to group assignment and had a vested interest in seeing the intervention succeed in these studies.
Overall, the lack of blinding of participants, care providers and outcome assessors creates an unclear to high risk of bias in the trials' results.
Incomplete outcome data
The five studies in Comparison 1 reported losses to follow up ranging from 6% to 30% of the total participants. Losses were balanced across treatment groups in Bright 1999 and Solomon 1995. It was unclear whether losses were balanced across groups in Clarke 2000 or Rivera 2007. Sells 2006 reported greater loss of participants in the assertive community treatment (ACT) group without consumer‐providers. The reasons for losses were poorly reported; it is unclear whether the losses may have biased these studies' results and, if so, in which direction.
Four of the six studies in Comparison 2 reported minimal losses (ie less than 10%) that were balanced across groups and unlikely to bias outcomes. However, Rogers 2007 reported 20.5% of participants were lost to follow up without describing whether losses were balanced across groups; disproportionate losses in either group may have biased outcomes in either direction. In Sledge 2011, 17% of participants withdrew consent post‐randomisation (balanced between groups), and while it appears that service use data are reported for all of the remaining participants, the authors note that they did not have verifiable data on whether patients were hospitalised at other facilities during the follow‐up period.
Overall, the studies are at low to unclear risk of attrition bias.
Selective reporting
In order to indicate potential outcome reporting bias in this review, we compared the number of studies (and total participants) contributing data for each of the outcomes, to the number of studies (and total participants) that were likely to have measured outcomes but reported limited data (insufficient to include in a meta‐analysis) or did not report all outcomes that were measured (see Table 2).
Three of the five studies in Comparison 1 selectively reported only some of the outcomes that were measured (Bright 1999; Sells 2006; Solomon 1995).
Only one of the six studies in Comparison 2 reported data for all outcomes measured (Craig 2004). Selective outcome reporting was indicated in four of these studies (O'Donnell 1999; Kaufmann 1995; Rogers 2007; Sledge 2011); however, correspondence with the authors of Sledge 2011 indicates that a manuscript is under preparation for the secondary outcomes assessed in the trial. Further, data for Gordon 1979 were poorly reported and it was not possible to determine how many of the 80 people randomised were allocated to each group.
Overall, 6 of the 11 included studies are at high risk of bias in terms of selective outcome reporting.
Other potential sources of bias
All of the five studies with direct comparisons of consumer‐providers to professionals in the same role (Comparison 1) reported comparability of groups at baseline and none of these studies was considered at risk of confounding through contamination of treatment groups (eg participants in the comparison group receiving services from a consumer‐provider instead of a professional).
Four of six studies in Comparison 2 involved treatment groups that were comparable at baseline. For the remaining two studies this could not be determined (Gordon 1979; Rogers 2007). Most of these studies were at high risk of contamination between treatment groups due to comparison groups having partial or complete access to the consumer‐provider intervention that could lead to an underestimate of the effects of the intervention (Craig 2004; Kaufmann 1995; Rogers 2007). Two studies indicated participants were able to continue receiving standard mental health services and access the consumer‐provider intervention regardless of randomised assignments (Kaufmann 1995; Rogers 2007). This resulted in equal numbers of participants from both groups accessing the intervention in Kaufmann 1995, cancelling out the effect of randomisation. It is unclear how this may have affected study outcomes for Rogers 2007.
Most of the included studies declared their funding sources which included National or Commonwealth mental health department or health institute grants (Clarke 2000; Kaufmann 1995; O'Donnell 1999; Rogers 2007; Sells 2006; Sledge 2011; Solomon 1995) and other sources ( Rivera 2007; see also Characteristics of included studies). Sledge 2011 received some funding from a pharmaceutical company. Bright 1999; Gordon 1979 and Craig 2004 did not report their funding source. No study discussed the funders' role and degree of input to the study.
Effects of interventions
We analyse and present separately the effects of interventions for each of the two comparisons in this review (see Figure 1):
-
Consumer‐providers versus professionals employed to do the same role within a mental health service;
-
Mental health services with and without consumer‐providers as an adjunct to the service.
For each of these comparisons, we assessed the effect of interventions on clients receiving services (psychosocial, mental health, adverse outcomes) as well as outcomes for service provision (client satisfaction with service provision, use of services, service provision patterns) (see Types of outcome measures). We assessed secondary outcomes of professionals' attitudes and financial costs associated with service provision. We analysed outcomes measured at the longest follow‐up time (typically 12 months). We provide further information and references for outcome measurement tools in Table 1.
We present qualitative effects of interventions on consumer‐providers across all studies separately (see Discussion: Qualitative outcomes).
Comparison 1: Consumer‐provider versus professional
Five low to moderate quality studies compared consumer‐providers in the intervention group and professionals employed in the same role in the comparison group (Bright 1999; Clarke 2000; Rivera 2007; Sells 2006; Solomon 1995).
Summary
Overall, the five studies found no difference in psychosocial, mental health and client satisfaction outcomes. They found a small reduction in use of crisis and emergency service use in clients receiving services from consumer‐providers, but no other difference in service use. There were different service provision patterns in the intervention and comparison group, including a lower caseload for consumer‐providers. One study found no difference in provider perspectives of the client‐manager relationship in either group. The five studies did not report adverse outcomes for clients or financial costs.
Primary outcomes for clients receiving services
1) Standardised measures of psychosocial outcomes (quality of life, function, social relations)
Three studies (Rivera 2007; Sells 2006; Solomon 1995) used the Lehman Quality of Life Interview (QOLI), but data were not available from two of the studies (N = 233) (Sells 2006; Solomon 1995). The third study, Rivera 2007 (130 participants), assessed the effect of consumer‐providers within a strengths‐based intensive case management team compared to using licensed clinical social workers in the same role. There was no significant difference between groups after 12 months regarding life satisfaction (mean difference (MD) ‐0.30 (95% CI ‐0.80 to 0.20) Analysis 1.1), daily activities (MD 0.00 (95% CI ‐0.07 to 0.07) Analysis 1.2), or social relations (MD ‐0.10 (95% CI ‐0.48 to 0.28) Analysis 1.3). The results are consistent with Sells 2006 and Solomon 1995 that both found no difference in these QOLI subscales for participants receiving case management services with and without consumer‐providers.
Although we could not determine whether adequate randomisation and allocation concealment had occurred in these studies, it is unlikely that selection bias has significantly impacted these results. Inclusion of missing data from Sells 2006 and Solomon 1995 is likely to strengthen the evidence of no difference between clients managed by consumer‐providers or professional staff.
2) Standardised measures of mental health (general symptoms, depression)
General symptoms
Three studies used different tools to measure mental health symptoms (Bright 1999; Rivera 2007; Solomon 1995. See Table 1). We were unable to calculate a summary estimate for Solomon 1995 (N = 96). Bright 1999 conducted two parallel studies involving 98 participants comparing the effect of consumer‐providers and health professionals leading a 10‐week course in either mutual support group therapy or cognitive behaviour therapy. There was no difference in symptoms between groups immediately post‐intervention (N = 67) using the Hopkins Symptoms Checklist‐58. This is consistent with Rivera 2007 (N = 130) that showed no difference in Brief Symptom Inventory scores after 12 months of case management services. The pooled estimate of effect is ‐0.24 SMD (95%CI ‐0.52 to 0.05, P = 0.10) (Analysis 1.4) indicating there was no difference in symptoms between the groups. These results are consistent with Solomon 1995 which reported no difference between groups in symptoms measured by the Brief Psychiatric Rating Scale (BPRS). Inclusion of the missing data from Solomon 1995 in the pooled analysis would probably increase the precision of the results indicating no difference between the groups. It is unlikely that the potential selection bias identified in these studies would have significantly influenced these results.
Depression
One study (Bright 1999) measured depression using the Beck Depression Inventory. There was no significant difference in self‐reported depression for participants in mutual support group (MSG) therapy led by consumer‐providers compared to professional employees (MD 3.61 (95% CI ‐1.37 to 8.59) Analysis 1.5.1) however the wide confidence interval means we cannot rule out that some clients of consumer‐providers will have higher (worse) scores. For cognitive behavioural therapy (CBT), clients of consumer‐providers had lower (better) scores for depression, however this difference did not reach statistical significance (MD ‐5.57 (95% CI ‐12.90 to 1.76) Analysis 1.5.1). When providers assessed depression using the Hamilton Rating Scale for Depression (MSG therapy: MD 2.43 (95%CI ‐0.58 to 5.44), CBT: MD 1.32 (95%CI ‐2.26 to 4.90) Analysis 1.5.2) there was no strong evidence of a clinical difference between the groups. Solomon 1995 measured depression as a separate subscale of the BPRS and reported no differences between groups, but did not provide sufficient data to include in a meta‐analysis.
Although outcome data for Bright 1999 were incomplete, the attrition was balanced across the groups and hence is unlikely to have biased these outcomes.
3) Adverse outcomes for clients
There were no adverse outcomes reported for clients in the five studies comparing consumer‐providers to professionals in the same role within mental health services.
Primary outcomes for service provision
4) Client satisfaction with service provision
Two studies assessed participant satisfaction; one study used the Behavioural Health Care Rating of Satisfaction (Rivera 2007) and one study used the trialists' own trial‐specific tool to assess satisfaction with treatment (16 items assessed using a four‐point scale, Solomon 1995). A pooled estimate (2 studies, total N = 213) indicates there is no significant difference in satisfaction between groups (SMD ‐0.22 (95%CI ‐0.69 to 0.25), P = 0.35) (Analysis 1.6).
Client‐manager relationship
Two studies reported participant assessment of the client‐manager relationship (Sells 2006; Solomon 1995). Sells 2006 used the Barrett‐Lennard relationship inventory at 12 months and Solomon 1995 used the Working Alliance Inventory at 2 years. The pooled estimate shows no significant difference between groups (total N = 160; SMD 0.22 (95%CI ‐0.10 to 0.53), P = 0.18) (Analysis 1.7).
5) Use of services (mental health services, crisis/emergency services, hospital use, client attrition)
Use of mental health services
Three studies (Rivera 2007; Solomon 1995; Sells 2006) assessed the uptake of mental health services provided to participants. We were unable to calculate summary estimates for Sells 2006. Rivera 2007 used hospital records to assess how many additional individual or group rehabilitation therapy sessions participants accessed in 12 months. There was no significant difference between groups (individual therapy: MD 0.00 (95%CI ‐0.08 to 0.08); group therapy: MD 1.90 (95%CI ‐1.18 to 4.98)) (Analysis 1.8.1). In Solomon 1995, the number of hours of rehabilitation services used in 12 months appeared skewed for each treatment group, and the summary estimate is imprecise, as indicated by the wide confidence interval (MD ‐70.89 (95%CI ‐248.84 to 107.06)).
Rivera 2007 and Solomon 1995 also assessed use of outpatient services (Analysis 1.8.2). Solomon 1995 reported outpatient service use for 91 participants with no significant difference in favour of either group at 12 months (MD ‐1.23 (95%CI ‐4.34 to 1.88)), consistent with Rivera 2007 (MD ‐0.70 (95% CI ‐3.88 to 2.48). Sells 2006 reported no difference between groups in service use over 12 months, but did not provide sufficient data to include in a meta‐analysis.
Potential selection bias from inadequate randomisation or concealment of allocation has not resulted in outcomes that strongly favour either treatment group in these studies.
Crisis/emergency service use
Three studies compared client use of crisis or emergency services in each of the treatment groups (Clarke 2000; Rivera 2007; Solomon 1995). Pooled summary estimates of 2‐year data from Clarke 2000 and 12‐month data from Rivera 2007 show a small but significant reduction in crisis or emergency service use in clients within the consumer‐provider group (SMD ‐0.34 (95% CI ‐0.60 to ‐0.07) P = 0.01) (Analysis 1.14). These findings are based on self‐reported use of services collected at 6‐monthly (Clarke 2000) or monthly interviews (Rivera 2007). It is unlikely that potential selection bias may have significantly influenced results of these studies, however the accuracy of the results are likely to be affected by the participants' ability to recall their use of services. It is unclear whether participant awareness of treatment allocation in Clarke 2000 may have biased this self‐reported outcome measure and what direction the bias would be (this could depend on the participant's belief in the capability of the different providers as to whether they are likely to under‐report or exaggerate their need for these services).
Solomon 1995 reported no difference in service use between groups, but did not provide sufficient data to include in a meta‐analysis. Inclusion of missing data from Solomon 1995 may render the pooled effect non‐significant.
Hospital use
Two studies collected data regarding hospital admission (Clarke 2000; Solomon 1995). Although fewer people were admitted to hospital in the consumer‐provider group in Clarke 2000, this difference did not reach statistical significance and the confidence interval incorporates both increased and decreased risk of admission in the consumer‐provider group (RR 0.68 (95% CI 0.45 to 1.03), Analysis 1.15). This finding is based on self‐reported recall of hospitalisation at interviews conducted every 6 months for 114 participants who were aware of treatment allocation. Potential selection bias or performance bias did not result in an effect estimate that significantly favours either group.
We were unable to calculate a summary estimate for Solomon 1995 which reported no difference between groups. As Clarke 2000 and Solomon 1995 both involve similar numbers of participants, incorporating missing data from Solomon 1995 in a pooled analysis with Clarke 2000 is unlikely to show a significant difference between groups.
Two studies collected information on length of hospital stay. Rivera 2007 compared the length of stay for 136 participants and found no significant difference between groups (MD 1.10 (95% CI ‐0.72 to 2.92), Analysis 1.16). We were unable to calculate a summary estimate for Solomon 1995 which reported no significant difference between groups. Depending on the measure of variance in the outcome data of Solomon 1995, it is unclear whether inclusion of this missing data for 96 participants in a pooled analysis would result in an overall significant difference in hospital stays between the groups.
Client attrition
All five studies in Comparison 1 (consumer‐provider versus professional staff) experienced dropouts or described reasons why participants were unable to be assessed at follow up. We were unable to determine whether losses were balanced across treatment groups in Clarke 2000 (20/178 across all three arms; 11% attrition overall) or Rivera 2007 (52/255 across all three arms; 20% attrition overall). Most of the lost participants in Clarke 2000 failed to commence treatment with the assigned provider, and it is unclear whether this related to group assignment. Most of the losses in Rivera 2007 were due to participants being discharged to long‐term residential care that precluded enrolment in the clinic‐based arm of the trial, although the trialists state there were no differences in the characteristics of participants who were excluded and those who remained in the study. The other three studies ranged in overall attrition from 5% (Solomon 1995) to 46% (Sells 2006) and losses were balanced across groups (RR 0.80 (95%CI 0.58 to 1.09), P = 0.16) (Analysis 1.9).
6) Service provision patterns (caseload, time allocated to tasks, location of services, case manager tasks)
Caseload
Of the five studies in Comparison 1, only two studies appeared to have balanced caseloads between the consumer‐provider and professional staff groups (Bright 1999; Solomon 1995). In Analysis 1.10 we present a comparison of caseload, number of personnel, or number of clients assigned to each treatment group. Clarke 2000 had lower numbers of clients in the consumer‐provider groups compared to the professionals. The workload of individual personnel also differed between treatment groups in Rivera 2007, in which four consumer‐providers were employed at half‐time compared to two professionals that were employed full‐time. It is unlikely these small differences would significantly bias performance in favour of consumer‐providers, however this is not the case for Sells 2006 in which consumer‐providers had approximately half the caseload compared to professional staff. Significant differences in caseload or the time spent with clients may have biased outcomes in favour of the service delivered by consumer‐providers in this study.
Time allocated to tasks
Two studies compared the time that consumer‐providers and professionals spent on different tasks within a case manager's role (Clarke 2000; Solomon 1995). We were unable to calculate summary estimates for Clarke 2000 which reported the percentage of overall time spent with the team, clients, alone, or with family members, staff and other agencies or operators. Clarke 2000 reported no differences between consumer‐providers and professionals in how much time was spent across each of the different categories (Analysis 1.11). In Solomon 1995 each case manager in the two treatment groups recorded time spent on different activities. Overall, consumer‐providers spent at least 18 hours more time face‐to‐face with clients (MD 28.25 hours (95%CI 18.06 to 38.45)) and at least 13 hours less time on the telephone with clients (MD ‐15.90 hours (95% CI ‐18.55 to ‐13.25) compared to professional staff. Consumer‐providers also spent at least 8 hours less time in contact with client family and friends (MD ‐13.16 hours (95% CI ‐18.54 to ‐7.78)) and at least 16 hours less time with provider agencies and staff (MD ‐23.58 hours (95% CI ‐30.84 to ‐16.32)). However the mean difference in number of hours spent by consumer‐providers on all case management services was not significantly different (MD 19.28 hours (95% CI ‐5.09 to 42.63) compared to professional staff.
Location of services
Two studies reported the locations at which case managers provided service to clients (Clarke 2000; Solomon 1995). We were unable to calculate summary estimates for Clarke 2000 which reported similar percentages of time for both groups providing service to clients at the study institution (consumer‐provider 15% versus professional 13%) but a difference in the proportion of time spent with clients outside the office (consumer‐provider 61% versus professional 73%) (Analysis 1.12) without reporting any measures of variance. Solomon 1995 found that consumer‐providers spent more time providing services in the client's home (MD 4.02 hours (95% CI 0.30 to 7.74)), on the street (MD 3.39 hours (95% CI 0.77 to 6.01)), or at the provider agency (MD 26.49 hours (95% CI 15.68 to 37.30)) and less time in the office (MD ‐50.29 hours (95% CI ‐63.51 to ‐37.07)) or hospital (MD ‐3.97 hours (95% CI ‐6.50, ‐1.44)) compared to professional staff.
Case manager tasks
Only Clarke 2000 provided a detailed account of the types of tasks undertaken within the case manager role; categorised as either tasks related to service provision or administrative tasks. We were unable to calculate summary estimates to determine whether there were any significant differences in the tasks undertaken by each group (Analysis 1.13).
Secondary outcomes
7) Professional's attitudes
Solomon 1995 assessed the client‐manager relationship from the provider's perspective using the Working Alliance Inventory. The effect estimate for this outcome at two years is imprecise and the confidence interval incorporates differences in favour of both groups (MD 2.56 (95% CI ‐9.51 to 14.63) (Analysis 1.17)).
8) Financial costs of service provision
There were no studies reporting information about the costs of service provision.
Comparison 2: Consumer‐provider as adjunct versus usual care
Six studies compared groups receiving usual care with groups receiving services from consumer‐providers in addition to usual care (Craig 2004; Gordon 1979; Kaufmann 1995; O'Donnell 1999; Sledge 2011; Rogers 2007).
Summary
Overall, the six low to moderate quality studies found no difference in psychosocial, client satisfaction or service use outcomes. One study found a small difference favouring the intervention group for both staff and client ratings of clients' needs having been met; however the staff rating may have been affected by detection bias. The six studies did not report mental health measures, adverse outcomes for clients or financial costs.
Primary outcomes for clients receiving services
1) Standardised measures of psychosocial outcomes (quality of life, empowerment, function, social relations)
Quality of life
O'Donnell 1999 (N = 84) assessed the effects of client quality of life, of client‐focused case management services provided for 12 months with or without the addition of a consumer (consumer‐provider) advocate. The study used a modified version of the Quality Of Life Index for Mental Health (QOLIMH) and reported no significant difference between groups, although insufficient data were reported to calculate a summary estimate.
Empowerment
One study assessed empowerment (Rogers 2007) and a second study of 80 participants measured motivation for change, self‐determination and hope (Sledge 2011), however these data are yet to be published. Rogers 2007 is a multi‐site study involving 1827 participants. It investigated the effects of attending a consumer operated service provider (COSP) in addition to traditional mental health services. The study used a Making Decisions Empowerment (MDE) questionnaire and reported no significant difference in clients' subjective feelings of empowerment after 12 months between groups (time x group interaction F(1.4059) = 2.30, P = 0.13). It also found no significant difference between groups on the Personal Empowerment (PE) questionnaire in how much choice clients felt they had in their lives (time x group interaction F(1.4062) = 3.53, P = 0.06). Nor was there a significant difference between groups in how they rated the amount of certainty in their social, residential, and financial lives (time x group interaction F(1.4025) = 0.05, P = 0.82). It is important to consider the moderate attendance at COSPs by the intervention group (57%) and potential confounding by those attending COSPs in the control group (15%) for this study, which largely compromises the reliability of these findings.
Function
One small study (Craig 2004) assessed function and disability using the Life Skills Profile (LSP). Data from a second study that also measured function status are not yet published (Sledge 2011). Craig 2004 investigated the impact of adding consumer‐providers as healthcare assistants to assertive outreach teams. Although the overall results for the LSP at 12 months did not reach statistical significance, the wide confidence interval of the summary estimate incorporates important differences in both directions for participants receiving additional support from consumer‐providers (MD 3.00 (95% CI ‐5.75 to 11.75), Analysis 2.1). It is important to note that some of the control group also attended social functions hosted by the consumer‐providers, which may have confounded the results. Participants were aware of treatment allocation in this study and variation in the results could have been biased based on individual participant beliefs about the capability of consumer‐providers to help with their condition.
Social relations
Craig 2004 and Sledge 2011 assessed participant satisfaction with their own social network. Craig 2004 used the Significant Others Scale (SOS) and found no significant difference after 12 months between groups (MD ‐0.10 (95% CI ‐0.53 to 0.33), Analysis 2.2). Data are not yet available for Sledge 2011.
2) Standardised measures of mental health (general symptoms, depression)
Kaufmann 1995 planned to assess mental health symptoms. This study planned to involve 90 participants to investigate the effect of self‐help groups run by consumer‐providers in addition to care provided by community health centres. The trialists planned to collect data using the BPRS and Symptom Check List‐90 (SCL‐90) at six‐monthly intervals, however follow‐up data collection was stopped early because there was a low level of attendance at the self‐help groups for the intervention group (9 out of 54, 17%) as well as the control group (6 out of 36, 17%). No usable data were available from this study.
3) Adverse outcomes for clients
There were no adverse outcomes reported for clients in the six studies in Comparison 2.
Primary outcomes for service provision
4) Client satisfaction with service provision
Three studies assessed participant satisfaction with treatment (Craig 2004; O'Donnell 1999; Analysis 2.3), however Sledge 2011 has not yet published these data. Craig 2004 used the Verona Service Satisfaction Scale to assess participant satisfaction with both the service (SMD 0.24 (95% CI ‐0.37 to 0.85)) and staff (SMD 0.18 (95% CI ‐0.43 to 0.79)). O'Donnell 1999 assessed participant satisfaction with the service using a modified version of the Client Service Satisfaction Questionnaire (SMD 1.67 (95% CI 0.08 to 3.25)). The pooled effect estimate for satisfaction with service from Craig 2004 and O'Donnell 1999 (total N = 125) was SMD 0.76 (95% CI ‐0.59 to 2.10), P = 0.27, indicating no significant difference between groups.
Craig 2004 also used the client version of the Camberwell Assessment of Need to assess participants' satisfaction that their needs had been met, and described the result as demonstrating no important difference between groups even though the difference just reached statistical significance (SMD 0.68 (95% CI 0.05 to 1.31), P = 0.04).
5) Use of services (mental health services, hospital use, client attrition)
Use of mental health services
Craig 2004 (N = 45) compared participant attendance rates for clinic appointments (Analysis 2.4), and found no difference between groups (SMD 0.52 (95% CI ‐0.07 to 1.11), P = 0.09).
Hospital use
Craig 2004 compared the proportion of people in each group hospitalised during the 12‐month follow up period (Analysis 2.6). The addition of consumer‐providers as assistants in the intervention group did not result in any difference in this outcome (N = 45, RR 1.07 (95% CI 0.55 to 2.07), P = 0.84). Sledge 2011 measured the number of hospitalisations in each group during the 9‐month follow up period. The addition of consumer‐providers did not result in a difference in the number of hospitalisations between the two groups (MD ‐0.64; 95% CI ‐1.3 to 0.02; Analysis 2.7).
Comparison of the length of hospital stay across the two groups in Craig 2004 and Sledge 2011 was less precise, with wide confidence intervals (MD ‐13.41 (95% CI ‐32.09 to 5.27), P = 0.16). The overall difference between groups did not reach statistical significance (Analysis 2.8). Gordon 1979 also measured rehospitalisation (17.5% in intervention, 35% in control group), length of stay (7 days in intervention; 24.6 days in control group) and use of community mental health services (47.5% in intervention and 74% in control group) at ten months. While there were 80 people in the study, the number randomised to each arm was not provided.
Client attrition
Four of the six studies in Comparison 2 reported dropouts or described reasons why participants were unable to be assessed at follow up (Craig 2004; O'Donnell 1999; Rogers 2007; Sledge 2011). Kaufmann 1995 was stopped early due to low rates of participation in the intervention group, and cross‐over between the intervention and control groups (17% of subjects in both groups attended self‐help groups). We were unable to determine whether losses were balanced across treatment groups in Gordon 1979 and Rogers 2007. The remaining studies ranged in overall attrition from 9% (Craig 2004) to 30% (O'Donnell 1999). More participants were lost from the intervention group in O'Donnell 1999 but this difference did not appear to have been related to the intervention itself. Pooling results from Craig 2004, Sledge 2011 and O'Donnell 1999 showed no overall difference in attrition between intervention and usual care groups (RR 1.29 (95% CI 0.72 to 2.31), P = 0.39) (Analysis 2.5).
Secondary outcomes
7) Professionals' attitudes
One study included staff assessment of whether they felt the clients' needs had been met (Analysis 2.9). Craig 2004 reported a small but significant difference in favour of those receiving additional support from consumer‐providers (MD 1.56 (95% 0.50 to 2.62), P = 0.004). The statistical significance of this result is probably a result of detection bias as it is based on interviews with staff who were not blind to the intervention and had a vested interest in seeing it succeed.
8) Financial costs of service provision
No studies reported information about the costs of service provision.
Discussion
Summary of main results
Comparison 1
There is a small amount of low to moderate quality evidence based on three studies (total N = 363) that consumer‐providers have no significant effect on quality of life, function, or social relations after 12 months of case management services, compared to professional staff providing the same service (Rivera 2007; Sells 2006; Solomon 1995). Similarly, three studies of low to moderate quality (total N = 293) showed no significant differences in general mental health symptoms (Bright 1999; Rivera 2007; Solomon 1995). One small study at high risk of bias (N = 67) involving a 10‐week program of either mutual support group therapy or cognitive behavioural therapy showed no difference in depression symptoms between groups led by a consumer‐provider or professional (Bright 1999), consistent with the only other study to measure this outcome (Solomon 1995). The studies did not report any adverse outcomes for clients.
Two studies of low to moderate quality (total N = 213) demonstrated no difference in satisfaction with treatment between groups involving a consumer‐provider or professional staff (Rivera 2007; Solomon 1995). Two studies (N = 160) showed no difference in assessment of the client‐manager relationship between groups using case management services (Sells 2006; Solomon 1995).
Two low to moderate quality studies (Clarke 2000; Rivera 2007; total N = 150) demonstrated a small but significant decrease in crisis and emergency service use favouring consumer‐providers, although a third study without usable data reported no difference in this outcome. There was no difference between groups in terms of hospital admissions (Clarke 2000; Solomon 1995; N = 210) or length of stay (Rivera 2007; Solomon 1995; N = 232).
There did not appear to be a significant difference in uptake of mental health services (Rivera 2007; Solomon 1995; total N = 213) or attrition (3 studies, Bright 1999; Sells 2006; Solomon 1995; total N = 293). There were differences in caseloads, with consumer‐providers tending to have fewer clients (Bright 1999; Clarke 2000; Rivera 2007; Sells 2006; Solomon 1995). Results for time allocation, tasks, and location of service provision, were mixed (Clarke 2000; Solomon 1995).
Comparison 2
There is limited evidence from two low to moderate quality studies (N = 164) that the addition of consumer‐providers to existing mental health services has no significant impact on psychosocial outcomes including quality of life, function and social relations after 12 months (Craig 2004; O'Donnell 1999). The studies did not report any adverse outcomes for clients. Limited evidence (the same 2 studies involving up to 125 participants) suggests the addition of consumer‐providers has no significant impact on client satisfaction with services or staff, although in one study it did improve clients' satisfaction with having their needs met, but this result did not reach clinical importance. Limited evidence from two studies (Craig 2004; Sledge 2011; N = 119), indicates that the addition of consumer‐providers had no effect on clients' use of mental health services (including hospital use). Evidence from one small, moderate quality trial (Craig 2004, N = 45) suggests care providers may perceive the addition of consumer‐providers as leading to improvements in meeting clients' needs, although this is likely to have been affected by detection bias.
Overall completeness and applicability of evidence
Comparison 1
The main comparison for this review involved studies with a consumer‐provider in a role that was occupied by professional staff in the comparison group. Five studies were identified involving a total of 581 trial participants, however we were only able to collect outcome data for up to three studies (up to 331 participants) for each of the outcomes assessed in this review. Although we attempted to obtain missing data from trialists, we were unable to determine effect estimates for a number of outcomes in individual studies (particularly in Solomon 1995 and Sells 2006). In most cases, it is likely that outcomes were selectively reported based on the lack of statistically significant findings, as outcomes with missing data were often described as having no significant difference between groups. Table 2 provides a summary of missing data and reporting bias for the outcomes addressed in this review. As there was no strong evidence of effect across any of the outcomes we assessed, and outcomes with missing data were reported as 'non significant', the potential inclusion of missing data in meta‐analyses is unlikely to change the results of this review.
Current evidence indicates there is no clinically important benefit or harm when consumer‐providers are involved in the delivery of statutory mental health services. This evidence largely applies to consumer‐providers as case managers within community‐based mental health teams in the USA (Clarke 2000; Rivera 2007; Sells 2006; Solomon 1995). Interestingly, consumer‐providers and professionals in some studies interacted on the same treatment teams, attended the same meetings and were able to share practice activities, which may explain the lack of differences between groups if the consumer‐providers and professionals consequently adopted similar behaviours to each other.
Comparison 2
For the second comparison group (six studies, up to 2215 participants), the three USA studies involved consumer‐operated service providers as an adjunct to mental health services (Gordon 1979; Kaufmann 1995; Rogers 2007), and studies in the USA, UK and Australia involved consumer‐providers in advocacy roles (Craig 2004; O'Donnell 1999; Sledge 2011). Selective outcome reporting and missing data were also limitations for this comparison group. Summary estimates for most outcomes rely on data from one small study (N = 45) conducted by Craig 2004. Several outcomes from O'Donnell 1999 (N = 84) had insufficient data for inclusion in a pooled analysis with Craig 2004 but results are unlikely to show any significant difference in outcomes between groups (O'Donnell 1999 reported no significant difference for outcomes where data were missing).
Both Kaufmann 1995 and Rogers 2007 involved referral to consumer‐operated services in addition to usual care, and both studies indicated uptake of these services across comparison groups as a confounder of the outcomes evaluated. These studies suggest spontaneous uptake of consumer‐operated services may be between 15% to 17% when clients are not actively encouraged to attend (ie in usual care), with a potential participation rate of 57% when clients are encouraged to attend the services. These findings have implications for future studies (ie designing an intervention that takes into account potential non‐adherence) and indicates there may be limited uptake of these interventions outside a research context, where uptake of services would be expected to be less.
Interestingly, Rogers 2007 was the largest study (N = 1827) included in this review (Comparison 2) and the outcomes reported in this study (empowerment) were not assessed in any other studies. The applicability of these findings and the contribution of this large study to the overall body of evidence is therefore very limited.
Consideration of resources and costs
Given there is no strong evidence of significant clinical benefits or harms when employing consumer providers, there may be other factors such as resources and cost that should be considered for this type of intervention. Consumer‐providers may be considered a lower cost alternative to degree‐qualified health professionals (Salzer 2010), but others may argue the cost implications are the same if life experience is considered acceptable preparation for case management (Solomon 1995).
Importantly, our review identifies potential differences in working capacity (Sells 2006) and professional expertise, and potential increases in staff turnover (Craig 2004; O'Donnell 1999) for consumer‐providers that must be taken into account in any cost‐benefit analysis. Some studies noted absenteeism, and challenges in retaining consumer‐providers. Several consumer‐providers resigned due to the work being too stressful, training too lengthy, travel distance, and the negative effect of employment on welfare benefits (Clarke 2000; Craig 2004; O'Donnell 1999; Sells 2006). Almost all of the studies showed that consumer‐providers had reduced caseloads or working hours compared to professional staff in the same role (Analysis 1.10; Bright 1999; Clarke 2000; Rivera 2007; Sells 2006). There may also be differences in expected deliverables between consumer‐providers and professional staff, as indicated in qualitative data collected by Sells 2006: "Peers were not required to fulfil traditional case manager responsibilities, giving them time and attention to devote to their clients". It is unclear what the potential impact would be for clients if traditional case manager responsibilities were reduced for professional staff as well and they too had added time to devote attention to their clients.
Qualitative data reported in trials
Six included studies (Clarke 2000; Craig 2004; Gordon 1979; O'Donnell 1999; Sells 2006; Solomon 1995) also examined qualitative experiences of consumer‐providers as providers of statutory mental health services and the impacts on both the consumer‐providers themselves as well as the health professional providers, participants and/or carers.
The main recurring themes were:
-
Consumer‐providers were expected to develop their role over time. They tended to feel this severely hampered their service delivery and created a perception that employing a consumer‐provider was a token gesture.
-
Consumer‐provider absenteeism due to illness or relapse of their mental health condition increased caseload for remaining staff.
-
Some consumer‐providers experienced the role as highly rewarding and important to their lives (Gordon 1979).
-
Traditional staff felt there were added expectations to support, train and supervise consumer‐providers within mental health teams, increasing their workload or adding burden.
-
Some professional staff found it challenging to manage having different ‘providers' in the team.
-
Clients felt there were limited outcome measures relevant to assessing the impact of consumer‐providers in mental health services.
Clients' beliefs about the capability of past or current service users to improve the client's condition may impact on these interventions' effects. Awareness of the care‐provider's history may be an important factor for clients' behaviour modification, and subsequent receptiveness and adherence to treatment. This is reflected in qualitative data exploring how the involvement of consumer‐providers is perceived by professional staff and consumer‐providers themselves, and their clients and carers. These data suggest that:
-
a clearer description of the consumer‐provider tasks, responsibilities and expected deliverables is required;
-
employing more consumer‐providers and providing a support network for them may address relapse and absenteeism;
-
addressing preconceptions and impacts on traditional staff by better outlining consumer‐provider roles, and the required training and support would be beneficial; and
-
the effects on consumer‐providers themselves, including impact on skill levels, employment outcomes, social functioning, quality of life and the need to return to treatment, require further consideration.
The consumer‐provider role
It is important to consider the role given to consumer‐providers within statutory mental health services in the included studies, and the degree of training and support required. At least two of the studies indicated the role of consumer‐providers was unclear, and developed throughout the duration of the trial (O'Donnell 1999; Sells 2006). Training and ongoing supervision of consumer‐providers were described in most studies and, whilst lengthy training was considered one of the barriers to retaining staff, some consumer‐providers felt they had received insufficient training for their role (Craig 2004). Future studies would benefit from having a clear description of the consumer‐provider role (eg specific tasks, responsibilities and expected deliverables of the role) and relevant training for the role so that it can be readily implemented. The ongoing supervision provided by professional staff should also be considered as an additional resource that is needed to support consumer‐providers in their role.
Outcomes
During the lengthy gestation of this review, the research and practice context relating to user involvement in mental health service provision has changed. A new focus on individual recovery pathways (rather than cure, per se) should be reflected in the explicit consideration of different client outcomes, as well as community outcomes, in future updates of the review. These may include hope and optimism, life satisfaction, wellness, confidence, connectedness, community empowerment and social support (Greenfield 2008; Simon 2011; Sledge 2011; van Gestel 2012).
Quality of the evidence
The overall evidence of the effects of employing past or current users of mental health services is of moderate to low quality (Figure 3), and is largely based on findings from three relatively small studies (total N = 363). It is unclear whether studies took appropriate measures to allocate clients of mental health services to groups with either a consumer‐provider or professional staff member independent of any potential bias the trialists, care providers, or clients had about their expected outcomes for each group. A lack of standard outcome measures across trials means it is difficult to pool outcomes across separate studies. Selective or incomplete reporting of study outcomes is a key limitation of the included studies with some studies failing to report on all of the outcomes that were assessed, others not providing comparison data across treatment groups, and one study using outcome measures specifically designed for their own study that are not assessed in any other studies. While most studies declared their funding sources, none discussed the role or level of input the funder had.
Potential biases in the review process
This review was conducted according to methods specified in the Cochrane Handbook for Systematic Reviews of Interventions (Higgins 2011). This advice is based on empirical evidence and current international consensus for methods that minimise bias in the conduct of systematic reviews. We attempted to contact all authors of included studies for missing data and, whilst receiving some responses, were unable to obtain any further unpublished data for inclusion in the review. Nevertheless we have considered the potential impact of including missing data for outcomes presented in the review.
A variety of terms is used to describe consumer‐providers (eg users, survivors, peers) in the literature and it is possible that potentially relevant studies using alternative terms to those listed in the search strategy may not have been identified in our searches. Moreover, whilst no language restrictions were applied in our searches, we did not search non‐English language databases, which may have resulted in a bias towards English‐language papers in this review. We welcome suggestions of any potentially eligible trials that were not assessed for inclusion in this review.
Agreements and disagreements with other studies or reviews
A previous review (Simpson 2002) identified eight studies involving users as employees of mental health services. Five of these studies were non‐randomised trials or observational studies and were ineligible for inclusion in this review. The remaining three studies (Solomon 1995; Clarke 2000; O'Donnell 1999) are included in both reviews. Simpson and colleagues identified key differences in service delivery between consumer‐providers and non consumer‐providers that are consistent with the findings of this review. Overall, consumer‐providers spent longer in supervision, in face‐to‐face contact with clients, or doing outreach work, and they spent less time on the telephone or in the office. Simpson 2002 also reported the higher turnover rate of consumer‐providers and the observation that consumer‐providers had less distinct professional boundaries. They concluded that consumer‐providers did not have any detrimental effect on clients in terms of symptoms, functioning, or quality of life which is also reflected in our review's findings. However, our review also found no significant difference in client satisfaction with their personal circumstances or hospitalisation, whilst Simpson 2002 reported improvement in these outcomes for clients of consumer‐providers.
Wright‐Berryman 2011 reviewed the literature on consumer‐provided services on assertive community treatment and intensive case management teams, and concluded that there was some evidence to support consumer‐provided services for improving engagement and reducing hospitalisation. Evidence of the intervention's impact on reducing symptoms and improving quality of life was, however, lacking. The authors' findings of limited evidence on the impact of consumer‐provided services accords with our review. Likewise, Cook 2011 briefly reviewed the evidence for peer‐provided, recovery‐oriented mental health services and found results similar to those of our review, namely that randomised trials show comparable outcomes for peer and non‐peer provided services.
We look forward to the completion of the Van Ginneken 2011 review of non‐specialist health workers providing mental health care in low and middle income countries, to assess the extent to which our review's findings are consistent with it. The review of lay health workers for improving maternal and child health and the management of infectious diseases (Lewin 2010) identified improvements in maternal and child health (specifically breastfeeding, immunisation, and childhood morbidity and mortality), and limited improvements in tuberculosis management, through the use of lay health workers. Lewin's review included substantially more studies (N = 82), in a wider range of settings than this review. Its promising findings are not inconsistent with those of our review, indicating that non‐professional staff can effect positive health outcomes for clients.

Graphical representation of comparisons 1 and 2

Risk of bias summary: review authors' judgements about each risk of bias item for each included study.
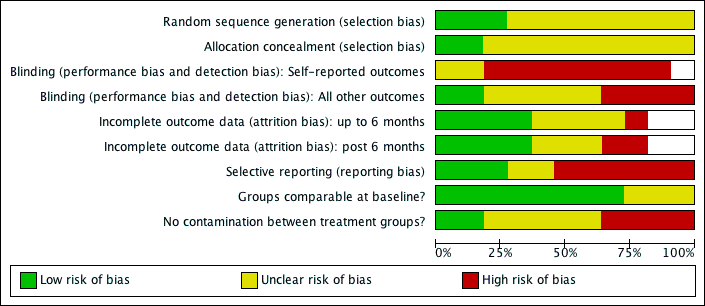
Risk of bias graph: review authors' judgements about each risk of bias item presented as percentages across all included studies.
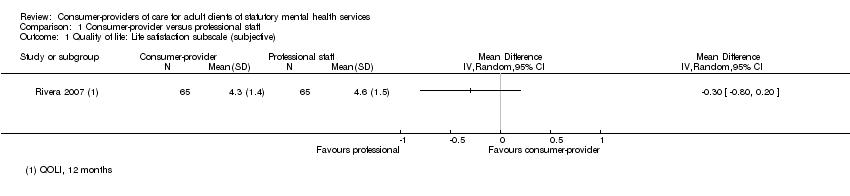
Comparison 1 Consumer‐provider versus professional staff, Outcome 1 Quality of life: Life satisfaction subscale (subjective).

Comparison 1 Consumer‐provider versus professional staff, Outcome 2 Function: Daily activities subscale (subjective).

Comparison 1 Consumer‐provider versus professional staff, Outcome 3 Social: Social relations subscale (subjective).
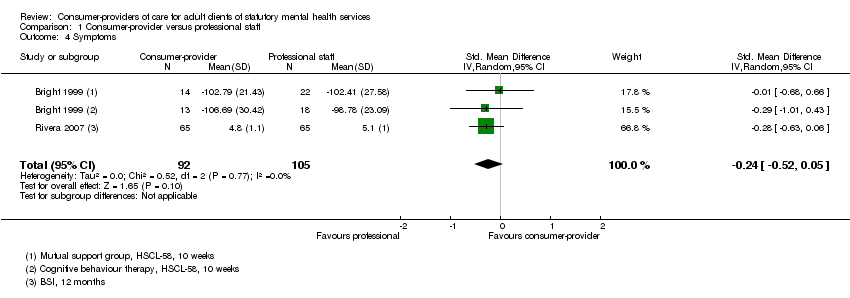
Comparison 1 Consumer‐provider versus professional staff, Outcome 4 Symptoms.

Comparison 1 Consumer‐provider versus professional staff, Outcome 5 Depression.

Comparison 1 Consumer‐provider versus professional staff, Outcome 6 Satisfaction.

Comparison 1 Consumer‐provider versus professional staff, Outcome 7 Client manager relationship.
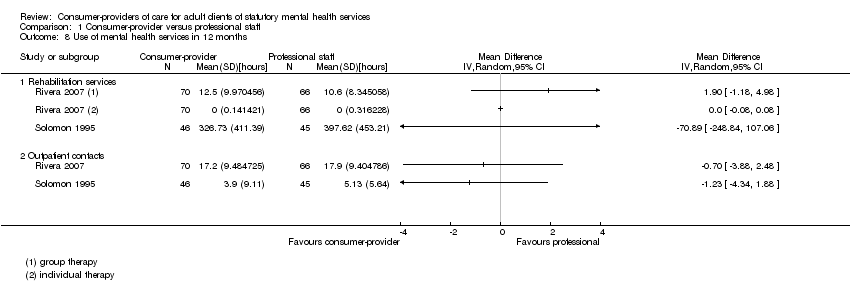
Comparison 1 Consumer‐provider versus professional staff, Outcome 8 Use of mental health services in 12 months.

Comparison 1 Consumer‐provider versus professional staff, Outcome 9 Attrition.
| Study | Description | Consumer‐provider | Professional staff |
| Bright 1999 | Caseload (Mutual support groups) | n = 22 | n = 27 |
| Bright 1999 | Caseload (Cognitive behavioural therapy groups) | n = 21 | n = 27 |
| Clarke 2000 | Average caseload | 4.6 clients/case manager | 5.4 clients/case manager |
| Rivera 2007 | Personnel | 4 x 0.5 EFT personnel (n = 70) | 2 x 1.0 EFT personnel (n = 66) |
| Sells 2006 | Average caseload | 10 to 12 clients/case manager | 20 to 24 clients/case manager |
| Solomon 1995 | Personnel | 4 personnel (n = 48) | 4 personnel (n = 48) |
Comparison 1 Consumer‐provider versus professional staff, Outcome 10 Service provision: Caseload/personnel.
| Study | Time spent with | Consumer‐provider | Professional staff | Effect measure |
| Clarke 2000 | Team | 40% | 40% | not estimable |
| Clarke 2000 | Clients | 33% | 33% | not estimable |
| Clarke 2000 | Alone | 25% | 25% | not estimable |
| Clarke 2000 | Family/staff and other agencies/operators | 6% | 6% | not estimable |
| Clarke 2000 | ||||
| Solomon 1995 | Face‐to‐face with client | mean 38.2 (SD 33.63), n=46 | mean 9.95 (SD 10.54), n = 45 | MD 28.25 hours [95% CI 18.06 to 38.45] |
| Solomon 1995 | Telephone with client | mean 5.90 (SD 6.44), n = 46 | mean 21.8 (SD 6.44), n = 45 | MD ‐15.90 hours [95% CI ‐18.55 to ‐13.25] |
| Solomon 1995 | Contact with client family/friends | mean 0.46 (SD 1.22), n = 46 | mean 13.62 (SD 18.38), n = 45 | MD ‐13.16 hours [95% CI ‐18.54 to ‐7.78] |
| Solomon 1995 | Contact with provider agency or staff | mean 1.98 (SD 7.03), n = 46 | mean 25.56 (SD 23.87), n = 45 | MD ‐23.58 hours [95% CI ‐30.84 to ‐16.32] |
| Solomon 1995 | All case management services | mean 83.79 (SD 63.71), n = 46 | mean 64.51 (SD 54.62), n = 45 | MD 19.28 hours [95% CI ‐5.08 to 43.63] |
Comparison 1 Consumer‐provider versus professional staff, Outcome 11 Service provision: Time allocation.
| Study | Location | Consumer‐provider | Professional staff | Effect measure |
| Clarke 2000 | Out of office (eg client home or public place) | 61% | 73% | not estimable |
| Clarke 2000 | Institution | 15% | 13% | not estimable |
| Clarke 2000 | ||||
| Clarke 2000 | ||||
| Clarke 2000 | ||||
| Solomon 1995 | Office | mean 13.01 (SD 13.77), n = 46 | mean 63.30 (SD 43.15), n = 45 | MD ‐50.29 hours [95% CI ‐63.51 to ‐37.07] |
| Solomon 1995 | Client's home | mean 9.23 (SD 9.71), n = 46 | mean 5.21 (SD 8.34), n = 45 | MD 4.02 hours [95% CI 0.30 to 7.74] |
| Solomon 1995 | On the street | mean 4.89 (SD 8.32), n = 46 | mean 1.50 (SD 3.52), n = 45 | MD 3.39 hours [95% CI 0.77 to 6.01] |
| Solomon 1995 | Provider agency | mean 28.44 (SD 37.29), n = 46 | mean 1.95 (SD 3.01), n = 45 | MD 26.49 hours [95% CI 15.68 to 37.30] |
| Solomon 1995 | Hospital (no difference in days hospitalised between groups) | mean 1.08 (SD 2.55), n = 46 | mean 5.05 (SD 8.30), n = 45 | MD ‐3.97 hours [95% CI ‐6.50 to ‐1.44] |
Comparison 1 Consumer‐provider versus professional staff, Outcome 12 Service provision: Location of services.
| Study | Category | Consumer‐provider | Professional staff |
| Service categories | |||
| Clarke 2000 | Support/structure | 14% | 15% |
| Clarke 2000 | Treatment Plan | 3% | 6% |
| Clarke 2000 | Service Coordination | 8% | 8% |
| Clarke 2000 | Crisis | 1% | 1% |
| Clarke 2000 | Assess/monitor | 6% | 7% |
| Clarke 2000 | Training (skill/job) | 1% | 3% |
| Clarke 2000 | Transporting | 3% | 5% |
| Clarke 2000 | Counselling | 3% | 3% |
| Clarke 2000 | Other | 3% | 2% |
| Administrative | |||
| Clarke 2000 | Travel | 11% | 11% |
| Clarke 2000 | Paperwork | 13% | 14% |
| Clarke 2000 | Administration/Supervision | 15% | 8% |
| Clarke 2000 | Team meetings | 19% | 17% |
| Clarke 2000 | |||
| Clarke 2000 | |||
| Clarke 2000 | |||
| Clarke 2000 | |||
| Clarke 2000 | |||
Comparison 1 Consumer‐provider versus professional staff, Outcome 13 Service provision: Case manager tasks.

Comparison 1 Consumer‐provider versus professional staff, Outcome 14 Crisis/emergency service.

Comparison 1 Consumer‐provider versus professional staff, Outcome 15 Hospital admissions.

Comparison 1 Consumer‐provider versus professional staff, Outcome 16 Length of stay.

Comparison 1 Consumer‐provider versus professional staff, Outcome 17 Professional's attitude: client manager relationship.
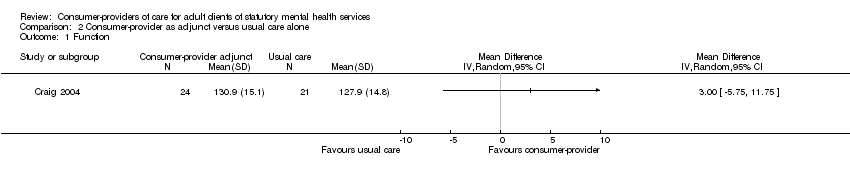
Comparison 2 Consumer‐provider as adjunct versus usual care alone, Outcome 1 Function.

Comparison 2 Consumer‐provider as adjunct versus usual care alone, Outcome 2 Social.
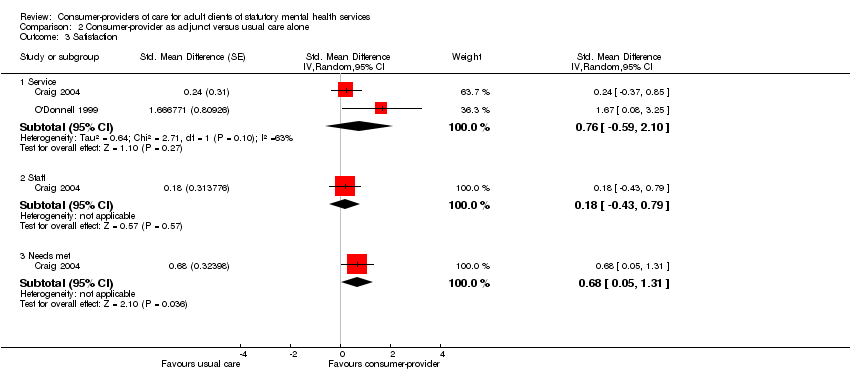
Comparison 2 Consumer‐provider as adjunct versus usual care alone, Outcome 3 Satisfaction.

Comparison 2 Consumer‐provider as adjunct versus usual care alone, Outcome 4 Use of mental health services: attendance at clinic appointments.

Comparison 2 Consumer‐provider as adjunct versus usual care alone, Outcome 5 Attrition.

Comparison 2 Consumer‐provider as adjunct versus usual care alone, Outcome 6 Any hospital admissions.
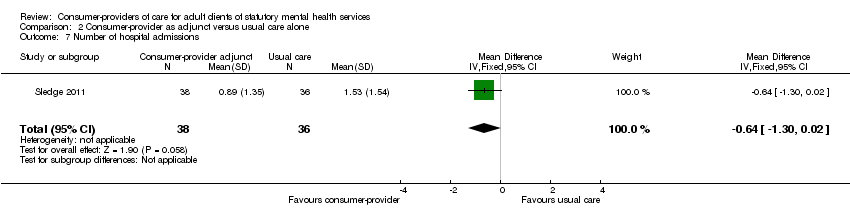
Comparison 2 Consumer‐provider as adjunct versus usual care alone, Outcome 7 Number of hospital admissions.

Comparison 2 Consumer‐provider as adjunct versus usual care alone, Outcome 8 Length of hospital stay.
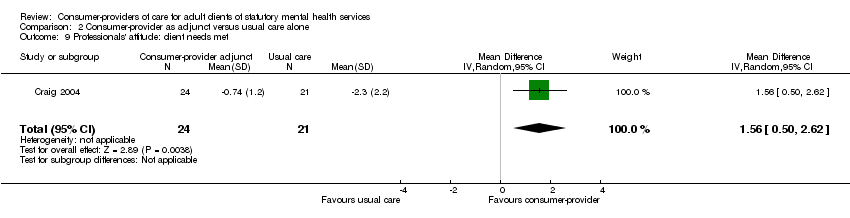
Comparison 2 Consumer‐provider as adjunct versus usual care alone, Outcome 9 Professionals' attitude: client needs met.
| Tool | Abbreviation | Reference/s | Description | Outcome | Assessor | Studies |
| Lehman Quality of Life (also in Brief Version) | QOLI (and QOLI‐Brief) | Subjective subscales: Life satisfaction, Daily activities, Family contact, Social relations, Finances, Health, Safety (score 1‐7). Objective subscales: Family contacts, Social relations (score 1‐5), Daily activities, Finances (score 0‐1). Higher scores better. | Quality of life | Client self‐report (interview) | ||
| Quality of Life Index for Mental Health | QOLIMH | A brief 25‐item questionnaire | Quality of life | Client self‐report | ||
| Making Decisions Empowerment | MDE | 28 items (score 1‐4). Responses are summed. Higher scores better (individual scale values reversed). | Empowerment | Client self‐report | ||
| Personal Empowerment | PE | 20 items with two sub‐scales; 1) choice and 2) reduction in chance. Choice sub‐scale employs four point Likert scale . Reduction in Chance sub‐scale employs five‐point scale. Responses are summed. Higher scores better (individual scale values reversed). | Empowerment | Client self‐report | ||
| Life Skills Profile | LSP | A 39‐item measure of function | Function | Case managers and families | ||
| Significant Others Scale | SOS | Interview assesses size of social network and ratings of qualitative aspects of support provided by individuals in the network. | Social | Client self‐report (interview) | ||
| Hopkins Symptoms Checklist‐58 | HSCL‐58 | 58‐items on a four‐point scale. Higher scores worse. | Symptoms | Client self‐report | ||
| Brief Symptom Inventory | BSI | Measures clinically relevant symptoms (score 1‐5). Higher scores better. | Symptoms | Client self‐report | ||
| Brief Psychiatric Rating Scale (also expanded version) | BPRS | 18 items (expanded version has 24 items) rated on seven point scale. Higher scores worse. | Symptoms | Trained interviewer | ||
| Symptom Check List‐90 | SCL‐90 | Self‐administered check list of 90 items rated on a five point scale (0 = not at all; 4 = extremely), eight sub scale scores were computed and three global indices, global severity index, positive symptoms distress index, and positive symptom total. | Symptoms | Client self‐report | ||
| Beck Depression Inventory | BDI | 21‐item scale. Each item consists of four statements of depressive symptoms (score 0‐3) and assesses respondents mood in the past week. Maximum score 63 (≥19 indicates significant depressive symptoms). Higher scores worse. | Depression | Client self‐report | ||
| Hamilton Rating Scale for Depression (revised) | HRSD | Observer‐rated scale for depressive symptomatology following clinical interview taking into account patient behaviour in the immediate preceding week (score 0‐52; 30 = severe illness). Higher scores worse. | Depression | Clinician | ||
| Behavioral Health Care Rating of Satisfaction | BHCRS | Client satisfaction with clinical staff and services (score 1‐6). Higher scores better. | Satisfaction | Client | ||
| Verona Service Satisfaction Scale | VSSS | 54 questions that cover seven dimensions: | Satisfaction | Client | ||
| Client Service Satisfaction Questionnaire | CSQ | Modified nine‐item scale. Higher scores better. | Satisfaction | Client | ||
| Satisfaction with treatment | Hoult 1983, modifying Stein 1980 | Interview based 16 item scale to measure client satisfaction with all MH treatment (not case management services alone) on a 4‐point scale. Higher scores associated with greater satisfaction, authors note that they used a modified version of the instrument for assessing community treatment team approach | Satisfaction | Trained interviewer | ||
| Camberwell Assessment of Needs | CAN | Sum score (possible score 0‐22). Higher scores worse. | Satisfaction | Can be rated independently by staff and clients | ||
| Barrett‐Lennard Relationship Inventory | BLRI | 64 items, six point scale (1=definitely false, 6=definitely true). Higher score better. | client‐counselor relationship | client self‐report | ||
| Working Alliance Inventory | WAI | 36 items (score 1‐7) equally divided across 3 subscales: Goals, Tasks, and Bonds. Higher scores better. | Client‐manager relationship | Client and case managers |
| Outcome | Studies assessed outcome | n studies with outcome data (total N included in analysis) | n studies with incomplete data (total N randomised) |
| COMPARISON 1 (n = 5) | |||
| Primary outcomes | |||
| QOL | 3 | 1 (130) | 2 (233) |
| Function | 3 | 1 (130) | 2 (233) |
| Social | 3 | 1 (130) | 2 (233) |
| Symptoms | 3 | 2 (197) | 1(96) |
| Depression | 2 | 1(67) | 1(96) |
| Satisfaction | 2 | 2 (213) | 0 |
| Client manager relationship | 2 | 2 (160) | 0 |
| Use of mental health services | 3 | 2 (227) | 1 (137) |
| Client attrition | 5 | 3 (333) | 2 (250) |
| Hospital admissions | 2 | 1 (114) | 1 (96) |
| Crisis/Emergency services | 3 | 2 (250) | 1 (96) |
| Length of stay | 2 | 1 (136) | 1 (96) |
| Secondary outcomes | |||
| Providers' attitudes | 1 | 1 (96) | 0 |
| COMPARISON 2 (n = 6) | |||
| Primary outcomes | |||
| QOL | 1 | 0 | 1 (84) |
| Function | 3 | 1 (45) | 2 (208) |
| Social | 2 | 1 (45) | 1 (89) |
| Symptoms | 1 | 0 | 1 (90) |
| Sense of community | 1 | 0 | 1 (89) |
| Motivation for change | 1 | 0 | 1 (89) |
| Self‐determination | 1 | 0 | 1 (89) |
| Hope | 1 | 0 | 1 (89) |
| Satisfaction | 2 | 2 (125) | 0 |
| Client manager relationship | 1 | 0 | 1 (89) |
| Use of mental health services | 1 | 1 (45) | 0 |
| Client attrition | 3 (218) | 3 (199) | |
| Hospital admissions | 3 (199) | 1 (84) | |
| Crisis/emergency services | 1 | 0 | 1 (84) |
| Length of stay | 4 | 3(199) | 1 (84) |
| Secondary outcomes | |||
| Providers' attitudes | 3 | 1 (45) | 2 (173) |
| Study | Other papers reporting study |
| Herinckx 1997; Paulson 1996; Paulson 1999 | |
| Doherty 2004 | |
| Edmunson 1982; Edmunson 1984; Gordon 1979b | |
| O'Donnell 1998 | |
| Johnsen 2005 | |
| Jewell 2006; Sells 2008 | |
| Solomon 1994a; Solomon 1994b; Solomon 1995b; Solomon 1995c; Solomon 1995d; Solomon 1996a; Solomon 1996b |
| Outcome or subgroup title | No. of studies | No. of participants | Statistical method | Effect size |
| 1 Quality of life: Life satisfaction subscale (subjective) Show forest plot | 1 | Mean Difference (IV, Random, 95% CI) | Totals not selected | |
| 2 Function: Daily activities subscale (subjective) Show forest plot | 1 | Mean Difference (IV, Random, 95% CI) | Totals not selected | |
| 3 Social: Social relations subscale (subjective) Show forest plot | 1 | Mean Difference (IV, Random, 95% CI) | Totals not selected | |
| 4 Symptoms Show forest plot | 2 | 197 | Std. Mean Difference (IV, Random, 95% CI) | ‐0.24 [‐0.52, 0.05] |
| 5 Depression Show forest plot | 1 | Mean Difference (IV, Random, 95% CI) | Totals not selected | |
| 5.1 Self‐report (BDI) at 10 weeks | 1 | Mean Difference (IV, Random, 95% CI) | 0.0 [0.0, 0.0] | |
| 5.2 Observer‐rated (HRSD) at 10 weeks | 1 | Mean Difference (IV, Random, 95% CI) | 0.0 [0.0, 0.0] | |
| 6 Satisfaction Show forest plot | 2 | 213 | Std. Mean Difference (IV, Random, 95% CI) | ‐0.22 [‐0.69, 0.25] |
| 7 Client manager relationship Show forest plot | 2 | 160 | Std. Mean Difference (IV, Random, 95% CI) | 0.22 [‐0.10, 0.53] |
| 8 Use of mental health services in 12 months Show forest plot | 2 | Mean Difference (IV, Random, 95% CI) | Totals not selected | |
| 8.1 Rehabilitation services | 2 | Mean Difference (IV, Random, 95% CI) | 0.0 [0.0, 0.0] | |
| 8.2 Outpatient contacts | 2 | Mean Difference (IV, Random, 95% CI) | 0.0 [0.0, 0.0] | |
| 9 Attrition Show forest plot | 3 | 331 | Risk Ratio (M‐H, Random, 95% CI) | 0.80 [0.58, 1.09] |
| 10 Service provision: Caseload/personnel Show forest plot | Other data | No numeric data | ||
| 11 Service provision: Time allocation Show forest plot | Other data | No numeric data | ||
| 12 Service provision: Location of services Show forest plot | Other data | No numeric data | ||
| 13 Service provision: Case manager tasks Show forest plot | Other data | No numeric data | ||
| 13.1 Service categories | Other data | No numeric data | ||
| 13.2 Administrative | Other data | No numeric data | ||
| 14 Crisis/emergency service Show forest plot | 2 | Std. Mean Difference (Random, 95% CI) | ‐0.34 [‐0.60, ‐0.07] | |
| 15 Hospital admissions Show forest plot | 1 | Risk Ratio (M‐H, Random, 95% CI) | Totals not selected | |
| 16 Length of stay Show forest plot | 1 | Mean Difference (IV, Random, 95% CI) | Totals not selected | |
| 17 Professional's attitude: client manager relationship Show forest plot | 1 | Mean Difference (IV, Fixed, 95% CI) | Totals not selected | |
| Outcome or subgroup title | No. of studies | No. of participants | Statistical method | Effect size |
| 1 Function Show forest plot | 1 | Mean Difference (IV, Random, 95% CI) | Totals not selected | |
| 2 Social Show forest plot | 1 | Mean Difference (IV, Fixed, 95% CI) | Totals not selected | |
| 3 Satisfaction Show forest plot | 2 | Std. Mean Difference (Random, 95% CI) | Subtotals only | |
| 3.1 Service | 2 | Std. Mean Difference (Random, 95% CI) | 0.76 [‐0.59, 2.10] | |
| 3.2 Staff | 1 | Std. Mean Difference (Random, 95% CI) | 0.18 [‐0.43, 0.79] | |
| 3.3 Needs met | 1 | Std. Mean Difference (Random, 95% CI) | 0.68 [0.05, 1.31] | |
| 4 Use of mental health services: attendance at clinic appointments Show forest plot | 1 | Std. Mean Difference (Random, 95% CI) | 0.52 [‐0.07, 1.11] | |
| 5 Attrition Show forest plot | 3 | 218 | Risk Ratio (M‐H, Random, 95% CI) | 1.29 [0.72, 2.31] |
| 6 Any hospital admissions Show forest plot | 1 | 45 | Risk Ratio (M‐H, Random, 95% CI) | 1.07 [0.55, 2.07] |
| 7 Number of hospital admissions Show forest plot | 1 | 74 | Mean Difference (IV, Fixed, 95% CI) | ‐0.64 [‐1.30, 0.02] |
| 8 Length of hospital stay Show forest plot | 2 | 119 | Mean Difference (IV, Random, 95% CI) | ‐13.41 [‐32.09, 5.27] |
| 9 Professionals' attitude: client needs met Show forest plot | 1 | 45 | Mean Difference (IV, Random, 95% CI) | 1.56 [0.50, 2.62] |