| Tool | Abbreviation | Reference/s | Description | Outcome | Assessor | Studies |
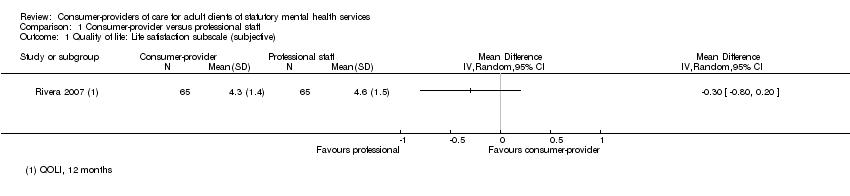
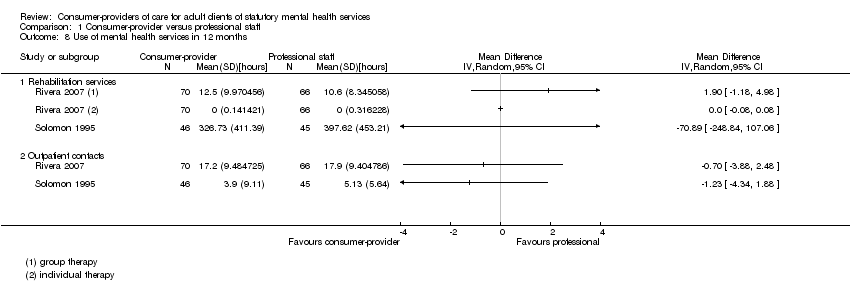
| Lehman Quality of Life (also in Brief Version) | QOLI (and QOLI‐Brief) | Lehman 1988 Lehman 1994 | Subjective subscales: Life satisfaction, Daily activities, Family contact, Social relations, Finances, Health, Safety (score 1‐7). Objective subscales: Family contacts, Social relations (score 1‐5), Daily activities, Finances (score 0‐1). Higher scores better. | Quality of life | Client self‐report (interview) | Sells 2006, Rivera 2007, Solomon 1995 |
| Quality of Life Index for Mental Health | QOLIMH | Becker 1993 | A brief 25‐item questionnaire
modified from the Quality of Life Index for Mental Health. | Quality of life | Client self‐report | O'Donnell 1999 |
| Making Decisions Empowerment | MDE | Rogers 1997 | 28 items (score 1‐4). Responses are summed. Higher scores better (individual scale values reversed). | Empowerment | Client self‐report | Rogers 2007 |
| Personal Empowerment | PE | Segal 1995 | 20 items with two sub‐scales; 1) choice and 2) reduction in chance. Choice sub‐scale employs four point Likert scale . Reduction in Chance sub‐scale employs five‐point scale. Responses are summed. Higher scores better (individual scale values reversed). | Empowerment | Client self‐report | Rogers 2007 |
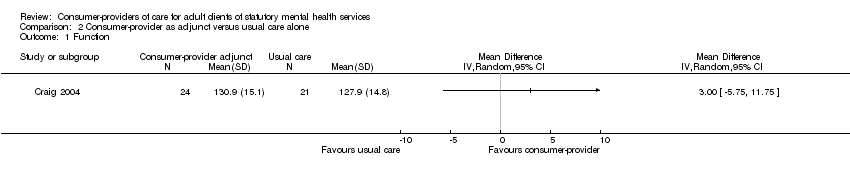
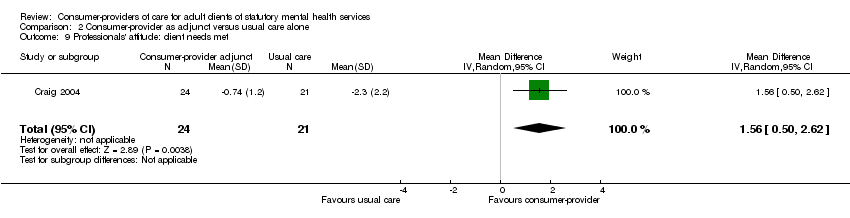
| Life Skills Profile | LSP | Rosen 1989 | A 39‐item measure of function
and disability. Higher scores better. | Function | Case managers and families | Craig 2004 |
| Significant Others Scale | SOS | Power 1988 | Interview assesses size of social network and ratings of qualitative aspects of support provided by individuals in the network. | Social | Client self‐report (interview) | Craig 2004 |
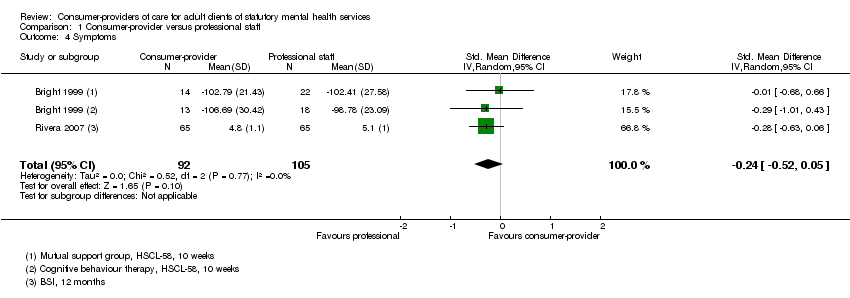
| Hopkins Symptoms Checklist‐58 | HSCL‐58 | Derogatis 1974 | 58‐items on a four‐point scale. Higher scores worse. | Symptoms | Client self‐report | Bright 1999 |
| Brief Symptom Inventory | BSI | Derogatis 1983 | Measures clinically relevant symptoms (score 1‐5). Higher scores better. | Symptoms | Client self‐report | Rivera 2007 |
| Brief Psychiatric Rating Scale (also expanded version) | BPRS | Overall 1962 Velligan 2005 | 18 items (expanded version has 24 items) rated on seven point scale. Higher scores worse. | Symptoms | Trained interviewer | Kaufmann 1995, Solomon 1995, |
| Symptom Check List‐90 | SCL‐90 | Derogardis 1977 | Self‐administered check list of 90 items rated on a five point scale (0 = not at all; 4 = extremely), eight sub scale scores were computed and three global indices, global severity index, positive symptoms distress index, and positive symptom total. | Symptoms | Client self‐report | Kaufmann 1995 |
| Beck Depression Inventory | BDI | Beck 1979 | 21‐item scale. Each item consists of four statements of depressive symptoms (score 0‐3) and assesses respondents mood in the past week. Maximum score 63 (≥19 indicates significant depressive symptoms). Higher scores worse. | Depression | Client self‐report | Bright 1999 |
| Hamilton Rating Scale for Depression (revised) | HRSD | Rehm 1985 | Observer‐rated scale for depressive symptomatology following clinical interview taking into account patient behaviour in the immediate preceding week (score 0‐52; 30 = severe illness). Higher scores worse. | Depression | Clinician | Bright 1999 |
| Behavioral Health Care Rating of Satisfaction | BHCRS | Dow 1995 | Client satisfaction with clinical staff and services (score 1‐6). Higher scores better. | Satisfaction | Client | Rivera 2007 |
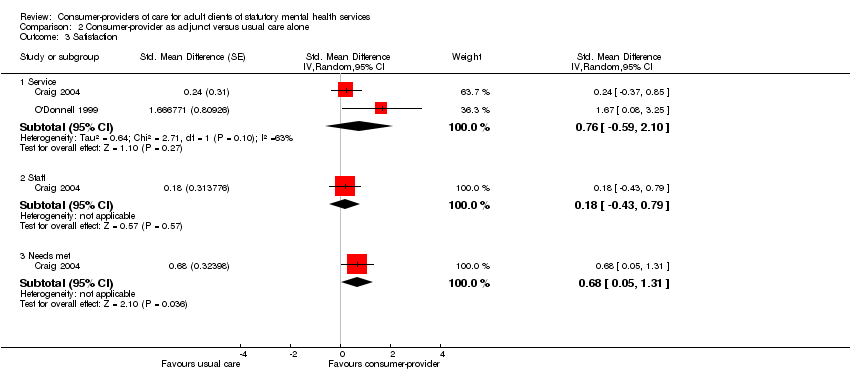
| Verona Service Satisfaction Scale | VSSS | Cozza 1997 | 54 questions that cover seven dimensions:
overall satisfaction, professionals’ skills and behaviour, information access, efficacy,
types of intervention and relative’s involvement. Higher scores better. | Satisfaction | Client | Craig 2004 |
| Client Service Satisfaction Questionnaire | CSQ | Larsen 1979 Greenfield 1989 | Modified nine‐item scale. Higher scores better. | Satisfaction | Client | O'Donnell 1999 |
| Satisfaction with treatment | | Hoult 1983, modifying Stein 1980 | Interview based 16 item scale to measure client satisfaction with all MH treatment (not case management services alone) on a 4‐point scale. Higher scores associated with greater satisfaction, authors note that they used a modified version of the instrument for assessing community treatment team approach | Satisfaction | Trained interviewer | Solomon 1995 |
| Camberwell Assessment of Needs | CAN | Phelan 1995 | Sum score (possible score 0‐22). Higher scores worse. | Satisfaction | Can be rated independently by staff and clients | Craig 2004 |
| Barrett‐Lennard Relationship Inventory | BLRI | Barrett‐Lennard 1962 | 64 items, six point scale (1=definitely false, 6=definitely true). Higher score better. | client‐counselor relationship | client self‐report | Sells 2006 |
| Working Alliance Inventory | WAI | Ralph 1992 Hovarth 1989 | 36 items (score 1‐7) equally divided across 3 subscales: Goals, Tasks, and Bonds. Higher scores better. | Client‐manager relationship | Client and case managers | Solomon 1995 |