| Posterior cruciate ligament retention versus sacrifice (all types of arthroplasty designs) |
| Patient or population: Patients receiving total knee arthroplasty with or without posterior stabilised design for the treatment of osteoarthritis
Settings: Hospital
Intervention: Posterior cruciate ligament retention
Comparison: Posterior cruciate ligament sacrifice |
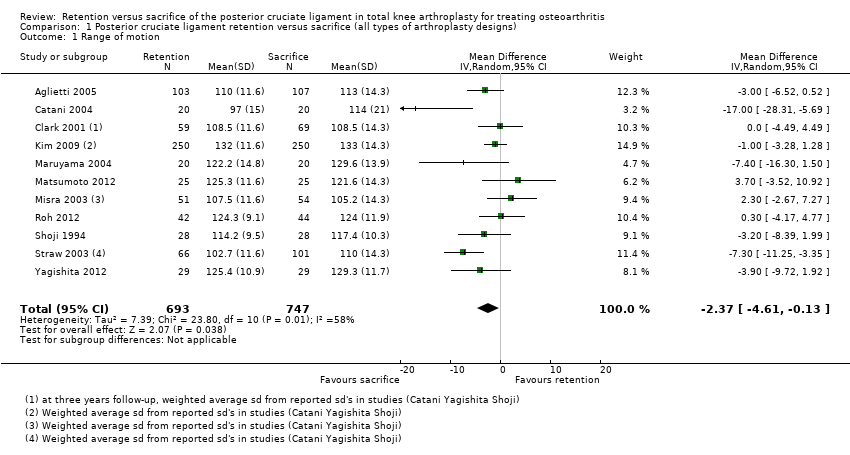
| Performance based measures ‐ Range of motion (possible range 0 (worst) to 140 (maximal) degrees) Follow‐up: 12‐78 months1 | The mean range of motion in the cruciate‐sacrifice group was 118.3 degrees (± SE 0.53) | The mean range of motion in the cruciate‐retaining group 2.40 lower (4.61 lower to 0.13 higher) | | Total No. of patients: 1,119 (62%) Total No. of knees: 1,440 (65%) | 11 studies (65%) | ⊕⊕⊝⊝
low2,3,4,5 | Absolute difference 2.40 lower (4.61 lower to 0.13 higher) Relative percent change: ‐2.0% (3.9% lower to 0.1% higher) Not statistically significant. |
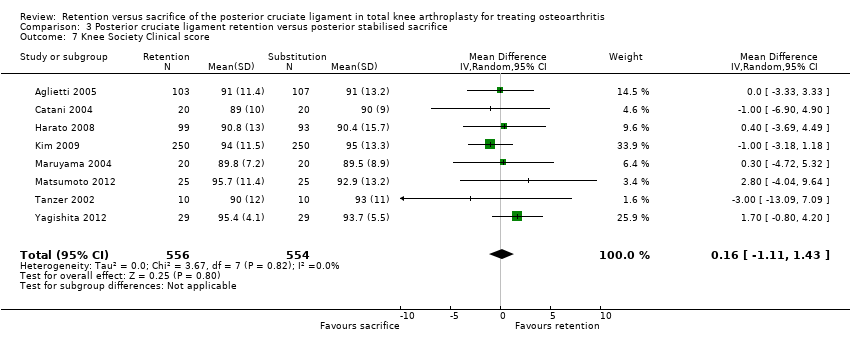
| Knee pain Knee Society Score, sub score pain (possible range of points 0 (severe pain) ‐ 50 (no pain)) Follow‐up: 24‐87 months years | The mean knee pain score in the cruciate‐sacrifice group was 48.3 points (± SE 0.54) | The mean knee pain score in the cruciate‐retention group was 0.01 higher (1.40 lower to 1.43 higher) | | Total No. of patients: 656 (36%) Total No. of knees: 1,004 (46%) | 4 studies (24%) | ⊕⊕⊕⊝
moderate2,5,6 | Absolute difference: 0.01 higher (1.40 lower to 1.43 higher) Relative percent change: 0.0% (2.9% lower to 3.0% higher) Not statistically significant. |
| Survival rate of the implant (Revision surgery reported) Follow‐up: 17‐87 months | See comment | See comment | Not estimable | Total No. of patients: 926 (51%) Total No. of knees: 1,229 (56%) | 7 studies (41%) | See comment | Insufficient data provided. Incidental remarks on implant survival could be derived from 7 studies. One study Misra 2003 reported 2 revisions in de cruciate‐retention group, Chaudhary 2008 1 in the cruciate‐retention group, Harato 2008 1 in the cruciate‐retention group and 3 in the sacrifice group. Aglietti 2005 1 revision in the cruciate‐sacrifice group due to septic loosening Kim 2009, Yagishita 2012 and Tanzer 2002 specifically reported no revision surgery had occurred during follow‐up |
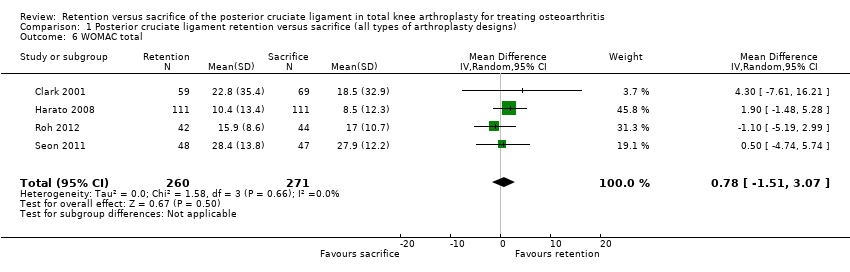
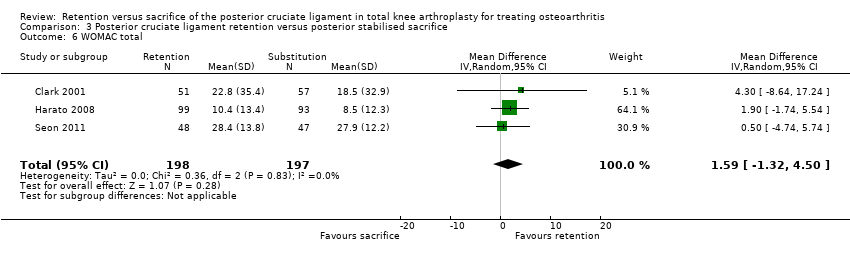
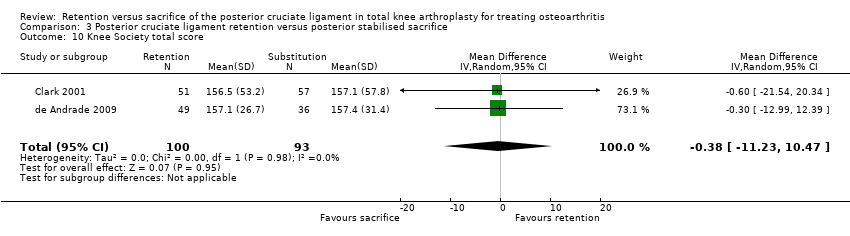
| Health related quality of life measures and functional measures with validated instruments (WOMAC, range 0‐100, higher scores indicate worse pain, stiffness and functional limitations) Follow‐up: 24‐87 months | The mean WOMAC total score in the cruciate‐sacrifice group was 15.0 points (± SE 1.2) | The mean WOMAC total score in the cruciate‐retention group was 0.78 higher (1.51 lower to 3.07 higher) | | Total No. of patients: 501 (28%) Total No. of knees: 531 (24%) | 4 studies (24%) | ⊕⊕⊝⊝
low2,3,4,5 | Absolute difference: 0.78 higher (1.51 lower to 3.07 higher) Relative percent change: 5.2% (10.0% lower to 20.5% higher) Not statistically significant. |
| Global assessment (patient) Patient satisfaction on scale 0 (not at all satisfied) to 10 (completely satisfied) Follow‐up: 12‐83 months | The mean satisfaction score in the cruciate‐sacrifice group was 7.910 | The mean satisfaction score in the cruciate‐retention group was 0.2 lower10 | | Total No. of patients: 103 (6%) Total No. of knees: 105 (5%) | 1 study (6%) | ⊕⊕⊝⊝
low2,5 | Absolute difference: 0.2 lower 10 Relative percent change: ‐2.5% 10 Not statistically significant. |
| Complications Follow‐up: 8‐87 months7 | See comment | See comment | Not estimable | Total No. of patients: 1,252 (69%) Total No. of knees: 1,635 (74%) | 11 studies (65%) | See comment | Due to the very diverse way of reporting and defining complications combining data for quantitative analysis was not possible8,9 |
| Re‐operation rate (not involving implant change, short and long term) Follow‐up: 24 months | See comment | See comment | Not estimable | Total No. of patients: 40 (2%) | 1 study (6%) | See comment | Catani 2004 reported 4 re‐operations; 3 patella luxations (2 in cruciate‐sacrificing, 1 in cruciate‐retention group) and 1 surgical manipulation due to lack of range of motion (in the cruciate‐retention group) |
| CI: Confidence interval; KSS: Knee Society Score, WOMAC: Western Ontario and McMasters Universities Osteoarthritis Index. NA: not applicable |
| GRADE Working Group grades of evidence
High quality: Further research is very unlikely to change our confidence in the estimate of effect.
Moderate quality: Further research is likely to have an important impact on our confidence in the estimate of effect and may change the estimate.
Low quality: Further research is very likely to have an important impact on our confidence in the estimate of effect and is likely to change the estimate.
Very low quality: We are very uncertain about the estimate. |