Sulfasalazin za ankilozirajući spondilitis
Referencias
References to studies included in this review
References to studies excluded from this review
Additional references
References to other published versions of this review
Characteristics of studies
Characteristics of included studies [ordered by study ID]
Ir a:
| Methods | Multicenter | |
| Participants | Participants fulfilling the modified New York criteria for definite AS Other inclusion criteria: Exclusion criteria: Age: 44.6 +/‐ 12.6 | |
| Interventions | SSZ 1.0 g orally, twice a day | |
| Outcomes | Primary: Secondary: | |
| Notes | This trial was funded by Department of Veterans Affairs and Medical Research Service All continuous outcomes were presented as both end point and change from baseline Subgroup analysis: | |
| Risk of bias | ||
| Bias | Authors' judgement | Support for judgement |
| Random sequence generation (selection bias) | Unclear risk | Insufficient information about the sequence generation process to permit judgment of Yes or No |
| Allocation concealment (selection bias) | Unclear risk | Insufficient information to permit judgment of Yes or No |
| Blinding (performance bias and detection bias) | Low risk | "Patients received either 500 mg of enteric‐coated SSZ tablets or an identical placebo". "The following physical assessment was made by a clinician" |
| Incomplete outcome data (attrition bias) | Low risk | "Withdrawals from the study were fewer than was anticipated by the Planning Committee". 36 patients from the SSZ group and 25 patients from the placebo group, the reasons for withdrawal were similar in both groups. The main study analysis based on intention‐to‐treat principles |
| Selective reporting (reporting bias) | Low risk | They reported the expected outcomes |
| Other bias | Low risk | The study appears to be free of other sources of bias |
| Methods | Randomized allocation | |
| Participants | Participants fulfilling the New York criteria for AS and requiring daily NSAIDs or analgesics Exclusion criteria: Age in SSZ group: 37.4 +/‐ 8.5 | |
| Interventions | SSZ 1.0 g orally, twice a day | |
| Outcomes | 1. Spinal pain (100 mm visual analogue scale) | |
| Notes | The active and placebo tablets were offered by Pharmacia Company and the author was supported by the Arthritis Foundation of New Zealand All continuous outcomes were presented as change from baseline Outcomes were also assessed at 4, 8, 12, 24, 36, weeks after the trial began Results were presented as means for each intervention group and 95% CI for difference between them SDs for each group were not given No significant difference was found between the intervention groups | |
| Risk of bias | ||
| Bias | Authors' judgement | Support for judgement |
| Random sequence generation (selection bias) | Low risk | "Patients were allocated to receive SASP or placebo using a randomisation protocol constructed from a table of random numbers in block four" |
| Allocation concealment (selection bias) | Unclear risk | Insufficient information to permit judgment of Yes or No |
| Blinding (performance bias and detection bias) | High risk | The trial is double‐blind placebo‐controlled. Although three participants broke the blinding, and two participants became aware of their therapy, the observers remained blinded |
| Incomplete outcome data (attrition bias) | Unclear risk | Not mention how many dropped out from either active group or placebo group |
| Selective reporting (reporting bias) | Low risk | They reported the expected outcomes |
| Other bias | Low risk | The study appears to be free of other sources of bias |
| Methods | Randomized allocation | |
| Participants | Participants fulfilling the New York criteria for AS and with active disease defined as: Exclusion criteria: Age (median and range) Duration of disease (median and range) | |
| Interventions | SSZ 2.0 g orally daily | |
| Outcomes | 1. Pain (100 mm visual analogue scale) | |
| Notes | The active and placebo tablets were offered by Pharmacia Company All continuous outcomes were presented as end point values We changed sleep disturbance into night pain (no bother) Participants who dropped out were counted as night pain (bother) The following were presented as median Spinal stiffness: CRP: Other outcomes were presented as mean +/‐ 95% CI, from which we calculated SD | |
| Risk of bias | ||
| Bias | Authors' judgement | Support for judgement |
| Random sequence generation (selection bias) | Unclear risk | Insufficient information about the sequence generation process to permit judgment of Yes or No |
| Allocation concealment (selection bias) | Unclear risk | The study did not address allocation concealment |
| Blinding (performance bias and detection bias) | Low risk | This is placebo‐controlled trial and the observer blinding was stressed |
| Incomplete outcome data (attrition bias) | High risk | There are 30 participants recruited at the beginning of the trial, but only the participants who completed 3 months' treatment were analysed |
| Selective reporting (reporting bias) | Low risk | They reported the expected outcomes |
| Other bias | Low risk | The study appears to be free of other sources of bias |
| Methods | Randomized allocation | |
| Participants | Participants fulfilling the New York criteria for AS and requiring daily NSAIDs 8 had family history and/or minimal localised lesions of cutaneous psoriasis Age (median and confidence interval): Duration of disease (median and confidence interval): | |
| Interventions | SSZ 2.0 g orally daily | |
| Outcomes | 1. Treatment failure of overall patient assessment (event, including any withdrawal) | |
| Notes | There was no financial interest to report All continuous outcomes were presented as change from baseline and as median (95% CI) We changed 'treatment failure of overall patient assessment' into 'improvement in patient global assessment' | |
| Risk of bias | ||
| Bias | Authors' judgement | Support for judgement |
| Random sequence generation (selection bias) | Low risk | The randomisation list was in blocks of six |
| Allocation concealment (selection bias) | Low risk | The study supplied the active drug in numerical order |
| Blinding (performance bias and detection bias) | Low risk | This is a double‐blind (participants and investigators), placebo‐controlled trial |
| Incomplete outcome data (attrition bias) | High risk | For continuous outcome data, the analysis was made on those participants who completed the trials (47/60). The only one dichotomous outcome (treatment success or failure) was analyzed as intention‐to‐treat |
| Selective reporting (reporting bias) | Low risk | They reported the expected outcomes |
| Other bias | Low risk | The study appears to be free of other sources of bias |
| Methods | Randomized allocation | |
| Participants | Participants fulfilling AS criteria of the American Rheumatism Association (1966) Other inclusion criteria: Exclusion criteria: Age (median and actual range): Duration of disease (median and actual range): | |
| Interventions | SSZ initially 1.0 g/d orally, increased 0.5 to 1.0 g weekly until 3.0 g/d or the highest dose the patient could tolerate | |
| Outcomes | 1. Duration of morning stiffness (hr) | |
| Notes | There was no financial interest to report Most outcomes were presented as graph Among continuous outcomes, only ESR was available for our analysis | |
| Risk of bias | ||
| Bias | Authors' judgement | Support for judgement |
| Random sequence generation (selection bias) | Unclear risk | Insufficient information about the sequence generation process to permit judgment of Yes or No |
| Allocation concealment (selection bias) | Unclear risk | Insufficient information to permit judgment of Yes or No |
| Blinding (performance bias and detection bias) | Low risk | This is double‐blind, placebo‐controlled trial. Although there is no information about who were blinded, it appeared to not affect the result much because only one outcome (ESR) was available for the present review |
| Incomplete outcome data (attrition bias) | High risk | Only those who completed the trial were included in the analysis |
| Selective reporting (reporting bias) | Low risk | They reported the expected outcomes |
| Other bias | Low risk | The study appears to be free of other sources of bias |
| Methods | Randomized allocation | |
| Participants | Participants fulfilling the New York criteria for AS Those who clinically had very little or no spinal mobility were excluded Age Male: 85% Duration of disease : | |
| Interventions | SSZ 1.0 g orally twice a day | |
| Outcomes | Primary: Secondary | |
| Notes | There was no financial interest to report Primary outcomes were presented only as graph where no significant difference was reported between two groups For secondary outcomes, no figure was given except for episodes of peripheral arthritis which showed significant difference (0.298 episodes/yr in SSZ group vs 0.392 episodes/yr in placebo group) Extra information about randomisation, concealment and withdrawal was offered by the author 35 (39%) participants withdrew from treatment. Few (5 placebo, 8 SSZ) were precipitated by specific adverse reactions. The majority withdrew because they preferred to stop taking tablets regularly. | |
| Risk of bias | ||
| Bias | Authors' judgement | Support for judgement |
| Random sequence generation (selection bias) | Low risk | The study was randomised using computer generated random numbers sealed in envelops and opened sequentially as each patient was entered into the study |
| Allocation concealment (selection bias) | Low risk | The hospital pharmacy was not revealed to the participants or assessors |
| Blinding (performance bias and detection bias) | Low risk | Indistinguishable placebo tablets were used in the study. Analysis of primary outcome measures was performed by the same assessor, and the results of statistics were disclosed to the investigators |
| Incomplete outcome data (attrition bias) | Unclear risk | In the Methods section, the authors stated that the participants were assessed even if they discontinued the trial medicine. However, in the results section, they did not provide the sample size of each outcome |
| Selective reporting (reporting bias) | High risk | Some of the prespecified primary outcomes have not been reported, such as function, consumption of NSAIDs, patients assessment of response |
| Other bias | Low risk | The study appears to be free of other sources of bias |
| Methods | Randomized allocation | |
| Participants | Participants fulfilling the New York criteria for AS, with ESR > 25 mm/hr, morning stiffness > 50 min Exclusion criteria: Age Duration of disease: not given | |
| Interventions | SSZ initially 1.0 g/d orally, increased 0.5 to 1.0 g weekly until 3.0 g/d or depending on the efficacy and tolerance | |
| Outcomes | 1. Duration of morning stiffness (hr) | |
| Notes | There was no financial interest to report All continuous outcomes were presented as end point values The author offered the full‐text paper and English translation | |
| Risk of bias | ||
| Bias | Authors' judgement | Support for judgement |
| Random sequence generation (selection bias) | Unclear risk | Insufficient information about the sequence generation process to permit judgment of Yes or No |
| Allocation concealment (selection bias) | Unclear risk | Insufficient information to permit judgment of Yes or No |
| Blinding (performance bias and detection bias) | Low risk | "Neither the physician nor the patients were acquainted about the sort of medicine they actually use" |
| Incomplete outcome data (attrition bias) | High risk | "Number of patients interrupting therapy because of side effects, SSZ group 8/71 (2 skin rash, 3 nausea, 3 did not want to continue therapy), placebo group 5/24 (1 skin rash, 2 inefficiency, 2 did not want to continue)". Did not use intention‐to‐treat analysis |
| Selective reporting (reporting bias) | Low risk | They reported the expected outcomes |
| Other bias | Low risk | The study appears to be free of other sources of bias |
| Methods | Randomized allocation | |
| Participants | Participants fulfilling the New York criteria for AS Other inclusion criteria: Exclusion criteria: Age: Duration of disease: | |
| Interventions | SSZ initially 1.0 g/d orally, increased 0.5 to 1.0 g weekly until 3.0 g/d or depending on the efficacy and tolerance | |
| Outcomes | 1. Duration of morning stiffness (hr) | |
| Notes | There was no financial interest to report All continuous outcomes were presented as end point values We suspected that results of 'chest expansion' were errors because they were impossible to be about 40 to 50 cm so we divided them by 10 | |
| Risk of bias | ||
| Bias | Authors' judgement | Support for judgement |
| Random sequence generation (selection bias) | Unclear risk | Insufficient information about the sequence generation process to permit judgment of Yes or No |
| Allocation concealment (selection bias) | Unclear risk | Insufficient information to permit judgment of Yes or No |
| Blinding (performance bias and detection bias) | Low risk | "The doctors and patients were not informed of the drug codes" |
| Incomplete outcome data (attrition bias) | Unclear risk | There were 2 drop‐outs in each group but no information about missing outcome results |
| Selective reporting (reporting bias) | Low risk | They reported the expected outcomes |
| Other bias | Low risk | The study appears to be free of other sources of bias |
| Methods | Randomized allocation | |
| Participants | Participants fulfilling the modified New York criteria for AS Other inclusion criteria: Exclusion criteria: Age: 27.5 +/‐ 8.3 | |
| Interventions | SSZ 1.0 g orally, 3 times a day | |
| Outcomes | 1. Back pain (100 mm visual analogue scale) | |
| Notes | There was no financial interest to report All continuous outcomes were presented as change from baseline We changed 'effectiveness in patient assessment' to 'improvement in patient global assessment' We changed 'effectiveness in physician assessment' to 'improvement in physician global assessment' Those dropping out were counted as not improved We changed 'nocturnal awakening' to 'night pain ('no bother' participants who dropped out were counted as night pain (bother) For 'number of painful joints' and 'number of swollen joints', no SD was given For 'fingers‐to‐floor test' (cm), SD of SSZ group was missed German full‐text was translated into English | |
| Risk of bias | ||
| Bias | Authors' judgement | Support for judgement |
| Random sequence generation (selection bias) | Unclear risk | Insufficient information about the sequence generation process to permit judgment of Yes or No |
| Allocation concealment (selection bias) | Unclear risk | Insufficient information to permit judgment of Yes or No |
| Blinding (performance bias and detection bias) | Unclear risk | "It treat of a prospective, randomized, double blind, placebo‐controlled study with intention‐to‐treat analyse of the results". But no information about which two were blinded |
| Incomplete outcome data (attrition bias) | High risk | There were 16/34 and 7/36 participants withdrew from the trial in SZZ and placebo, respectively. No information about the missing data |
| Selective reporting (reporting bias) | Low risk | They reported the expected outcomes |
| Other bias | Low risk | The study appears to be free of other sources of bias |
| Methods | Randomized allocation | |
| Participants | Participants fulfilling the New York criteria for AS Other inclusion criteria: Exclusion criteria: Age: Duration of disease: | |
| Interventions | SSZ orally, maximum tolerated dose or 2.0 g/d | |
| Outcomes | 1. Back pain (100 mm visual analogue scale) | |
| Notes | This study was supported by the Haywood Rheumatism Research and Development Foundation and Pharmacia All continuous outcomes were presented as change from baseline We changed 'sleep disturbance (%)' to 'night pain (no bother)' We changed visual analogue scale 10 cm to visual analogue scale 100 mm and inch to cm Sacroiliac joints and lumbar spine radiograph score were assessed but no figures given | |
| Risk of bias | ||
| Bias | Authors' judgement | Support for judgement |
| Random sequence generation (selection bias) | Low risk | Randomization was performed within groups of 4 by Pharmacia |
| Allocation concealment (selection bias) | Low risk | The Department Pharmacia was not revealed to the participants or assessors |
| Blinding (performance bias and detection bias) | Low risk | "All observers were blinded to which therapy the patients were taking". "The clinical measurements were performed by a single observer". "The erosion count was confirmed for each patients by 2 observers blinded to treat" |
| Incomplete outcome data (attrition bias) | Unclear risk | The study did not address the issue of missing data of those drop‐outs and did not use principle of intention‐to‐treat |
| Selective reporting (reporting bias) | High risk | The study did not report the scores of patients' general wellbeing |
| Other bias | Low risk | The study appears to be free of other sources of bias |
| Methods | Randomized allocation | |
| Participants | Participants fulfilling the New York criteria for AS Other inclusion criteria: Exclusion criteria: Age (median and range) SSZ group: 40.5 (25 to 66) Duration of disease (median and range): | |
| Interventions | SSZ 2.0 g/d orally | |
| Outcomes | 1. ESR (mm/hr) | |
| Notes | There was no financial interest to report All continuous outcomes were presented as end point values We changed min to hr | |
| Risk of bias | ||
| Bias | Authors' judgement | Support for judgement |
| Random sequence generation (selection bias) | Unclear risk | Insufficient information about the sequence generation process to permit judgment of Yes or No |
| Allocation concealment (selection bias) | Unclear risk | Insufficient information to permit judgment of Yes or No |
| Blinding (performance bias and detection bias) | Unclear risk | The study did not address this item |
| Incomplete outcome data (attrition bias) | High risk | The result were analyzed with intention‐to‐treat principle, 5 participants from active group and 9 participants from placebo group dropped out, SSZ treatment was withdrawn due to adverse side‐effects, placebo treatment because of its effectiveness. Reason for missing outcome data likely to be related to true outcome, with imbalance in reasons for missing data across intervention groups |
| Selective reporting (reporting bias) | Low risk | They reported the expected outcomes |
| Other bias | Low risk | The study appears to be free of other sources of bias |
AS ‐ ankylosing spondylitis
CI ‐ confidence interval
CRP ‐ C‐reactive protein
ESR ‐ erythrocyte sedimentation rate
GOT ‐ glutamic‐oxaloacetic transaminase
GPT ‐ glutamic‐pyruvic transaminase
G6PD ‐ glucose‐6‐phosphate dehydrogenease
g/d ‐ grams per day
HLA B27 ‐ human leukocyte antigen B27
Ig A ‐ immunoglobulin A
mm/hr ‐ millimetre per hour
NSAID ‐ non‐steroidal anti‐inflammatory drug
RA ‐ rheumatoid arthritis
SAPA ‐ sulfasalazine
SD ‐ standard deviation
SLE ‐ systemic lupus erythematosus
SSZ ‐ sulfasalazineug ‐ microgram
Characteristics of excluded studies [ordered by study ID]
Ir a:
| Study | Reason for exclusion |
| No relevant outcomes | |
| This was a multicenter, double‐blind, placebo controlled RCT. The participants were 242 patients with inflammatory back pain due to undifferentiated spondyloarthritis and early AS, including 12 AS patients. We were unable to get the results for AS patients alone | |
| This was a multicenter, double‐blind, placebo controlled RCT comparing etanercept with SSZ in patients with AS. We excluded it because there is another separate Cochrane review addressing biologics in AS | |
| The participants were 33 patients with juvenile onset spondyloarthropathy, including 13 AS patients. No outcome specific to AS patients was presented | |
| No relevant outcomes | |
| This is a protocol; attempts to contact the authors to access full‐text have been unsuccessful so far | |
| The participants were 76 patients with axial spondyloarthritis; no outcome specific to AS patients were presented | |
| This was a RCT, comparing the effects of Bushen Tongdu Decoction (Chinese traditional medicine) and SSZ on serum tumour necrosis factor‐alpha and transforming growth factor beta1 in patients with AS. Because the efficacy of Bushen Tongdu Decoction is unclear in AS, we excluded this study | |
| This was a RCT about long‐term effectiveness of leflunomide compared with SSZ in treatment of AS. The efficacy of leflunomide in AS is unclear and therefore we decided to exclude this trial after a discussion | |
| This was a RCT, comparing the effects of etanercept and SSZ. We excluded it because there was another separate Cochrane review addressing biologics in AS |
AS ‐ ankylosing spondylitis
RCT ‐ randomized controlled trials
SSZ ‐ sulfasalazine
Data and analyses
| Outcome or subgroup title | No. of studies | No. of participants | Statistical method | Effect size |
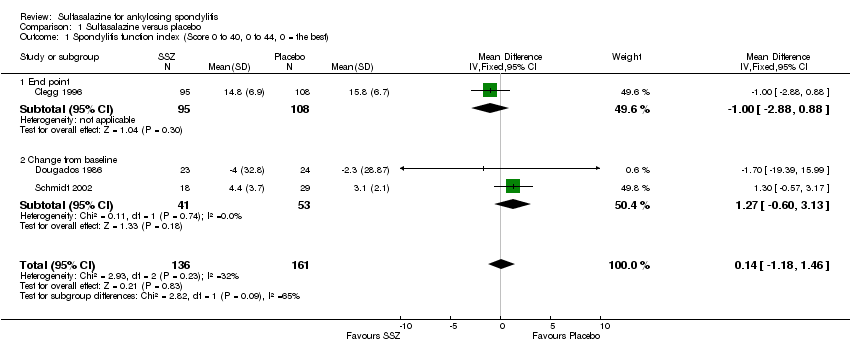
| 1 Spondylitis function index (Score 0 to 40, 0 to 44, 0 = the best) Show forest plot | 3 | 297 | Mean Difference (IV, Fixed, 95% CI) | 0.14 [‐1.18, 1.46] |
| Analysis 1.1  Comparison 1 Sulfasalazine versus placebo, Outcome 1 Spondylitis function index (Score 0 to 40, 0 to 44, 0 = the best). | ||||
| 1.1 End point | 1 | 203 | Mean Difference (IV, Fixed, 95% CI) | ‐1.0 [‐2.88, 0.88] |
| 1.2 Change from baseline | 2 | 94 | Mean Difference (IV, Fixed, 95% CI) | 1.27 [‐0.60, 3.13] |
| 2 Spondylitis function index (2nd analysis) (score 0 to 40, 0 to 44, 0 = the best) Show forest plot | 3 | 297 | Mean Difference (IV, Fixed, 95% CI) | 0.20 [‐0.77, 1.18] |
| Analysis 1.2 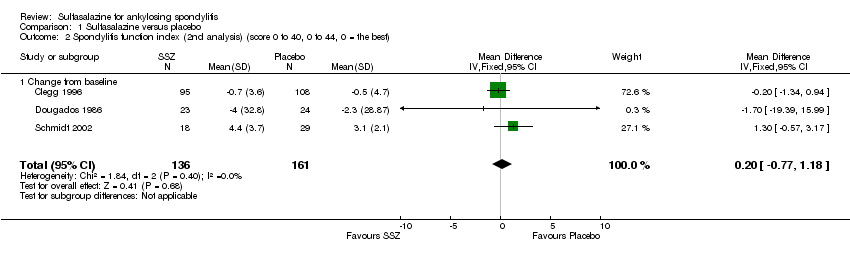 Comparison 1 Sulfasalazine versus placebo, Outcome 2 Spondylitis function index (2nd analysis) (score 0 to 40, 0 to 44, 0 = the best). | ||||
| 2.1 Change from baseline | 3 | 297 | Mean Difference (IV, Fixed, 95% CI) | 0.20 [‐0.77, 1.18] |
| 3 Improvement in back pain Show forest plot | 1 | Risk Ratio (M‐H, Fixed, 95% CI) | Totals not selected | |
| Analysis 1.3  Comparison 1 Sulfasalazine versus placebo, Outcome 3 Improvement in back pain. | ||||
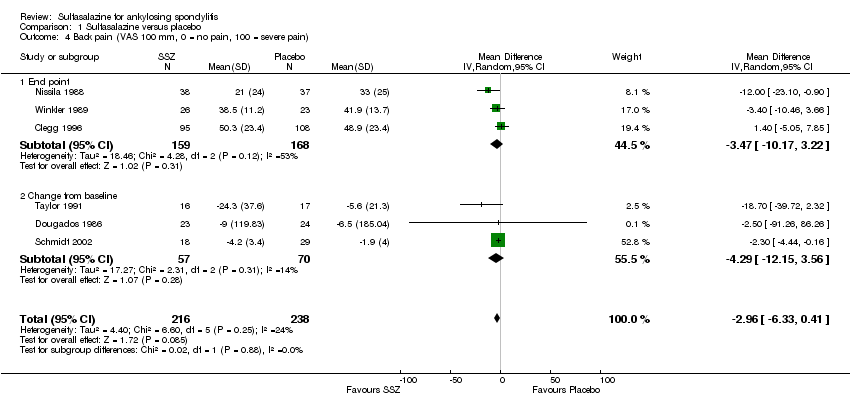
| 4 Back pain (VAS 100 mm, 0 = no pain, 100 = severe pain) Show forest plot | 6 | 454 | Mean Difference (IV, Random, 95% CI) | ‐2.96 [‐6.33, 0.41] |
| Analysis 1.4  Comparison 1 Sulfasalazine versus placebo, Outcome 4 Back pain (VAS 100 mm, 0 = no pain, 100 = severe pain). | ||||
| 4.1 End point | 3 | 327 | Mean Difference (IV, Random, 95% CI) | ‐3.47 [‐10.17, 3.22] |
| 4.2 Change from baseline | 3 | 127 | Mean Difference (IV, Random, 95% CI) | ‐4.29 [‐12.15, 3.56] |
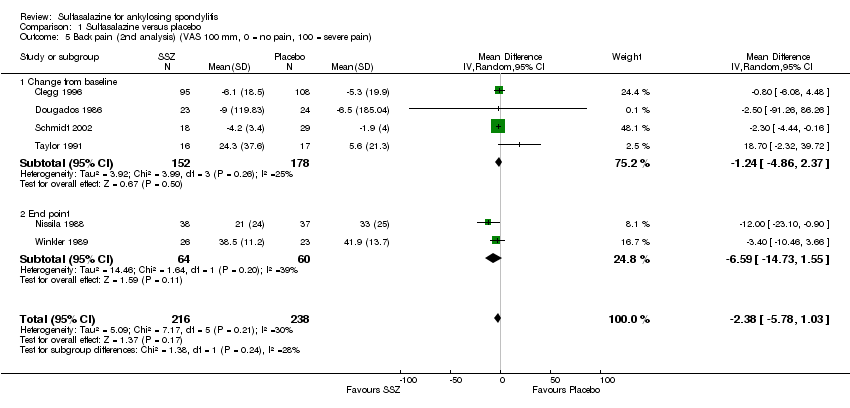
| 5 Back pain (2nd analysis) (VAS 100 mm, 0 = no pain, 100 = severe pain) Show forest plot | 6 | 454 | Mean Difference (IV, Random, 95% CI) | ‐2.38 [‐5.78, 1.03] |
| Analysis 1.5  Comparison 1 Sulfasalazine versus placebo, Outcome 5 Back pain (2nd analysis) (VAS 100 mm, 0 = no pain, 100 = severe pain). | ||||
| 5.1 Change from baseline | 4 | 330 | Mean Difference (IV, Random, 95% CI) | ‐1.24 [‐4.86, 2.37] |
| 5.2 End point | 2 | 124 | Mean Difference (IV, Random, 95% CI) | ‐6.59 [‐14.73, 1.55] |
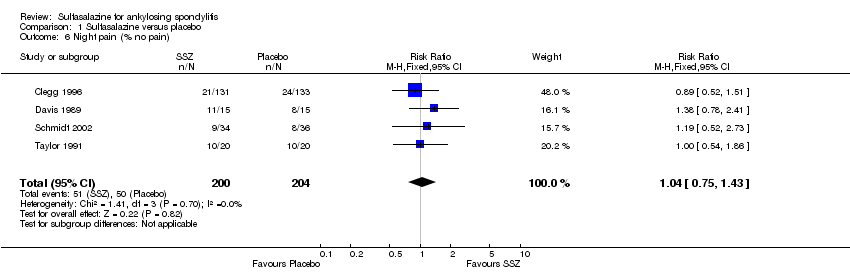
| 6 Night pain (% no pain) Show forest plot | 4 | 404 | Risk Ratio (M‐H, Fixed, 95% CI) | 1.04 [0.75, 1.43] |
| Analysis 1.6  Comparison 1 Sulfasalazine versus placebo, Outcome 6 Night pain (% no pain). | ||||
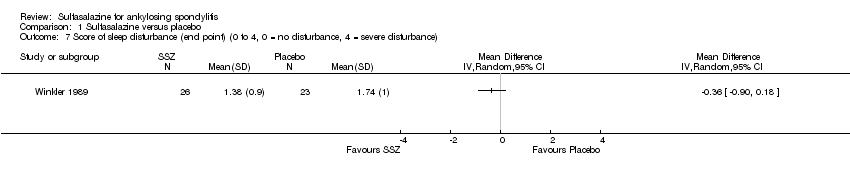
| 7 Score of sleep disturbance (end point) (0 to 4, 0 = no disturbance, 4 = severe disturbance) Show forest plot | 1 | Mean Difference (IV, Random, 95% CI) | Totals not selected | |
| Analysis 1.7  Comparison 1 Sulfasalazine versus placebo, Outcome 7 Score of sleep disturbance (end point) (0 to 4, 0 = no disturbance, 4 = severe disturbance). | ||||
| 8 Frequency of nocturnal awakening (change from baseline) Show forest plot | 1 | Mean Difference (IV, Random, 95% CI) | Totals not selected | |
| Analysis 1.8 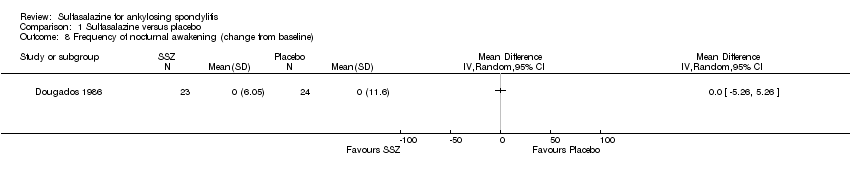 Comparison 1 Sulfasalazine versus placebo, Outcome 8 Frequency of nocturnal awakening (change from baseline). | ||||
| 9 Score of daily NSAIDs (change from baseline, usual dosage as 10) Show forest plot | 1 | Mean Difference (IV, Random, 95% CI) | Totals not selected | |
| Analysis 1.9  Comparison 1 Sulfasalazine versus placebo, Outcome 9 Score of daily NSAIDs (change from baseline, usual dosage as 10). | ||||
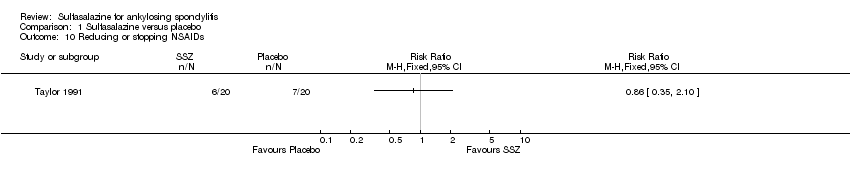
| 10 Reducing or stopping NSAIDs Show forest plot | 1 | Risk Ratio (M‐H, Fixed, 95% CI) | Totals not selected | |
| Analysis 1.10  Comparison 1 Sulfasalazine versus placebo, Outcome 10 Reducing or stopping NSAIDs. | ||||
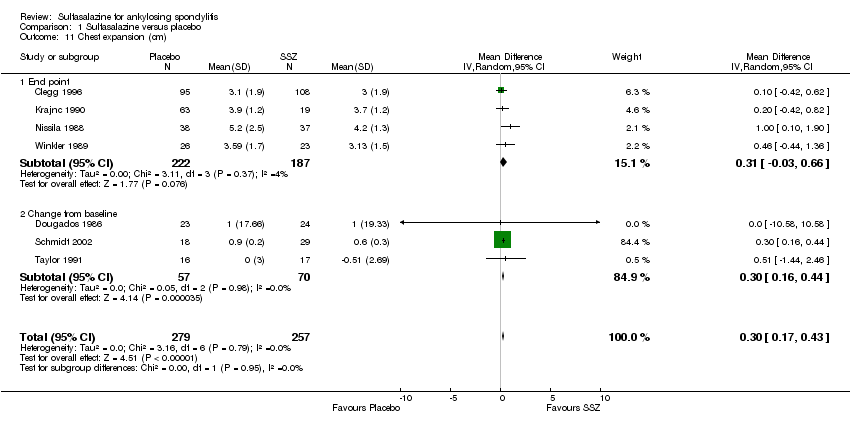
| 11 Chest expansion (cm) Show forest plot | 7 | 536 | Mean Difference (IV, Random, 95% CI) | 0.30 [0.17, 0.43] |
| Analysis 1.11  Comparison 1 Sulfasalazine versus placebo, Outcome 11 Chest expansion (cm). | ||||
| 11.1 End point | 4 | 409 | Mean Difference (IV, Random, 95% CI) | 0.31 [‐0.03, 0.66] |
| 11.2 Change from baseline | 3 | 127 | Mean Difference (IV, Random, 95% CI) | 0.30 [0.16, 0.44] |
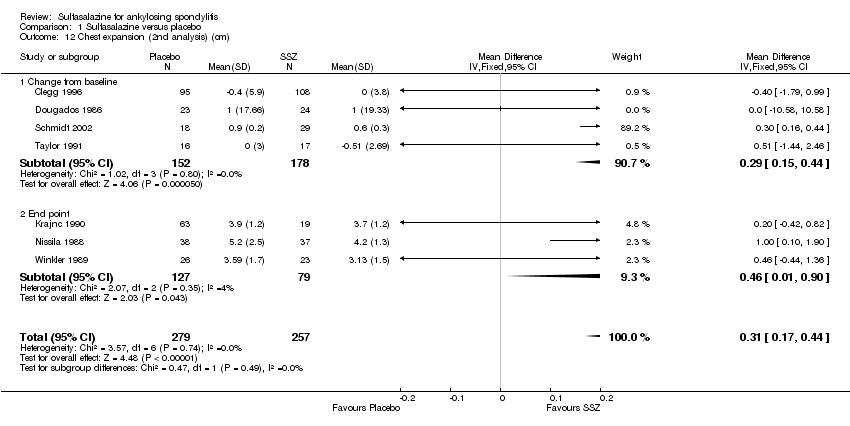
| 12 Chest expansion (2nd analysis) (cm) Show forest plot | 7 | 536 | Mean Difference (IV, Fixed, 95% CI) | 0.31 [0.17, 0.44] |
| Analysis 1.12  Comparison 1 Sulfasalazine versus placebo, Outcome 12 Chest expansion (2nd analysis) (cm). | ||||
| 12.1 Change from baseline | 4 | 330 | Mean Difference (IV, Fixed, 95% CI) | 0.29 [0.15, 0.44] |
| 12.2 End point | 3 | 206 | Mean Difference (IV, Fixed, 95% CI) | 0.46 [0.01, 0.90] |
| 13 Forced vital volume (change from baseline) (L/min) Show forest plot | 1 | Mean Difference (IV, Random, 95% CI) | Totals not selected | |
| Analysis 1.13 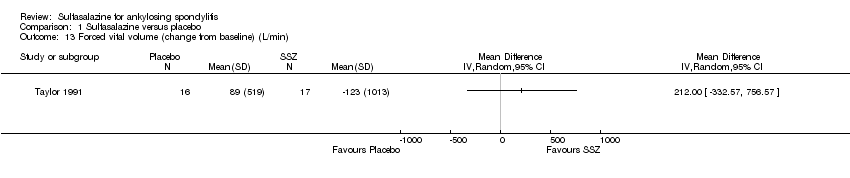 Comparison 1 Sulfasalazine versus placebo, Outcome 13 Forced vital volume (change from baseline) (L/min). | ||||
| 14 (Modified) Schober's test (cm) Show forest plot | 7 | 536 | Mean Difference (IV, Random, 95% CI) | 0.18 [‐0.11, 0.46] |
| Analysis 1.14  Comparison 1 Sulfasalazine versus placebo, Outcome 14 (Modified) Schober's test (cm). | ||||
| 14.1 End point | 4 | 409 | Mean Difference (IV, Random, 95% CI) | 0.07 [‐0.14, 0.29] |
| 14.2 Change from baseline | 3 | 127 | Mean Difference (IV, Random, 95% CI) | 0.50 [0.44, 0.56] |
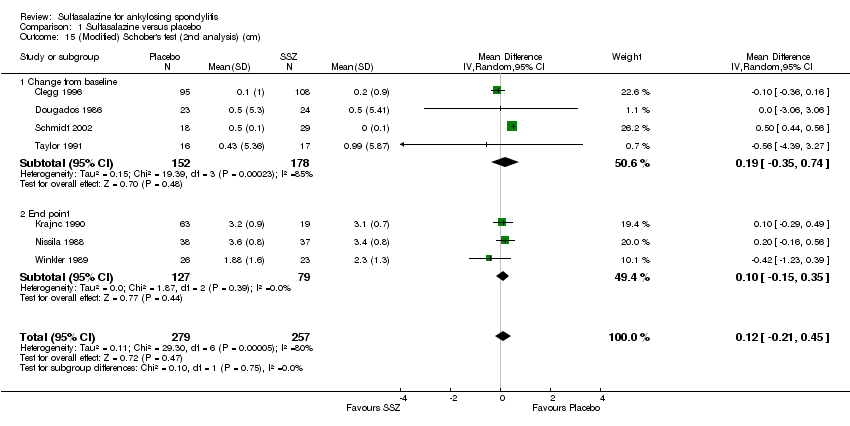
| 15 (Modified) Schober's test (2nd analysis) (cm) Show forest plot | 7 | 536 | Mean Difference (IV, Random, 95% CI) | 0.12 [‐0.21, 0.45] |
| Analysis 1.15  Comparison 1 Sulfasalazine versus placebo, Outcome 15 (Modified) Schober's test (2nd analysis) (cm). | ||||
| 15.1 Change from baseline | 4 | 330 | Mean Difference (IV, Random, 95% CI) | 0.19 [‐0.35, 0.74] |
| 15.2 End point | 3 | 206 | Mean Difference (IV, Random, 95% CI) | 0.10 [‐0.15, 0.35] |
| 16 Occiput‐to‐wall test (cm) Show forest plot | 5 | 386 | Mean Difference (IV, Random, 95% CI) | 0.08 [‐0.90, 1.06] |
| Analysis 1.16  Comparison 1 Sulfasalazine versus placebo, Outcome 16 Occiput‐to‐wall test (cm). | ||||
| 16.1 End point | 3 | 306 | Mean Difference (IV, Random, 95% CI) | ‐0.63 [‐1.33, 0.07] |
| 16.2 Change from baseline | 2 | 80 | Mean Difference (IV, Random, 95% CI) | 0.68 [0.31, 1.05] |
| 17 Occiput‐to‐wall test (2nd analysis) (cm) Show forest plot | 5 | 386 | Mean Difference (IV, Random, 95% CI) | ‐0.03 [‐0.84, 0.79] |
| Analysis 1.17 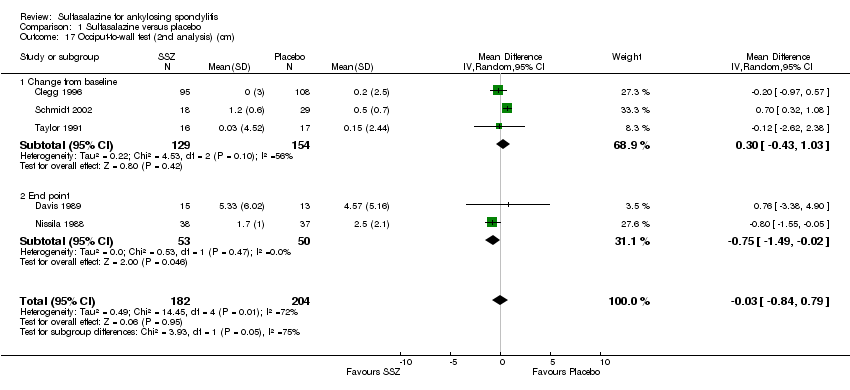 Comparison 1 Sulfasalazine versus placebo, Outcome 17 Occiput‐to‐wall test (2nd analysis) (cm). | ||||
| 17.1 Change from baseline | 3 | 283 | Mean Difference (IV, Random, 95% CI) | 0.30 [‐0.43, 1.03] |
| 17.2 End point | 2 | 103 | Mean Difference (IV, Random, 95% CI) | ‐0.75 [‐1.49, ‐0.02] |
| 18 Fingers‐to‐floor test (cm) Show forest plot | 7 | 517 | Mean Difference (IV, Random, 95% CI) | ‐1.03 [‐2.93, 0.87] |
| Analysis 1.18  Comparison 1 Sulfasalazine versus placebo, Outcome 18 Fingers‐to‐floor test (cm). | ||||
| 18.1 End point | 5 | 437 | Mean Difference (IV, Random, 95% CI) | ‐0.64 [‐2.77, 1.49] |
| 18.2 Change from baseline | 2 | 80 | Mean Difference (IV, Random, 95% CI) | ‐2.54 [‐6.75, 1.67] |
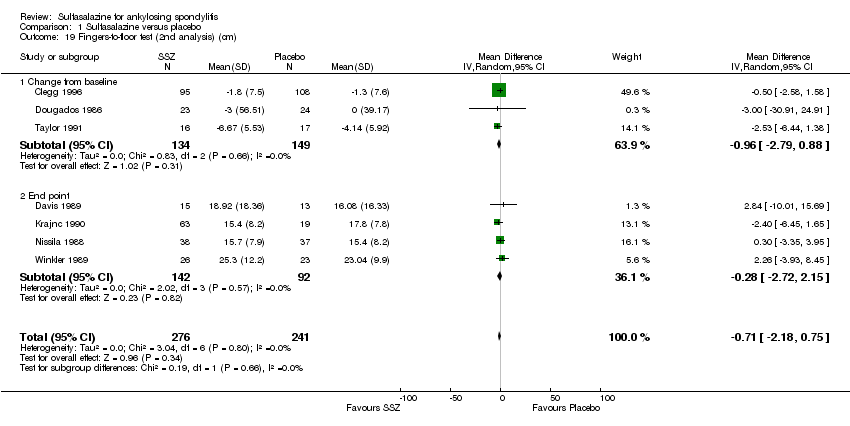
| 19 Fingers‐to‐floor test (2nd analysis) (cm) Show forest plot | 7 | 517 | Mean Difference (IV, Random, 95% CI) | ‐0.71 [‐2.18, 0.75] |
| Analysis 1.19  Comparison 1 Sulfasalazine versus placebo, Outcome 19 Fingers‐to‐floor test (2nd analysis) (cm). | ||||
| 19.1 Change from baseline | 3 | 283 | Mean Difference (IV, Random, 95% CI) | ‐0.96 [‐2.79, 0.88] |
| 19.2 End point | 4 | 234 | Mean Difference (IV, Random, 95% CI) | ‐0.28 [‐2.72, 2.15] |
| 20 Chin sternum distance (change from baseline) (cm) Show forest plot | 1 | Mean Difference (IV, Fixed, 95% CI) | Totals not selected | |
| Analysis 1.20  Comparison 1 Sulfasalazine versus placebo, Outcome 20 Chin sternum distance (change from baseline) (cm). | ||||
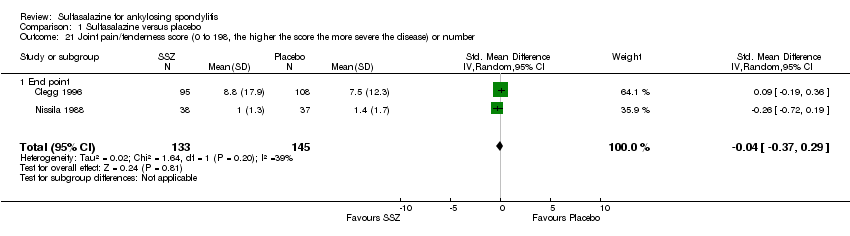
| 21 Joint pain/tenderness score (0 to 198, the higher the score the more severe the disease) or number Show forest plot | 2 | 278 | Std. Mean Difference (IV, Random, 95% CI) | ‐0.04 [‐0.37, 0.29] |
| Analysis 1.21  Comparison 1 Sulfasalazine versus placebo, Outcome 21 Joint pain/tenderness score (0 to 198, the higher the score the more severe the disease) or number. | ||||
| 21.1 End point | 2 | 278 | Std. Mean Difference (IV, Random, 95% CI) | ‐0.04 [‐0.37, 0.29] |
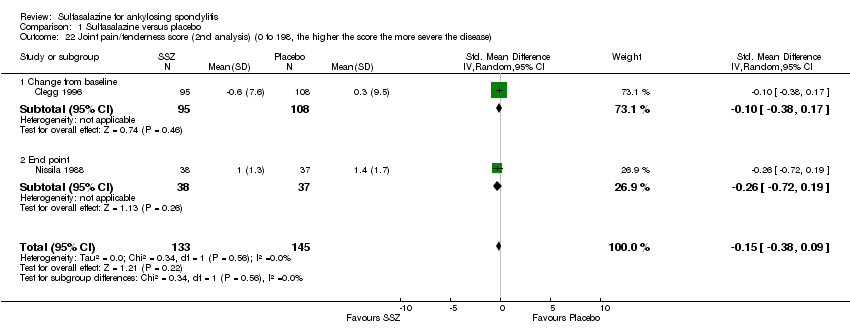
| 22 Joint pain/tenderness score (2nd analysis) (0 to 198, the higher the score the more severe the disease) Show forest plot | 2 | 278 | Std. Mean Difference (IV, Random, 95% CI) | ‐0.15 [‐0.38, 0.09] |
| Analysis 1.22  Comparison 1 Sulfasalazine versus placebo, Outcome 22 Joint pain/tenderness score (2nd analysis) (0 to 198, the higher the score the more severe the disease). | ||||
| 22.1 Change from baseline | 1 | 203 | Std. Mean Difference (IV, Random, 95% CI) | ‐0.10 [‐0.38, 0.17] |
| 22.2 End point | 1 | 75 | Std. Mean Difference (IV, Random, 95% CI) | ‐0.26 [‐0.72, 0.19] |
| 23 Joint swelling score (0 to 198, the higher score the more severe the disease) or number Show forest plot | 2 | 278 | Std. Mean Difference (IV, Random, 95% CI) | 0.04 [‐0.20, 0.27] |
| Analysis 1.23  Comparison 1 Sulfasalazine versus placebo, Outcome 23 Joint swelling score (0 to 198, the higher score the more severe the disease) or number. | ||||
| 23.1 End point | 2 | 278 | Std. Mean Difference (IV, Random, 95% CI) | 0.04 [‐0.20, 0.27] |
| 24 Joint swelling score (2nd analysis) (0 to 198, the higher the score the more severe the disease) Show forest plot | 2 | 278 | Mean Difference (IV, Random, 95% CI) | 0.0 [‐0.29, 0.29] |
| Analysis 1.24  Comparison 1 Sulfasalazine versus placebo, Outcome 24 Joint swelling score (2nd analysis) (0 to 198, the higher the score the more severe the disease). | ||||
| 24.1 Change from baseline | 1 | 203 | Mean Difference (IV, Random, 95% CI) | 0.0 [‐0.97, 0.97] |
| 24.2 End point | 1 | 75 | Mean Difference (IV, Random, 95% CI) | 0.0 [‐0.30, 0.30] |
| 25 Dactylitis score (0 to 3, 0 = normal, 3 = severe) Show forest plot | 1 | Mean Difference (IV, Random, 95% CI) | Totals not selected | |
| Analysis 1.25 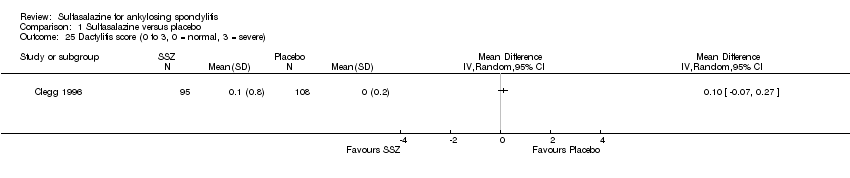 Comparison 1 Sulfasalazine versus placebo, Outcome 25 Dactylitis score (0 to 3, 0 = normal, 3 = severe). | ||||
| 26 Dactylitis score (2nd analysis) (0 to 3, 0 = normal, 3 = severe) Show forest plot | 1 | Mean Difference (IV, Random, 95% CI) | Totals not selected | |
| Analysis 1.26  Comparison 1 Sulfasalazine versus placebo, Outcome 26 Dactylitis score (2nd analysis) (0 to 3, 0 = normal, 3 = severe). | ||||
| 27 Enthesopathy index (0 to 90, 0 to 66, 0 to 90, the higher the score the more severe the disease) Show forest plot | 3 | 297 | Std. Mean Difference (IV, Random, 95% CI) | 0.10 [‐0.13, 0.33] |
| Analysis 1.27  Comparison 1 Sulfasalazine versus placebo, Outcome 27 Enthesopathy index (0 to 90, 0 to 66, 0 to 90, the higher the score the more severe the disease). | ||||
| 27.1 End point | 1 | 203 | Std. Mean Difference (IV, Random, 95% CI) | 0.06 [‐0.22, 0.33] |
| 27.2 Change from baseline | 2 | 94 | Std. Mean Difference (IV, Random, 95% CI) | 0.19 [‐0.29, 0.68] |
| 28 Enthesopathy index (2nd analysis) (0 to 90, 0 to 66, 0 to 90, the higher score the more severe the disease) Show forest plot | 3 | 297 | Std. Mean Difference (IV, Random, 95% CI) | 0.11 [‐0.12, 0.34] |
| Analysis 1.28 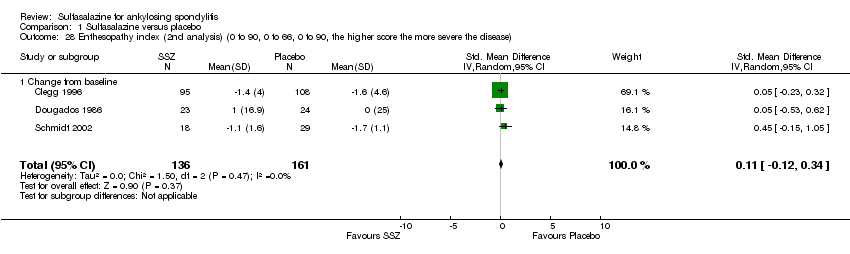 Comparison 1 Sulfasalazine versus placebo, Outcome 28 Enthesopathy index (2nd analysis) (0 to 90, 0 to 66, 0 to 90, the higher score the more severe the disease). | ||||
| 28.1 Change from baseline | 3 | 297 | Std. Mean Difference (IV, Random, 95% CI) | 0.11 [‐0.12, 0.34] |
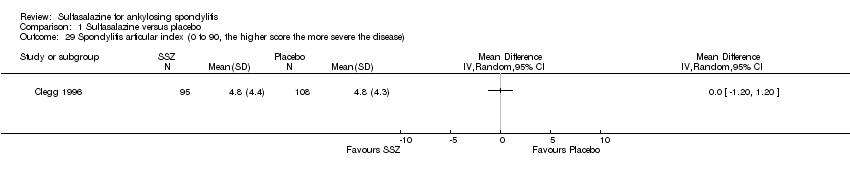
| 29 Spondylitis articular index (0 to 90, the higher score the more severe the disease) Show forest plot | 1 | Mean Difference (IV, Random, 95% CI) | Totals not selected | |
| Analysis 1.29  Comparison 1 Sulfasalazine versus placebo, Outcome 29 Spondylitis articular index (0 to 90, the higher score the more severe the disease). | ||||
| 30 Spondylitis articular index (2nd analysis) (0 to 90, the higher score the more severe the disease) Show forest plot | 1 | Mean Difference (IV, Random, 95% CI) | Totals not selected | |
| Analysis 1.30  Comparison 1 Sulfasalazine versus placebo, Outcome 30 Spondylitis articular index (2nd analysis) (0 to 90, the higher score the more severe the disease). | ||||
| 31 Improvement in patient global assessment Show forest plot | 3 | 394 | Risk Ratio (IV, Random, 95% CI) | 1.52 [0.78, 2.97] |
| Analysis 1.31 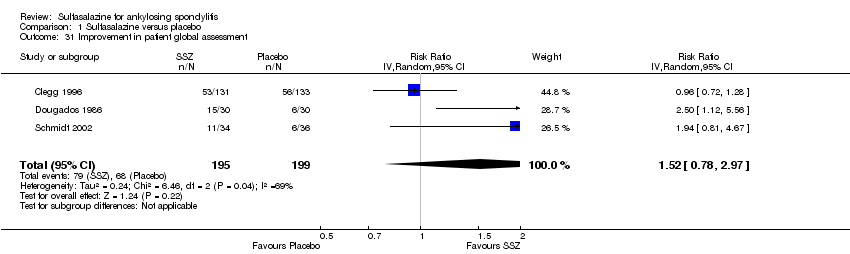 Comparison 1 Sulfasalazine versus placebo, Outcome 31 Improvement in patient global assessment. | ||||
| 32 Patient assessment of disease severity (end point) (VAS 100 mm, 0 = very good, 100 = very poor) Show forest plot | 1 | Mean Difference (IV, Fixed, 95% CI) | Totals not selected | |
| Analysis 1.32  Comparison 1 Sulfasalazine versus placebo, Outcome 32 Patient assessment of disease severity (end point) (VAS 100 mm, 0 = very good, 100 = very poor). | ||||
| 33 General well‐being (end point) (VAS 100 mm, 0 = very good, 100 = very poor) Show forest plot | 1 | Mean Difference (IV, Random, 95% CI) | Totals not selected | |
| Analysis 1.33  Comparison 1 Sulfasalazine versus placebo, Outcome 33 General well‐being (end point) (VAS 100 mm, 0 = very good, 100 = very poor). | ||||
| 34 Improvement in physician global assessment Show forest plot | 2 | 334 | Risk Ratio (IV, Random, 95% CI) | 1.34 [0.59, 3.08] |
| Analysis 1.34 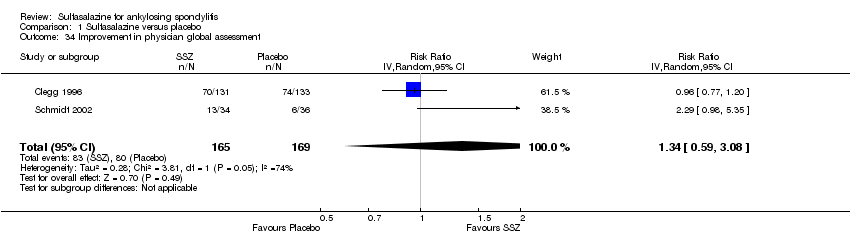 Comparison 1 Sulfasalazine versus placebo, Outcome 34 Improvement in physician global assessment. | ||||
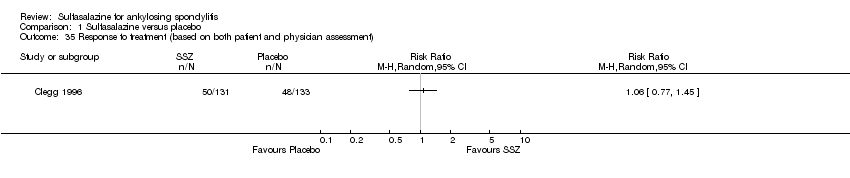
| 35 Response to treatment (based on both patient and physician assessment) Show forest plot | 1 | Risk Ratio (M‐H, Random, 95% CI) | Totals not selected | |
| Analysis 1.35  Comparison 1 Sulfasalazine versus placebo, Outcome 35 Response to treatment (based on both patient and physician assessment). | ||||
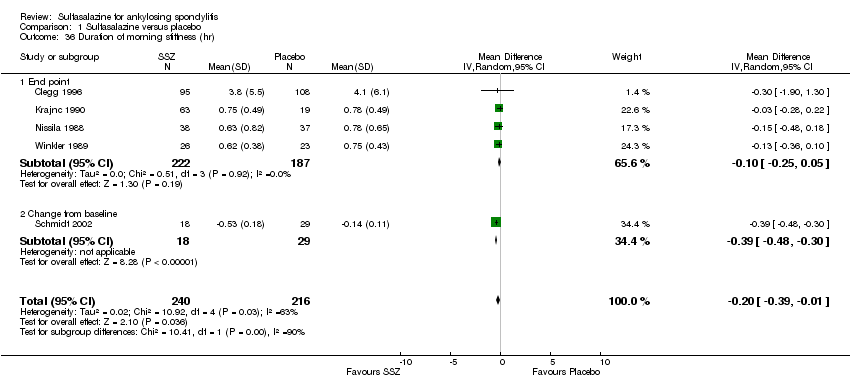
| 36 Duration of morning stiffness (hr) Show forest plot | 5 | 456 | Mean Difference (IV, Random, 95% CI) | ‐0.20 [‐0.39, ‐0.01] |
| Analysis 1.36  Comparison 1 Sulfasalazine versus placebo, Outcome 36 Duration of morning stiffness (hr). | ||||
| 36.1 End point | 4 | 409 | Mean Difference (IV, Random, 95% CI) | ‐0.10 [‐0.25, 0.05] |
| 36.2 Change from baseline | 1 | 47 | Mean Difference (IV, Random, 95% CI) | ‐0.39 [‐0.48, ‐0.30] |
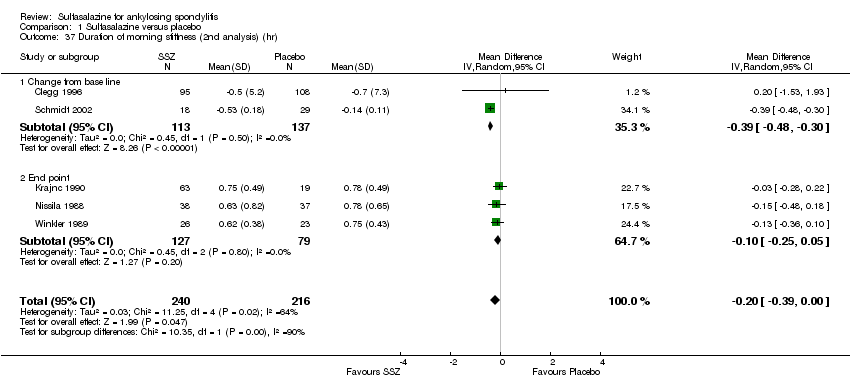
| 37 Duration of morning stiffness (2nd analysis) (hr) Show forest plot | 5 | 456 | Mean Difference (IV, Random, 95% CI) | ‐0.20 [‐0.39, ‐0.00] |
| Analysis 1.37  Comparison 1 Sulfasalazine versus placebo, Outcome 37 Duration of morning stiffness (2nd analysis) (hr). | ||||
| 37.1 Change from base line | 2 | 250 | Mean Difference (IV, Random, 95% CI) | ‐0.39 [‐0.48, ‐0.30] |
| 37.2 End point | 3 | 206 | Mean Difference (IV, Random, 95% CI) | ‐0.10 [‐0.25, 0.05] |
| 38 Morning stiffness (end point) (VAS 100 mm, 0 = no stiffness, 100 = severe stiffness) Show forest plot | 2 | 108 | Mean Difference (IV, Random, 95% CI) | ‐13.89 [‐22.54, ‐5.24] |
| Analysis 1.38 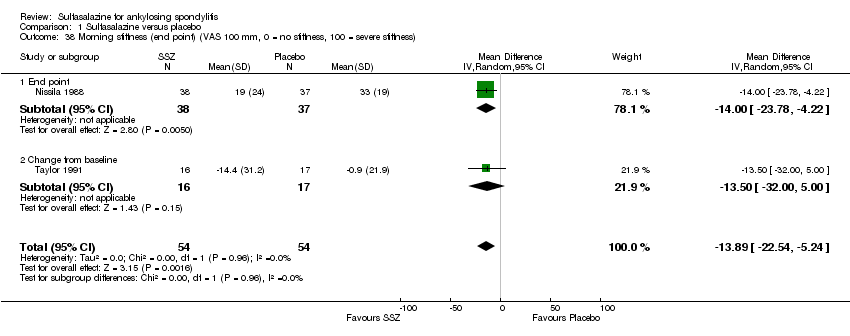 Comparison 1 Sulfasalazine versus placebo, Outcome 38 Morning stiffness (end point) (VAS 100 mm, 0 = no stiffness, 100 = severe stiffness). | ||||
| 38.1 End point | 1 | 75 | Mean Difference (IV, Random, 95% CI) | ‐12.00 [‐23.78, ‐4.22] |
| 38.2 Change from baseline | 1 | 33 | Mean Difference (IV, Random, 95% CI) | ‐13.5 [‐30.00, 5.00] |
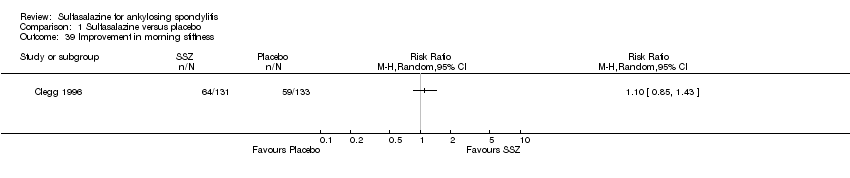
| 39 Improvement in morning stiffness Show forest plot | 1 | Risk Ratio (M‐H, Random, 95% CI) | Totals not selected | |
| Analysis 1.39  Comparison 1 Sulfasalazine versus placebo, Outcome 39 Improvement in morning stiffness. | ||||
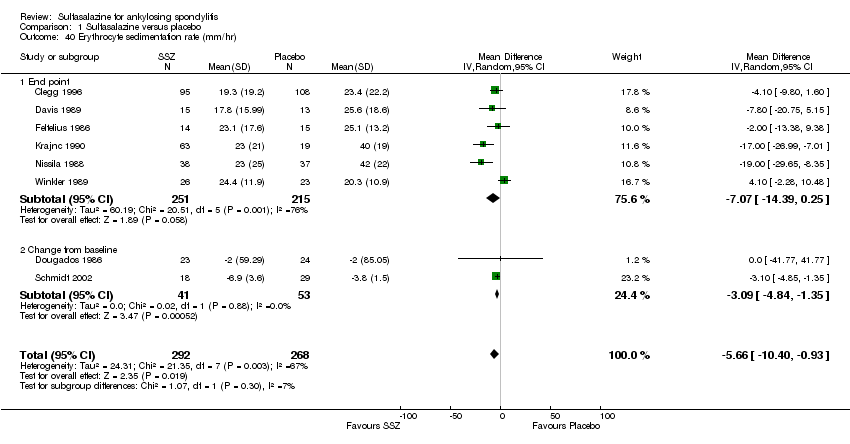
| 40 Erythrocyte sedimentation rate (mm/hr) Show forest plot | 8 | 560 | Mean Difference (IV, Random, 95% CI) | ‐5.66 [‐10.40, ‐0.93] |
| Analysis 1.40  Comparison 1 Sulfasalazine versus placebo, Outcome 40 Erythrocyte sedimentation rate (mm/hr). | ||||
| 40.1 End point | 6 | 466 | Mean Difference (IV, Random, 95% CI) | ‐7.07 [‐14.39, 0.25] |
| 40.2 Change from baseline | 2 | 94 | Mean Difference (IV, Random, 95% CI) | ‐3.09 [‐4.84, ‐1.35] |
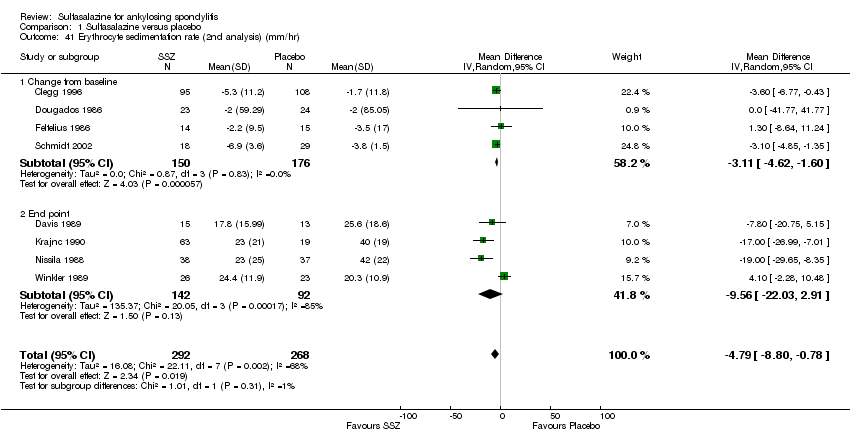
| 41 Erythrocyte sedimentation rate (2nd analysis) (mm/hr) Show forest plot | 8 | 560 | Mean Difference (IV, Random, 95% CI) | ‐4.79 [‐8.80, ‐0.78] |
| Analysis 1.41  Comparison 1 Sulfasalazine versus placebo, Outcome 41 Erythrocyte sedimentation rate (2nd analysis) (mm/hr). | ||||
| 41.1 Change from baseline | 4 | 326 | Mean Difference (IV, Random, 95% CI) | ‐3.11 [‐4.62, ‐1.60] |
| 41.2 End point | 4 | 234 | Mean Difference (IV, Random, 95% CI) | ‐9.56 [‐22.03, 2.91] |
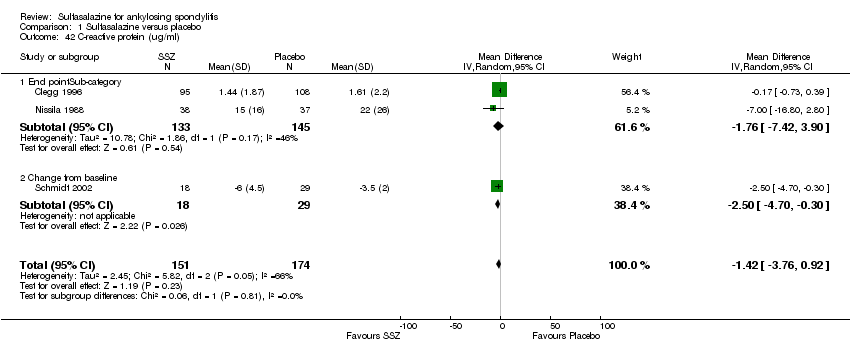
| 42 C‐reactive protein (ug/ml) Show forest plot | 3 | 325 | Mean Difference (IV, Random, 95% CI) | ‐1.42 [‐3.76, 0.92] |
| Analysis 1.42  Comparison 1 Sulfasalazine versus placebo, Outcome 42 C‐reactive protein (ug/ml). | ||||
| 42.1 End pointSub‐category | 2 | 278 | Mean Difference (IV, Random, 95% CI) | ‐1.76 [‐7.42, 3.90] |
| 42.2 Change from baseline | 1 | 47 | Mean Difference (IV, Random, 95% CI) | ‐2.5 [‐4.70, ‐0.30] |
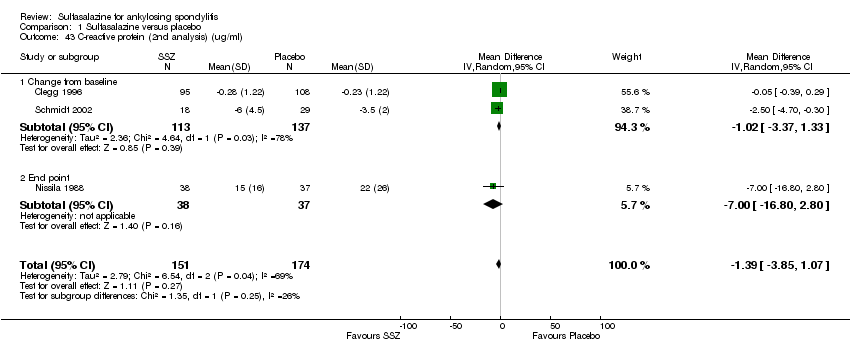
| 43 C‐reactive protein (2nd analysis) (ug/ml) Show forest plot | 3 | 325 | Mean Difference (IV, Random, 95% CI) | ‐1.39 [‐3.85, 1.07] |
| Analysis 1.43  Comparison 1 Sulfasalazine versus placebo, Outcome 43 C‐reactive protein (2nd analysis) (ug/ml). | ||||
| 43.1 Change from baseline | 2 | 250 | Mean Difference (IV, Random, 95% CI) | ‐1.02 [‐3.37, 1.33] |
| 43.2 End point | 1 | 75 | Mean Difference (IV, Random, 95% CI) | ‐7.0 [‐16.80, 2.80] |
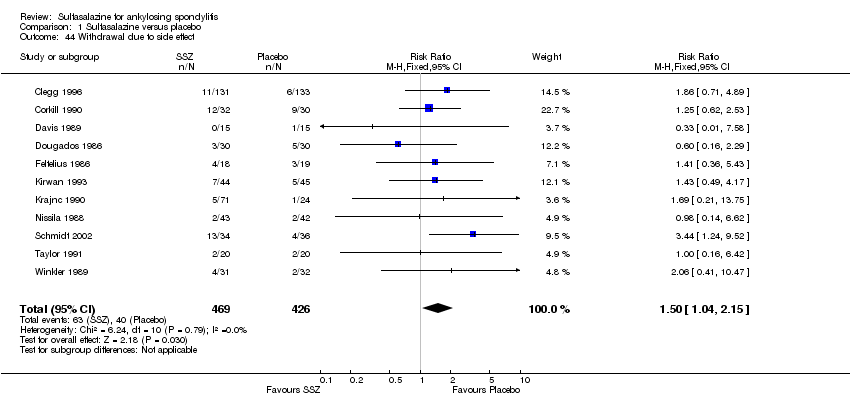
| 44 Withdrawal due to side effect Show forest plot | 11 | 895 | Risk Ratio (M‐H, Fixed, 95% CI) | 1.50 [1.04, 2.15] |
| Analysis 1.44  Comparison 1 Sulfasalazine versus placebo, Outcome 44 Withdrawal due to side effect. | ||||
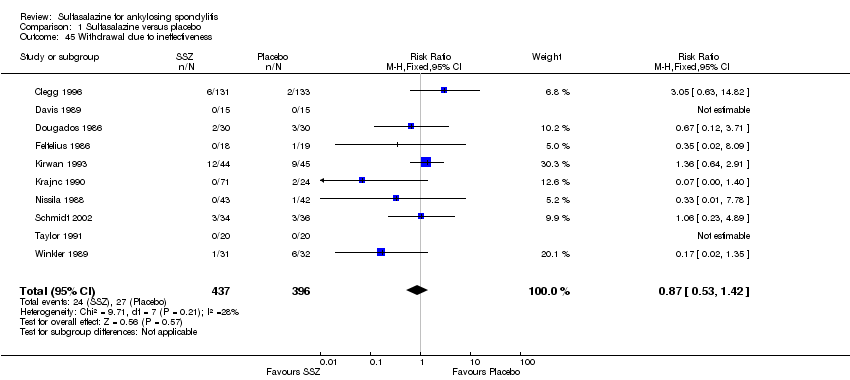
| 45 Withdrawal due to ineffectiveness Show forest plot | 10 | 833 | Risk Ratio (M‐H, Fixed, 95% CI) | 0.87 [0.53, 1.42] |
| Analysis 1.45  Comparison 1 Sulfasalazine versus placebo, Outcome 45 Withdrawal due to ineffectiveness. | ||||
| 46 Drop‐out for any reason Show forest plot | 10 | 833 | Risk Ratio (M‐H, Fixed, 95% CI) | 1.33 [1.03, 1.73] |
| Analysis 1.46 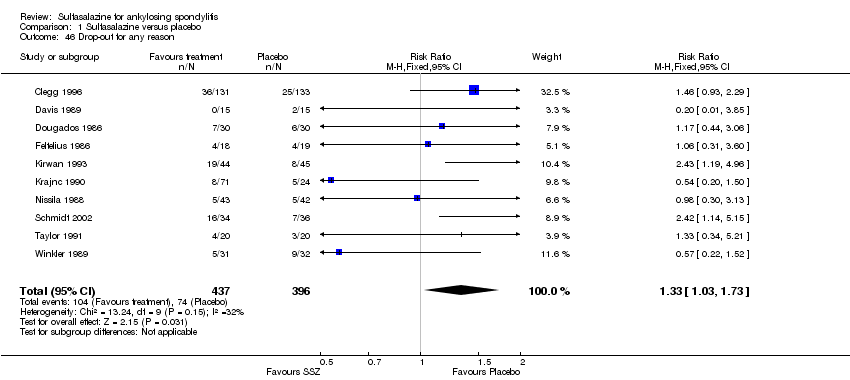 Comparison 1 Sulfasalazine versus placebo, Outcome 46 Drop‐out for any reason. | ||||
| 47 Serious adverse events Show forest plot | 1 | 264 | Peto Odds Ratio (Peto, Fixed, 95% CI) | 7.50 [0.15, 378.16] |
| Analysis 1.47  Comparison 1 Sulfasalazine versus placebo, Outcome 47 Serious adverse events. | ||||
| Outcome or subgroup title | No. of studies | No. of participants | Statistical method | Effect size |
| 1 Back pain (VAS 100 mm, 0 = no pain, 100 = severe pain) Show forest plot | 1 | Mean Difference (IV, Random, 95% CI) | Totals not selected | |
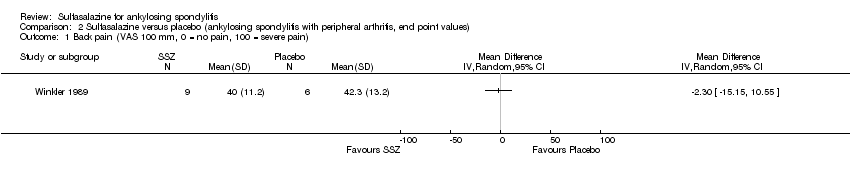
| Analysis 2.1  Comparison 2 Sulfasalazine versus placebo (ankylosing spondylitis with peripheral arthritis, end point values), Outcome 1 Back pain (VAS 100 mm, 0 = no pain, 100 = severe pain). | ||||
| 2 Score of sleep disturbance (0 to 4, 0 = no disturbance, 4 = severe disturbance) Show forest plot | 1 | Mean Difference (IV, Random, 95% CI) | Totals not selected | |
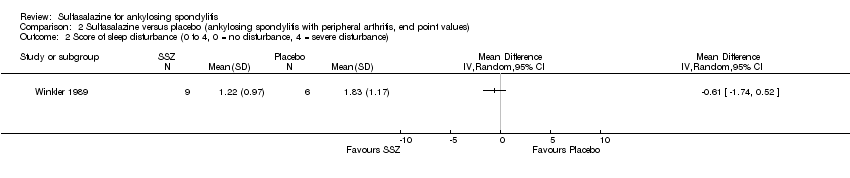
| Analysis 2.2  Comparison 2 Sulfasalazine versus placebo (ankylosing spondylitis with peripheral arthritis, end point values), Outcome 2 Score of sleep disturbance (0 to 4, 0 = no disturbance, 4 = severe disturbance). | ||||
| 3 Chest expansion (cm) Show forest plot | 1 | Mean Difference (IV, Random, 95% CI) | Totals not selected | |
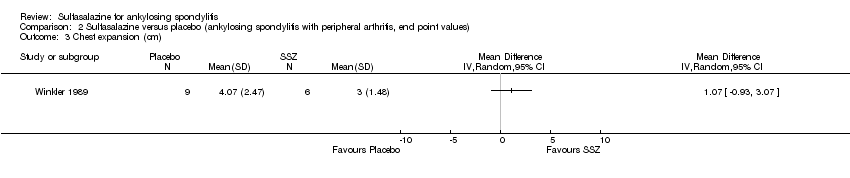
| Analysis 2.3  Comparison 2 Sulfasalazine versus placebo (ankylosing spondylitis with peripheral arthritis, end point values), Outcome 3 Chest expansion (cm). | ||||
| 4 Schober's test (cm) Show forest plot | 1 | Mean Difference (IV, Random, 95% CI) | Totals not selected | |
| Analysis 2.4 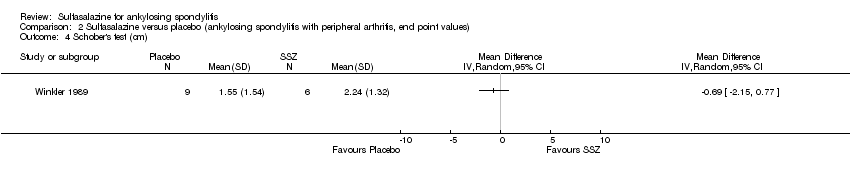 Comparison 2 Sulfasalazine versus placebo (ankylosing spondylitis with peripheral arthritis, end point values), Outcome 4 Schober's test (cm). | ||||
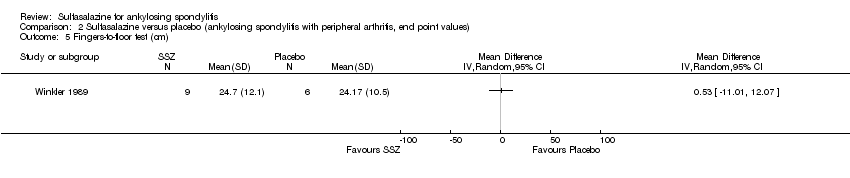
| 5 Fingers‐to‐floor test (cm) Show forest plot | 1 | Mean Difference (IV, Random, 95% CI) | Totals not selected | |
| Analysis 2.5  Comparison 2 Sulfasalazine versus placebo (ankylosing spondylitis with peripheral arthritis, end point values), Outcome 5 Fingers‐to‐floor test (cm). | ||||
| 6 Articular index (0 to 66, the higher the score the more severe the disease) Show forest plot | 1 | Mean Difference (IV, Random, 95% CI) | Totals not selected | |
| Analysis 2.6  Comparison 2 Sulfasalazine versus placebo (ankylosing spondylitis with peripheral arthritis, end point values), Outcome 6 Articular index (0 to 66, the higher the score the more severe the disease). | ||||
| 7 Degree of joint swelling (0 to 66, the higher the score the more severe the disease) Show forest plot | 1 | Mean Difference (IV, Random, 95% CI) | Totals not selected | |
| Analysis 2.7 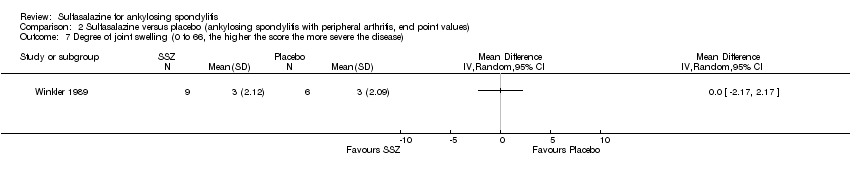 Comparison 2 Sulfasalazine versus placebo (ankylosing spondylitis with peripheral arthritis, end point values), Outcome 7 Degree of joint swelling (0 to 66, the higher the score the more severe the disease). | ||||
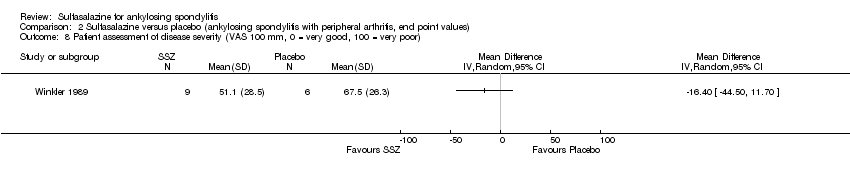
| 8 Patient assessment of disease severity (VAS 100 mm, 0 = very good, 100 = very poor) Show forest plot | 1 | Mean Difference (IV, Random, 95% CI) | Totals not selected | |
| Analysis 2.8  Comparison 2 Sulfasalazine versus placebo (ankylosing spondylitis with peripheral arthritis, end point values), Outcome 8 Patient assessment of disease severity (VAS 100 mm, 0 = very good, 100 = very poor). | ||||
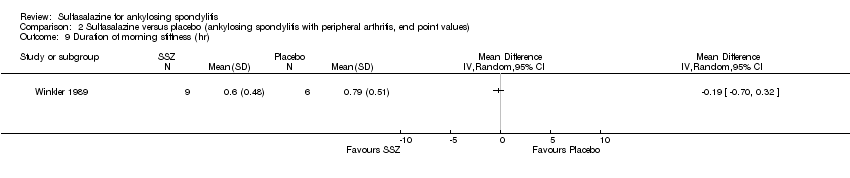
| 9 Duration of morning stiffness (hr) Show forest plot | 1 | Mean Difference (IV, Random, 95% CI) | Totals not selected | |
| Analysis 2.9  Comparison 2 Sulfasalazine versus placebo (ankylosing spondylitis with peripheral arthritis, end point values), Outcome 9 Duration of morning stiffness (hr). | ||||
| 10 Erythrocyte sedimentation rate (mm/hr) Show forest plot | 1 | Mean Difference (IV, Random, 95% CI) | Totals not selected | |
| Analysis 2.10 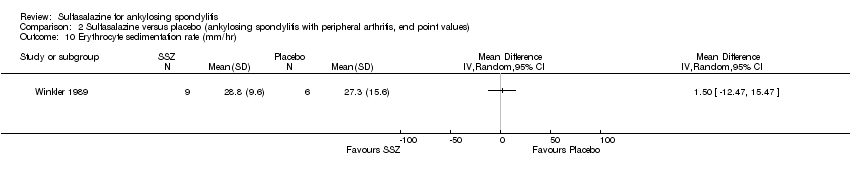 Comparison 2 Sulfasalazine versus placebo (ankylosing spondylitis with peripheral arthritis, end point values), Outcome 10 Erythrocyte sedimentation rate (mm/hr). | ||||
| Outcome or subgroup title | No. of studies | No. of participants | Statistical method | Effect size |
| 1 Back pain (VAS 100 mm, 0 = no pain, 100 = severe pain) Show forest plot | 1 | Mean Difference (IV, Random, 95% CI) | Totals not selected | |
| Analysis 3.1  Comparison 3 Sulfasalazine versus placebo (axial form ankylosing spondylitis, end point values), Outcome 1 Back pain (VAS 100 mm, 0 = no pain, 100 = severe pain). | ||||
| 2 Score of sleep disturbance (0 to 4, 0 = no disturbance, 4 = severe disturbance) Show forest plot | 1 | Mean Difference (IV, Random, 95% CI) | Totals not selected | |
| Analysis 3.2 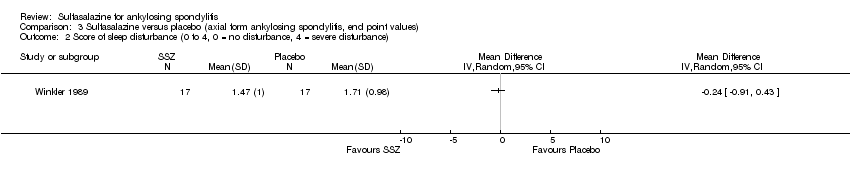 Comparison 3 Sulfasalazine versus placebo (axial form ankylosing spondylitis, end point values), Outcome 2 Score of sleep disturbance (0 to 4, 0 = no disturbance, 4 = severe disturbance). | ||||
| 3 Chest expansion (cm) Show forest plot | 1 | Mean Difference (IV, Random, 95% CI) | Totals not selected | |
| Analysis 3.3  Comparison 3 Sulfasalazine versus placebo (axial form ankylosing spondylitis, end point values), Outcome 3 Chest expansion (cm). | ||||
| 4 Schober's test (cm) Show forest plot | 1 | Mean Difference (IV, Random, 95% CI) | Totals not selected | |
| Analysis 3.4 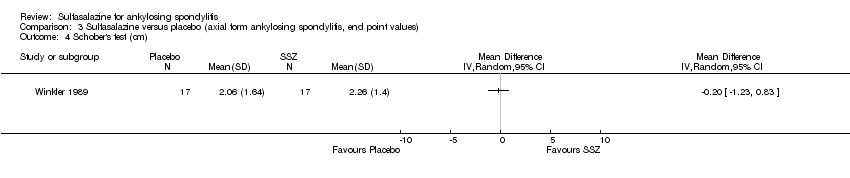 Comparison 3 Sulfasalazine versus placebo (axial form ankylosing spondylitis, end point values), Outcome 4 Schober's test (cm). | ||||
| 5 Fingers‐to‐floor test (cm) Show forest plot | 1 | Mean Difference (IV, Random, 95% CI) | Totals not selected | |
| Analysis 3.5 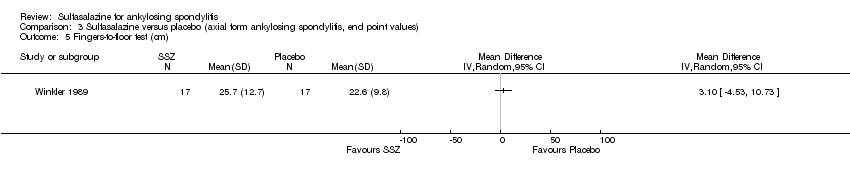 Comparison 3 Sulfasalazine versus placebo (axial form ankylosing spondylitis, end point values), Outcome 5 Fingers‐to‐floor test (cm). | ||||
| 6 Patient assessment of disease severity (VAS 100 mm, 0 = very good, 100 = very poor) Show forest plot | 1 | Mean Difference (IV, Random, 95% CI) | Totals not selected | |
| Analysis 3.6  Comparison 3 Sulfasalazine versus placebo (axial form ankylosing spondylitis, end point values), Outcome 6 Patient assessment of disease severity (VAS 100 mm, 0 = very good, 100 = very poor). | ||||
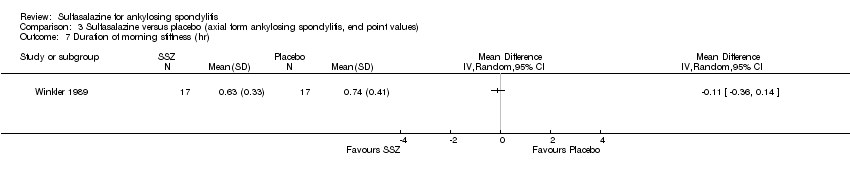
| 7 Duration of morning stiffness (hr) Show forest plot | 1 | Mean Difference (IV, Random, 95% CI) | Totals not selected | |
| Analysis 3.7  Comparison 3 Sulfasalazine versus placebo (axial form ankylosing spondylitis, end point values), Outcome 7 Duration of morning stiffness (hr). | ||||
| 8 Erythrocyte sedimentation rate (mm/hr) Show forest plot | 1 | Mean Difference (IV, Fixed, 95% CI) | Totals not selected | |
| Analysis 3.8 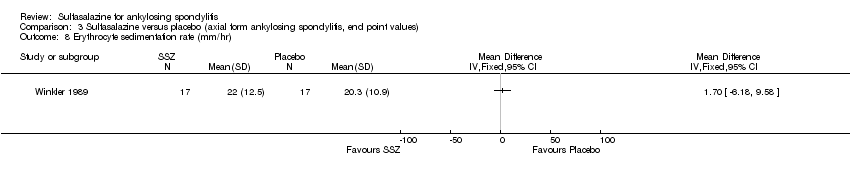 Comparison 3 Sulfasalazine versus placebo (axial form ankylosing spondylitis, end point values), Outcome 8 Erythrocyte sedimentation rate (mm/hr). | ||||

Study flow diagram.
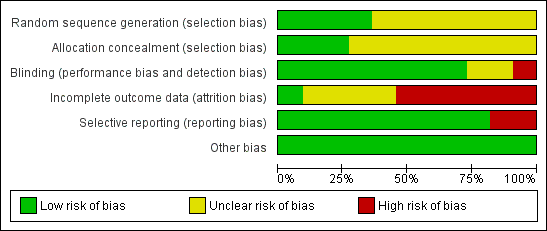
Risk of bias graph: review authors' judgments about each risk of bias item presented as percentages across all included studies.

Risk of bias summary: review authors' judgments about each risk of bias item for each included study.
Comparison 1 Sulfasalazine versus placebo, Outcome 1 Spondylitis function index (Score 0 to 40, 0 to 44, 0 = the best).

Comparison 1 Sulfasalazine versus placebo, Outcome 2 Spondylitis function index (2nd analysis) (score 0 to 40, 0 to 44, 0 = the best).

Comparison 1 Sulfasalazine versus placebo, Outcome 3 Improvement in back pain.
Comparison 1 Sulfasalazine versus placebo, Outcome 4 Back pain (VAS 100 mm, 0 = no pain, 100 = severe pain).
Comparison 1 Sulfasalazine versus placebo, Outcome 5 Back pain (2nd analysis) (VAS 100 mm, 0 = no pain, 100 = severe pain).
Comparison 1 Sulfasalazine versus placebo, Outcome 6 Night pain (% no pain).
Comparison 1 Sulfasalazine versus placebo, Outcome 7 Score of sleep disturbance (end point) (0 to 4, 0 = no disturbance, 4 = severe disturbance).

Comparison 1 Sulfasalazine versus placebo, Outcome 8 Frequency of nocturnal awakening (change from baseline).

Comparison 1 Sulfasalazine versus placebo, Outcome 9 Score of daily NSAIDs (change from baseline, usual dosage as 10).
Comparison 1 Sulfasalazine versus placebo, Outcome 10 Reducing or stopping NSAIDs.
Comparison 1 Sulfasalazine versus placebo, Outcome 11 Chest expansion (cm).
Comparison 1 Sulfasalazine versus placebo, Outcome 12 Chest expansion (2nd analysis) (cm).

Comparison 1 Sulfasalazine versus placebo, Outcome 13 Forced vital volume (change from baseline) (L/min).

Comparison 1 Sulfasalazine versus placebo, Outcome 14 (Modified) Schober's test (cm).
Comparison 1 Sulfasalazine versus placebo, Outcome 15 (Modified) Schober's test (2nd analysis) (cm).

Comparison 1 Sulfasalazine versus placebo, Outcome 16 Occiput‐to‐wall test (cm).

Comparison 1 Sulfasalazine versus placebo, Outcome 17 Occiput‐to‐wall test (2nd analysis) (cm).

Comparison 1 Sulfasalazine versus placebo, Outcome 18 Fingers‐to‐floor test (cm).
Comparison 1 Sulfasalazine versus placebo, Outcome 19 Fingers‐to‐floor test (2nd analysis) (cm).

Comparison 1 Sulfasalazine versus placebo, Outcome 20 Chin sternum distance (change from baseline) (cm).
Comparison 1 Sulfasalazine versus placebo, Outcome 21 Joint pain/tenderness score (0 to 198, the higher the score the more severe the disease) or number.
Comparison 1 Sulfasalazine versus placebo, Outcome 22 Joint pain/tenderness score (2nd analysis) (0 to 198, the higher the score the more severe the disease).

Comparison 1 Sulfasalazine versus placebo, Outcome 23 Joint swelling score (0 to 198, the higher score the more severe the disease) or number.

Comparison 1 Sulfasalazine versus placebo, Outcome 24 Joint swelling score (2nd analysis) (0 to 198, the higher the score the more severe the disease).

Comparison 1 Sulfasalazine versus placebo, Outcome 25 Dactylitis score (0 to 3, 0 = normal, 3 = severe).

Comparison 1 Sulfasalazine versus placebo, Outcome 26 Dactylitis score (2nd analysis) (0 to 3, 0 = normal, 3 = severe).

Comparison 1 Sulfasalazine versus placebo, Outcome 27 Enthesopathy index (0 to 90, 0 to 66, 0 to 90, the higher the score the more severe the disease).

Comparison 1 Sulfasalazine versus placebo, Outcome 28 Enthesopathy index (2nd analysis) (0 to 90, 0 to 66, 0 to 90, the higher score the more severe the disease).
Comparison 1 Sulfasalazine versus placebo, Outcome 29 Spondylitis articular index (0 to 90, the higher score the more severe the disease).

Comparison 1 Sulfasalazine versus placebo, Outcome 30 Spondylitis articular index (2nd analysis) (0 to 90, the higher score the more severe the disease).

Comparison 1 Sulfasalazine versus placebo, Outcome 31 Improvement in patient global assessment.

Comparison 1 Sulfasalazine versus placebo, Outcome 32 Patient assessment of disease severity (end point) (VAS 100 mm, 0 = very good, 100 = very poor).

Comparison 1 Sulfasalazine versus placebo, Outcome 33 General well‐being (end point) (VAS 100 mm, 0 = very good, 100 = very poor).

Comparison 1 Sulfasalazine versus placebo, Outcome 34 Improvement in physician global assessment.
Comparison 1 Sulfasalazine versus placebo, Outcome 35 Response to treatment (based on both patient and physician assessment).
Comparison 1 Sulfasalazine versus placebo, Outcome 36 Duration of morning stiffness (hr).
Comparison 1 Sulfasalazine versus placebo, Outcome 37 Duration of morning stiffness (2nd analysis) (hr).

Comparison 1 Sulfasalazine versus placebo, Outcome 38 Morning stiffness (end point) (VAS 100 mm, 0 = no stiffness, 100 = severe stiffness).
Comparison 1 Sulfasalazine versus placebo, Outcome 39 Improvement in morning stiffness.
Comparison 1 Sulfasalazine versus placebo, Outcome 40 Erythrocyte sedimentation rate (mm/hr).
Comparison 1 Sulfasalazine versus placebo, Outcome 41 Erythrocyte sedimentation rate (2nd analysis) (mm/hr).
Comparison 1 Sulfasalazine versus placebo, Outcome 42 C‐reactive protein (ug/ml).
Comparison 1 Sulfasalazine versus placebo, Outcome 43 C‐reactive protein (2nd analysis) (ug/ml).
Comparison 1 Sulfasalazine versus placebo, Outcome 44 Withdrawal due to side effect.
Comparison 1 Sulfasalazine versus placebo, Outcome 45 Withdrawal due to ineffectiveness.

Comparison 1 Sulfasalazine versus placebo, Outcome 46 Drop‐out for any reason.

Comparison 1 Sulfasalazine versus placebo, Outcome 47 Serious adverse events.
Comparison 2 Sulfasalazine versus placebo (ankylosing spondylitis with peripheral arthritis, end point values), Outcome 1 Back pain (VAS 100 mm, 0 = no pain, 100 = severe pain).
Comparison 2 Sulfasalazine versus placebo (ankylosing spondylitis with peripheral arthritis, end point values), Outcome 2 Score of sleep disturbance (0 to 4, 0 = no disturbance, 4 = severe disturbance).
Comparison 2 Sulfasalazine versus placebo (ankylosing spondylitis with peripheral arthritis, end point values), Outcome 3 Chest expansion (cm).

Comparison 2 Sulfasalazine versus placebo (ankylosing spondylitis with peripheral arthritis, end point values), Outcome 4 Schober's test (cm).
Comparison 2 Sulfasalazine versus placebo (ankylosing spondylitis with peripheral arthritis, end point values), Outcome 5 Fingers‐to‐floor test (cm).

Comparison 2 Sulfasalazine versus placebo (ankylosing spondylitis with peripheral arthritis, end point values), Outcome 6 Articular index (0 to 66, the higher the score the more severe the disease).

Comparison 2 Sulfasalazine versus placebo (ankylosing spondylitis with peripheral arthritis, end point values), Outcome 7 Degree of joint swelling (0 to 66, the higher the score the more severe the disease).
Comparison 2 Sulfasalazine versus placebo (ankylosing spondylitis with peripheral arthritis, end point values), Outcome 8 Patient assessment of disease severity (VAS 100 mm, 0 = very good, 100 = very poor).
Comparison 2 Sulfasalazine versus placebo (ankylosing spondylitis with peripheral arthritis, end point values), Outcome 9 Duration of morning stiffness (hr).

Comparison 2 Sulfasalazine versus placebo (ankylosing spondylitis with peripheral arthritis, end point values), Outcome 10 Erythrocyte sedimentation rate (mm/hr).

Comparison 3 Sulfasalazine versus placebo (axial form ankylosing spondylitis, end point values), Outcome 1 Back pain (VAS 100 mm, 0 = no pain, 100 = severe pain).

Comparison 3 Sulfasalazine versus placebo (axial form ankylosing spondylitis, end point values), Outcome 2 Score of sleep disturbance (0 to 4, 0 = no disturbance, 4 = severe disturbance).

Comparison 3 Sulfasalazine versus placebo (axial form ankylosing spondylitis, end point values), Outcome 3 Chest expansion (cm).

Comparison 3 Sulfasalazine versus placebo (axial form ankylosing spondylitis, end point values), Outcome 4 Schober's test (cm).

Comparison 3 Sulfasalazine versus placebo (axial form ankylosing spondylitis, end point values), Outcome 5 Fingers‐to‐floor test (cm).

Comparison 3 Sulfasalazine versus placebo (axial form ankylosing spondylitis, end point values), Outcome 6 Patient assessment of disease severity (VAS 100 mm, 0 = very good, 100 = very poor).
Comparison 3 Sulfasalazine versus placebo (axial form ankylosing spondylitis, end point values), Outcome 7 Duration of morning stiffness (hr).

Comparison 3 Sulfasalazine versus placebo (axial form ankylosing spondylitis, end point values), Outcome 8 Erythrocyte sedimentation rate (mm/hr).
| Sulfasalazine compared to placebo for ankylosing spondylitis | ||||||
| Patient or population: Patients with ankylosing spondylitis | ||||||
| Outcomes | Illustrative comparative risks* (95% CI) | Relative effect | No of Participants | Quality of the evidence | Comments | |
| Assumed risk | Corresponding risk | |||||
| Placebo | Sulfasalazine | |||||
| Back pain (pooled data) | The mean back pain (pooled data) in the control groups was | The mean back pain (pooled data) in the intervention groups was | 454 | ⊕⊕⊕⊝ | Absolute risk difference 3% lower (95% CI 1% to 6%); Relative percent change = 6% (95% CI 2% to 12%); NNT4 = n/a5 | |
| Mean improvement in Bath ankylosing spondylitis disease activity index (BASDAI) ‐ not reported | See comment | See comment | Not estimable | No data | See comment | Not measured |
| Mean improvement in Bath ankylosing spondylitis function index (BASFI) ‐ not reported | See comment | See comment | Not estimable | No data | See comment | Not measured |
| Mean improvement in Bath ankylosing spondylitis metrology index (BASMI) ‐ not reported | See comment | See comment | Not estimable | No data | See comment | Not measured |
| Radiographic progress ‐ not reported | See comment | See comment | Not estimable | No data | See comment | Not measured |
| Total number of withdrawals due to adverse events | 94 per 1000 | 134 per 1000 | RR 1.43 | 895 | ⊕⊕⊕⊝ | Absolute risk difference 4% (95% CI 0.4% to 8.8%); NNTH6 = 25 (95% CI 266 to 12) |
| Serious adverse events | 0 per 1000 | 1 per 1000 | OR 7.5 | 264 | ⊕⊕⊕⊝ | Absolute risk difference 750% (95% CI 15% to 37816%) (W); Relative percent change = 205% (95% CI ‐87% to 7309%); NNTH = n/a |
| *The basis for the assumed risk (e.g. the median control group risk across studies) is provided in footnotes. The corresponding risk (and its 95% confidence interval) is based on the assumed risk in the comparison group and the relative effect of the intervention (and its 95% CI). | ||||||
| GRADE Working Group grades of evidence | ||||||
| 1 From Clegg 1996, mean back pain at baseline in placebo = 48.9 (95% CI 3.0 to 94.8). 4 NNT (Number needed to treat). NNT for dichotomous outcomes calculated using Cates NNT calculator (http://www.nntonline.net/visualrx/). 5 n/a means result is not statistically significant. 6NNTH (Number needed to treat to harm). | ||||||
| Study | Methodological quality | Duration/sample size | Disease duration | Peripheral arthritis | Baseline ESR | Intervention | Main results | Drop‐out |
| Mutlicenter RCT Concealment: unclear risk Assessment: blind | 36 weeks/264 | 18.5+/‐11.6 | 29% | SSZ: 24.6+/‐18.0 Placebo: 25.2+/‐22.0 | SSZ (or placebo) 2.0 g/d | ESR declined more with SSZ than with placebo (P < 0.0001). When comparing SSZ responders with non‐responders, the former had a greater decrease in ESR (P < 0.04) Patients with peripheral arthritis showed improvement that favored SSZ (P < 0.02) No significant difference in other parameters. One patient taking SSZ had severe adverse drug reaction | 19.3% | |
| RCT Concealment: unclear risk Assessment: blind | 48 weeks/62 | SSZ: 12.3+/‐8.2 Placebo: 16.1+/‐11.4 | 19% | SSZ: 15+/‐16 Placebo: 24+/‐26 | SSZ (or placebo) 2.0 g/d | No significant difference between intervention groups | No data | |
| RCT Concealment: unclear Risk assessment: blind | 3 months/30 | Median SSZ: 8.6 Placebo: 8.4 | 23% | SSZ: 24+/‐7.8(95% confidence limits) Placebo: 26.4+/‐8.6 | SSZ (or placebo) 2.0 g/d | Claimed effective on the basis of before‐after comparison | 6.7% | |
| RCT Concealment: low risk Assessment: blind | 6 months/60 | Median 10 | 0% | SSZ: 13.5(median) Placebo: 11.0 | SSZ (or placebo) 2.0 g/d | Success in patient assessment was more in SSZ than in placebo group. Function index and NSAIDs dosage were significantly improved in SSZ compared with placebo group. No difference was found in other parameters | 21.7% | |
| RCT Concealment: unclear risk Assessment: blind | 12 weeks/37 | Median SSZ: 12.1 Placebo: 10.4 | 5% | SSZ: 24.3+/‐17.4 Placebo: 28.5+/‐19.5 | SSZ (or placebo) up to 3.0 g/d | Only graphs (no figures) were presented. Compared with placebo group, morning stiffness and sleep disturbance were significantly improved in SSZ group Analysis of SSZ group showed that the greatest improvement were those with ESR > 20 mm/hr or haptoglobin > 3.8 g/L | 21.6% | |
| RCT Concealment: low risk Assessment: blind | 3 years/89 | SSZ: 19+/‐12 Placebo: 21.9+/‐11.7 | 28% | No data | SSZ (or placebo) 2.0 g/d | Occurence of peripheral joint symptoms was lower in SSZ group: SSZ: 0.298 episodes/yr Placebo: 0.392 episodes/yr, P < 0.05 No difference was found in Schober test, chest expansion and cervical spine lateral flexion. More drop‐outs in SSZ group | 30.3% | |
| RCT Concealment: unclear risk Assessment: blind | 24 weeks/95 SSZ = 71 Placebo = 24 | No data | 66% | SSZ: 41+/‐19 Placebo: 43+/‐18 | SSZ (or placebo) up to 3.0 g/d | On the basis of before‐after treatment comparison, duration of morning stiffness, number of painful and swollen joints, and ESR, there was significant improvement in SSZ group Duration of morning stiffness and ESR value were given in the paper and we found no significant difference between the intervention groups | 14.3% | |
| RCT Concealment: unclear risk Assessment: blind | 26 weeks/85 | SSZ: 5.4+/‐7.3 Placebo: 3.8+/‐4.3 | 68% | SSZ: 42+/‐20 Placebo: 46+/‐19 | SSZ (or placebo) up to 3.0 g/d | Significant differences between intervention groups were observed in severity of morning stiffness, chest expansion and ESR. We also found severity of pain significantly improved in SSZ, compared with placebo group | 12.2% | |
| RCT Concealment: unclear risk Assessment: blind? | 26 weeks/70 | SSZ: 16.7+/‐7.2 Placebo: 16.3+/‐7.8 | 36% | SSZ: 23.1+/‐3.2 Placebo 20.4+/‐2.4 | SSZ (or placebo) 3.0 g/d | No significant difference was found between intervention groups except IgA. There were more drop‐outs in SSZ than in placebo group (18/34 versus 7/36) | 32.9% | |
| RCT Concealment: low risk Assessment: blind | 1 year/40 | SSZ: 11+/‐1.6 Placebo: 10.7+/‐1.6 | 15% | SSZ: 27 Placebo: 25 | SSZ (or placebo) 2.0 g/d | No significant difference was found between intervention groups in all parameters except pain (measured with visual analogue scale). However, the pooled result showed no statistically significant, too | 17.5% | |
| RCT Concealment: unclear risk Assessment: blind? | 24 weeks/63 | Median SSZ: 10.8 Placebo: 11.2 | 33% | SSZ: 33.4+/‐20.4 Placebo: 26.9+/‐16.4 | SSZ (or placebo) 2.0 g/d | The advantage of SSZ over placebo were significant only in the duration of morning stiffness and disturbance of sleep. The same results were found in the patients with axial form (N = 34). In patients with peripheral arthritis (N = 15), articular index showed significant improvement in SSZ over placebo | 22.2% | |
| ESR ‐ erythrocyte sedimentation rate | ||||||||
| Study and Duration | Participants | Outcomes assessed | Results reported | Present analysis | ESR results | Spinal stiffness |
| Clegg 1996, 36 weeks | 264 (SSZ: 31) (Placebo: 133) 29% with PA DD (year): 18.5±11.6 ESR (mm/h): 26.4±18.0 (SSZ) 25.2±22.0 (placebo) | Primary outcomes included response to treatment, improvement in PhGA, PGA, back pain and morning stiffness. Secondary outcomes included night pain (event), duration of morning stiffness, back pain VAS, spondylitis function index, joint/tenderness score, joint swelling score, dactylitis score, enthesopathy index, spondylitis articular index, chest expansion, Schober's test, occiput‐to‐wall test, fingers‐to‐floor test, ESR and CRP | Drop‐out: 19.3%. Both end point value and change from baseline were presented for all continuous outcomes. No difference was found between treatment groups in all outcomes except ESR, which declined more with SSZ than placebo group (P < 0.0001). When comparing SSZ responders with non‐responders, the former had a greater decrease in ESR (P < 0.04). Subgroup analysis showed that in patients with PA, 55.9% of SSZ group and 30.2% of placebo group got peripheral response (P = 0.023) | All the results reported have been confirmed except subgroup analysis where no information about treatment allocation was available for analysis. MD for ESR (change from baseline) was ‐3.10 mm/h, 95% CI ‐4.85 to ‐1.35 mm/h, favoring SSZ group | Absolute benefit from SSZ: ‐3.6 mm/h Relative difference in change from baseline: ‐14% | Did not report |
| Corkill 1990, 48 weeks | 62 (SSZ: 32) (Placebo: 30) 19% with PA DD (year): 12.3±8.2 (SSZ) 16.1±11.4 (placebo) ESR (mm/h): 15±16 (SSZ) 24±26 (placebo) | Spinal pain VAS, spinal stiffness VAS, peripheral joint pain VAS, Schober's test, chest expansion, cervical flexion, cervical rotation, and ESR | Drop‐out: 1.6%. No significant difference was found between treatment groups | Because SDs were not given for all outcomes, these results could not be analyzed | Absolute benefit from SSZ: ‐0.1 mm/h Relative difference in change from baseline: ‐1% | Absolute benefit from SSZ: ‐9.8 mm on 100 mm VAS Relative difference in change from baseline: ‐25% |
| Davis 1989, 3 months | 30 (SSZ: 15) (Placebo: 15) 23% with PA DD (year): 8.6 (SSZ) 8.4 (placebo) ESR (mm/h): 24±7.8 (SSZ) 26.4±8.6 (placebo) | Pain VAS, spinal stiffness VAS, sleep disturbance (event), occiput‐to‐wall test, fingers‐to‐floor test, ESR and CRP | Drop‐out: 6.7%. In SSZ group, all clinical outcomes showed significantly improved when initial and 3 months results are compared | Pain VAS, spinal stiffness VAS and CRP could not be analyzed because means and SDs were not given. No significant difference was found in any other outcome | Absolute benefit from SSZ: ‐5.4 mm/h Relatiive difference in change from baseline: ‐20% | Absolute benefit from SSZ: ‐20 mm on 100 mm VAS Relative difference in change from baseline: ‐40% |
| Dougados 1986, 6 months | 60 (SSZ: 30) (Placebo: 30) None with PA DD (year, median): 10 ESR (mm/h, median): 13.5 (SSZ) 11.0 (placebo) | PGA, score of daily NSAIDs, pain VAS, joint index, frequency of nocturnal awakening, function index, Schober's test, fingers‐to‐floor test, chest expansion and ESR | Drop‐out: 21.7%. Success in PGA was more in SSZ than in placebo group (15/30 vs 6/30, P < 0.05). SSZ resulted in a significant reduction in score of daily NSAIDs (P < 0.05) and significant improvement of function index (P was not given) compared with placebo. No significant difference was found in other outcomes | All continuous outcomes were presented as median and 95% CI. For RevMan analysis, we assumed that mean is equal to median for each outcome and calculated SD from 95% CI and sample size. Success in PGA was more in SSZ than in placebo group (RR 2.5, 95% CI 1.12 to 5.56). No significant difference was found between treatment groups in other outcomes | Absolute benefit from SSZ: 0 mm/h | Did not report |
| Feltelius 1986, 12 weeks | 37 (SSZ:18) (Placebo: 19) 5% with PA DD (year, median): 12.1 (SSZ) 10.4 (placebo) ESR (mm/h): 24.3±17.4 (SSZ) 28.5±19.5 (placebo) | Duration of morning stiffness, spinal stiffness VAS, pain VAS, general wellbeing VAS, chest expansion, Schober's test, sleep disturbance (event), sacroiliac pain VAS, ESR | Drop‐out: 21.6%. Spinal stiffness VAS, chest expansion and sleep disturbance were significantly improved in SSZ compared with placebo group | All outcomes were presented as graphs and no data were available for analysis except ESR that showed no significant difference between treatment groups | Absolute benefit from SSZ: 1.3 mm/h Relative difference in change from baseline: 5% | Did not report |
| Kirwan 1993, 3 years | 89 (SSZ: 44) (Placebo: 45) 28% with PA DD (year): 19±12 (SSZ) 21.9±11.7 (placebo) ESR not given | Primary outcomes included Schober's test, chest expansion, and lateral cervical flexion. Secondary outcomes included function (HAQ), back pain VAS, consumption of anti‐inflammatory drugs, sleep disturbance VAS, PGA, episodes of peripheral arthritis, episodes of heel pain, flares in general AS symptoms, episodes of arthritis | Drop‐out: 30.3%. No significant difference was found between treatment groups in all outcomes except occurrence of peripheral joint symptoms. The episodes of PA were 0.289 episodes/year in SSZ and 0.392 episodes/year in placebo group, respectively (P < 0.05) | There were significantly more drop‐outs for any reason in SSZ than in placebo group. RR was 2.43 (95% CI 1.19 to 4.96). No data were available for analysis in any other outcome | Did not report | Did not report |
| Krajnc 1990, 24 weeks | 95 (SSZ: 71) (Placebo: 24) 66% with PA DD not given ESR (mm/h): 41±19 (SSZ) 43±18 (placebo) | Duration of morning stiffness, Schober's test, chest expansion, fingers‐to‐floor test, number of painful/swollen joints and ESR | Drop‐out: 14.3%. In SSZ group, duration of morning stiffness, chest expansion, number of painful/swollen joints and ESR showed significantly improved when initial and 24 weeks results are compared | No significant difference was found between treatment groups in all outcomes except ESR (MD ‐17.00 mm/h, 95% CI ‐26.99 to ‐7.01mm/h, favoring SSZ) | Absolute benefit from SSZ: 15 mm/h Relatiive difference in change from baseline: ‐35% | Absoluete benefit from SSZ: ‐4 mm on 100 mm VAS Relative difference in change from baseline: ‐8% |
| Nissila 1988, 26 weeks | 85 (SSZ: 43 (Placebo: 42) 68% with PA DD (year): 5.4±7.3 (SSZ) 3.8±4.3 (placebo) ESR (mm/h): 42±20 (SSZ) 46±19 (placebo) | Duration of morning stiffness, spinal stiffness VAS, chest expansion, Schober's test, fingers‐to‐floor test, occiput‐to‐wall test, number of painful joints, number of swollen joints, general wellbeing VAS, ESR and CRP | Drop‐out: 12.2%. Significant differences between treatment groups were found in morning stiffness VAS (P = 0.02), chest expansion (P = 0.03) and ESR (P = 0.02), favoring SSZ. No significant difference was found in other outcomes. Note: we suspected that results of chest expansion were errors because they were impossible to be about 40 to 50 cm. So we divided them by 10 for analysis | Significant differences were found in morning stiffness VAS 100 mm (0 = no stiffness, 100 = severe, MD ‐14.00, 95% CI ‐23.78 to ‐4.22), chest expansion (MD 1.00 cm, 95% CI 0.10 to 1.90 cm), occiput‐to‐wall test (MD ‐0.80 cm, 95% CI ‐1.55 to 0.05 cm), ESR (MD ‐19.00 mm/h, 95% CI ‐29.65 to ‐8.35 mm/h), and general wellbeing VAS 100 mm (0 = the best, 100 = the worst, MD ‐11.00, 95% CI ‐19.84 to ‐2.16), favoring SSZ. No significant difference was found in other outcomes | Absolute benefit from SSZ: ‐15 mm/h Relatiive difference in change from baseline: ‐33% | Absolute benefit from SSZ: ‐6 mm on 100 mm VAS Relative difference in change from baseline: ‐15% |
| Schmidt 2002, 26 weeks | 70 (SSZ: 34) (Placebo: 36) 36% with PA DD (year): 16.7±7.2 (SSZ) 16.3±7.8 (placebo) ESR (mm/h): 23.1±3.2 (SSZ) 20.4±2.4 (placebo) | Back pain VAS, nocturnal awakening (event), pain/tenderness score, duration of morning stiffness, number of painful joints, number of swollen joints, spondylitis function index, PGA, PhGA, Schober's test, fingers‐to‐floor test, chin sternum distance, chest expansion, ESR and CRP | Drop‐out: 36%. No significant difference was reported between treatment groups. There were more drop‐outs in SSZ than in placebo (38% vs 11%) | All continuous outcomes were analyzed as change from baseline. Significant differences were found between treatment groups in back pain VAS 100 mm (0 = no pain, 100 = severe pain, MD ‐2.30, 95% CI ‐4.44 to ‐0.16), chest expansion (MD 0.30 cm, 95% CI 0.16 to 0.44 cm), Schober's test (MD 0.50 cm, 95 CI 0.44 to 0.56 cm), duration of morning stiffness (MD ‐0.39 h, 95% CI ‐0.48 to ‐0.30 h), ESR (MD ‐3.10 mm/h, 95% CI ‐4.85 to ‐1.35 mm/h) and CRP (MD ‐2.50 µg/ml, 95% CI ‐4.70 to ‐0.30 µg/ml), favoring SSZ group. But in occiput‐to‐wall test, the difference (MD 0.70 cm, 95% CI 0.32 to 1.08 cm) favored placebo over SSZ. No significant difference was found in other outcomes. There were significantly more withdrawals for side effects and drop‐outs for any reason in SSZ than in placebo group. RRs were 3.44 (95% CI 1.24 to 9.52) and 2.42 (95% CI 1.14 to 5.15), respectively | Absolute benefit from SSZ: ‐3.1 mm/h Relatiive difference in change from baseline: ‐15% | Did not report |
| Taylor 1991, 1 year | 40 (SSZ: 20) (Placebo: 20) 15% with PA DD (year): 11±1.6 (SSZ) 10.7±1.6 (placebo) ESR (mm/h, mean): 27 (SSZ) 25 (placebo) | Back pain VAS, fingers‐to‐floor test, chest expansion, sleep disturbance (event), forced vital volume, occiput‐to‐wall test, Schober's test, spinal stiffness VAS, reduction or stop of NSAIDs (event) | Drop‐out: 17.5%. No significant difference was found between treatment groups in all outcomes except pain VAS (P < 0.05, favoring SSZ) | No significant difference was found between treatment groups in all outcomes including pain VAS | Did not report | Absolute benefit from SSZ: ‐13.5 mm on 100 mm VAS Relative difference in change from baseline: ‐42% |
| Winkler 1989, 24 weeks | 63 (SSZ: 31) (Placebo: 32) 33% with PA DD (year, median): 10.8 (SSZ) 11.2 (placebo) ESR (mm/h): 33.4±20.4 (SSZ) 26.9±16.4 (placebo) | ESR, duration of morning stiffness, back pain VAS, score of sleep disturbance, chest expansion, Schober's test, fingers‐to‐floor test, disease severity in PGA | Drop‐out: 22.2%. The advantage of SSZ over placebo was significant only in the duration of morning stiffness (P < 0.05) and score of sleep disturbance (P< 0.05). In subgroup analysis, the same results were found in patients with axial form (N = 34). In patients with peripheral arthritis (N = 15), articular index showed significant improvement in SSZ over placebo (P < 0.05) | No significant difference was found between treatment groups in all outcomes. In subgroup analysis of patients with axial form, we found significant difference favoring SSZ over placebo in back pain VAS 100 mm (0 = no pain, 100 = severe pain). MD was ‐9.20 and 95% CI ‐17.81 to 0.59 | Absolute benefit from SSZ: ‐2.7 mm/h Relatiive difference in change from baseline: ‐10% | Did not report |
| CI ‐ confidence interval | ||||||
| Outcome or subgroup title | No. of studies | No. of participants | Statistical method | Effect size |
| 1 Spondylitis function index (Score 0 to 40, 0 to 44, 0 = the best) Show forest plot | 3 | 297 | Mean Difference (IV, Fixed, 95% CI) | 0.14 [‐1.18, 1.46] |
| 1.1 End point | 1 | 203 | Mean Difference (IV, Fixed, 95% CI) | ‐1.0 [‐2.88, 0.88] |
| 1.2 Change from baseline | 2 | 94 | Mean Difference (IV, Fixed, 95% CI) | 1.27 [‐0.60, 3.13] |
| 2 Spondylitis function index (2nd analysis) (score 0 to 40, 0 to 44, 0 = the best) Show forest plot | 3 | 297 | Mean Difference (IV, Fixed, 95% CI) | 0.20 [‐0.77, 1.18] |
| 2.1 Change from baseline | 3 | 297 | Mean Difference (IV, Fixed, 95% CI) | 0.20 [‐0.77, 1.18] |
| 3 Improvement in back pain Show forest plot | 1 | Risk Ratio (M‐H, Fixed, 95% CI) | Totals not selected | |
| 4 Back pain (VAS 100 mm, 0 = no pain, 100 = severe pain) Show forest plot | 6 | 454 | Mean Difference (IV, Random, 95% CI) | ‐2.96 [‐6.33, 0.41] |
| 4.1 End point | 3 | 327 | Mean Difference (IV, Random, 95% CI) | ‐3.47 [‐10.17, 3.22] |
| 4.2 Change from baseline | 3 | 127 | Mean Difference (IV, Random, 95% CI) | ‐4.29 [‐12.15, 3.56] |
| 5 Back pain (2nd analysis) (VAS 100 mm, 0 = no pain, 100 = severe pain) Show forest plot | 6 | 454 | Mean Difference (IV, Random, 95% CI) | ‐2.38 [‐5.78, 1.03] |
| 5.1 Change from baseline | 4 | 330 | Mean Difference (IV, Random, 95% CI) | ‐1.24 [‐4.86, 2.37] |
| 5.2 End point | 2 | 124 | Mean Difference (IV, Random, 95% CI) | ‐6.59 [‐14.73, 1.55] |
| 6 Night pain (% no pain) Show forest plot | 4 | 404 | Risk Ratio (M‐H, Fixed, 95% CI) | 1.04 [0.75, 1.43] |
| 7 Score of sleep disturbance (end point) (0 to 4, 0 = no disturbance, 4 = severe disturbance) Show forest plot | 1 | Mean Difference (IV, Random, 95% CI) | Totals not selected | |
| 8 Frequency of nocturnal awakening (change from baseline) Show forest plot | 1 | Mean Difference (IV, Random, 95% CI) | Totals not selected | |
| 9 Score of daily NSAIDs (change from baseline, usual dosage as 10) Show forest plot | 1 | Mean Difference (IV, Random, 95% CI) | Totals not selected | |
| 10 Reducing or stopping NSAIDs Show forest plot | 1 | Risk Ratio (M‐H, Fixed, 95% CI) | Totals not selected | |
| 11 Chest expansion (cm) Show forest plot | 7 | 536 | Mean Difference (IV, Random, 95% CI) | 0.30 [0.17, 0.43] |
| 11.1 End point | 4 | 409 | Mean Difference (IV, Random, 95% CI) | 0.31 [‐0.03, 0.66] |
| 11.2 Change from baseline | 3 | 127 | Mean Difference (IV, Random, 95% CI) | 0.30 [0.16, 0.44] |
| 12 Chest expansion (2nd analysis) (cm) Show forest plot | 7 | 536 | Mean Difference (IV, Fixed, 95% CI) | 0.31 [0.17, 0.44] |
| 12.1 Change from baseline | 4 | 330 | Mean Difference (IV, Fixed, 95% CI) | 0.29 [0.15, 0.44] |
| 12.2 End point | 3 | 206 | Mean Difference (IV, Fixed, 95% CI) | 0.46 [0.01, 0.90] |
| 13 Forced vital volume (change from baseline) (L/min) Show forest plot | 1 | Mean Difference (IV, Random, 95% CI) | Totals not selected | |
| 14 (Modified) Schober's test (cm) Show forest plot | 7 | 536 | Mean Difference (IV, Random, 95% CI) | 0.18 [‐0.11, 0.46] |
| 14.1 End point | 4 | 409 | Mean Difference (IV, Random, 95% CI) | 0.07 [‐0.14, 0.29] |
| 14.2 Change from baseline | 3 | 127 | Mean Difference (IV, Random, 95% CI) | 0.50 [0.44, 0.56] |
| 15 (Modified) Schober's test (2nd analysis) (cm) Show forest plot | 7 | 536 | Mean Difference (IV, Random, 95% CI) | 0.12 [‐0.21, 0.45] |
| 15.1 Change from baseline | 4 | 330 | Mean Difference (IV, Random, 95% CI) | 0.19 [‐0.35, 0.74] |
| 15.2 End point | 3 | 206 | Mean Difference (IV, Random, 95% CI) | 0.10 [‐0.15, 0.35] |
| 16 Occiput‐to‐wall test (cm) Show forest plot | 5 | 386 | Mean Difference (IV, Random, 95% CI) | 0.08 [‐0.90, 1.06] |
| 16.1 End point | 3 | 306 | Mean Difference (IV, Random, 95% CI) | ‐0.63 [‐1.33, 0.07] |
| 16.2 Change from baseline | 2 | 80 | Mean Difference (IV, Random, 95% CI) | 0.68 [0.31, 1.05] |
| 17 Occiput‐to‐wall test (2nd analysis) (cm) Show forest plot | 5 | 386 | Mean Difference (IV, Random, 95% CI) | ‐0.03 [‐0.84, 0.79] |
| 17.1 Change from baseline | 3 | 283 | Mean Difference (IV, Random, 95% CI) | 0.30 [‐0.43, 1.03] |
| 17.2 End point | 2 | 103 | Mean Difference (IV, Random, 95% CI) | ‐0.75 [‐1.49, ‐0.02] |
| 18 Fingers‐to‐floor test (cm) Show forest plot | 7 | 517 | Mean Difference (IV, Random, 95% CI) | ‐1.03 [‐2.93, 0.87] |
| 18.1 End point | 5 | 437 | Mean Difference (IV, Random, 95% CI) | ‐0.64 [‐2.77, 1.49] |
| 18.2 Change from baseline | 2 | 80 | Mean Difference (IV, Random, 95% CI) | ‐2.54 [‐6.75, 1.67] |
| 19 Fingers‐to‐floor test (2nd analysis) (cm) Show forest plot | 7 | 517 | Mean Difference (IV, Random, 95% CI) | ‐0.71 [‐2.18, 0.75] |
| 19.1 Change from baseline | 3 | 283 | Mean Difference (IV, Random, 95% CI) | ‐0.96 [‐2.79, 0.88] |
| 19.2 End point | 4 | 234 | Mean Difference (IV, Random, 95% CI) | ‐0.28 [‐2.72, 2.15] |
| 20 Chin sternum distance (change from baseline) (cm) Show forest plot | 1 | Mean Difference (IV, Fixed, 95% CI) | Totals not selected | |
| 21 Joint pain/tenderness score (0 to 198, the higher the score the more severe the disease) or number Show forest plot | 2 | 278 | Std. Mean Difference (IV, Random, 95% CI) | ‐0.04 [‐0.37, 0.29] |
| 21.1 End point | 2 | 278 | Std. Mean Difference (IV, Random, 95% CI) | ‐0.04 [‐0.37, 0.29] |
| 22 Joint pain/tenderness score (2nd analysis) (0 to 198, the higher the score the more severe the disease) Show forest plot | 2 | 278 | Std. Mean Difference (IV, Random, 95% CI) | ‐0.15 [‐0.38, 0.09] |
| 22.1 Change from baseline | 1 | 203 | Std. Mean Difference (IV, Random, 95% CI) | ‐0.10 [‐0.38, 0.17] |
| 22.2 End point | 1 | 75 | Std. Mean Difference (IV, Random, 95% CI) | ‐0.26 [‐0.72, 0.19] |
| 23 Joint swelling score (0 to 198, the higher score the more severe the disease) or number Show forest plot | 2 | 278 | Std. Mean Difference (IV, Random, 95% CI) | 0.04 [‐0.20, 0.27] |
| 23.1 End point | 2 | 278 | Std. Mean Difference (IV, Random, 95% CI) | 0.04 [‐0.20, 0.27] |
| 24 Joint swelling score (2nd analysis) (0 to 198, the higher the score the more severe the disease) Show forest plot | 2 | 278 | Mean Difference (IV, Random, 95% CI) | 0.0 [‐0.29, 0.29] |
| 24.1 Change from baseline | 1 | 203 | Mean Difference (IV, Random, 95% CI) | 0.0 [‐0.97, 0.97] |
| 24.2 End point | 1 | 75 | Mean Difference (IV, Random, 95% CI) | 0.0 [‐0.30, 0.30] |
| 25 Dactylitis score (0 to 3, 0 = normal, 3 = severe) Show forest plot | 1 | Mean Difference (IV, Random, 95% CI) | Totals not selected | |
| 26 Dactylitis score (2nd analysis) (0 to 3, 0 = normal, 3 = severe) Show forest plot | 1 | Mean Difference (IV, Random, 95% CI) | Totals not selected | |
| 27 Enthesopathy index (0 to 90, 0 to 66, 0 to 90, the higher the score the more severe the disease) Show forest plot | 3 | 297 | Std. Mean Difference (IV, Random, 95% CI) | 0.10 [‐0.13, 0.33] |
| 27.1 End point | 1 | 203 | Std. Mean Difference (IV, Random, 95% CI) | 0.06 [‐0.22, 0.33] |
| 27.2 Change from baseline | 2 | 94 | Std. Mean Difference (IV, Random, 95% CI) | 0.19 [‐0.29, 0.68] |
| 28 Enthesopathy index (2nd analysis) (0 to 90, 0 to 66, 0 to 90, the higher score the more severe the disease) Show forest plot | 3 | 297 | Std. Mean Difference (IV, Random, 95% CI) | 0.11 [‐0.12, 0.34] |
| 28.1 Change from baseline | 3 | 297 | Std. Mean Difference (IV, Random, 95% CI) | 0.11 [‐0.12, 0.34] |
| 29 Spondylitis articular index (0 to 90, the higher score the more severe the disease) Show forest plot | 1 | Mean Difference (IV, Random, 95% CI) | Totals not selected | |
| 30 Spondylitis articular index (2nd analysis) (0 to 90, the higher score the more severe the disease) Show forest plot | 1 | Mean Difference (IV, Random, 95% CI) | Totals not selected | |
| 31 Improvement in patient global assessment Show forest plot | 3 | 394 | Risk Ratio (IV, Random, 95% CI) | 1.52 [0.78, 2.97] |
| 32 Patient assessment of disease severity (end point) (VAS 100 mm, 0 = very good, 100 = very poor) Show forest plot | 1 | Mean Difference (IV, Fixed, 95% CI) | Totals not selected | |
| 33 General well‐being (end point) (VAS 100 mm, 0 = very good, 100 = very poor) Show forest plot | 1 | Mean Difference (IV, Random, 95% CI) | Totals not selected | |
| 34 Improvement in physician global assessment Show forest plot | 2 | 334 | Risk Ratio (IV, Random, 95% CI) | 1.34 [0.59, 3.08] |
| 35 Response to treatment (based on both patient and physician assessment) Show forest plot | 1 | Risk Ratio (M‐H, Random, 95% CI) | Totals not selected | |
| 36 Duration of morning stiffness (hr) Show forest plot | 5 | 456 | Mean Difference (IV, Random, 95% CI) | ‐0.20 [‐0.39, ‐0.01] |
| 36.1 End point | 4 | 409 | Mean Difference (IV, Random, 95% CI) | ‐0.10 [‐0.25, 0.05] |
| 36.2 Change from baseline | 1 | 47 | Mean Difference (IV, Random, 95% CI) | ‐0.39 [‐0.48, ‐0.30] |
| 37 Duration of morning stiffness (2nd analysis) (hr) Show forest plot | 5 | 456 | Mean Difference (IV, Random, 95% CI) | ‐0.20 [‐0.39, ‐0.00] |
| 37.1 Change from base line | 2 | 250 | Mean Difference (IV, Random, 95% CI) | ‐0.39 [‐0.48, ‐0.30] |
| 37.2 End point | 3 | 206 | Mean Difference (IV, Random, 95% CI) | ‐0.10 [‐0.25, 0.05] |
| 38 Morning stiffness (end point) (VAS 100 mm, 0 = no stiffness, 100 = severe stiffness) Show forest plot | 2 | 108 | Mean Difference (IV, Random, 95% CI) | ‐13.89 [‐22.54, ‐5.24] |
| 38.1 End point | 1 | 75 | Mean Difference (IV, Random, 95% CI) | ‐12.00 [‐23.78, ‐4.22] |
| 38.2 Change from baseline | 1 | 33 | Mean Difference (IV, Random, 95% CI) | ‐13.5 [‐30.00, 5.00] |
| 39 Improvement in morning stiffness Show forest plot | 1 | Risk Ratio (M‐H, Random, 95% CI) | Totals not selected | |
| 40 Erythrocyte sedimentation rate (mm/hr) Show forest plot | 8 | 560 | Mean Difference (IV, Random, 95% CI) | ‐5.66 [‐10.40, ‐0.93] |
| 40.1 End point | 6 | 466 | Mean Difference (IV, Random, 95% CI) | ‐7.07 [‐14.39, 0.25] |
| 40.2 Change from baseline | 2 | 94 | Mean Difference (IV, Random, 95% CI) | ‐3.09 [‐4.84, ‐1.35] |
| 41 Erythrocyte sedimentation rate (2nd analysis) (mm/hr) Show forest plot | 8 | 560 | Mean Difference (IV, Random, 95% CI) | ‐4.79 [‐8.80, ‐0.78] |
| 41.1 Change from baseline | 4 | 326 | Mean Difference (IV, Random, 95% CI) | ‐3.11 [‐4.62, ‐1.60] |
| 41.2 End point | 4 | 234 | Mean Difference (IV, Random, 95% CI) | ‐9.56 [‐22.03, 2.91] |
| 42 C‐reactive protein (ug/ml) Show forest plot | 3 | 325 | Mean Difference (IV, Random, 95% CI) | ‐1.42 [‐3.76, 0.92] |
| 42.1 End pointSub‐category | 2 | 278 | Mean Difference (IV, Random, 95% CI) | ‐1.76 [‐7.42, 3.90] |
| 42.2 Change from baseline | 1 | 47 | Mean Difference (IV, Random, 95% CI) | ‐2.5 [‐4.70, ‐0.30] |
| 43 C‐reactive protein (2nd analysis) (ug/ml) Show forest plot | 3 | 325 | Mean Difference (IV, Random, 95% CI) | ‐1.39 [‐3.85, 1.07] |
| 43.1 Change from baseline | 2 | 250 | Mean Difference (IV, Random, 95% CI) | ‐1.02 [‐3.37, 1.33] |
| 43.2 End point | 1 | 75 | Mean Difference (IV, Random, 95% CI) | ‐7.0 [‐16.80, 2.80] |
| 44 Withdrawal due to side effect Show forest plot | 11 | 895 | Risk Ratio (M‐H, Fixed, 95% CI) | 1.50 [1.04, 2.15] |
| 45 Withdrawal due to ineffectiveness Show forest plot | 10 | 833 | Risk Ratio (M‐H, Fixed, 95% CI) | 0.87 [0.53, 1.42] |
| 46 Drop‐out for any reason Show forest plot | 10 | 833 | Risk Ratio (M‐H, Fixed, 95% CI) | 1.33 [1.03, 1.73] |
| 47 Serious adverse events Show forest plot | 1 | 264 | Peto Odds Ratio (Peto, Fixed, 95% CI) | 7.50 [0.15, 378.16] |
| Outcome or subgroup title | No. of studies | No. of participants | Statistical method | Effect size |
| 1 Back pain (VAS 100 mm, 0 = no pain, 100 = severe pain) Show forest plot | 1 | Mean Difference (IV, Random, 95% CI) | Totals not selected | |
| 2 Score of sleep disturbance (0 to 4, 0 = no disturbance, 4 = severe disturbance) Show forest plot | 1 | Mean Difference (IV, Random, 95% CI) | Totals not selected | |
| 3 Chest expansion (cm) Show forest plot | 1 | Mean Difference (IV, Random, 95% CI) | Totals not selected | |
| 4 Schober's test (cm) Show forest plot | 1 | Mean Difference (IV, Random, 95% CI) | Totals not selected | |
| 5 Fingers‐to‐floor test (cm) Show forest plot | 1 | Mean Difference (IV, Random, 95% CI) | Totals not selected | |
| 6 Articular index (0 to 66, the higher the score the more severe the disease) Show forest plot | 1 | Mean Difference (IV, Random, 95% CI) | Totals not selected | |
| 7 Degree of joint swelling (0 to 66, the higher the score the more severe the disease) Show forest plot | 1 | Mean Difference (IV, Random, 95% CI) | Totals not selected | |
| 8 Patient assessment of disease severity (VAS 100 mm, 0 = very good, 100 = very poor) Show forest plot | 1 | Mean Difference (IV, Random, 95% CI) | Totals not selected | |
| 9 Duration of morning stiffness (hr) Show forest plot | 1 | Mean Difference (IV, Random, 95% CI) | Totals not selected | |
| 10 Erythrocyte sedimentation rate (mm/hr) Show forest plot | 1 | Mean Difference (IV, Random, 95% CI) | Totals not selected | |
| Outcome or subgroup title | No. of studies | No. of participants | Statistical method | Effect size |
| 1 Back pain (VAS 100 mm, 0 = no pain, 100 = severe pain) Show forest plot | 1 | Mean Difference (IV, Random, 95% CI) | Totals not selected | |
| 2 Score of sleep disturbance (0 to 4, 0 = no disturbance, 4 = severe disturbance) Show forest plot | 1 | Mean Difference (IV, Random, 95% CI) | Totals not selected | |
| 3 Chest expansion (cm) Show forest plot | 1 | Mean Difference (IV, Random, 95% CI) | Totals not selected | |
| 4 Schober's test (cm) Show forest plot | 1 | Mean Difference (IV, Random, 95% CI) | Totals not selected | |
| 5 Fingers‐to‐floor test (cm) Show forest plot | 1 | Mean Difference (IV, Random, 95% CI) | Totals not selected | |
| 6 Patient assessment of disease severity (VAS 100 mm, 0 = very good, 100 = very poor) Show forest plot | 1 | Mean Difference (IV, Random, 95% CI) | Totals not selected | |
| 7 Duration of morning stiffness (hr) Show forest plot | 1 | Mean Difference (IV, Random, 95% CI) | Totals not selected | |
| 8 Erythrocyte sedimentation rate (mm/hr) Show forest plot | 1 | Mean Difference (IV, Fixed, 95% CI) | Totals not selected | |