Сульфасалазин при анкилозирующем спондилите (болезни Бехтерева)
Abstract
Background
Ankylosing spondylitis (AS) is a chronic inflammatory disease of unknown cause and affects mainly the spine, but can also affect other joints. Disease progression may result in loss of mobility and function. Sulfasalazine is a disease‐modifying antirheumatic drug used in the treatment of AS. However, its efficacy remains unclear. This is an update of a Cochrane review first published in 2005.
Objectives
To evaluate the benefits and harms of sulfasalazine for the treatment of ankylosing spondylitis (AS).
Search methods
We searched for relevant randomized and quasi‐randomized trials in any language, using the following sources: the Cochrane Central Register of Controlled Trials (CENTRAL) (The Cochrane Library 2013, Issue 11); MEDLINE (2003 to 28 November 2013); EMBASE (2003 to 27 November 2013); CINAHL (2003 to 28 November 2013); Ovid MEDLINE data, World Health Organization International Clinical Trials Registry Platform (28 November 2013); and the reference sections of retrieved articles.
Selection criteria
We evaluated randomized and quasi‐randomized trials examining the benefits and harms of sulfasalazine on AS.
Data collection and analysis
Two review authors independently reviewed unblinded trial reports according to the selection criteria. Disagreements on the inclusion of the studies were resolved, when necessary, by recourse to a third review author. The same authors independently assessed the risk of bias of included trials and entered the data extracted from the included trials. We combined results using mean difference (MD) or standardised mean difference (SMD) for continuous data, and risk ratio (RR) for dichotomous data.
We restructured outcome measures for this update based on recommendations from the editorial group. Major outcomes included: pain, Bath ankylosing spondylitis disease activity index (BASDAI), Bath ankylosing spondylitis function index (BASFI), Bath ankylosing spondylitis metrology index (BASMI), radiographic progression, total number of withdrawals due to adverse events, and serious adverse events.
Main results
We did not add any new studies to this review following the updated search. In the original review, we included 11 studies in the analysis, involving 895 participants in total. All included studies compared sulfasalazine with placebo. We judged most of the studies as low risk of bias or unclear risk of bias in five domains (random sequence generation, allocation concealment, blinding of outcome assessment, selective reporting, and other sources of bias). However, for incomplete outcome data, we only judged one trial at low risk of bias.
None of the included trials assessed BASDAI, BASFI, BASMI or radiographic progression. Different parameters were used to assess pain. The pooled MD for back pain measured on a 0 to 100 mm visual analogue scale was ‐2.96 (95% confidence interval (CI) ‐6.33 to 0.41; absolute risk difference 3%, 95% CI 1% to 6%; 6 trials). Compared to placebo, a significantly higher rate of withdrawals due to adverse effects (RR 1.50, 95% CI 1.04 to 2.15; absolute risk difference 4%, 95% CI 0.4% to 8.8%; 11 trials) was found in the sulfasalazine group. A serious adverse reaction was reported in one patient taking sulfasalazine (Peto odds ratio 7.50, 95% CI 0.15 to 378.16).
Authors' conclusions
There is not enough evidence to support any benefit of sulfasalazine in reducing pain, disease activity, radiographic progression, or improving physical function and spinal mobility in the treatment of AS. A statistically significant benefit in reducing the erythrocyte sedimentation rate and easing spinal stiffness was mentioned in the previous version. However, the effect size was very small and not clinically meaningful. More withdrawals because of side effects occurred with sulfasalazine. Further studies, with larger sample sizes, longer duration, and using validated outcome measures are needed to verify the uncertainty of sulfasalazine in AS.
PICO
Резюме на простом языке
Сульфасалазин при анкилозирующем спондилите (болезни Бехтерева)
Мы провели обзор эффекта сульфасалазина у людей с анкилозирующим спондилитом. После поиска всех соответствующих исследований по ноябрь 2013 года, мы нашли 11 исследований с участием 895 человек. Наши результаты кратко изложены ниже.
Обзор показал, что у людей с анкилозирующим спондилитом:
‐ в сравнении с имитированными таблетками (плацебо), сульфасалазин, вероятно, имеет мало или совсем не имеет различий в боли, активности заболевания, физической функции, подвижности позвоночника, и в глобальной оценке пациентом и врачом;
‐ повреждение позвоночника, видимое на рентгенограмме или на МРТ (магнитно‐резонансной томографии), не оценивали и поэтому не известно, замедляет ли сульфасалазин повреждение;
‐ были побочные эффекты, такие как расстройство желудка, кожные реакции/высыпания и язвы в ротовой полости;
‐ больше людей перестали принимать сульфасалазин из‐за побочных эффектов, чем те, кто принимал имитированные таблетки; и
‐ нет достаточных доказательств, чтобы быть уверенным в пользе и вреде сульфасалазина при анкилозирующем спондилите, и необходимо больше исследований.
Что такое анкилозирующий спондилит, и что такое сульфасалазин?
Анкилозирующий спондилит ‐ это тип артрита, с обычной локализацией в суставах и связках позвоночника. Он может также поражать плечи, бедра или другие суставы. Возникают боль, скованность и ограничение движения в спине и в других пораженных суставах.
Основные результаты этого обзора
Боль
‐ Люди, которые принимали сульфасалазин, оценивали свою боль на 3 деления ниже по шкале от 0 до 100, после 3‐36 месяцев, чем те, кто принимали плацебо (3% абсолютное улучшение).
‐ Люди, которые принимали сульфасалазин, оценивали свою боль на 47 по шкале от 0 до 100, после 3‐36 месяцев.
‐ Люди, которые принимали плацебо, оценивали свою боль на 50 по шкале от 0 до 100, после 3‐36 месяцев.
Индекс активности заболевания анкилозирующим спондилитом (ИАЗАС; BASDAI)
Этот исход не был измерен в этих исследованиях.
Индекс функции (функциональных нарушений) при анкилозирующем спондилите (ИФАС; BASFI)
Этот исход не был измерен в этих исследованиях.
Метрологический индекс анкилозирующего спондилита (МИАС; BASMI)
Этот исход не был измерен в этих исследованиях.
Рентгенологическое прогрессирование
Этот исход не был измерен в этих исследованиях.
Общее число выбывших из‐за неблагоприятных событий
‐ на 23 человека больше из тех, кто принимал сульфасалазин, выбыло из‐за неблагоприятных событий, чем тех, кто принимал плацебо.
‐ 13 из 100 людей, принимающих сульфасалазин, выбыло из‐за неблагоприятных событий.
‐ 9 из 100 человек, принимавших имитированные таблетки (плацебо), выбыло из‐за неблагоприятных событий.
Серьезные неблагоприятные (нежелательные) события
Только один человек из 469 перестал принимать сульфасалазин из‐за серьезных неблагоприятных событий.
Authors' conclusions
Summary of findings
| Sulfasalazine compared to placebo for ankylosing spondylitis | ||||||
| Patient or population: Patients with ankylosing spondylitis | ||||||
| Outcomes | Illustrative comparative risks* (95% CI) | Relative effect | No of Participants | Quality of the evidence | Comments | |
| Assumed risk | Corresponding risk | |||||
| Placebo | Sulfasalazine | |||||
| Back pain (pooled data) | The mean back pain (pooled data) in the control groups was | The mean back pain (pooled data) in the intervention groups was | 454 | ⊕⊕⊕⊝ | Absolute risk difference 3% lower (95% CI 1% to 6%); Relative percent change = 6% (95% CI 2% to 12%); NNT4 = n/a5 | |
| Mean improvement in Bath ankylosing spondylitis disease activity index (BASDAI) ‐ not reported | See comment | See comment | Not estimable | No data | See comment | Not measured |
| Mean improvement in Bath ankylosing spondylitis function index (BASFI) ‐ not reported | See comment | See comment | Not estimable | No data | See comment | Not measured |
| Mean improvement in Bath ankylosing spondylitis metrology index (BASMI) ‐ not reported | See comment | See comment | Not estimable | No data | See comment | Not measured |
| Radiographic progress ‐ not reported | See comment | See comment | Not estimable | No data | See comment | Not measured |
| Total number of withdrawals due to adverse events | 94 per 1000 | 134 per 1000 | RR 1.43 | 895 | ⊕⊕⊕⊝ | Absolute risk difference 4% (95% CI 0.4% to 8.8%); NNTH6 = 25 (95% CI 266 to 12) |
| Serious adverse events | 0 per 1000 | 1 per 1000 | OR 7.5 | 264 | ⊕⊕⊕⊝ | Absolute risk difference 750% (95% CI 15% to 37816%) (W); Relative percent change = 205% (95% CI ‐87% to 7309%); NNTH = n/a |
| *The basis for the assumed risk (e.g. the median control group risk across studies) is provided in footnotes. The corresponding risk (and its 95% confidence interval) is based on the assumed risk in the comparison group and the relative effect of the intervention (and its 95% CI). | ||||||
| GRADE Working Group grades of evidence | ||||||
| 1 From Clegg 1996, mean back pain at baseline in placebo = 48.9 (95% CI 3.0 to 94.8). 4 NNT (Number needed to treat). NNT for dichotomous outcomes calculated using Cates NNT calculator (http://www.nntonline.net/visualrx/). 5 n/a means result is not statistically significant. 6NNTH (Number needed to treat to harm). | ||||||
Background
Description of the condition
Ankylosing spondylitis (AS) is a chronic inflammatory disease of unknown cause and belongs to a group of diseases known as spondyloarthropathies, which includes reactive arthritis, arthritis/spondylitis in inflammatory bowel disease, psoriatic arthritis/spondylitis and undifferentiated spondyloarthropathy. The disease has a relatively early onset, presenting at a mean age of 26 years, and occurs somewhat more frequently in men than in women (Feldtkeller 2003). Depending on the geographical region, the prevalence of AS is about 0.1% to 1.4% of the population (Akkoc 2005). Disease progression may result in loss of mobility and function, and therefore patients can experience a heavy disease burden, with pain and stiffness, loss of physical function, and severe impairment in quality of life (Davis 2005; Zink 2000).
Description of the intervention
Physiotherapy and exercises are the main non‐pharmacological therapies, with modest evidence showing a beneficial effect for AS (Dagfinrud 2008). Non‐steroidal anti‐inflammatory drugs (NSAIDs) have been the corner stone of pharmacological treatment. In 2010, the Assessment of Ankylosing Spondylitis/European League Against Rheumatism suggested that NSAIDs, including Coxibs, were recommended as first‐line drug treatment for AS patients with pain and stiffness. Continuous treatment with NSAIDs is preferred for patients with persistently active, symptomatic disease (Braun 2011a). For patients refractory or intolerant to NSAIDs, disease‐modifying antirheumatic drugs such as methotrexate (Chen 2013) and sulfasalazine have been used as a second‐line approach. Sulfasalazine has been used in rheumatoid arthritis for decades and a clinically and statistically significant benefit in rheumatoid arthritis disease activity has been confirmed in a systematic review (Suarez‐Almazor 1998). It is the best studied disease‐modifying antirheumatic drug used in AS, but its efficacy remains unclear. Although AS is difficult to treat, the treatment options for AS have been broadened since the discovery of TNF‐alpha inhibitors, e.g. adalimumab, etanercept, and infliximab. TNF‐alpha inhibitors have been extensively studied in AS (Zochling 2005). Randomized controlled trials (RCTs) (Braun 2002; Gorman 2002; van den Bosch 2002) showed that they were highly effective in improving disease activity, spinal mobility, function, and pain. However, their expense means that few patients can access them.
How the intervention might work
Sulfasalazine has been described as an anti‐inflammatory drug or immunomodulator (Smedegård 1995). We hypothesized that sulfasalazine had a similar effect on AS. However, the accurate mechanisms of sulfasalazine in AS were unclear.
Why it is important to do this review
There is uncertainty whether sulfasalazine is an effective treatment for AS. We first performed a systematic review in Chen 2005, and this is an update of that original review.
Objectives
To evaluate the benefits and harms of sulfasalazine for the treatment of ankylosing spondylitis (AS).
Methods
Criteria for considering studies for this review
Types of studies
We evaluated randomized controlled trials (RCTs) and quasi‐RCTs in any language, examining the benefits and harms of sulfasalazine on ankylosing spondylitis (AS).
Types of participants
Patients with AS fulfilling any one of the following criteria: 1961 Rome, 1966 New York, modified 1984 New York, Amor or ESSG (European Spondyloarthropathy Study Group) criteria (Olivieri 2002). We included studies with spondyloarthropathies/spondyloarthritis participants if there were available data assessing the outcomes specific to patients with AS. Patients with or without the impairment of peripheral joints were eligible for inclusion.
Types of interventions
Sulfasalazine given orally for at least 12 weeks. We included the following comparisons.
-
Sulfasalazine versus placebo.
-
Sulfasalazine versus other medication.
-
Sulfasalazine versus no medication.
Types of outcome measures
Primary outcomes
According to the Cochrane Musculoskeletal Group (CMSG), the major outcomes included the following.
-
Pain (visual analogue scale or numerical rating scale).
-
Bath ankylosing spondylitis disease activity index (BASDAI).
-
Bath ankylosing spondylitis function index (BASFI).
-
Bath ankylosing spondylitis metrology index (BASMI).
-
Radiographic progression.
-
Total number of withdrawals due to adverse events.
-
Serious adverse events.
Secondary outcomes
-
Assessment of Ankylosing Spondylitis responses (e.g. ASAS40, ASAS20, partial remission) (van der Heijde 2002; van der Heijde 2005).
-
Other disease activity index, e.g. Ankylosing Spondylitis Disease Activity Score.
-
Physical function.
-
Spinal mobility and spinal stiffness.
-
Peripheral joints/entheses (pain, swelling and tenderness).
-
Patient global assessment and physician global assessment.
-
Fatigue.
-
Level of acute phase reactants, including erythrocyte sedimentation rate and C‐reactive protein.
-
Total number of withdrawals.
Search methods for identification of studies
We searched for relevant randomized controlled trials (RCTs) and quasi‐RCTs in any language, using the following sources: the Cochrane Central Register of Controlled Trials (CENTRAL) (The Cochrane Library 2013, Issue 11); MEDLINE (2003 to 28 November 2013); EMBASE (2003 to 28 November 2013); CINAHL (2003 to 28 November 2013); Ovid MEDLINE data; World Health Organization International Clinical Trials Registry Platform (28 November 2013); and the reference sections of retrieved articles. Search strategies for the original review are in Appendix 1. Search strategies for the second (current) review are in Appendix 2 and Appendix 2. Search results for the second (current) version are in Appendix 4 and Appendix 3.
Data collection and analysis
Selection of studies
We identified potential trials for inclusion from the search results (see Figure 1). JC and SL independently reviewed unblinded trial reports for this review update (JC and CL for the original review) according to the selection criteria. We resolved disagreements about the inclusion of studies, when necessary, by recourse to a third review author.
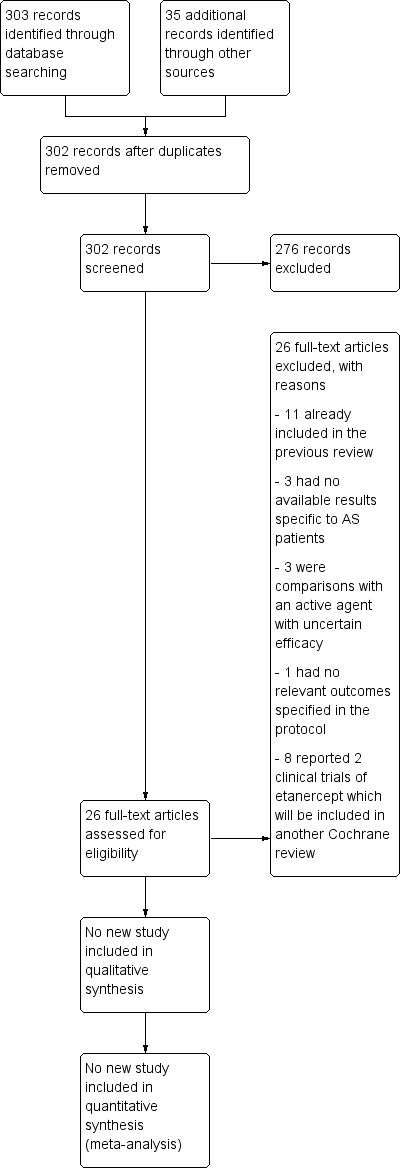
Study flow diagram.
Data extraction and management
JC and SL recorded the extracted data from the included trials onto a prestructured data extraction sheet and entered the data independently into Review Manager 5 (RevMan 2014). We only included outcomes in the review that were specified in the protocol. We entered continuous data (e.g. visual analogue scales of pain, patient's global assessment) as means and standard deviations (SDs), and dichotomous outcomes (e.g. response, improvement) as number of events.
Assessment of risk of bias in included studies
For this review, we assessed risk of bias in all included studies using The Cochrane Collaboration's tool for assessing risk of bias (Higgins 2011). There were six domains: random sequence generation, allocation concealment, blinding of outcome assessment, incomplete outcome data, selective reporting, and other sources of bias, as specified in Appendix 4. We categorized risk of bias as 'Low risk', 'High risk', or 'Unclear risk'. We independently addressed the included trials using a data collection form (Appendix 5).
Measures of treatment effect
For continuous data, we used mean difference (MD) or standardised mean difference (SMD) (depending on comparability of scales). For dichotomous data, we used risk ratio (RR).
Unit of analysis issues
In this review we included only RCTs and there were no unit of analysis issues.
Dealing with missing data
For continuous data (e.g. visual analogue scales of pain, patient global assessment), we analyzed only the available data. For dichotomous data of beneficial outcomes (e.g. response, improvement), we used intention‐to‐treat analysis, that is, we included all participants and assumed no expected event occurred in those participants who dropped out.
Assessment of heterogeneity
We explored heterogeneity using the Chi2 test, with significance set at P = 0.10. We measured heterogeneity using I2. We regarded I2≥ 50% as substantial heterogeneity.
Assessment of reporting biases
We planned using a funnel plot to detect publication bias.
Data synthesis
We performed meta‐analysis when the participants and interventions were sufficiently homogeneous, using Review Manager 5 (RevMan 2014). We used a random‐effects model to combine the results where heterogeneity was significant; otherwise, we used a fixed‐effect model.
Subgroup analysis and investigation of heterogeneity
We planned on conducting subgroup analyses based on characteristics of participants (e.g. different AS classification criteria, male or female, with or without peripheral arthritis) and intervention (e.g. different dosage, different duration).
Sensitivity analysis
We performed three sensitivity analyses according to whether:
-
the allocation to intervention or control groups was truly randomized or quasi‐randomized (in order to explore the potential for selection bias); and
-
the outcome assessment was blinded (to explore the potential for assessment bias associated with knowledge of the intervention).
If either of the sensitivity analyses affected the results of the review then we would make conservative conclusions.
Summary of findings tables
We graded the evidence using GRADEpro software which was developed by the Grading of Recommendations, Assessment, Development and Evaluation (GRADE) Working Group (www.gradeworkinggroup.org). We included the seven main outcomes (back pain, bath ankylosing spondylitis disease activity index (BASDAI), bath ankylosing spondylitis function index (BASFI), bath ankylosing spondylitis metrology index (BASMI), radiographic progress, total number of withdrawals due to adverse events, and serious adverse events) in summary of findings Table for the main comparison.
Results
Description of studies
Results of the search
We obtained a total of 302 records in the updated search (Figure 1). In the preliminary screening of titles and abstracts, we excluded 276 records. After full‐text assessment, we found 11 records that had already been included in the first version of the review (Clegg 1996; Corkill 1990; Davis 1989; Dougados 1986; Feltelius 1986; Kirwan 1993; Krajnc 1990; Nissila 1988; Schmidt 2002; Taylor 1991; Winkler 1989). We excluded 15 records (nine studies; Braun 2011 included seven records) for the reasons specified in the Characteristics of excluded studies tables. Therefore, we did not add any new studies to this update.
Included studies
We included eleven studies and all of these trials compared sulfasalazine with placebo. They included a total of 895 participants, 469 receiving sulfasalazine and 426 placebo. The sample size ranged from 30 to 264. The duration of treatment ranged from 12 weeks to three years. The dosage of sulfasalazine (or placebo) was 2.0 g/day or up to 3.0 g/day, depending on the efficacy and tolerance. More than 30 outcomes were assessed.
Among the included participants, about 86% were male; Taylor 1991 did not present the information on the sex distribution of participants. Depending on the trial, age and duration of disease was reported as a mean or median value. The age ranged from 26.9 to 45.7 and the duration of disease ranged from 3.8 to 21.9 years. Zero to 68% of participants had peripheral arthritis. All studies claimed that they included participants with active disease, but the definitions of active disease varied. Further details are available in the Characteristics of included studies tables.
Excluded studies
Braun 2006 and Song 2011 are two trials concerning undifferentiated spondyloarthritis and early AS. We excluded them because the data specific to AS patients were unavailable. Three studies were RCTs comparing sulfasalazine with another active agent. These agents were Kunxian capsule (Chinese traditional medicine) (NCT00953979), Bushen Tongdu decoction (Chinese traditional medicine) (Xu 2008), and leflunomide (Zhao 2006). Because the efficacy of these agents was uncertain in AS and comparisons with them did not contribute to understanding the benefits of sulfasalazine, we excluded these three trials. We excluded one study, Deng 2009, because of lack of relevant outcomes specified in the protocol. Braun 2011 and Zhao 2009 were two RCTs comparing etanercept with sulfasalazine. We excluded them because there is another separate Cochrane review addressing biologics in AS (Zochling 2005).
Risk of bias in included studies
The risk of bias of included trials varied greatly and is summarized in Figure 2 and Figure 3.

Risk of bias graph: review authors' judgments about each risk of bias item presented as percentages across all included studies.

Risk of bias summary: review authors' judgments about each risk of bias item for each included study.
Allocation
Seven trials (Clegg 1996; Davis 1989; Feltelius 1986; Krajnc 1990; Nissila 1988; Schmidt 2002; Winkler 1989), were reported as randomized, but details of the methods of randomisation and concealment were not given. Four trials (Corkill 1990; Dougados 1986; Kirwan 1993; Taylor 1991), were reported as double‐blind and randomized. The methods of randomisation were generated by sealed envelopes or random number table. Concealment seemed to be adequate in Dougados 1986, Kirwan 1993 and Taylor 1991.
Blinding
We judged blinding at high risk of bias in Corkill 1990, as blinding was broken during the trial. We judged two trials at unclear risk of bias (Schmidt 2002; Winkler 1989). We judged all other trials at low risk of bias.
Incomplete outcome data
One trial presented complete outcome data (Clegg 1996). Four studies had more than 20% (Dougados 1986; Feltelius 1986; Kirwan 1993; Schmidt 2002), and two had more than 30% of participants drop out (Kirwan 1993; Schmidt 2002). Continuous outcome results were missed in these trials and therefore we judged them at high risk of bias. We judged all other trials at unclear risk of bias.
Selective reporting
Two trials were unable to provide the data of all the outcomes prespecified and we judged them at high risk of bias (Kirwan 1993; Taylor 1991). We judged all other trials at low risk of bias.
Other potential sources of bias
All the included trials appeared to be free of other sources of bias and therefore we judged them at low risk of bias.
Effects of interventions
Because of multiple sources of heterogeneity, we could not perform meta‐analyses in all outcomes. Instead, we presented a narrative summary of pertinent findings from the individual studies. The main reported findings for the individual trials are also summarised in Additional Table 1 and Table 2.
| Study | Methodological quality | Duration/sample size | Disease duration | Peripheral arthritis | Baseline ESR | Intervention | Main results | Drop‐out |
| Mutlicenter RCT Concealment: unclear risk Assessment: blind | 36 weeks/264 | 18.5+/‐11.6 | 29% | SSZ: 24.6+/‐18.0 Placebo: 25.2+/‐22.0 | SSZ (or placebo) 2.0 g/d | ESR declined more with SSZ than with placebo (P < 0.0001). When comparing SSZ responders with non‐responders, the former had a greater decrease in ESR (P < 0.04) Patients with peripheral arthritis showed improvement that favored SSZ (P < 0.02) No significant difference in other parameters. One patient taking SSZ had severe adverse drug reaction | 19.3% | |
| RCT Concealment: unclear risk Assessment: blind | 48 weeks/62 | SSZ: 12.3+/‐8.2 Placebo: 16.1+/‐11.4 | 19% | SSZ: 15+/‐16 Placebo: 24+/‐26 | SSZ (or placebo) 2.0 g/d | No significant difference between intervention groups | No data | |
| RCT Concealment: unclear Risk assessment: blind | 3 months/30 | Median SSZ: 8.6 Placebo: 8.4 | 23% | SSZ: 24+/‐7.8(95% confidence limits) Placebo: 26.4+/‐8.6 | SSZ (or placebo) 2.0 g/d | Claimed effective on the basis of before‐after comparison | 6.7% | |
| RCT Concealment: low risk Assessment: blind | 6 months/60 | Median 10 | 0% | SSZ: 13.5(median) Placebo: 11.0 | SSZ (or placebo) 2.0 g/d | Success in patient assessment was more in SSZ than in placebo group. Function index and NSAIDs dosage were significantly improved in SSZ compared with placebo group. No difference was found in other parameters | 21.7% | |
| RCT Concealment: unclear risk Assessment: blind | 12 weeks/37 | Median SSZ: 12.1 Placebo: 10.4 | 5% | SSZ: 24.3+/‐17.4 Placebo: 28.5+/‐19.5 | SSZ (or placebo) up to 3.0 g/d | Only graphs (no figures) were presented. Compared with placebo group, morning stiffness and sleep disturbance were significantly improved in SSZ group Analysis of SSZ group showed that the greatest improvement were those with ESR > 20 mm/hr or haptoglobin > 3.8 g/L | 21.6% | |
| RCT Concealment: low risk Assessment: blind | 3 years/89 | SSZ: 19+/‐12 Placebo: 21.9+/‐11.7 | 28% | No data | SSZ (or placebo) 2.0 g/d | Occurence of peripheral joint symptoms was lower in SSZ group: SSZ: 0.298 episodes/yr Placebo: 0.392 episodes/yr, P < 0.05 No difference was found in Schober test, chest expansion and cervical spine lateral flexion. More drop‐outs in SSZ group | 30.3% | |
| RCT Concealment: unclear risk Assessment: blind | 24 weeks/95 SSZ = 71 Placebo = 24 | No data | 66% | SSZ: 41+/‐19 Placebo: 43+/‐18 | SSZ (or placebo) up to 3.0 g/d | On the basis of before‐after treatment comparison, duration of morning stiffness, number of painful and swollen joints, and ESR, there was significant improvement in SSZ group Duration of morning stiffness and ESR value were given in the paper and we found no significant difference between the intervention groups | 14.3% | |
| RCT Concealment: unclear risk Assessment: blind | 26 weeks/85 | SSZ: 5.4+/‐7.3 Placebo: 3.8+/‐4.3 | 68% | SSZ: 42+/‐20 Placebo: 46+/‐19 | SSZ (or placebo) up to 3.0 g/d | Significant differences between intervention groups were observed in severity of morning stiffness, chest expansion and ESR. We also found severity of pain significantly improved in SSZ, compared with placebo group | 12.2% | |
| RCT Concealment: unclear risk Assessment: blind? | 26 weeks/70 | SSZ: 16.7+/‐7.2 Placebo: 16.3+/‐7.8 | 36% | SSZ: 23.1+/‐3.2 Placebo 20.4+/‐2.4 | SSZ (or placebo) 3.0 g/d | No significant difference was found between intervention groups except IgA. There were more drop‐outs in SSZ than in placebo group (18/34 versus 7/36) | 32.9% | |
| RCT Concealment: low risk Assessment: blind | 1 year/40 | SSZ: 11+/‐1.6 Placebo: 10.7+/‐1.6 | 15% | SSZ: 27 Placebo: 25 | SSZ (or placebo) 2.0 g/d | No significant difference was found between intervention groups in all parameters except pain (measured with visual analogue scale). However, the pooled result showed no statistically significant, too | 17.5% | |
| RCT Concealment: unclear risk Assessment: blind? | 24 weeks/63 | Median SSZ: 10.8 Placebo: 11.2 | 33% | SSZ: 33.4+/‐20.4 Placebo: 26.9+/‐16.4 | SSZ (or placebo) 2.0 g/d | The advantage of SSZ over placebo were significant only in the duration of morning stiffness and disturbance of sleep. The same results were found in the patients with axial form (N = 34). In patients with peripheral arthritis (N = 15), articular index showed significant improvement in SSZ over placebo | 22.2% |
ESR ‐ erythrocyte sedimentation rate
g/d ‐ grams per day
Ig A ‐ immunoglobulin A
NSAIDs ‐ non‐steroidal anti‐inflammatory drugs
RCT ‐ randomized controlled trials
SSZ ‐ sulfasalazine
| Study and Duration | Participants | Outcomes assessed | Results reported | Present analysis | ESR results | Spinal stiffness |
| Clegg 1996, 36 weeks | 264 (SSZ: 31) (Placebo: 133) 29% with PA DD (year): 18.5±11.6 ESR (mm/h): 26.4±18.0 (SSZ) 25.2±22.0 (placebo) | Primary outcomes included response to treatment, improvement in PhGA, PGA, back pain and morning stiffness. Secondary outcomes included night pain (event), duration of morning stiffness, back pain VAS, spondylitis function index, joint/tenderness score, joint swelling score, dactylitis score, enthesopathy index, spondylitis articular index, chest expansion, Schober's test, occiput‐to‐wall test, fingers‐to‐floor test, ESR and CRP | Drop‐out: 19.3%. Both end point value and change from baseline were presented for all continuous outcomes. No difference was found between treatment groups in all outcomes except ESR, which declined more with SSZ than placebo group (P < 0.0001). When comparing SSZ responders with non‐responders, the former had a greater decrease in ESR (P < 0.04). Subgroup analysis showed that in patients with PA, 55.9% of SSZ group and 30.2% of placebo group got peripheral response (P = 0.023) | All the results reported have been confirmed except subgroup analysis where no information about treatment allocation was available for analysis. MD for ESR (change from baseline) was ‐3.10 mm/h, 95% CI ‐4.85 to ‐1.35 mm/h, favoring SSZ group | Absolute benefit from SSZ: ‐3.6 mm/h Relative difference in change from baseline: ‐14% | Did not report |
| Corkill 1990, 48 weeks | 62 (SSZ: 32) (Placebo: 30) 19% with PA DD (year): 12.3±8.2 (SSZ) 16.1±11.4 (placebo) ESR (mm/h): 15±16 (SSZ) 24±26 (placebo) | Spinal pain VAS, spinal stiffness VAS, peripheral joint pain VAS, Schober's test, chest expansion, cervical flexion, cervical rotation, and ESR | Drop‐out: 1.6%. No significant difference was found between treatment groups | Because SDs were not given for all outcomes, these results could not be analyzed | Absolute benefit from SSZ: ‐0.1 mm/h Relative difference in change from baseline: ‐1% | Absolute benefit from SSZ: ‐9.8 mm on 100 mm VAS Relative difference in change from baseline: ‐25% |
| Davis 1989, 3 months | 30 (SSZ: 15) (Placebo: 15) 23% with PA DD (year): 8.6 (SSZ) 8.4 (placebo) ESR (mm/h): 24±7.8 (SSZ) 26.4±8.6 (placebo) | Pain VAS, spinal stiffness VAS, sleep disturbance (event), occiput‐to‐wall test, fingers‐to‐floor test, ESR and CRP | Drop‐out: 6.7%. In SSZ group, all clinical outcomes showed significantly improved when initial and 3 months results are compared | Pain VAS, spinal stiffness VAS and CRP could not be analyzed because means and SDs were not given. No significant difference was found in any other outcome | Absolute benefit from SSZ: ‐5.4 mm/h Relatiive difference in change from baseline: ‐20% | Absolute benefit from SSZ: ‐20 mm on 100 mm VAS Relative difference in change from baseline: ‐40% |
| Dougados 1986, 6 months | 60 (SSZ: 30) (Placebo: 30) None with PA DD (year, median): 10 ESR (mm/h, median): 13.5 (SSZ) 11.0 (placebo) | PGA, score of daily NSAIDs, pain VAS, joint index, frequency of nocturnal awakening, function index, Schober's test, fingers‐to‐floor test, chest expansion and ESR | Drop‐out: 21.7%. Success in PGA was more in SSZ than in placebo group (15/30 vs 6/30, P < 0.05). SSZ resulted in a significant reduction in score of daily NSAIDs (P < 0.05) and significant improvement of function index (P was not given) compared with placebo. No significant difference was found in other outcomes | All continuous outcomes were presented as median and 95% CI. For RevMan analysis, we assumed that mean is equal to median for each outcome and calculated SD from 95% CI and sample size. Success in PGA was more in SSZ than in placebo group (RR 2.5, 95% CI 1.12 to 5.56). No significant difference was found between treatment groups in other outcomes | Absolute benefit from SSZ: 0 mm/h | Did not report |
| Feltelius 1986, 12 weeks | 37 (SSZ:18) (Placebo: 19) 5% with PA DD (year, median): 12.1 (SSZ) 10.4 (placebo) ESR (mm/h): 24.3±17.4 (SSZ) 28.5±19.5 (placebo) | Duration of morning stiffness, spinal stiffness VAS, pain VAS, general wellbeing VAS, chest expansion, Schober's test, sleep disturbance (event), sacroiliac pain VAS, ESR | Drop‐out: 21.6%. Spinal stiffness VAS, chest expansion and sleep disturbance were significantly improved in SSZ compared with placebo group | All outcomes were presented as graphs and no data were available for analysis except ESR that showed no significant difference between treatment groups | Absolute benefit from SSZ: 1.3 mm/h Relative difference in change from baseline: 5% | Did not report |
| Kirwan 1993, 3 years | 89 (SSZ: 44) (Placebo: 45) 28% with PA DD (year): 19±12 (SSZ) 21.9±11.7 (placebo) ESR not given | Primary outcomes included Schober's test, chest expansion, and lateral cervical flexion. Secondary outcomes included function (HAQ), back pain VAS, consumption of anti‐inflammatory drugs, sleep disturbance VAS, PGA, episodes of peripheral arthritis, episodes of heel pain, flares in general AS symptoms, episodes of arthritis | Drop‐out: 30.3%. No significant difference was found between treatment groups in all outcomes except occurrence of peripheral joint symptoms. The episodes of PA were 0.289 episodes/year in SSZ and 0.392 episodes/year in placebo group, respectively (P < 0.05) | There were significantly more drop‐outs for any reason in SSZ than in placebo group. RR was 2.43 (95% CI 1.19 to 4.96). No data were available for analysis in any other outcome | Did not report | Did not report |
| Krajnc 1990, 24 weeks | 95 (SSZ: 71) (Placebo: 24) 66% with PA DD not given ESR (mm/h): 41±19 (SSZ) 43±18 (placebo) | Duration of morning stiffness, Schober's test, chest expansion, fingers‐to‐floor test, number of painful/swollen joints and ESR | Drop‐out: 14.3%. In SSZ group, duration of morning stiffness, chest expansion, number of painful/swollen joints and ESR showed significantly improved when initial and 24 weeks results are compared | No significant difference was found between treatment groups in all outcomes except ESR (MD ‐17.00 mm/h, 95% CI ‐26.99 to ‐7.01mm/h, favoring SSZ) | Absolute benefit from SSZ: 15 mm/h Relatiive difference in change from baseline: ‐35% | Absoluete benefit from SSZ: ‐4 mm on 100 mm VAS Relative difference in change from baseline: ‐8% |
| Nissila 1988, 26 weeks | 85 (SSZ: 43 (Placebo: 42) 68% with PA DD (year): 5.4±7.3 (SSZ) 3.8±4.3 (placebo) ESR (mm/h): 42±20 (SSZ) 46±19 (placebo) | Duration of morning stiffness, spinal stiffness VAS, chest expansion, Schober's test, fingers‐to‐floor test, occiput‐to‐wall test, number of painful joints, number of swollen joints, general wellbeing VAS, ESR and CRP | Drop‐out: 12.2%. Significant differences between treatment groups were found in morning stiffness VAS (P = 0.02), chest expansion (P = 0.03) and ESR (P = 0.02), favoring SSZ. No significant difference was found in other outcomes. Note: we suspected that results of chest expansion were errors because they were impossible to be about 40 to 50 cm. So we divided them by 10 for analysis | Significant differences were found in morning stiffness VAS 100 mm (0 = no stiffness, 100 = severe, MD ‐14.00, 95% CI ‐23.78 to ‐4.22), chest expansion (MD 1.00 cm, 95% CI 0.10 to 1.90 cm), occiput‐to‐wall test (MD ‐0.80 cm, 95% CI ‐1.55 to 0.05 cm), ESR (MD ‐19.00 mm/h, 95% CI ‐29.65 to ‐8.35 mm/h), and general wellbeing VAS 100 mm (0 = the best, 100 = the worst, MD ‐11.00, 95% CI ‐19.84 to ‐2.16), favoring SSZ. No significant difference was found in other outcomes | Absolute benefit from SSZ: ‐15 mm/h Relatiive difference in change from baseline: ‐33% | Absolute benefit from SSZ: ‐6 mm on 100 mm VAS Relative difference in change from baseline: ‐15% |
| Schmidt 2002, 26 weeks | 70 (SSZ: 34) (Placebo: 36) 36% with PA DD (year): 16.7±7.2 (SSZ) 16.3±7.8 (placebo) ESR (mm/h): 23.1±3.2 (SSZ) 20.4±2.4 (placebo) | Back pain VAS, nocturnal awakening (event), pain/tenderness score, duration of morning stiffness, number of painful joints, number of swollen joints, spondylitis function index, PGA, PhGA, Schober's test, fingers‐to‐floor test, chin sternum distance, chest expansion, ESR and CRP | Drop‐out: 36%. No significant difference was reported between treatment groups. There were more drop‐outs in SSZ than in placebo (38% vs 11%) | All continuous outcomes were analyzed as change from baseline. Significant differences were found between treatment groups in back pain VAS 100 mm (0 = no pain, 100 = severe pain, MD ‐2.30, 95% CI ‐4.44 to ‐0.16), chest expansion (MD 0.30 cm, 95% CI 0.16 to 0.44 cm), Schober's test (MD 0.50 cm, 95 CI 0.44 to 0.56 cm), duration of morning stiffness (MD ‐0.39 h, 95% CI ‐0.48 to ‐0.30 h), ESR (MD ‐3.10 mm/h, 95% CI ‐4.85 to ‐1.35 mm/h) and CRP (MD ‐2.50 µg/ml, 95% CI ‐4.70 to ‐0.30 µg/ml), favoring SSZ group. But in occiput‐to‐wall test, the difference (MD 0.70 cm, 95% CI 0.32 to 1.08 cm) favored placebo over SSZ. No significant difference was found in other outcomes. There were significantly more withdrawals for side effects and drop‐outs for any reason in SSZ than in placebo group. RRs were 3.44 (95% CI 1.24 to 9.52) and 2.42 (95% CI 1.14 to 5.15), respectively | Absolute benefit from SSZ: ‐3.1 mm/h Relatiive difference in change from baseline: ‐15% | Did not report |
| Taylor 1991, 1 year | 40 (SSZ: 20) (Placebo: 20) 15% with PA DD (year): 11±1.6 (SSZ) 10.7±1.6 (placebo) ESR (mm/h, mean): 27 (SSZ) 25 (placebo) | Back pain VAS, fingers‐to‐floor test, chest expansion, sleep disturbance (event), forced vital volume, occiput‐to‐wall test, Schober's test, spinal stiffness VAS, reduction or stop of NSAIDs (event) | Drop‐out: 17.5%. No significant difference was found between treatment groups in all outcomes except pain VAS (P < 0.05, favoring SSZ) | No significant difference was found between treatment groups in all outcomes including pain VAS | Did not report | Absolute benefit from SSZ: ‐13.5 mm on 100 mm VAS Relative difference in change from baseline: ‐42% |
| Winkler 1989, 24 weeks | 63 (SSZ: 31) (Placebo: 32) 33% with PA DD (year, median): 10.8 (SSZ) 11.2 (placebo) ESR (mm/h): 33.4±20.4 (SSZ) 26.9±16.4 (placebo) | ESR, duration of morning stiffness, back pain VAS, score of sleep disturbance, chest expansion, Schober's test, fingers‐to‐floor test, disease severity in PGA | Drop‐out: 22.2%. The advantage of SSZ over placebo was significant only in the duration of morning stiffness (P < 0.05) and score of sleep disturbance (P< 0.05). In subgroup analysis, the same results were found in patients with axial form (N = 34). In patients with peripheral arthritis (N = 15), articular index showed significant improvement in SSZ over placebo (P < 0.05) | No significant difference was found between treatment groups in all outcomes. In subgroup analysis of patients with axial form, we found significant difference favoring SSZ over placebo in back pain VAS 100 mm (0 = no pain, 100 = severe pain). MD was ‐9.20 and 95% CI ‐17.81 to 0.59 | Absolute benefit from SSZ: ‐2.7 mm/h Relatiive difference in change from baseline: ‐10% | Did not report |
CI ‐ confidence interval
CRP ‐ C‐reactive protein
DD ‐ duration of disease
ESR ‐ erythrocyte sedimentation rate
HAQ ‐ health assessment questionnaire
MD ‐ mean difference
mm/hr ‐ millimetre per hour
NSAIDs ‐ non‐steroidal anti‐inflammatory drugs
PA ‐ peripheral arthritis
PGA ‐ patient global assessment
PhGA ‐ physician global assessment
RR ‐ relative risk
SD ‐ standard deviation
SSZ ‐ sulphasalazine
VAS ‐ visual analogue scale
Primary outcomes
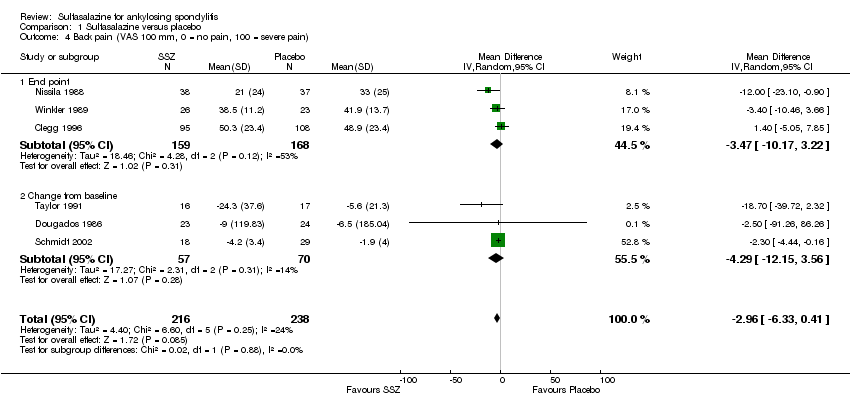
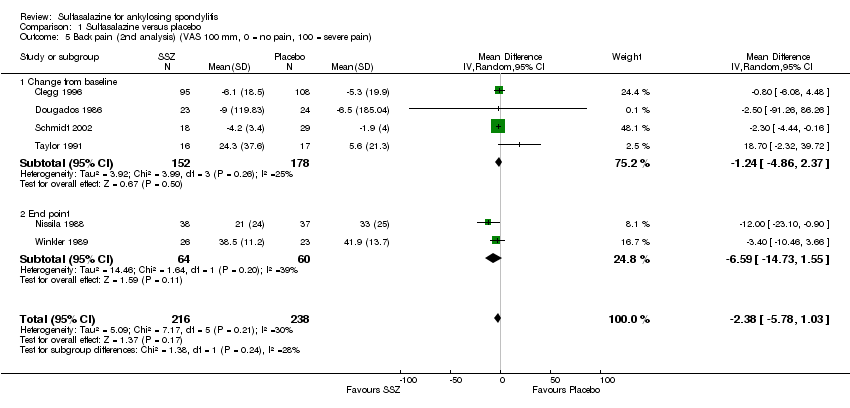
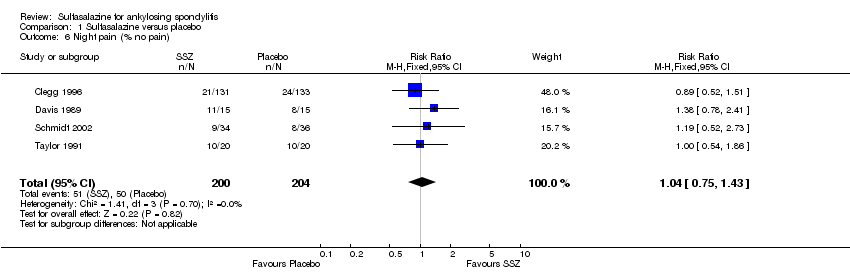
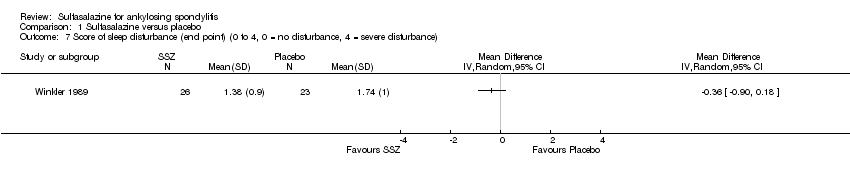
Different parameters were used to assess pain in the included trials. They included improvement in back pain (Analysis 1.3), back pain measured with 100 mm visual analogue scale (Analysis 1.4; Analysis 1.5), night pain (% no pain) (Analysis 1.6), score of sleep disturbance (score 0 to 4) (Analysis 1.7), frequency of nocturnal awaking (Analysis 1.8), score of daily non‐steroidal anti‐inflammatory drugs (NSAIDs) (change from baseline, usual dosage as 10) (Analysis 1.9), and reducing and stopping NSAIDs (Analysis 1.10). Among these parameters, back pain was the most used one which we chose to include in summary of findings Table for the main comparison. Six trials assessed back pain measured with visual analogue scale (0 mm to 100 mm) (Clegg 1996; Dougados 1986; Nissila 1988; Schmidt 2002; Taylor 1991; Winkler 1989). Two trials found significant lower back pain measured with visual analogue scale in sulfasalazine compared with the placebo group (Nissila 1988; Schmidt 2002). However, pooled MD was ‐2.96 (95% CI ‐6.33 to 0.41) and the difference was not statistically significant (Analysis 1.4). We did not find significant heterogeneity among the trials.
No data were available in these trials for bath ankylosing spondylitis disease activity index (BASDAI), bath ankylosing spondylitis function index (BASFI), bath ankylosing spondylitis metrology index (BASMI), or radiographic progression.
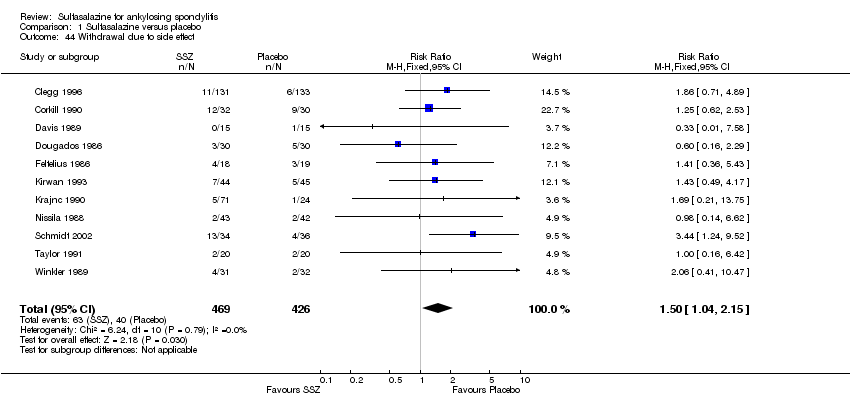
For safety outcomes, significantly higher rates of withdrawal due to side effects were found in the sulfasalazine group compared with the placebo group. Pooled RR was 1.50 (95% CI 1.04 to 2.15) (Analysis 1.44). Among 469 participants receiving sulfasalazine, a serious adverse reaction was reported in one patient who developed a generalized, erythematous, raised, pruritic eruption which was associated with nausea, anorexia and insomnia (Clegg 1996).
Secondary outcomes
The included trials did not report Assessment of Ankylosing Spondylitis response, other disease activity index, or fatigue.
Three trials assessed physical function index and none of them found a statistically significant difference between the sulfasalazine and placebo groups in the analysis of either end point data or change from baseline data (Clegg 1996; Dougados 1986; Schmidt 2002). Pooled analysis showed a similar result and no significant heterogeneity among these trials (Analysis 1.1; Analysis 1.2).
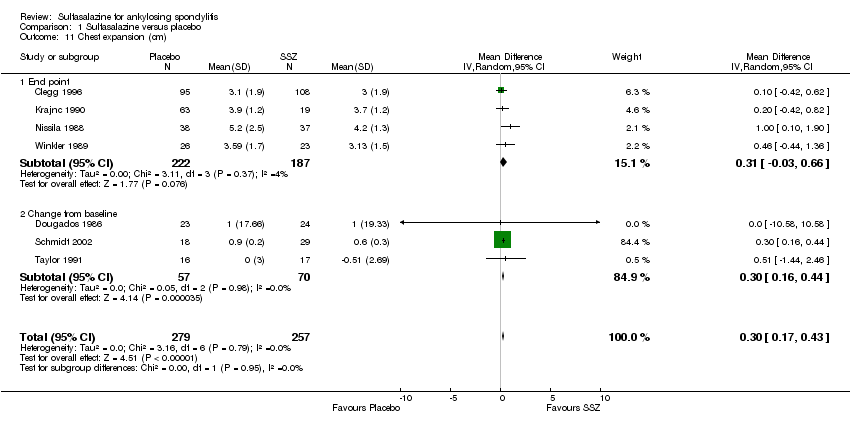
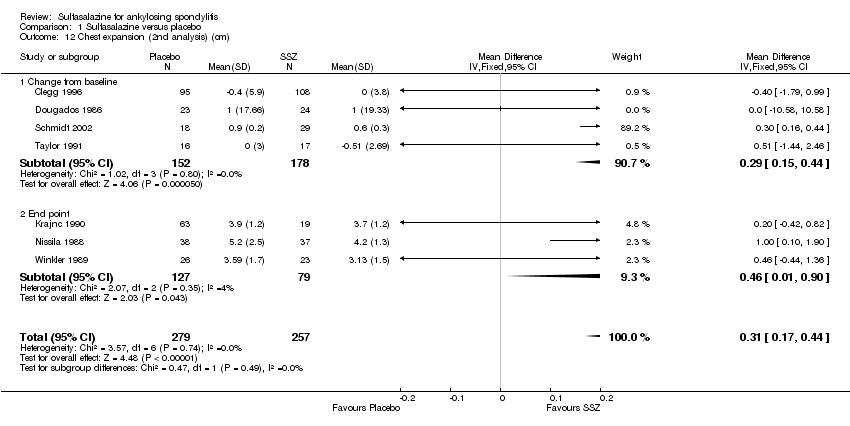
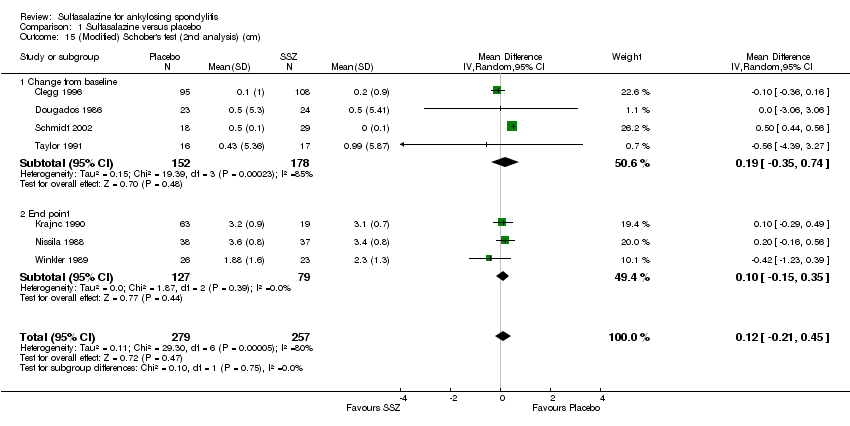
Spinal mobility outcomes included chest expansion (Analysis 1.11; Analysis 1.12), forced vital volume (Analysis 1.13), modified Schober's test (Analysis 1.14; Analysis 1.15), occiput‐to‐wall test (Analysis 1.16; Analysis 1.17), fingers‐to‐floor test (Analysis 1.18; Analysis 1.19), and chin sternum distance (Analysis 1.20). Two trials showed better chest expansion in the sulfasalazine compared with placebo group (Nissila 1988; Schmidt 2002) (Analysis 1.11; Analysis 1.12). This statistically significant difference was confirmed in pooled analysis with weighted MD as 0.30 cm (Analysis 1.11) and 0.31 cm (Analysis 1.12). There was significant heterogeneity among the trials (P < 0.0001) (Analysis 1.12). Schmidt 2002, a trial with more than 30% of drop‐outs, contributed more than 80% weight. When excluded from the analysis, the difference and heterogeneity were insignificant. No statistically significant difference was found between intervention groups in other outcomes of spinal mobility. However, significant heterogeneity was also found among the included studies in Schober's test (Analysis 1.15), occiput‐to‐wall test (Analysis 1.16), and improvement in patient global assessment (Analysis 1.31), and physician global assessment (Analysis 1.34). Again, when the Schmidt 2002 trial was excluded, heterogeneity became insignificant.
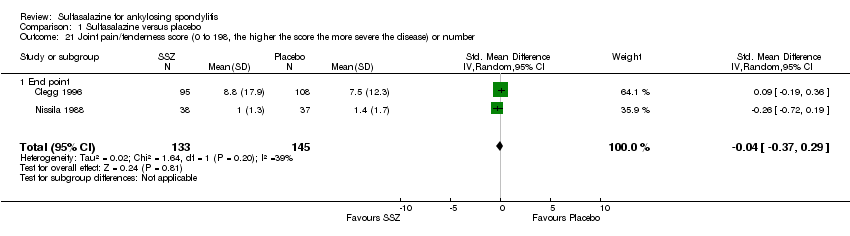
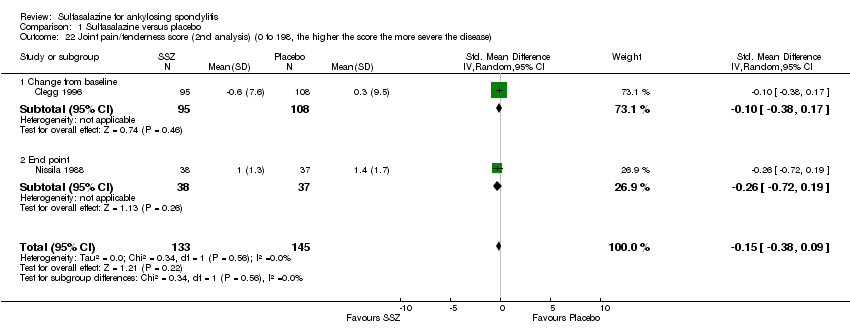
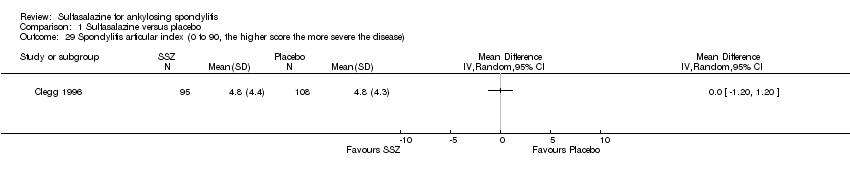
Peripheral joints/entheses were assessed in several studies (Clegg 1996; Dougados 1986; Kirwan 1993; Nissila 1988; Schmidt 2002). Outcomes included joint pain/tenderness score (0 to 198) or number (Analysis 1.21; Analysis 1.22), joint swelling score (0 to 198) or number (Analysis 1.23; Analysis 1.24), dactylitis score (0 to 3) (Analysis 1.25; Analysis 1.26), enthesopathy index (0 to 90) (Analysis 1.27; Analysis 1.28) and spondylitis articular index (0 to 90) (Analysis 1.29; Analysis 1.30). There was no statistically significant difference between intervention groups in either individual study or pooled data except for the Kirwan 1993 study, which found that occurrence of peripheral joint symptoms were lower in the sulfasalazine group (0.298 episodes/year) than in the placebo group (0.392 episodes/year) (P < 0.05). This difference was not shown in our analysis because of lack of available data.
Dougados 1986 found more participants improved in terms of patient global assessment in the sulfasalazine group than placebo group, but two other trials, Clegg 1996 and Schmidt 2002, did not, and neither did our pooled analysis (Analysis 1.31). One trial, Winkler 1989, compared patient assessment of disease severity (100 mm visual analogue scale) between the sulfasalazine and placebo groups and found no difference (Analysis 1.32).
One trial, Nissila 1988, assessed general wellbeing (100 mm visual analogue scale) and found the sulfasalazine group was better than the placebo group (MD ‐11.00, 95% CI ‐19.84 to ‐2.16) (Analysis 1.33). Two trials, Clegg 1996 and Schmidt 2002, analyzed improvement in physician global assessment and found no difference between the sulfasalazine and placebo groups, neither did our pooled result (Analysis 1.34). One trial, Clegg 1996, assessed response to treatment which was based on both patient and physician global assessment and found no difference between the sulfasalazine and placebo groups (Analysis 1.35).
Five trials assessed duration of morning stiffness (Clegg 1996; Krajnc 1990; Nissila 1988; Schmidt 2002; Winkler 1989). Schmidt 2002, found a statistically significant difference between intervention groups, favoring sulfasalazine over placebo. But the difference of pooled results was statistically insignificant (Analysis 1.36; Analysis 1.37). Significant heterogeneity existed among the studies. When we excluded the Schmidt 2002 trial, heterogeneity became insignificant. Two trials assessed morning stiffness with a 100 mm visual analogue scale (where 0 = no stiffness, 100 = severe) (Nissila 1988; Taylor 1991). One study showed a statistically significant difference favoring sulfasalazine over placebo (Nissila 1988). Pooled data showed a similar result (MD ‐13.89, 95% CI ‐22.54 to ‐5.24 (Analysis 1.38).
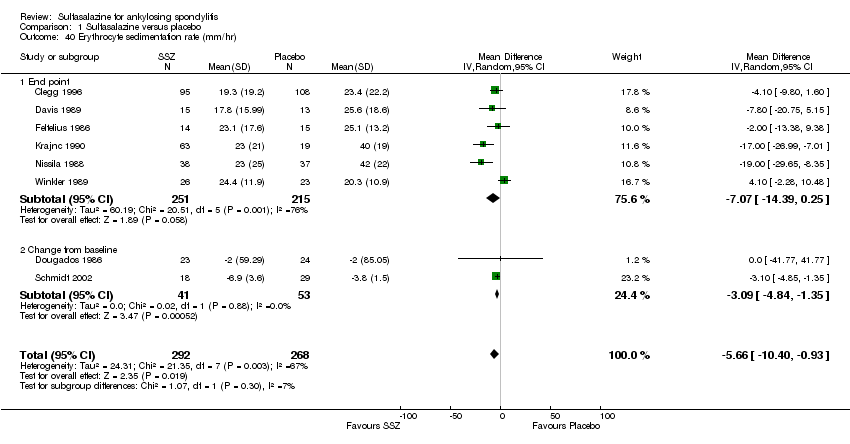
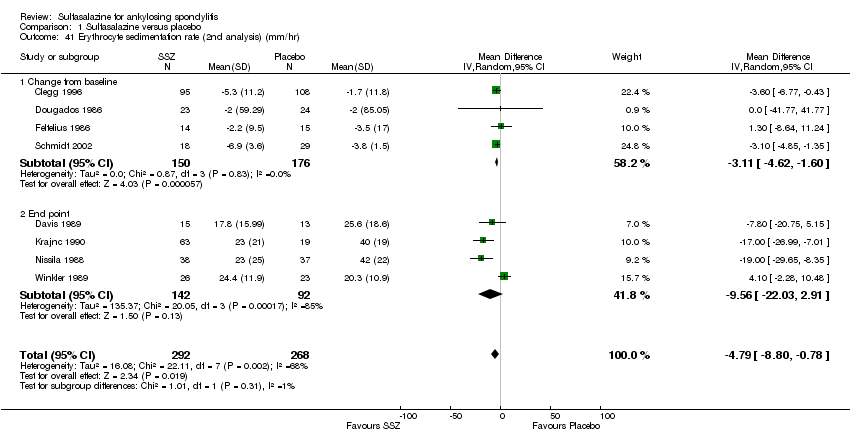
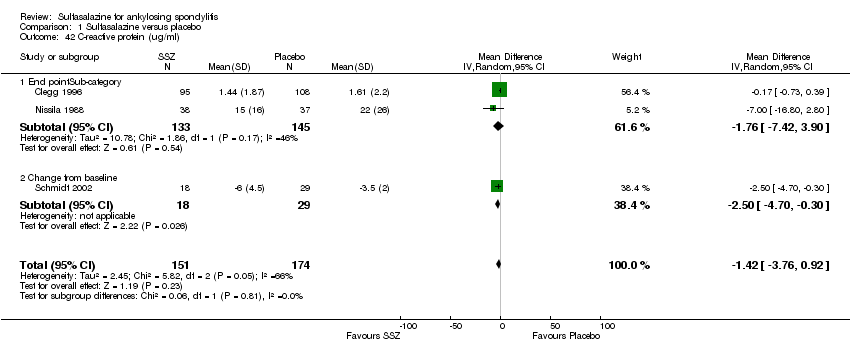
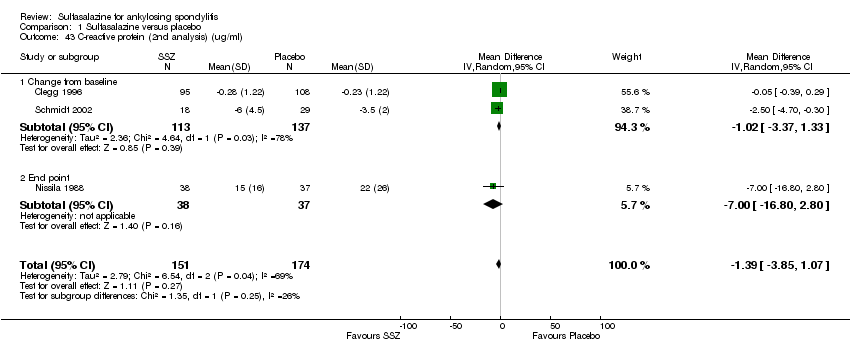
For erythrocyte sedimentation rate, four trials found statistically significant differences between intervention groups, favoring sulfasalazine over placebo (Clegg 1996; Krajnc 1990; Nissila 1988; Schmidt 2002). A similar result was found in the pooled data (Analysis 1.40; Analysis 1.41). MD of change from baseline was ‐3.11 mm/hr, 95% CI ‐4.62 to ‐1.60 mm/hr. MD of end point was ‐7.07 mm/hr, 95% CI ‐14.39 to 0.25 (not statistically significant). Significant heterogeneity existed among the trials (P = 0.02). This could be due to the large difference of erythrocyte sedimentation rate at baseline levels among the studies. Three trials, Clegg 1996, Nissila 1988 and Schmidt 2002, assessed C‐reactive protein and only one, Schmidt 2002, showed a statistically significant difference between intervention groups, favoring sulfasalazine over placebo. The pooled result showed no statistically significant difference (Analysis 1.42; Analysis 1.43).
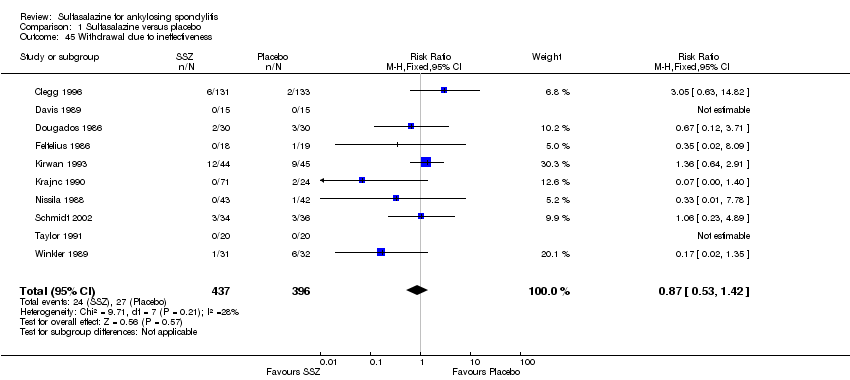
Ten trials reported the total number of withdrawals (Clegg 1996; Davis 1989; Dougados 1986; Feltelius 1986; Kirwan 1993; Krajnc 1990; Nissila 1988; Schmidt 2002; Taylor 1991; Winkler 1989). A significantly higher rate of withdrawals due to any reason was found in the sulfasalazine groups compared with the placebo groups (pooled RR 1.33, 95% CI 1.03 to 1.73) (Analysis 1.46).
Sensitivity analysis
We did not perform a sensitivity analysis against concealment because we did not rank any included trials at high risk of bias. Blinding was reported in all studies, however, three participants broke the blinding during the trial of Corkill 1990. Continuous outcome data were unavailable in this trial. For the dichotomous outcome, withdrawals due to side effect, exclusion of this trial from the analysis showed a similar result (Analysis 1.44). Since continuous data included only the participants who completed the trials, we excluded the trials with more than 30% drop‐outs (Kirwan 1993; Schmidt 2002), to see if a high percentage of drop‐outs affected the results. After exclusion of Schmidt 2002 (no continuous data was available in Kirwan 1993), we found that the MD of chest expansion and MD of duration of morning stiffness (change from baseline) became statistically insignificant, which have been mentioned above. Other outcomes remained similar. Only the median and CI values were available in Dougados 1986. We assumed that mean was equal to median for each outcome and calculated the SD from the CI and sample size. Therefore, the mean and SD were estimated in this trial. Sensitivity analysis, however, found no obvious difference between inclusion and exclusion of this trial in the pooled result. The Davis 1989 and Feltelius 1986 trials had the least number of participants and the shortest periods. When excluded, the pooled difference of erythrocyte sedimentation rate (end point) became statistically significant (weighted MD ‐6.13 mm/hr, 95% CI ‐11.89 to ‐0.37 mm/hr), while other results remained similar.
Subgroup data
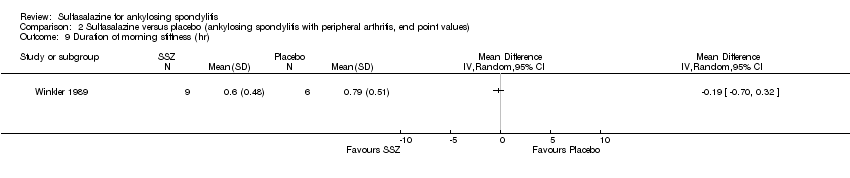
We could not group studies of sulfasalazine versus placebo according to characteristics of interventions and participants. Only one study (Winkler 1989) presented data of subgroups (participants with and without peripheral arthritis). In participants with peripheral arthritis (N = 15), we did not find a statistically significant difference between intervention groups in back pain, score of sleep disturbance, chest expansion, Schober's test, fingers‐to‐floor test, articular index, degree of joint swelling, patient assessment of disease severity, duration of morning stiffness, or erythrocyte sedimentation rate. For participants without peripheral arthritis (N = 34), we did not find a statistically significant difference in these outcomes (but articular index and degree of joint swelling were not assessed) except back pain measured with a 100 mm visual analogue scale (where 0 = no pain, 100 = severe), which was shown to significantly favor sulfasalazine over placebo (MD ‐9.20, 95% CI ‐17.81 to ‐0.59) (Analysis 3.1). Another study separately analyzed the results of participants with peripheral arthritis (N = 77) and found more peripheral responses in the sulfasalazine than placebo group (55.9% versus 30.2%, P = 0.023) (Clegg 1996). Here, peripheral response was a composition of four parameters, e.g. patient self assessment, physician assessment, joint pain/tenderness score, and joint swelling score. Peripheral response was defined as improvement in at least two parameters, with no worsening in other parameters. We did not analyze these parameters in Review Manager 5 because the information on treatment allocation was not given (RevMan 2014).
Discussion
Summary of main results
We identified 11 RCTs evaluating the benefits and harms of sulfasalazine in ankylosing spondylitis (AS). These trials enrolled 895 participants in total. All these trials compared sulfasalazine with placebo. More than 30 outcomes were assessed. Most of the pooled data in the present review included only a few trials (less than five) and few participants (less than 400). Seven major outcomes, e.g. pain, bath ankylosing spondylitis disease activity index (BASDAI), bath ankylosing spondylitis function index (BASFI), bath ankylosing spondylitis metrology index (BASMI), radiographic progression, total number of withdrawals, and total number of withdrawals due to adverse events, were included in the present review. None of the included studies assessed BASDAI, BASFI, BASMI or radiographic progression. Different parameters were used to assess pain. We chose the most used one, e.g. back pain, to be included in summary of findings Table for the main comparison. We did not find any statistically significant difference in either individual trial data or pooled analysis results, except that back pain measured with visual analogue scale (0 mm to 100 mm) was found to be statistically significantly lower in the sulfasalazine group compared with the placebo group in two trials (Nissila 1988; Schmidt 2002). However, the pooled mean difference was not statistically significant.
With regard to the safety of sulfasalazine, the total number of adverse events was higher in the sulfasalazine group than in the placebo group; a serious adverse reaction occurred in one patient taking sulfasalazine. Statistically significantly higher rates of withdrawals due to side effects, and for any reason were found in the sulfasalazine group compared to the placebo group. The most frequent side effects with sulfasalazine were nausea, heartburn, epigastric distress, skin reactions, lightheadedness, and headache.
In addition, the pooled data showed that sulfasalazine did significantly ease morning stiffness and reduce erythrocyte sedimentation rate, even though the slight difference does not have much clinical significance. For other outcomes, it was not possible to pool the data.
Among the included trials, only two (Clegg 1996; Winkler 1989), analyzed the effect of sulfasalazine on peripheral arthritis. One trial presented data of the subgroup with peripheral arthritis (N = 15) and found no statistically significant difference between the sulfasalazine and placebo group (Winkler 1989). The other study separately analyzed the results of participants with peripheral arthritis (N = 77) and found more peripheral responses in the sulfasalazine group than in the placebo group (Clegg 1996). There is not enough evidence suggesting sulfasalazine is better for peripheral joints than for the spine.
Overall completeness and applicability of evidence
The included studies did not report most of the major, validated outcomes such as BASDAI, BASFI, BASMI or radiographic progression. In addition, the study population in the included trials involved 895 AS participants who fulfilled New York criteria (Olivieri 2002) which required radiographic change. The majority of these participants were adults, and considered to have active disease, although the definition of active disease differed among the trials. The duration of disease ranged from 3.8 to 21.9 years. Therefore, the evidence was not applicable to juvenile patients and those patients with early disease onset.
Quality of the evidence
The present review shows limited benefit of sulfasalazine in AS. The strength of evidence in this review should be ranked as moderate level for several reasons. First, the potential benefit of sulfasalazine might be overlooked because most of the pooled data in the present review included only a few trials (less than five) and few participants (less than 400). Moreover, obvious methodological drawbacks existed as specified in the Risk of bias in included studies section. Finally, the included participants were all patients at an advanced stage of AS who might not respond well to sulfasalazine.
Potential biases in the review process
We conducted a thorough search in several databases and updated the search strategies during the process of updating this review. We included all trials that met our inclusion criteria and applied no language restrictions. Two review authors independently reviewed the trial reports according to the selection criteria. When necessary, we contacted the trial authors to clarify any information regarding their trials. We resolved any disagreements regarding the inclusion of studies by discussion.
Agreements and disagreements with other studies or reviews
Ferraz 1990 conducted a meta‐analysis of five RCTs and concluded that sulfasalazine significantly relieved pain and morning stiffness, compared with placebo (Davis 1989; Dougados 1986; Feltelius 1986; Nissila 1988; Winkler 1989). Six RCTs have been published since then (Clegg 1996; Corkill 1990; Kirwan 1993; Krajnc 1990; Schmidt 2002; Taylor 1991). Our previous review (Chen 2005), and the current update showed limited benefit of sulfasalazine in reducing erythrocyte sedimentation rate and easing spinal stiffness, as the effect size was small and not clinically significant. We did not find any other published systematic review, meta‐analysis or RCT comparing sulfasalazine with placebo in our updated search. For peripheral arthritis of AS, the present review did not support any benefit of sulfasalazine, in accordance with the experts' recommendation of using TNF‐alpha inhibitors (such as etanercept), rather than sulfasalazine, if available (van der Heijde 2011). A randomized double‐blind study comparing etanercept with sulfasalazine found that etanercept was more effective in all joint assessments, regardless of swollen joint involvement (Braun 2011). Therefore, etanercept might be a better choice for management of patients with AS and peripheral joint involvement.

Study flow diagram.
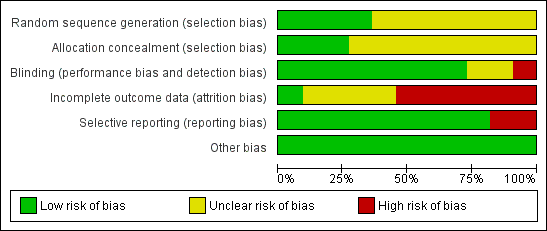
Risk of bias graph: review authors' judgments about each risk of bias item presented as percentages across all included studies.

Risk of bias summary: review authors' judgments about each risk of bias item for each included study.
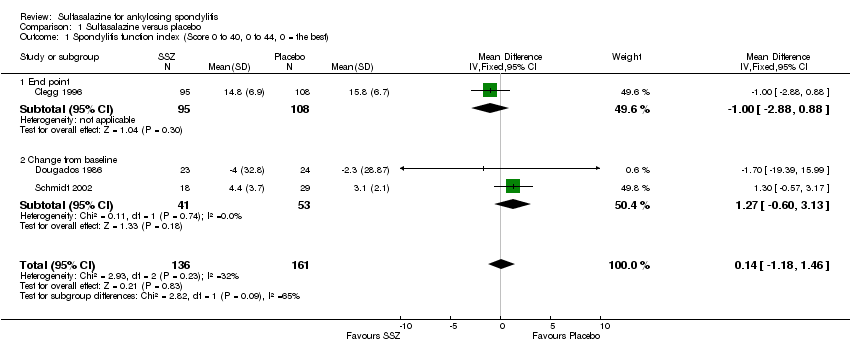
Comparison 1 Sulfasalazine versus placebo, Outcome 1 Spondylitis function index (Score 0 to 40, 0 to 44, 0 = the best).
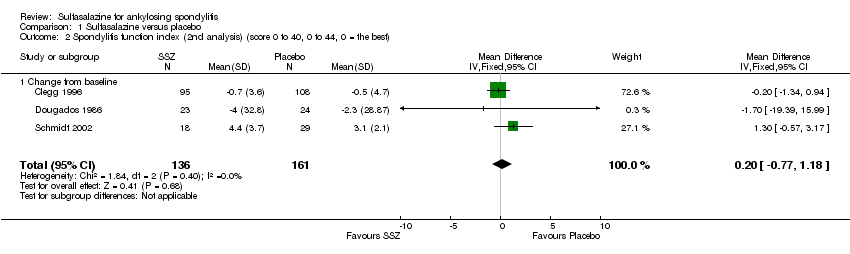
Comparison 1 Sulfasalazine versus placebo, Outcome 2 Spondylitis function index (2nd analysis) (score 0 to 40, 0 to 44, 0 = the best).

Comparison 1 Sulfasalazine versus placebo, Outcome 3 Improvement in back pain.
Comparison 1 Sulfasalazine versus placebo, Outcome 4 Back pain (VAS 100 mm, 0 = no pain, 100 = severe pain).
Comparison 1 Sulfasalazine versus placebo, Outcome 5 Back pain (2nd analysis) (VAS 100 mm, 0 = no pain, 100 = severe pain).
Comparison 1 Sulfasalazine versus placebo, Outcome 6 Night pain (% no pain).
Comparison 1 Sulfasalazine versus placebo, Outcome 7 Score of sleep disturbance (end point) (0 to 4, 0 = no disturbance, 4 = severe disturbance).

Comparison 1 Sulfasalazine versus placebo, Outcome 8 Frequency of nocturnal awakening (change from baseline).

Comparison 1 Sulfasalazine versus placebo, Outcome 9 Score of daily NSAIDs (change from baseline, usual dosage as 10).
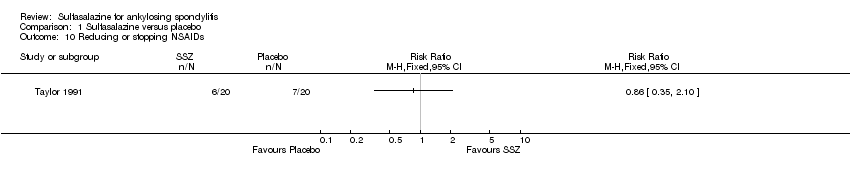
Comparison 1 Sulfasalazine versus placebo, Outcome 10 Reducing or stopping NSAIDs.
Comparison 1 Sulfasalazine versus placebo, Outcome 11 Chest expansion (cm).
Comparison 1 Sulfasalazine versus placebo, Outcome 12 Chest expansion (2nd analysis) (cm).

Comparison 1 Sulfasalazine versus placebo, Outcome 13 Forced vital volume (change from baseline) (L/min).

Comparison 1 Sulfasalazine versus placebo, Outcome 14 (Modified) Schober's test (cm).
Comparison 1 Sulfasalazine versus placebo, Outcome 15 (Modified) Schober's test (2nd analysis) (cm).

Comparison 1 Sulfasalazine versus placebo, Outcome 16 Occiput‐to‐wall test (cm).

Comparison 1 Sulfasalazine versus placebo, Outcome 17 Occiput‐to‐wall test (2nd analysis) (cm).

Comparison 1 Sulfasalazine versus placebo, Outcome 18 Fingers‐to‐floor test (cm).
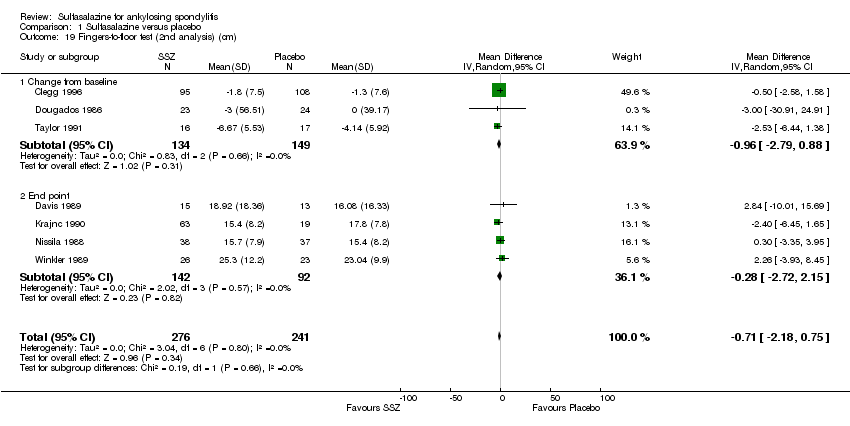
Comparison 1 Sulfasalazine versus placebo, Outcome 19 Fingers‐to‐floor test (2nd analysis) (cm).

Comparison 1 Sulfasalazine versus placebo, Outcome 20 Chin sternum distance (change from baseline) (cm).
Comparison 1 Sulfasalazine versus placebo, Outcome 21 Joint pain/tenderness score (0 to 198, the higher the score the more severe the disease) or number.
Comparison 1 Sulfasalazine versus placebo, Outcome 22 Joint pain/tenderness score (2nd analysis) (0 to 198, the higher the score the more severe the disease).

Comparison 1 Sulfasalazine versus placebo, Outcome 23 Joint swelling score (0 to 198, the higher score the more severe the disease) or number.

Comparison 1 Sulfasalazine versus placebo, Outcome 24 Joint swelling score (2nd analysis) (0 to 198, the higher the score the more severe the disease).

Comparison 1 Sulfasalazine versus placebo, Outcome 25 Dactylitis score (0 to 3, 0 = normal, 3 = severe).

Comparison 1 Sulfasalazine versus placebo, Outcome 26 Dactylitis score (2nd analysis) (0 to 3, 0 = normal, 3 = severe).

Comparison 1 Sulfasalazine versus placebo, Outcome 27 Enthesopathy index (0 to 90, 0 to 66, 0 to 90, the higher the score the more severe the disease).

Comparison 1 Sulfasalazine versus placebo, Outcome 28 Enthesopathy index (2nd analysis) (0 to 90, 0 to 66, 0 to 90, the higher score the more severe the disease).
Comparison 1 Sulfasalazine versus placebo, Outcome 29 Spondylitis articular index (0 to 90, the higher score the more severe the disease).

Comparison 1 Sulfasalazine versus placebo, Outcome 30 Spondylitis articular index (2nd analysis) (0 to 90, the higher score the more severe the disease).

Comparison 1 Sulfasalazine versus placebo, Outcome 31 Improvement in patient global assessment.

Comparison 1 Sulfasalazine versus placebo, Outcome 32 Patient assessment of disease severity (end point) (VAS 100 mm, 0 = very good, 100 = very poor).

Comparison 1 Sulfasalazine versus placebo, Outcome 33 General well‐being (end point) (VAS 100 mm, 0 = very good, 100 = very poor).

Comparison 1 Sulfasalazine versus placebo, Outcome 34 Improvement in physician global assessment.
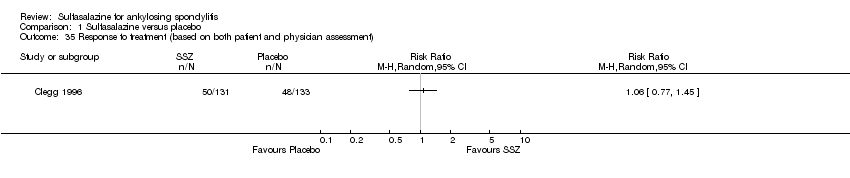
Comparison 1 Sulfasalazine versus placebo, Outcome 35 Response to treatment (based on both patient and physician assessment).
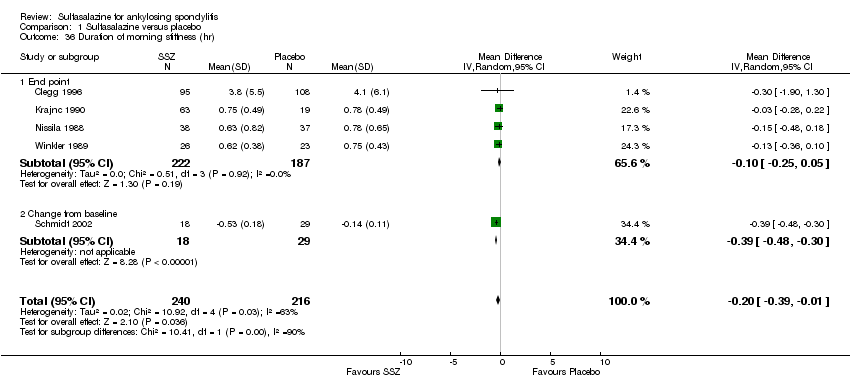
Comparison 1 Sulfasalazine versus placebo, Outcome 36 Duration of morning stiffness (hr).
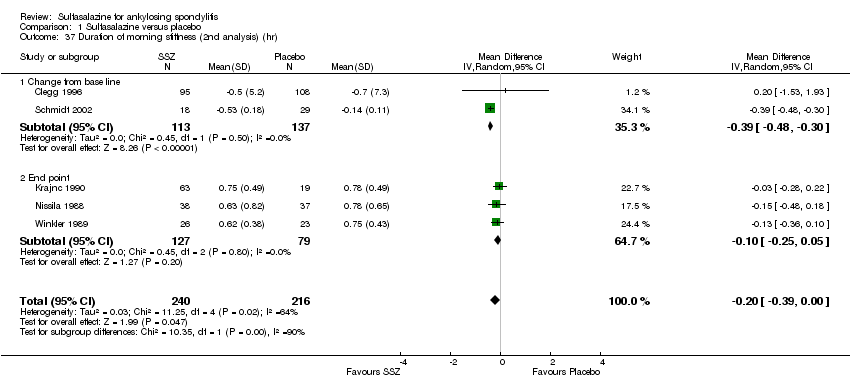
Comparison 1 Sulfasalazine versus placebo, Outcome 37 Duration of morning stiffness (2nd analysis) (hr).

Comparison 1 Sulfasalazine versus placebo, Outcome 38 Morning stiffness (end point) (VAS 100 mm, 0 = no stiffness, 100 = severe stiffness).
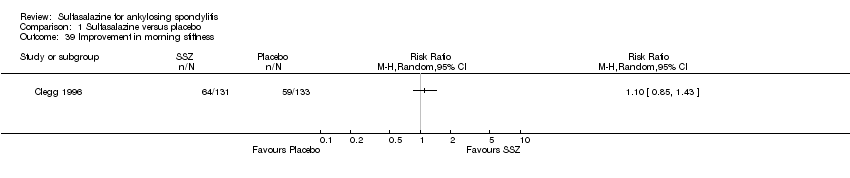
Comparison 1 Sulfasalazine versus placebo, Outcome 39 Improvement in morning stiffness.
Comparison 1 Sulfasalazine versus placebo, Outcome 40 Erythrocyte sedimentation rate (mm/hr).
Comparison 1 Sulfasalazine versus placebo, Outcome 41 Erythrocyte sedimentation rate (2nd analysis) (mm/hr).
Comparison 1 Sulfasalazine versus placebo, Outcome 42 C‐reactive protein (ug/ml).
Comparison 1 Sulfasalazine versus placebo, Outcome 43 C‐reactive protein (2nd analysis) (ug/ml).
Comparison 1 Sulfasalazine versus placebo, Outcome 44 Withdrawal due to side effect.
Comparison 1 Sulfasalazine versus placebo, Outcome 45 Withdrawal due to ineffectiveness.

Comparison 1 Sulfasalazine versus placebo, Outcome 46 Drop‐out for any reason.

Comparison 1 Sulfasalazine versus placebo, Outcome 47 Serious adverse events.
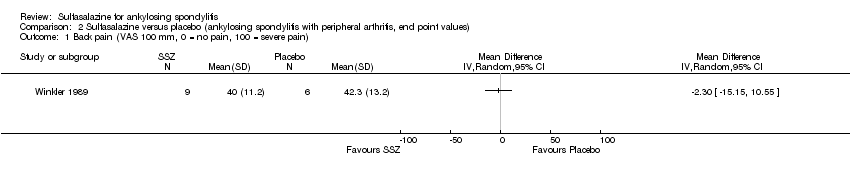
Comparison 2 Sulfasalazine versus placebo (ankylosing spondylitis with peripheral arthritis, end point values), Outcome 1 Back pain (VAS 100 mm, 0 = no pain, 100 = severe pain).
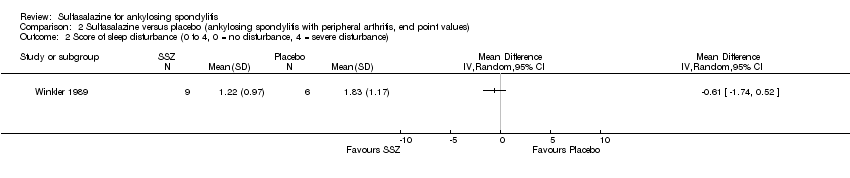
Comparison 2 Sulfasalazine versus placebo (ankylosing spondylitis with peripheral arthritis, end point values), Outcome 2 Score of sleep disturbance (0 to 4, 0 = no disturbance, 4 = severe disturbance).
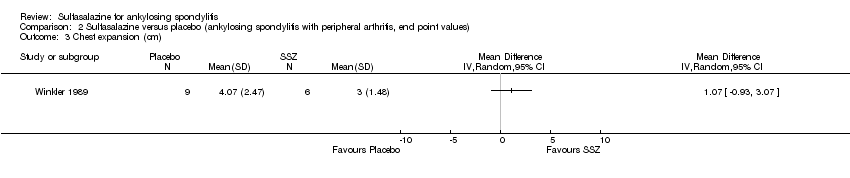
Comparison 2 Sulfasalazine versus placebo (ankylosing spondylitis with peripheral arthritis, end point values), Outcome 3 Chest expansion (cm).

Comparison 2 Sulfasalazine versus placebo (ankylosing spondylitis with peripheral arthritis, end point values), Outcome 4 Schober's test (cm).
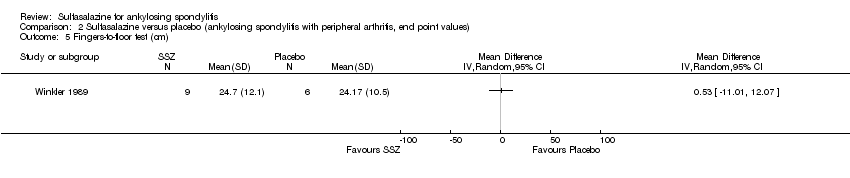
Comparison 2 Sulfasalazine versus placebo (ankylosing spondylitis with peripheral arthritis, end point values), Outcome 5 Fingers‐to‐floor test (cm).

Comparison 2 Sulfasalazine versus placebo (ankylosing spondylitis with peripheral arthritis, end point values), Outcome 6 Articular index (0 to 66, the higher the score the more severe the disease).
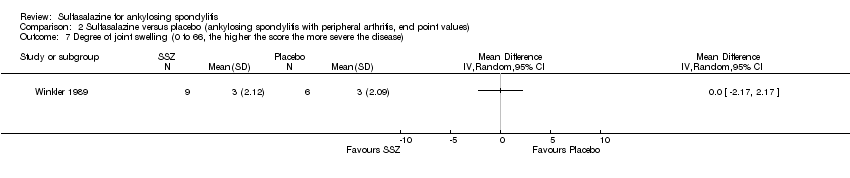
Comparison 2 Sulfasalazine versus placebo (ankylosing spondylitis with peripheral arthritis, end point values), Outcome 7 Degree of joint swelling (0 to 66, the higher the score the more severe the disease).
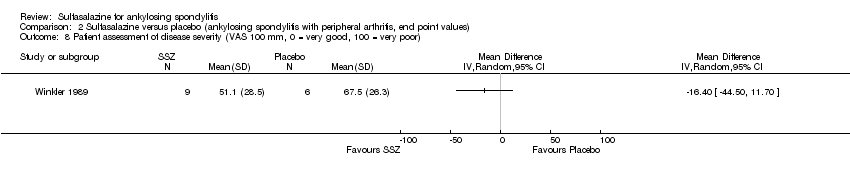
Comparison 2 Sulfasalazine versus placebo (ankylosing spondylitis with peripheral arthritis, end point values), Outcome 8 Patient assessment of disease severity (VAS 100 mm, 0 = very good, 100 = very poor).
Comparison 2 Sulfasalazine versus placebo (ankylosing spondylitis with peripheral arthritis, end point values), Outcome 9 Duration of morning stiffness (hr).

Comparison 2 Sulfasalazine versus placebo (ankylosing spondylitis with peripheral arthritis, end point values), Outcome 10 Erythrocyte sedimentation rate (mm/hr).

Comparison 3 Sulfasalazine versus placebo (axial form ankylosing spondylitis, end point values), Outcome 1 Back pain (VAS 100 mm, 0 = no pain, 100 = severe pain).

Comparison 3 Sulfasalazine versus placebo (axial form ankylosing spondylitis, end point values), Outcome 2 Score of sleep disturbance (0 to 4, 0 = no disturbance, 4 = severe disturbance).

Comparison 3 Sulfasalazine versus placebo (axial form ankylosing spondylitis, end point values), Outcome 3 Chest expansion (cm).

Comparison 3 Sulfasalazine versus placebo (axial form ankylosing spondylitis, end point values), Outcome 4 Schober's test (cm).
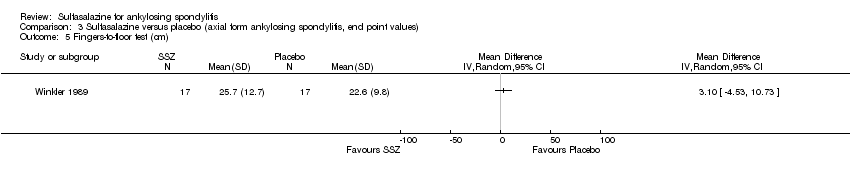
Comparison 3 Sulfasalazine versus placebo (axial form ankylosing spondylitis, end point values), Outcome 5 Fingers‐to‐floor test (cm).

Comparison 3 Sulfasalazine versus placebo (axial form ankylosing spondylitis, end point values), Outcome 6 Patient assessment of disease severity (VAS 100 mm, 0 = very good, 100 = very poor).
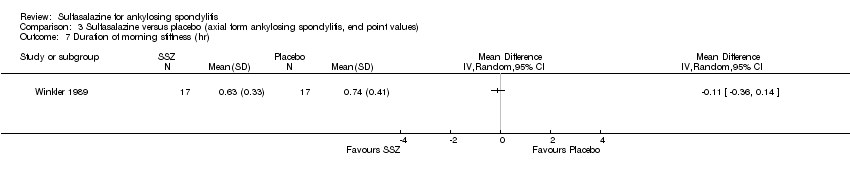
Comparison 3 Sulfasalazine versus placebo (axial form ankylosing spondylitis, end point values), Outcome 7 Duration of morning stiffness (hr).

Comparison 3 Sulfasalazine versus placebo (axial form ankylosing spondylitis, end point values), Outcome 8 Erythrocyte sedimentation rate (mm/hr).
| Sulfasalazine compared to placebo for ankylosing spondylitis | ||||||
| Patient or population: Patients with ankylosing spondylitis | ||||||
| Outcomes | Illustrative comparative risks* (95% CI) | Relative effect | No of Participants | Quality of the evidence | Comments | |
| Assumed risk | Corresponding risk | |||||
| Placebo | Sulfasalazine | |||||
| Back pain (pooled data) | The mean back pain (pooled data) in the control groups was | The mean back pain (pooled data) in the intervention groups was | 454 | ⊕⊕⊕⊝ | Absolute risk difference 3% lower (95% CI 1% to 6%); Relative percent change = 6% (95% CI 2% to 12%); NNT4 = n/a5 | |
| Mean improvement in Bath ankylosing spondylitis disease activity index (BASDAI) ‐ not reported | See comment | See comment | Not estimable | No data | See comment | Not measured |
| Mean improvement in Bath ankylosing spondylitis function index (BASFI) ‐ not reported | See comment | See comment | Not estimable | No data | See comment | Not measured |
| Mean improvement in Bath ankylosing spondylitis metrology index (BASMI) ‐ not reported | See comment | See comment | Not estimable | No data | See comment | Not measured |
| Radiographic progress ‐ not reported | See comment | See comment | Not estimable | No data | See comment | Not measured |
| Total number of withdrawals due to adverse events | 94 per 1000 | 134 per 1000 | RR 1.43 | 895 | ⊕⊕⊕⊝ | Absolute risk difference 4% (95% CI 0.4% to 8.8%); NNTH6 = 25 (95% CI 266 to 12) |
| Serious adverse events | 0 per 1000 | 1 per 1000 | OR 7.5 | 264 | ⊕⊕⊕⊝ | Absolute risk difference 750% (95% CI 15% to 37816%) (W); Relative percent change = 205% (95% CI ‐87% to 7309%); NNTH = n/a |
| *The basis for the assumed risk (e.g. the median control group risk across studies) is provided in footnotes. The corresponding risk (and its 95% confidence interval) is based on the assumed risk in the comparison group and the relative effect of the intervention (and its 95% CI). | ||||||
| GRADE Working Group grades of evidence | ||||||
| 1 From Clegg 1996, mean back pain at baseline in placebo = 48.9 (95% CI 3.0 to 94.8). 4 NNT (Number needed to treat). NNT for dichotomous outcomes calculated using Cates NNT calculator (http://www.nntonline.net/visualrx/). 5 n/a means result is not statistically significant. 6NNTH (Number needed to treat to harm). | ||||||
| Study | Methodological quality | Duration/sample size | Disease duration | Peripheral arthritis | Baseline ESR | Intervention | Main results | Drop‐out |
| Mutlicenter RCT Concealment: unclear risk Assessment: blind | 36 weeks/264 | 18.5+/‐11.6 | 29% | SSZ: 24.6+/‐18.0 Placebo: 25.2+/‐22.0 | SSZ (or placebo) 2.0 g/d | ESR declined more with SSZ than with placebo (P < 0.0001). When comparing SSZ responders with non‐responders, the former had a greater decrease in ESR (P < 0.04) Patients with peripheral arthritis showed improvement that favored SSZ (P < 0.02) No significant difference in other parameters. One patient taking SSZ had severe adverse drug reaction | 19.3% | |
| RCT Concealment: unclear risk Assessment: blind | 48 weeks/62 | SSZ: 12.3+/‐8.2 Placebo: 16.1+/‐11.4 | 19% | SSZ: 15+/‐16 Placebo: 24+/‐26 | SSZ (or placebo) 2.0 g/d | No significant difference between intervention groups | No data | |
| RCT Concealment: unclear Risk assessment: blind | 3 months/30 | Median SSZ: 8.6 Placebo: 8.4 | 23% | SSZ: 24+/‐7.8(95% confidence limits) Placebo: 26.4+/‐8.6 | SSZ (or placebo) 2.0 g/d | Claimed effective on the basis of before‐after comparison | 6.7% | |
| RCT Concealment: low risk Assessment: blind | 6 months/60 | Median 10 | 0% | SSZ: 13.5(median) Placebo: 11.0 | SSZ (or placebo) 2.0 g/d | Success in patient assessment was more in SSZ than in placebo group. Function index and NSAIDs dosage were significantly improved in SSZ compared with placebo group. No difference was found in other parameters | 21.7% | |
| RCT Concealment: unclear risk Assessment: blind | 12 weeks/37 | Median SSZ: 12.1 Placebo: 10.4 | 5% | SSZ: 24.3+/‐17.4 Placebo: 28.5+/‐19.5 | SSZ (or placebo) up to 3.0 g/d | Only graphs (no figures) were presented. Compared with placebo group, morning stiffness and sleep disturbance were significantly improved in SSZ group Analysis of SSZ group showed that the greatest improvement were those with ESR > 20 mm/hr or haptoglobin > 3.8 g/L | 21.6% | |
| RCT Concealment: low risk Assessment: blind | 3 years/89 | SSZ: 19+/‐12 Placebo: 21.9+/‐11.7 | 28% | No data | SSZ (or placebo) 2.0 g/d | Occurence of peripheral joint symptoms was lower in SSZ group: SSZ: 0.298 episodes/yr Placebo: 0.392 episodes/yr, P < 0.05 No difference was found in Schober test, chest expansion and cervical spine lateral flexion. More drop‐outs in SSZ group | 30.3% | |
| RCT Concealment: unclear risk Assessment: blind | 24 weeks/95 SSZ = 71 Placebo = 24 | No data | 66% | SSZ: 41+/‐19 Placebo: 43+/‐18 | SSZ (or placebo) up to 3.0 g/d | On the basis of before‐after treatment comparison, duration of morning stiffness, number of painful and swollen joints, and ESR, there was significant improvement in SSZ group Duration of morning stiffness and ESR value were given in the paper and we found no significant difference between the intervention groups | 14.3% | |
| RCT Concealment: unclear risk Assessment: blind | 26 weeks/85 | SSZ: 5.4+/‐7.3 Placebo: 3.8+/‐4.3 | 68% | SSZ: 42+/‐20 Placebo: 46+/‐19 | SSZ (or placebo) up to 3.0 g/d | Significant differences between intervention groups were observed in severity of morning stiffness, chest expansion and ESR. We also found severity of pain significantly improved in SSZ, compared with placebo group | 12.2% | |
| RCT Concealment: unclear risk Assessment: blind? | 26 weeks/70 | SSZ: 16.7+/‐7.2 Placebo: 16.3+/‐7.8 | 36% | SSZ: 23.1+/‐3.2 Placebo 20.4+/‐2.4 | SSZ (or placebo) 3.0 g/d | No significant difference was found between intervention groups except IgA. There were more drop‐outs in SSZ than in placebo group (18/34 versus 7/36) | 32.9% | |
| RCT Concealment: low risk Assessment: blind | 1 year/40 | SSZ: 11+/‐1.6 Placebo: 10.7+/‐1.6 | 15% | SSZ: 27 Placebo: 25 | SSZ (or placebo) 2.0 g/d | No significant difference was found between intervention groups in all parameters except pain (measured with visual analogue scale). However, the pooled result showed no statistically significant, too | 17.5% | |
| RCT Concealment: unclear risk Assessment: blind? | 24 weeks/63 | Median SSZ: 10.8 Placebo: 11.2 | 33% | SSZ: 33.4+/‐20.4 Placebo: 26.9+/‐16.4 | SSZ (or placebo) 2.0 g/d | The advantage of SSZ over placebo were significant only in the duration of morning stiffness and disturbance of sleep. The same results were found in the patients with axial form (N = 34). In patients with peripheral arthritis (N = 15), articular index showed significant improvement in SSZ over placebo | 22.2% | |
| ESR ‐ erythrocyte sedimentation rate | ||||||||
| Study and Duration | Participants | Outcomes assessed | Results reported | Present analysis | ESR results | Spinal stiffness |
| Clegg 1996, 36 weeks | 264 (SSZ: 31) (Placebo: 133) 29% with PA DD (year): 18.5±11.6 ESR (mm/h): 26.4±18.0 (SSZ) 25.2±22.0 (placebo) | Primary outcomes included response to treatment, improvement in PhGA, PGA, back pain and morning stiffness. Secondary outcomes included night pain (event), duration of morning stiffness, back pain VAS, spondylitis function index, joint/tenderness score, joint swelling score, dactylitis score, enthesopathy index, spondylitis articular index, chest expansion, Schober's test, occiput‐to‐wall test, fingers‐to‐floor test, ESR and CRP | Drop‐out: 19.3%. Both end point value and change from baseline were presented for all continuous outcomes. No difference was found between treatment groups in all outcomes except ESR, which declined more with SSZ than placebo group (P < 0.0001). When comparing SSZ responders with non‐responders, the former had a greater decrease in ESR (P < 0.04). Subgroup analysis showed that in patients with PA, 55.9% of SSZ group and 30.2% of placebo group got peripheral response (P = 0.023) | All the results reported have been confirmed except subgroup analysis where no information about treatment allocation was available for analysis. MD for ESR (change from baseline) was ‐3.10 mm/h, 95% CI ‐4.85 to ‐1.35 mm/h, favoring SSZ group | Absolute benefit from SSZ: ‐3.6 mm/h Relative difference in change from baseline: ‐14% | Did not report |
| Corkill 1990, 48 weeks | 62 (SSZ: 32) (Placebo: 30) 19% with PA DD (year): 12.3±8.2 (SSZ) 16.1±11.4 (placebo) ESR (mm/h): 15±16 (SSZ) 24±26 (placebo) | Spinal pain VAS, spinal stiffness VAS, peripheral joint pain VAS, Schober's test, chest expansion, cervical flexion, cervical rotation, and ESR | Drop‐out: 1.6%. No significant difference was found between treatment groups | Because SDs were not given for all outcomes, these results could not be analyzed | Absolute benefit from SSZ: ‐0.1 mm/h Relative difference in change from baseline: ‐1% | Absolute benefit from SSZ: ‐9.8 mm on 100 mm VAS Relative difference in change from baseline: ‐25% |
| Davis 1989, 3 months | 30 (SSZ: 15) (Placebo: 15) 23% with PA DD (year): 8.6 (SSZ) 8.4 (placebo) ESR (mm/h): 24±7.8 (SSZ) 26.4±8.6 (placebo) | Pain VAS, spinal stiffness VAS, sleep disturbance (event), occiput‐to‐wall test, fingers‐to‐floor test, ESR and CRP | Drop‐out: 6.7%. In SSZ group, all clinical outcomes showed significantly improved when initial and 3 months results are compared | Pain VAS, spinal stiffness VAS and CRP could not be analyzed because means and SDs were not given. No significant difference was found in any other outcome | Absolute benefit from SSZ: ‐5.4 mm/h Relatiive difference in change from baseline: ‐20% | Absolute benefit from SSZ: ‐20 mm on 100 mm VAS Relative difference in change from baseline: ‐40% |
| Dougados 1986, 6 months | 60 (SSZ: 30) (Placebo: 30) None with PA DD (year, median): 10 ESR (mm/h, median): 13.5 (SSZ) 11.0 (placebo) | PGA, score of daily NSAIDs, pain VAS, joint index, frequency of nocturnal awakening, function index, Schober's test, fingers‐to‐floor test, chest expansion and ESR | Drop‐out: 21.7%. Success in PGA was more in SSZ than in placebo group (15/30 vs 6/30, P < 0.05). SSZ resulted in a significant reduction in score of daily NSAIDs (P < 0.05) and significant improvement of function index (P was not given) compared with placebo. No significant difference was found in other outcomes | All continuous outcomes were presented as median and 95% CI. For RevMan analysis, we assumed that mean is equal to median for each outcome and calculated SD from 95% CI and sample size. Success in PGA was more in SSZ than in placebo group (RR 2.5, 95% CI 1.12 to 5.56). No significant difference was found between treatment groups in other outcomes | Absolute benefit from SSZ: 0 mm/h | Did not report |
| Feltelius 1986, 12 weeks | 37 (SSZ:18) (Placebo: 19) 5% with PA DD (year, median): 12.1 (SSZ) 10.4 (placebo) ESR (mm/h): 24.3±17.4 (SSZ) 28.5±19.5 (placebo) | Duration of morning stiffness, spinal stiffness VAS, pain VAS, general wellbeing VAS, chest expansion, Schober's test, sleep disturbance (event), sacroiliac pain VAS, ESR | Drop‐out: 21.6%. Spinal stiffness VAS, chest expansion and sleep disturbance were significantly improved in SSZ compared with placebo group | All outcomes were presented as graphs and no data were available for analysis except ESR that showed no significant difference between treatment groups | Absolute benefit from SSZ: 1.3 mm/h Relative difference in change from baseline: 5% | Did not report |
| Kirwan 1993, 3 years | 89 (SSZ: 44) (Placebo: 45) 28% with PA DD (year): 19±12 (SSZ) 21.9±11.7 (placebo) ESR not given | Primary outcomes included Schober's test, chest expansion, and lateral cervical flexion. Secondary outcomes included function (HAQ), back pain VAS, consumption of anti‐inflammatory drugs, sleep disturbance VAS, PGA, episodes of peripheral arthritis, episodes of heel pain, flares in general AS symptoms, episodes of arthritis | Drop‐out: 30.3%. No significant difference was found between treatment groups in all outcomes except occurrence of peripheral joint symptoms. The episodes of PA were 0.289 episodes/year in SSZ and 0.392 episodes/year in placebo group, respectively (P < 0.05) | There were significantly more drop‐outs for any reason in SSZ than in placebo group. RR was 2.43 (95% CI 1.19 to 4.96). No data were available for analysis in any other outcome | Did not report | Did not report |
| Krajnc 1990, 24 weeks | 95 (SSZ: 71) (Placebo: 24) 66% with PA DD not given ESR (mm/h): 41±19 (SSZ) 43±18 (placebo) | Duration of morning stiffness, Schober's test, chest expansion, fingers‐to‐floor test, number of painful/swollen joints and ESR | Drop‐out: 14.3%. In SSZ group, duration of morning stiffness, chest expansion, number of painful/swollen joints and ESR showed significantly improved when initial and 24 weeks results are compared | No significant difference was found between treatment groups in all outcomes except ESR (MD ‐17.00 mm/h, 95% CI ‐26.99 to ‐7.01mm/h, favoring SSZ) | Absolute benefit from SSZ: 15 mm/h Relatiive difference in change from baseline: ‐35% | Absoluete benefit from SSZ: ‐4 mm on 100 mm VAS Relative difference in change from baseline: ‐8% |
| Nissila 1988, 26 weeks | 85 (SSZ: 43 (Placebo: 42) 68% with PA DD (year): 5.4±7.3 (SSZ) 3.8±4.3 (placebo) ESR (mm/h): 42±20 (SSZ) 46±19 (placebo) | Duration of morning stiffness, spinal stiffness VAS, chest expansion, Schober's test, fingers‐to‐floor test, occiput‐to‐wall test, number of painful joints, number of swollen joints, general wellbeing VAS, ESR and CRP | Drop‐out: 12.2%. Significant differences between treatment groups were found in morning stiffness VAS (P = 0.02), chest expansion (P = 0.03) and ESR (P = 0.02), favoring SSZ. No significant difference was found in other outcomes. Note: we suspected that results of chest expansion were errors because they were impossible to be about 40 to 50 cm. So we divided them by 10 for analysis | Significant differences were found in morning stiffness VAS 100 mm (0 = no stiffness, 100 = severe, MD ‐14.00, 95% CI ‐23.78 to ‐4.22), chest expansion (MD 1.00 cm, 95% CI 0.10 to 1.90 cm), occiput‐to‐wall test (MD ‐0.80 cm, 95% CI ‐1.55 to 0.05 cm), ESR (MD ‐19.00 mm/h, 95% CI ‐29.65 to ‐8.35 mm/h), and general wellbeing VAS 100 mm (0 = the best, 100 = the worst, MD ‐11.00, 95% CI ‐19.84 to ‐2.16), favoring SSZ. No significant difference was found in other outcomes | Absolute benefit from SSZ: ‐15 mm/h Relatiive difference in change from baseline: ‐33% | Absolute benefit from SSZ: ‐6 mm on 100 mm VAS Relative difference in change from baseline: ‐15% |
| Schmidt 2002, 26 weeks | 70 (SSZ: 34) (Placebo: 36) 36% with PA DD (year): 16.7±7.2 (SSZ) 16.3±7.8 (placebo) ESR (mm/h): 23.1±3.2 (SSZ) 20.4±2.4 (placebo) | Back pain VAS, nocturnal awakening (event), pain/tenderness score, duration of morning stiffness, number of painful joints, number of swollen joints, spondylitis function index, PGA, PhGA, Schober's test, fingers‐to‐floor test, chin sternum distance, chest expansion, ESR and CRP | Drop‐out: 36%. No significant difference was reported between treatment groups. There were more drop‐outs in SSZ than in placebo (38% vs 11%) | All continuous outcomes were analyzed as change from baseline. Significant differences were found between treatment groups in back pain VAS 100 mm (0 = no pain, 100 = severe pain, MD ‐2.30, 95% CI ‐4.44 to ‐0.16), chest expansion (MD 0.30 cm, 95% CI 0.16 to 0.44 cm), Schober's test (MD 0.50 cm, 95 CI 0.44 to 0.56 cm), duration of morning stiffness (MD ‐0.39 h, 95% CI ‐0.48 to ‐0.30 h), ESR (MD ‐3.10 mm/h, 95% CI ‐4.85 to ‐1.35 mm/h) and CRP (MD ‐2.50 µg/ml, 95% CI ‐4.70 to ‐0.30 µg/ml), favoring SSZ group. But in occiput‐to‐wall test, the difference (MD 0.70 cm, 95% CI 0.32 to 1.08 cm) favored placebo over SSZ. No significant difference was found in other outcomes. There were significantly more withdrawals for side effects and drop‐outs for any reason in SSZ than in placebo group. RRs were 3.44 (95% CI 1.24 to 9.52) and 2.42 (95% CI 1.14 to 5.15), respectively | Absolute benefit from SSZ: ‐3.1 mm/h Relatiive difference in change from baseline: ‐15% | Did not report |
| Taylor 1991, 1 year | 40 (SSZ: 20) (Placebo: 20) 15% with PA DD (year): 11±1.6 (SSZ) 10.7±1.6 (placebo) ESR (mm/h, mean): 27 (SSZ) 25 (placebo) | Back pain VAS, fingers‐to‐floor test, chest expansion, sleep disturbance (event), forced vital volume, occiput‐to‐wall test, Schober's test, spinal stiffness VAS, reduction or stop of NSAIDs (event) | Drop‐out: 17.5%. No significant difference was found between treatment groups in all outcomes except pain VAS (P < 0.05, favoring SSZ) | No significant difference was found between treatment groups in all outcomes including pain VAS | Did not report | Absolute benefit from SSZ: ‐13.5 mm on 100 mm VAS Relative difference in change from baseline: ‐42% |
| Winkler 1989, 24 weeks | 63 (SSZ: 31) (Placebo: 32) 33% with PA DD (year, median): 10.8 (SSZ) 11.2 (placebo) ESR (mm/h): 33.4±20.4 (SSZ) 26.9±16.4 (placebo) | ESR, duration of morning stiffness, back pain VAS, score of sleep disturbance, chest expansion, Schober's test, fingers‐to‐floor test, disease severity in PGA | Drop‐out: 22.2%. The advantage of SSZ over placebo was significant only in the duration of morning stiffness (P < 0.05) and score of sleep disturbance (P< 0.05). In subgroup analysis, the same results were found in patients with axial form (N = 34). In patients with peripheral arthritis (N = 15), articular index showed significant improvement in SSZ over placebo (P < 0.05) | No significant difference was found between treatment groups in all outcomes. In subgroup analysis of patients with axial form, we found significant difference favoring SSZ over placebo in back pain VAS 100 mm (0 = no pain, 100 = severe pain). MD was ‐9.20 and 95% CI ‐17.81 to 0.59 | Absolute benefit from SSZ: ‐2.7 mm/h Relatiive difference in change from baseline: ‐10% | Did not report |
| CI ‐ confidence interval | ||||||
| Outcome or subgroup title | No. of studies | No. of participants | Statistical method | Effect size |
| 1 Spondylitis function index (Score 0 to 40, 0 to 44, 0 = the best) Show forest plot | 3 | 297 | Mean Difference (IV, Fixed, 95% CI) | 0.14 [‐1.18, 1.46] |
| 1.1 End point | 1 | 203 | Mean Difference (IV, Fixed, 95% CI) | ‐1.0 [‐2.88, 0.88] |
| 1.2 Change from baseline | 2 | 94 | Mean Difference (IV, Fixed, 95% CI) | 1.27 [‐0.60, 3.13] |
| 2 Spondylitis function index (2nd analysis) (score 0 to 40, 0 to 44, 0 = the best) Show forest plot | 3 | 297 | Mean Difference (IV, Fixed, 95% CI) | 0.20 [‐0.77, 1.18] |
| 2.1 Change from baseline | 3 | 297 | Mean Difference (IV, Fixed, 95% CI) | 0.20 [‐0.77, 1.18] |
| 3 Improvement in back pain Show forest plot | 1 | Risk Ratio (M‐H, Fixed, 95% CI) | Totals not selected | |
| 4 Back pain (VAS 100 mm, 0 = no pain, 100 = severe pain) Show forest plot | 6 | 454 | Mean Difference (IV, Random, 95% CI) | ‐2.96 [‐6.33, 0.41] |
| 4.1 End point | 3 | 327 | Mean Difference (IV, Random, 95% CI) | ‐3.47 [‐10.17, 3.22] |
| 4.2 Change from baseline | 3 | 127 | Mean Difference (IV, Random, 95% CI) | ‐4.29 [‐12.15, 3.56] |
| 5 Back pain (2nd analysis) (VAS 100 mm, 0 = no pain, 100 = severe pain) Show forest plot | 6 | 454 | Mean Difference (IV, Random, 95% CI) | ‐2.38 [‐5.78, 1.03] |
| 5.1 Change from baseline | 4 | 330 | Mean Difference (IV, Random, 95% CI) | ‐1.24 [‐4.86, 2.37] |
| 5.2 End point | 2 | 124 | Mean Difference (IV, Random, 95% CI) | ‐6.59 [‐14.73, 1.55] |
| 6 Night pain (% no pain) Show forest plot | 4 | 404 | Risk Ratio (M‐H, Fixed, 95% CI) | 1.04 [0.75, 1.43] |
| 7 Score of sleep disturbance (end point) (0 to 4, 0 = no disturbance, 4 = severe disturbance) Show forest plot | 1 | Mean Difference (IV, Random, 95% CI) | Totals not selected | |
| 8 Frequency of nocturnal awakening (change from baseline) Show forest plot | 1 | Mean Difference (IV, Random, 95% CI) | Totals not selected | |
| 9 Score of daily NSAIDs (change from baseline, usual dosage as 10) Show forest plot | 1 | Mean Difference (IV, Random, 95% CI) | Totals not selected | |
| 10 Reducing or stopping NSAIDs Show forest plot | 1 | Risk Ratio (M‐H, Fixed, 95% CI) | Totals not selected | |
| 11 Chest expansion (cm) Show forest plot | 7 | 536 | Mean Difference (IV, Random, 95% CI) | 0.30 [0.17, 0.43] |
| 11.1 End point | 4 | 409 | Mean Difference (IV, Random, 95% CI) | 0.31 [‐0.03, 0.66] |
| 11.2 Change from baseline | 3 | 127 | Mean Difference (IV, Random, 95% CI) | 0.30 [0.16, 0.44] |
| 12 Chest expansion (2nd analysis) (cm) Show forest plot | 7 | 536 | Mean Difference (IV, Fixed, 95% CI) | 0.31 [0.17, 0.44] |
| 12.1 Change from baseline | 4 | 330 | Mean Difference (IV, Fixed, 95% CI) | 0.29 [0.15, 0.44] |
| 12.2 End point | 3 | 206 | Mean Difference (IV, Fixed, 95% CI) | 0.46 [0.01, 0.90] |
| 13 Forced vital volume (change from baseline) (L/min) Show forest plot | 1 | Mean Difference (IV, Random, 95% CI) | Totals not selected | |
| 14 (Modified) Schober's test (cm) Show forest plot | 7 | 536 | Mean Difference (IV, Random, 95% CI) | 0.18 [‐0.11, 0.46] |
| 14.1 End point | 4 | 409 | Mean Difference (IV, Random, 95% CI) | 0.07 [‐0.14, 0.29] |
| 14.2 Change from baseline | 3 | 127 | Mean Difference (IV, Random, 95% CI) | 0.50 [0.44, 0.56] |
| 15 (Modified) Schober's test (2nd analysis) (cm) Show forest plot | 7 | 536 | Mean Difference (IV, Random, 95% CI) | 0.12 [‐0.21, 0.45] |
| 15.1 Change from baseline | 4 | 330 | Mean Difference (IV, Random, 95% CI) | 0.19 [‐0.35, 0.74] |
| 15.2 End point | 3 | 206 | Mean Difference (IV, Random, 95% CI) | 0.10 [‐0.15, 0.35] |
| 16 Occiput‐to‐wall test (cm) Show forest plot | 5 | 386 | Mean Difference (IV, Random, 95% CI) | 0.08 [‐0.90, 1.06] |
| 16.1 End point | 3 | 306 | Mean Difference (IV, Random, 95% CI) | ‐0.63 [‐1.33, 0.07] |
| 16.2 Change from baseline | 2 | 80 | Mean Difference (IV, Random, 95% CI) | 0.68 [0.31, 1.05] |
| 17 Occiput‐to‐wall test (2nd analysis) (cm) Show forest plot | 5 | 386 | Mean Difference (IV, Random, 95% CI) | ‐0.03 [‐0.84, 0.79] |
| 17.1 Change from baseline | 3 | 283 | Mean Difference (IV, Random, 95% CI) | 0.30 [‐0.43, 1.03] |
| 17.2 End point | 2 | 103 | Mean Difference (IV, Random, 95% CI) | ‐0.75 [‐1.49, ‐0.02] |
| 18 Fingers‐to‐floor test (cm) Show forest plot | 7 | 517 | Mean Difference (IV, Random, 95% CI) | ‐1.03 [‐2.93, 0.87] |
| 18.1 End point | 5 | 437 | Mean Difference (IV, Random, 95% CI) | ‐0.64 [‐2.77, 1.49] |
| 18.2 Change from baseline | 2 | 80 | Mean Difference (IV, Random, 95% CI) | ‐2.54 [‐6.75, 1.67] |
| 19 Fingers‐to‐floor test (2nd analysis) (cm) Show forest plot | 7 | 517 | Mean Difference (IV, Random, 95% CI) | ‐0.71 [‐2.18, 0.75] |
| 19.1 Change from baseline | 3 | 283 | Mean Difference (IV, Random, 95% CI) | ‐0.96 [‐2.79, 0.88] |
| 19.2 End point | 4 | 234 | Mean Difference (IV, Random, 95% CI) | ‐0.28 [‐2.72, 2.15] |
| 20 Chin sternum distance (change from baseline) (cm) Show forest plot | 1 | Mean Difference (IV, Fixed, 95% CI) | Totals not selected | |
| 21 Joint pain/tenderness score (0 to 198, the higher the score the more severe the disease) or number Show forest plot | 2 | 278 | Std. Mean Difference (IV, Random, 95% CI) | ‐0.04 [‐0.37, 0.29] |
| 21.1 End point | 2 | 278 | Std. Mean Difference (IV, Random, 95% CI) | ‐0.04 [‐0.37, 0.29] |
| 22 Joint pain/tenderness score (2nd analysis) (0 to 198, the higher the score the more severe the disease) Show forest plot | 2 | 278 | Std. Mean Difference (IV, Random, 95% CI) | ‐0.15 [‐0.38, 0.09] |
| 22.1 Change from baseline | 1 | 203 | Std. Mean Difference (IV, Random, 95% CI) | ‐0.10 [‐0.38, 0.17] |
| 22.2 End point | 1 | 75 | Std. Mean Difference (IV, Random, 95% CI) | ‐0.26 [‐0.72, 0.19] |
| 23 Joint swelling score (0 to 198, the higher score the more severe the disease) or number Show forest plot | 2 | 278 | Std. Mean Difference (IV, Random, 95% CI) | 0.04 [‐0.20, 0.27] |
| 23.1 End point | 2 | 278 | Std. Mean Difference (IV, Random, 95% CI) | 0.04 [‐0.20, 0.27] |
| 24 Joint swelling score (2nd analysis) (0 to 198, the higher the score the more severe the disease) Show forest plot | 2 | 278 | Mean Difference (IV, Random, 95% CI) | 0.0 [‐0.29, 0.29] |
| 24.1 Change from baseline | 1 | 203 | Mean Difference (IV, Random, 95% CI) | 0.0 [‐0.97, 0.97] |
| 24.2 End point | 1 | 75 | Mean Difference (IV, Random, 95% CI) | 0.0 [‐0.30, 0.30] |
| 25 Dactylitis score (0 to 3, 0 = normal, 3 = severe) Show forest plot | 1 | Mean Difference (IV, Random, 95% CI) | Totals not selected | |
| 26 Dactylitis score (2nd analysis) (0 to 3, 0 = normal, 3 = severe) Show forest plot | 1 | Mean Difference (IV, Random, 95% CI) | Totals not selected | |
| 27 Enthesopathy index (0 to 90, 0 to 66, 0 to 90, the higher the score the more severe the disease) Show forest plot | 3 | 297 | Std. Mean Difference (IV, Random, 95% CI) | 0.10 [‐0.13, 0.33] |
| 27.1 End point | 1 | 203 | Std. Mean Difference (IV, Random, 95% CI) | 0.06 [‐0.22, 0.33] |
| 27.2 Change from baseline | 2 | 94 | Std. Mean Difference (IV, Random, 95% CI) | 0.19 [‐0.29, 0.68] |
| 28 Enthesopathy index (2nd analysis) (0 to 90, 0 to 66, 0 to 90, the higher score the more severe the disease) Show forest plot | 3 | 297 | Std. Mean Difference (IV, Random, 95% CI) | 0.11 [‐0.12, 0.34] |
| 28.1 Change from baseline | 3 | 297 | Std. Mean Difference (IV, Random, 95% CI) | 0.11 [‐0.12, 0.34] |
| 29 Spondylitis articular index (0 to 90, the higher score the more severe the disease) Show forest plot | 1 | Mean Difference (IV, Random, 95% CI) | Totals not selected | |
| 30 Spondylitis articular index (2nd analysis) (0 to 90, the higher score the more severe the disease) Show forest plot | 1 | Mean Difference (IV, Random, 95% CI) | Totals not selected | |
| 31 Improvement in patient global assessment Show forest plot | 3 | 394 | Risk Ratio (IV, Random, 95% CI) | 1.52 [0.78, 2.97] |
| 32 Patient assessment of disease severity (end point) (VAS 100 mm, 0 = very good, 100 = very poor) Show forest plot | 1 | Mean Difference (IV, Fixed, 95% CI) | Totals not selected | |
| 33 General well‐being (end point) (VAS 100 mm, 0 = very good, 100 = very poor) Show forest plot | 1 | Mean Difference (IV, Random, 95% CI) | Totals not selected | |
| 34 Improvement in physician global assessment Show forest plot | 2 | 334 | Risk Ratio (IV, Random, 95% CI) | 1.34 [0.59, 3.08] |
| 35 Response to treatment (based on both patient and physician assessment) Show forest plot | 1 | Risk Ratio (M‐H, Random, 95% CI) | Totals not selected | |
| 36 Duration of morning stiffness (hr) Show forest plot | 5 | 456 | Mean Difference (IV, Random, 95% CI) | ‐0.20 [‐0.39, ‐0.01] |
| 36.1 End point | 4 | 409 | Mean Difference (IV, Random, 95% CI) | ‐0.10 [‐0.25, 0.05] |
| 36.2 Change from baseline | 1 | 47 | Mean Difference (IV, Random, 95% CI) | ‐0.39 [‐0.48, ‐0.30] |
| 37 Duration of morning stiffness (2nd analysis) (hr) Show forest plot | 5 | 456 | Mean Difference (IV, Random, 95% CI) | ‐0.20 [‐0.39, ‐0.00] |
| 37.1 Change from base line | 2 | 250 | Mean Difference (IV, Random, 95% CI) | ‐0.39 [‐0.48, ‐0.30] |
| 37.2 End point | 3 | 206 | Mean Difference (IV, Random, 95% CI) | ‐0.10 [‐0.25, 0.05] |
| 38 Morning stiffness (end point) (VAS 100 mm, 0 = no stiffness, 100 = severe stiffness) Show forest plot | 2 | 108 | Mean Difference (IV, Random, 95% CI) | ‐13.89 [‐22.54, ‐5.24] |
| 38.1 End point | 1 | 75 | Mean Difference (IV, Random, 95% CI) | ‐12.00 [‐23.78, ‐4.22] |
| 38.2 Change from baseline | 1 | 33 | Mean Difference (IV, Random, 95% CI) | ‐13.5 [‐30.00, 5.00] |
| 39 Improvement in morning stiffness Show forest plot | 1 | Risk Ratio (M‐H, Random, 95% CI) | Totals not selected | |
| 40 Erythrocyte sedimentation rate (mm/hr) Show forest plot | 8 | 560 | Mean Difference (IV, Random, 95% CI) | ‐5.66 [‐10.40, ‐0.93] |
| 40.1 End point | 6 | 466 | Mean Difference (IV, Random, 95% CI) | ‐7.07 [‐14.39, 0.25] |
| 40.2 Change from baseline | 2 | 94 | Mean Difference (IV, Random, 95% CI) | ‐3.09 [‐4.84, ‐1.35] |
| 41 Erythrocyte sedimentation rate (2nd analysis) (mm/hr) Show forest plot | 8 | 560 | Mean Difference (IV, Random, 95% CI) | ‐4.79 [‐8.80, ‐0.78] |
| 41.1 Change from baseline | 4 | 326 | Mean Difference (IV, Random, 95% CI) | ‐3.11 [‐4.62, ‐1.60] |
| 41.2 End point | 4 | 234 | Mean Difference (IV, Random, 95% CI) | ‐9.56 [‐22.03, 2.91] |
| 42 C‐reactive protein (ug/ml) Show forest plot | 3 | 325 | Mean Difference (IV, Random, 95% CI) | ‐1.42 [‐3.76, 0.92] |
| 42.1 End pointSub‐category | 2 | 278 | Mean Difference (IV, Random, 95% CI) | ‐1.76 [‐7.42, 3.90] |
| 42.2 Change from baseline | 1 | 47 | Mean Difference (IV, Random, 95% CI) | ‐2.5 [‐4.70, ‐0.30] |
| 43 C‐reactive protein (2nd analysis) (ug/ml) Show forest plot | 3 | 325 | Mean Difference (IV, Random, 95% CI) | ‐1.39 [‐3.85, 1.07] |
| 43.1 Change from baseline | 2 | 250 | Mean Difference (IV, Random, 95% CI) | ‐1.02 [‐3.37, 1.33] |
| 43.2 End point | 1 | 75 | Mean Difference (IV, Random, 95% CI) | ‐7.0 [‐16.80, 2.80] |
| 44 Withdrawal due to side effect Show forest plot | 11 | 895 | Risk Ratio (M‐H, Fixed, 95% CI) | 1.50 [1.04, 2.15] |
| 45 Withdrawal due to ineffectiveness Show forest plot | 10 | 833 | Risk Ratio (M‐H, Fixed, 95% CI) | 0.87 [0.53, 1.42] |
| 46 Drop‐out for any reason Show forest plot | 10 | 833 | Risk Ratio (M‐H, Fixed, 95% CI) | 1.33 [1.03, 1.73] |
| 47 Serious adverse events Show forest plot | 1 | 264 | Peto Odds Ratio (Peto, Fixed, 95% CI) | 7.50 [0.15, 378.16] |
| Outcome or subgroup title | No. of studies | No. of participants | Statistical method | Effect size |
| 1 Back pain (VAS 100 mm, 0 = no pain, 100 = severe pain) Show forest plot | 1 | Mean Difference (IV, Random, 95% CI) | Totals not selected | |
| 2 Score of sleep disturbance (0 to 4, 0 = no disturbance, 4 = severe disturbance) Show forest plot | 1 | Mean Difference (IV, Random, 95% CI) | Totals not selected | |
| 3 Chest expansion (cm) Show forest plot | 1 | Mean Difference (IV, Random, 95% CI) | Totals not selected | |
| 4 Schober's test (cm) Show forest plot | 1 | Mean Difference (IV, Random, 95% CI) | Totals not selected | |
| 5 Fingers‐to‐floor test (cm) Show forest plot | 1 | Mean Difference (IV, Random, 95% CI) | Totals not selected | |
| 6 Articular index (0 to 66, the higher the score the more severe the disease) Show forest plot | 1 | Mean Difference (IV, Random, 95% CI) | Totals not selected | |
| 7 Degree of joint swelling (0 to 66, the higher the score the more severe the disease) Show forest plot | 1 | Mean Difference (IV, Random, 95% CI) | Totals not selected | |
| 8 Patient assessment of disease severity (VAS 100 mm, 0 = very good, 100 = very poor) Show forest plot | 1 | Mean Difference (IV, Random, 95% CI) | Totals not selected | |
| 9 Duration of morning stiffness (hr) Show forest plot | 1 | Mean Difference (IV, Random, 95% CI) | Totals not selected | |
| 10 Erythrocyte sedimentation rate (mm/hr) Show forest plot | 1 | Mean Difference (IV, Random, 95% CI) | Totals not selected | |
| Outcome or subgroup title | No. of studies | No. of participants | Statistical method | Effect size |
| 1 Back pain (VAS 100 mm, 0 = no pain, 100 = severe pain) Show forest plot | 1 | Mean Difference (IV, Random, 95% CI) | Totals not selected | |
| 2 Score of sleep disturbance (0 to 4, 0 = no disturbance, 4 = severe disturbance) Show forest plot | 1 | Mean Difference (IV, Random, 95% CI) | Totals not selected | |
| 3 Chest expansion (cm) Show forest plot | 1 | Mean Difference (IV, Random, 95% CI) | Totals not selected | |
| 4 Schober's test (cm) Show forest plot | 1 | Mean Difference (IV, Random, 95% CI) | Totals not selected | |
| 5 Fingers‐to‐floor test (cm) Show forest plot | 1 | Mean Difference (IV, Random, 95% CI) | Totals not selected | |
| 6 Patient assessment of disease severity (VAS 100 mm, 0 = very good, 100 = very poor) Show forest plot | 1 | Mean Difference (IV, Random, 95% CI) | Totals not selected | |
| 7 Duration of morning stiffness (hr) Show forest plot | 1 | Mean Difference (IV, Random, 95% CI) | Totals not selected | |
| 8 Erythrocyte sedimentation rate (mm/hr) Show forest plot | 1 | Mean Difference (IV, Fixed, 95% CI) | Totals not selected | |