Tratamiento con líquidos para la meningitis bacteriana aguda
Referencias
Referencias de los estudios incluidos en esta revisión
Referencias de los estudios excluidos de esta revisión
Referencias adicionales
Referencias de otras versiones publicadas de esta revisión
Characteristics of studies
Characteristics of included studies [ordered by study ID]
Ir a:
| Methods | Setting: Hospital Inpatient department Study design: Randomised, parallel group, multi‐centre, controlled trial Location: Papua New Guinea Number of centres: 3 Source of funding: Roche, World Health Organization, and Royal Australasian College of Physicians | |
| Participants | Children with clinical signs of meningitis, cloudy or turbid CSF with moderate or large amounts of leucocytes and protein on dipstick testing (Multistix 10 SG) were eligible for inclusion. Children with renal failure, congenital heart disease, who had received parenteral antibiotics for 48 hours or more in the week prior to presentation or who were septic or in hypovolaemic shock were excluded from enrolment Age: > 1 month to < 12 years | |
| Interventions | Nasogastric tube fluids at 60% of maintenance fluids, (maintenance fluids defined by "100 ml/kg/day for the first 10 kg of body weight, 50 ml/kg for the second 10 kg, and 20 ml/kg for over 20 kg") as expressed breast milk or other milk feed, divided into feeds given every 3 hours versus 100% of normal maintenance fluids (defined as above) administered intravenously (given nasogastrically in 7 children because an intravenous cannula could not be inserted) given as a solution containing 0.45% sodium chloride and 5% dextrose plus 10 mmol/L of potassium chloride per litre Duration: 48 hours | |
| Outcomes | Death | |
| Notes | 260 of the 357 children had confirmed bacterial meningitis. The paper states that although no bacteria were isolated in the other children the diagnosis was "definitely meningitis". Numbers of children without isolated bacteria was similar between groups Severe sequelae were considered to be present if 14 days after commencing treatment there was a severe motor deficit (marked spasticity, hemiplegia, severe hypotonia) and at least one of the following: a major sensory deficit (inability to fix and follow in an age‐appropriate way or no response to sound), persistent convulsions or coma All children received phenobarbitone, and received oxygen for the first 48 hours. The 1st 150 children received chloramphenicol, the rest ceftriaxone. Mechanical ventilation was not available | |
| Risk of bias | ||
| Bias | Authors' judgement | Support for judgement |
| Random sequence generation (selection bias) | Low risk | Adequate, with comparable treatment and control groups at entry |
| Allocation concealment (selection bias) | Low risk | Adequate, using sealed envelopes |
| Blinding of participants and personnel (performance bias) | High risk | Clearly not |
| Blinding of outcome assessment (detection bias) | Low risk | Low risk for outcomes of death and acute severe neurological sequelae |
| Incomplete outcome data (attrition bias) | Low risk | Adequate overall with 11 of 357 excluded post‐randomisation as found not to have meningitis. However, over 10% of participants lost to follow‐up at 3 months |
| Selective reporting (reporting bias) | Low risk | Adequate, with a good range of appropriate outcomes reported. 14 days is somewhat early to judge whether severe sequelae were present |
| Other bias | Low risk | A large and well‐described study |
| Methods | Setting: Hospital Inpatient department Study design: Randomised, parallel group, single‐centre, controlled trial Location: USA Source of funding: Hoffmann‐La Roche, Praxis Biologies, National Institute of Health | |
| Participants | Previously healthy children with a clinical diagnosis of meningitis, and confirmed by CSF cytology and by chemical studies were eligible for inclusion. Children with central nervous system disease, renal disease, who were prematurely delivered (at less than 36 weeks gestation), who have congestive heart failure, chronic pulmonary disease, malignancy, immunodeficiency, hepatic disease, or were on morphine/phenobarbitone/phenytoin/dexamethazone or lithium were excluded from enrolment Age: 3 months to 16 years | |
| Interventions | 2/3 maintenance fluids (maintenance defined as 100 ml/kg for the first 10 kg of body weight, plus 50 ml/kg for the next 10 kg (10 kg to 20 kg), plus 20 ml/kg for each kilogram in excess of 20 kg) versus Full maintenance fluids (as defined above), plus replacement fluids for any estimated deficit over 24 hours. Rehydration was begun by administering 10 ml/kg or 15 ml/kg by rapid intravenous infusion Duration: 24 hours | |
| Outcomes | Serum osmolality | |
| Notes | 13 children with bacterial meningitis and 6 with aseptic meningitis were enrolled. Results were reported separately. However, the initially pathology of the 6 exclusions was not documented | |
| Risk of bias | ||
| Bias | Authors' judgement | Support for judgement |
| Random sequence generation (selection bias) | Unclear risk | Not described |
| Allocation concealment (selection bias) | Low risk | Adequate, using sealed envelopes |
| Blinding of participants and personnel (performance bias) | High risk | Clearly not |
| Blinding of outcome assessment (detection bias) | Low risk | Low risk for outcomes of death and acute severe neurological sequelae |
| Incomplete outcome data (attrition bias) | High risk | Did not account for all participants. 5 out of 24 participants were not included in final analysis |
| Selective reporting (reporting bias) | High risk | Reporting of outcome data not adequate. No reporting of important outcomes of death, intact survival |
| Other bias | High risk | Most eligible participants not randomised. Poor reporting of details of study |
| Methods | Setting: Hospital Inpatient department Study design: Randomised, parallel group, single‐centre, controlled trial Location: India Source of funding: not stated | |
| Participants | Children with a diagnosis of bacterial meningitis were eligible for inclusion. Children with heart disease, respiratory illness, gastrointestinal disease, renal disease, central nervous system disease, malnutrition (less than 60% of weight expected for age), endocrinopathy, malignancy, immunodeficiency, or who had received previous anticonvulsant therapy were excluded Age: 2 months to 7 years | |
| Interventions | 65% calculated maintenance fluid requirement, given as intravenous 1/5th normal saline in 5% dextrose for 24 hours, followed by "a gradual liberalisation at a rate of 10 ml/kg/8 hours after 24 hours of hospital stay if serum sodium and plasma osmolality had returned to normal and if there were no clinical signs of dehydration versus maintenance fluid requirements (110 ml/kg for first 10 kg, 50 ml/kg for next 10 kg and 25 ml/kg for subsequent weight) given as intravenously and comprising 1/5th normal saline in 5% dextrose" as long as they required intravenous fluids | |
| Outcomes | Intact survival with sequelae | |
| Notes | Trial was stopped prematurely "when a trend toward poor outcome in the restricted‐fluid group became obvious" | |
| Risk of bias | ||
| Bias | Authors' judgement | Support for judgement |
| Random sequence generation (selection bias) | Unclear risk | Use of a list or table. Treatment and control groups were comparable at study entry |
| Allocation concealment (selection bias) | Unclear risk | Unclear, with the use of a list or table |
| Blinding of participants and personnel (performance bias) | High risk | Clearly neither participant's nor treatment providers blinded |
| Blinding of outcome assessment (detection bias) | Low risk | Clearly neither outcome assessors, participants nor treatment providers blinded |
| Incomplete outcome data (attrition bias) | Low risk | Appeared to account for all participants |
| Selective reporting (reporting bias) | High risk | Mixed neurological outcomes and complications, so some important outcomes unavailable |
| Other bias | High risk | Study was stopped prematurely, with no a priori stopping rules, with a "trend towards poor outcome" in one group |
CSF: cerebrospinal fluid
Characteristics of excluded studies [ordered by study ID]
Ir a:
| Study | Reason for exclusion |
| Interventions and comparators not relevant | |
| Not a RCT | |
| Not a RCT | |
| Not a RCT | |
| Sufficient data on culture‐positive bacterial meningitis not available | |
| Intervention not relevant | |
| Not a RCT; used for reference searching for a trial mentioned in abstract which was found to be Pelkonen 2011 | |
| Not a RCT |
RCT: randomised controlled trial
Data and analyses
| Outcome or subgroup title | No. of studies | No. of participants | Statistical method | Effect size |
| 1 Death Show forest plot | 2 | Risk Ratio (M‐H, Fixed, 95% CI) | Subtotals only | |
| Analysis 1.1  Comparison 1 Maintenance fluids versus restricted fluids, Outcome 1 Death. | ||||
| 1.1 All participants | 2 | 407 | Risk Ratio (M‐H, Fixed, 95% CI) | 0.82 [0.53, 1.27] |
| 1.2 Participants with hyponatraemia | 1 | 26 | Risk Ratio (M‐H, Fixed, 95% CI) | 0.15 [0.01, 2.50] |
| 1.3 Participants without hyponatraemia | 1 | 24 | Risk Ratio (M‐H, Fixed, 95% CI) | 0.79 [0.16, 3.90] |
| 2 Severe neurological sequelae Show forest plot | 2 | Risk Ratio (M‐H, Fixed, 95% CI) | Subtotals only | |
| Analysis 1.2  Comparison 1 Maintenance fluids versus restricted fluids, Outcome 2 Severe neurological sequelae. | ||||
| 2.1 Acute (within the first 4 weeks) | 2 | 407 | Risk Ratio (M‐H, Fixed, 95% CI) | 0.67 [0.41, 1.08] |
| 2.2 Chronic (after the first 4 weeks) | 1 | 351 | Risk Ratio (M‐H, Fixed, 95% CI) | 0.42 [0.20, 0.89] |
| 2.3 Participants without hyponatraemia | 1 | 24 | Risk Ratio (M‐H, Fixed, 95% CI) | 0.59 [0.13, 2.64] |
| 2.4 Participants with hyponatraemia | 1 | 26 | Risk Ratio (M‐H, Fixed, 95% CI) | 0.91 [0.34, 2.47] |
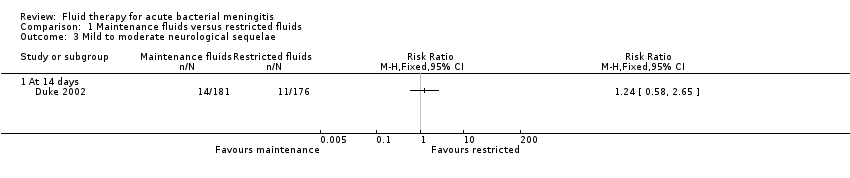
| 3 Mild to moderate neurological sequelae Show forest plot | 1 | Risk Ratio (M‐H, Fixed, 95% CI) | Totals not selected | |
| Analysis 1.3  Comparison 1 Maintenance fluids versus restricted fluids, Outcome 3 Mild to moderate neurological sequelae. | ||||
| 3.1 At 14 days | 1 | Risk Ratio (M‐H, Fixed, 95% CI) | 0.0 [0.0, 0.0] | |
| 4 Hemiparesis/hemiplegia Show forest plot | 1 | Risk Ratio (M‐H, Fixed, 95% CI) | Totals not selected | |
| Analysis 1.4  Comparison 1 Maintenance fluids versus restricted fluids, Outcome 4 Hemiparesis/hemiplegia. | ||||
| 4.1 At 14 days | 1 | Risk Ratio (M‐H, Fixed, 95% CI) | 0.0 [0.0, 0.0] | |
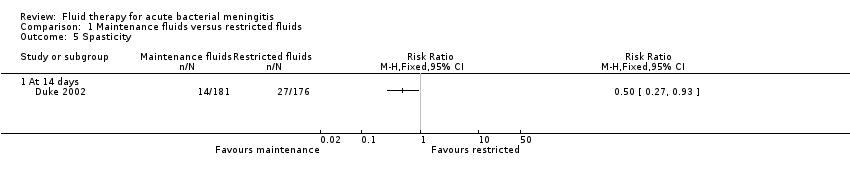
| 5 Spasticity Show forest plot | 1 | Risk Ratio (M‐H, Fixed, 95% CI) | Totals not selected | |
| Analysis 1.5  Comparison 1 Maintenance fluids versus restricted fluids, Outcome 5 Spasticity. | ||||
| 5.1 At 14 days | 1 | Risk Ratio (M‐H, Fixed, 95% CI) | 0.0 [0.0, 0.0] | |
| 6 Seizures Show forest plot | 1 | Risk Ratio (M‐H, Fixed, 95% CI) | Totals not selected | |
| Analysis 1.6 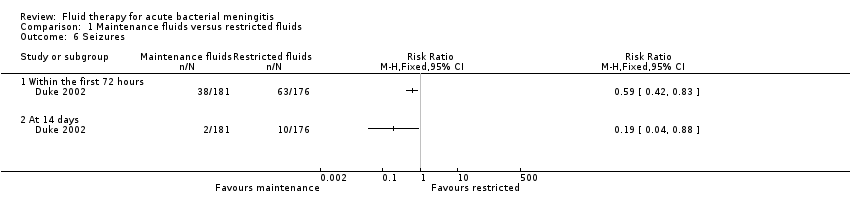 Comparison 1 Maintenance fluids versus restricted fluids, Outcome 6 Seizures. | ||||
| 6.1 Within the first 72 hours | 1 | Risk Ratio (M‐H, Fixed, 95% CI) | 0.0 [0.0, 0.0] | |
| 6.2 At 14 days | 1 | Risk Ratio (M‐H, Fixed, 95% CI) | 0.0 [0.0, 0.0] | |
| 7 Visual impairment Show forest plot | 1 | Risk Ratio (M‐H, Fixed, 95% CI) | Totals not selected | |
| Analysis 1.7  Comparison 1 Maintenance fluids versus restricted fluids, Outcome 7 Visual impairment. | ||||
| 7.1 At 14 days | 1 | Risk Ratio (M‐H, Fixed, 95% CI) | 0.0 [0.0, 0.0] | |
| 8 No response to sound Show forest plot | 1 | Risk Ratio (M‐H, Fixed, 95% CI) | Totals not selected | |
| Analysis 1.8  Comparison 1 Maintenance fluids versus restricted fluids, Outcome 8 No response to sound. | ||||
| 8.1 At 14 days | 1 | Risk Ratio (M‐H, Fixed, 95% CI) | 0.0 [0.0, 0.0] | |
| 9 Oedema Show forest plot | 1 | Risk Ratio (M‐H, Fixed, 95% CI) | Totals not selected | |
| Analysis 1.9  Comparison 1 Maintenance fluids versus restricted fluids, Outcome 9 Oedema. | ||||
| 9.1 Acute facial oedema | 1 | Risk Ratio (M‐H, Fixed, 95% CI) | 0.0 [0.0, 0.0] | |
| 9.2 Acute pulmonary oedema | 1 | Risk Ratio (M‐H, Fixed, 95% CI) | 0.0 [0.0, 0.0] | |
| 9.3 Acute hydrocephalus | 1 | Risk Ratio (M‐H, Fixed, 95% CI) | 0.0 [0.0, 0.0] | |
| 10 Total body water ‐ fall after 48 hours Show forest plot | 1 | Mean Difference (IV, Fixed, 95% CI) | Totals not selected | |
| Analysis 1.10  Comparison 1 Maintenance fluids versus restricted fluids, Outcome 10 Total body water ‐ fall after 48 hours. | ||||
| 10.1 Participants without hyponatraemia | 1 | Mean Difference (IV, Fixed, 95% CI) | 0.0 [0.0, 0.0] | |
| 10.2 Participants with hyponatraemia | 1 | Mean Difference (IV, Fixed, 95% CI) | 0.0 [0.0, 0.0] | |
| 11 Extracellular water ‐ fall after 48 hours Show forest plot | 1 | Mean Difference (IV, Fixed, 95% CI) | Totals not selected | |
| Analysis 1.11  Comparison 1 Maintenance fluids versus restricted fluids, Outcome 11 Extracellular water ‐ fall after 48 hours. | ||||
| 11.1 Participants without hyponatraemia | 1 | Mean Difference (IV, Fixed, 95% CI) | 0.0 [0.0, 0.0] | |
| 11.2 Participants with hyponatraemia | 1 | Mean Difference (IV, Fixed, 95% CI) | 0.0 [0.0, 0.0] | |
| 12 Serum sodium Show forest plot | 2 | Mean Difference (IV, Fixed, 95% CI) | Totals not selected | |
| Analysis 1.12  Comparison 1 Maintenance fluids versus restricted fluids, Outcome 12 Serum sodium. | ||||
| 12.1 All participants (24 hours) | 1 | Mean Difference (IV, Fixed, 95% CI) | 0.0 [0.0, 0.0] | |
| 12.2 Participants with hyponatraemia (48 hours) | 1 | Mean Difference (IV, Fixed, 95% CI) | 0.0 [0.0, 0.0] | |
| 12.3 Participants without hyponatraemia (48 hours) | 1 | Mean Difference (IV, Fixed, 95% CI) | 0.0 [0.0, 0.0] | |
| 12.4 Change from baseline at 48 hours ‐ without hyponatraemia | 1 | Mean Difference (IV, Fixed, 95% CI) | 0.0 [0.0, 0.0] | |
| 12.5 Change from baseline at 48 hours ‐ with hyponatraemia | 1 | Mean Difference (IV, Fixed, 95% CI) | 0.0 [0.0, 0.0] | |
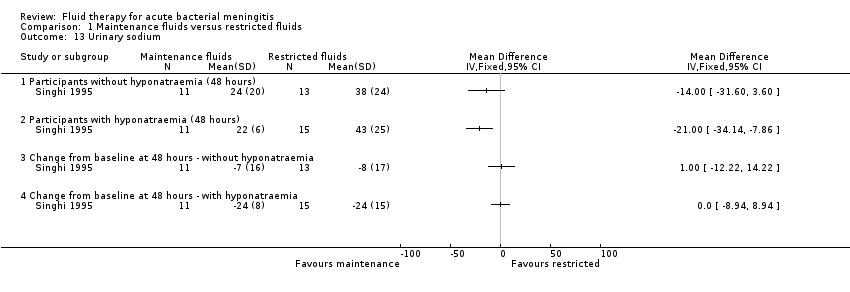
| 13 Urinary sodium Show forest plot | 1 | Mean Difference (IV, Fixed, 95% CI) | Totals not selected | |
| Analysis 1.13  Comparison 1 Maintenance fluids versus restricted fluids, Outcome 13 Urinary sodium. | ||||
| 13.1 Participants without hyponatraemia (48 hours) | 1 | Mean Difference (IV, Fixed, 95% CI) | 0.0 [0.0, 0.0] | |
| 13.2 Participants with hyponatraemia (48 hours) | 1 | Mean Difference (IV, Fixed, 95% CI) | 0.0 [0.0, 0.0] | |
| 13.3 Change from baseline at 48 hours ‐ without hyponatraemia | 1 | Mean Difference (IV, Fixed, 95% CI) | 0.0 [0.0, 0.0] | |
| 13.4 Change from baseline at 48 hours ‐ with hyponatraemia | 1 | Mean Difference (IV, Fixed, 95% CI) | 0.0 [0.0, 0.0] | |
| 14 Plasma osmolality ‐ change after 48 hours Show forest plot | 1 | Mean Difference (IV, Fixed, 95% CI) | Totals not selected | |
| Analysis 1.14  Comparison 1 Maintenance fluids versus restricted fluids, Outcome 14 Plasma osmolality ‐ change after 48 hours. | ||||
| 14.1 Participants without hyponatraemia | 1 | Mean Difference (IV, Fixed, 95% CI) | 0.0 [0.0, 0.0] | |
| 14.2 Participants with hyponatraemia | 1 | Mean Difference (IV, Fixed, 95% CI) | 0.0 [0.0, 0.0] | |
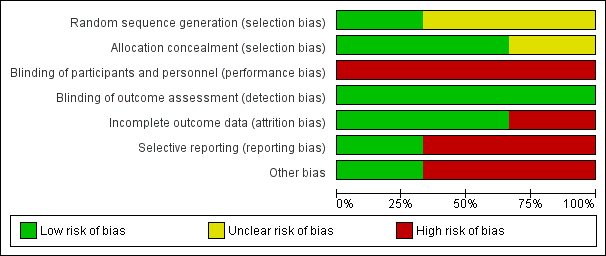
Risk of bias graph: review authors' judgements about each risk of bias item presented as percentages across all included studies.

Risk of bias summary: review authors' judgements about each risk of bias item for each included study.
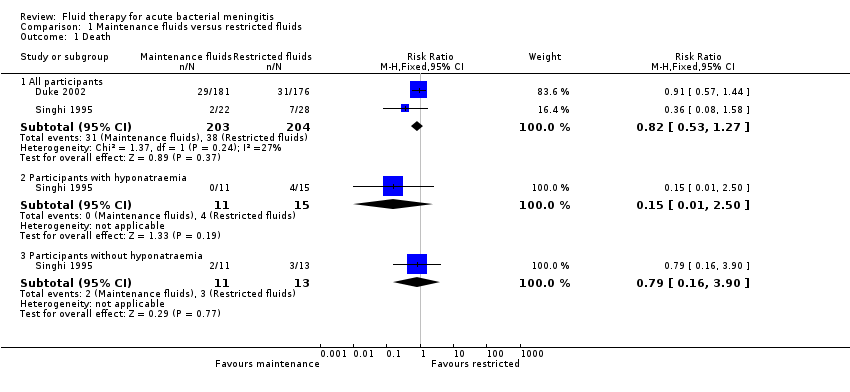
Comparison 1 Maintenance fluids versus restricted fluids, Outcome 1 Death.
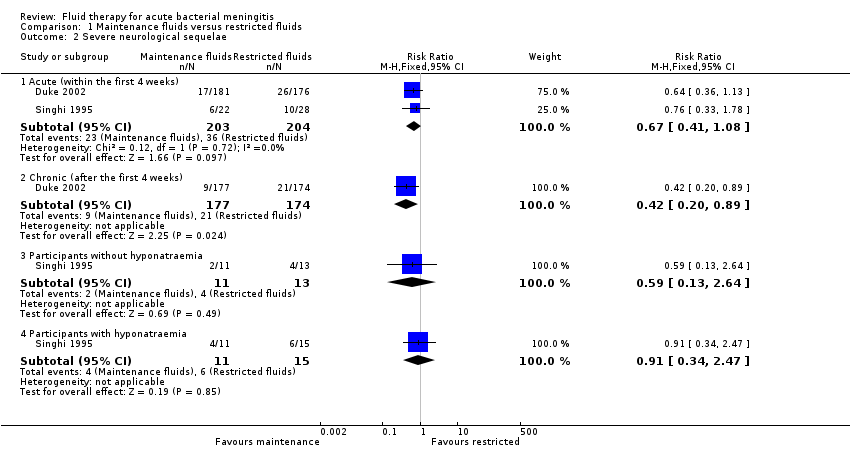
Comparison 1 Maintenance fluids versus restricted fluids, Outcome 2 Severe neurological sequelae.
Comparison 1 Maintenance fluids versus restricted fluids, Outcome 3 Mild to moderate neurological sequelae.

Comparison 1 Maintenance fluids versus restricted fluids, Outcome 4 Hemiparesis/hemiplegia.
Comparison 1 Maintenance fluids versus restricted fluids, Outcome 5 Spasticity.

Comparison 1 Maintenance fluids versus restricted fluids, Outcome 6 Seizures.

Comparison 1 Maintenance fluids versus restricted fluids, Outcome 7 Visual impairment.

Comparison 1 Maintenance fluids versus restricted fluids, Outcome 8 No response to sound.

Comparison 1 Maintenance fluids versus restricted fluids, Outcome 9 Oedema.

Comparison 1 Maintenance fluids versus restricted fluids, Outcome 10 Total body water ‐ fall after 48 hours.

Comparison 1 Maintenance fluids versus restricted fluids, Outcome 11 Extracellular water ‐ fall after 48 hours.

Comparison 1 Maintenance fluids versus restricted fluids, Outcome 12 Serum sodium.
Comparison 1 Maintenance fluids versus restricted fluids, Outcome 13 Urinary sodium.

Comparison 1 Maintenance fluids versus restricted fluids, Outcome 14 Plasma osmolality ‐ change after 48 hours.
| Maintenance fluids versus restricted fluids for acute bacterial meningitis | |||||
| Patient or population: paediatric patients with acute bacterial meningitis Settings: hospital inpatient department Intervention: maintenance fluids Comparison: restricted fluids | |||||
| Outcomes | Illustrative comparative risks* (95% CI) | Relative effect | No of participants | Quality of the evidence | |
| Assumed risk | Corresponding risk | ||||
| Restricted fluids | Maintenance fluids | ||||
| Death ‐ all participants | Study population | RR 0.82 (0.53 to 1.27) | 407 | ⊕⊕⊝⊝ | |
| 186 per 1000 | 153 per 1000 (99 to 237) | ||||
| Moderate risk population | |||||
| 213 per 1000 | 175 per 1000 (113 to 271) | ||||
| Severe neurological sequelae ‐ acute (within the first 4 weeks) | Study population | RR 0.67 | 407 | ⊕⊕⊝⊝ | |
| 176 per 1000 | 118 per 1000 (72 to 191) | ||||
| Moderate risk population | |||||
| 252 per 1000 | 169 per 1000 (103 to 272) | ||||
| Severe neurological sequelae ‐ chronic (after the first 4 weeks) | Study population | RR 0.42 | 351 | ⊕⊝⊝⊝ | |
| 121 per 1000 | 51 per 1000 (24 to 108) | ||||
| Moderate risk population | |||||
| 121 per 1000 | 51 per 1000 (24 to 108) | ||||
| *The basis for the assumed risk (e.g. the median control group risk across studies) is provided in footnotes. The corresponding risk (and its 95% confidence interval) is based on the assumed risk in the comparison group and the relative effect of the intervention (and its 95% CI). | |||||
| GRADE Working Group grades of evidence | |||||
| 1 Total number of events is small and 95% CI around pooled estimate includes both appreciable benefit and harms. | |||||
| Outcome or subgroup title | No. of studies | No. of participants | Statistical method | Effect size |
| 1 Death Show forest plot | 2 | Risk Ratio (M‐H, Fixed, 95% CI) | Subtotals only | |
| 1.1 All participants | 2 | 407 | Risk Ratio (M‐H, Fixed, 95% CI) | 0.82 [0.53, 1.27] |
| 1.2 Participants with hyponatraemia | 1 | 26 | Risk Ratio (M‐H, Fixed, 95% CI) | 0.15 [0.01, 2.50] |
| 1.3 Participants without hyponatraemia | 1 | 24 | Risk Ratio (M‐H, Fixed, 95% CI) | 0.79 [0.16, 3.90] |
| 2 Severe neurological sequelae Show forest plot | 2 | Risk Ratio (M‐H, Fixed, 95% CI) | Subtotals only | |
| 2.1 Acute (within the first 4 weeks) | 2 | 407 | Risk Ratio (M‐H, Fixed, 95% CI) | 0.67 [0.41, 1.08] |
| 2.2 Chronic (after the first 4 weeks) | 1 | 351 | Risk Ratio (M‐H, Fixed, 95% CI) | 0.42 [0.20, 0.89] |
| 2.3 Participants without hyponatraemia | 1 | 24 | Risk Ratio (M‐H, Fixed, 95% CI) | 0.59 [0.13, 2.64] |
| 2.4 Participants with hyponatraemia | 1 | 26 | Risk Ratio (M‐H, Fixed, 95% CI) | 0.91 [0.34, 2.47] |
| 3 Mild to moderate neurological sequelae Show forest plot | 1 | Risk Ratio (M‐H, Fixed, 95% CI) | Totals not selected | |
| 3.1 At 14 days | 1 | Risk Ratio (M‐H, Fixed, 95% CI) | 0.0 [0.0, 0.0] | |
| 4 Hemiparesis/hemiplegia Show forest plot | 1 | Risk Ratio (M‐H, Fixed, 95% CI) | Totals not selected | |
| 4.1 At 14 days | 1 | Risk Ratio (M‐H, Fixed, 95% CI) | 0.0 [0.0, 0.0] | |
| 5 Spasticity Show forest plot | 1 | Risk Ratio (M‐H, Fixed, 95% CI) | Totals not selected | |
| 5.1 At 14 days | 1 | Risk Ratio (M‐H, Fixed, 95% CI) | 0.0 [0.0, 0.0] | |
| 6 Seizures Show forest plot | 1 | Risk Ratio (M‐H, Fixed, 95% CI) | Totals not selected | |
| 6.1 Within the first 72 hours | 1 | Risk Ratio (M‐H, Fixed, 95% CI) | 0.0 [0.0, 0.0] | |
| 6.2 At 14 days | 1 | Risk Ratio (M‐H, Fixed, 95% CI) | 0.0 [0.0, 0.0] | |
| 7 Visual impairment Show forest plot | 1 | Risk Ratio (M‐H, Fixed, 95% CI) | Totals not selected | |
| 7.1 At 14 days | 1 | Risk Ratio (M‐H, Fixed, 95% CI) | 0.0 [0.0, 0.0] | |
| 8 No response to sound Show forest plot | 1 | Risk Ratio (M‐H, Fixed, 95% CI) | Totals not selected | |
| 8.1 At 14 days | 1 | Risk Ratio (M‐H, Fixed, 95% CI) | 0.0 [0.0, 0.0] | |
| 9 Oedema Show forest plot | 1 | Risk Ratio (M‐H, Fixed, 95% CI) | Totals not selected | |
| 9.1 Acute facial oedema | 1 | Risk Ratio (M‐H, Fixed, 95% CI) | 0.0 [0.0, 0.0] | |
| 9.2 Acute pulmonary oedema | 1 | Risk Ratio (M‐H, Fixed, 95% CI) | 0.0 [0.0, 0.0] | |
| 9.3 Acute hydrocephalus | 1 | Risk Ratio (M‐H, Fixed, 95% CI) | 0.0 [0.0, 0.0] | |
| 10 Total body water ‐ fall after 48 hours Show forest plot | 1 | Mean Difference (IV, Fixed, 95% CI) | Totals not selected | |
| 10.1 Participants without hyponatraemia | 1 | Mean Difference (IV, Fixed, 95% CI) | 0.0 [0.0, 0.0] | |
| 10.2 Participants with hyponatraemia | 1 | Mean Difference (IV, Fixed, 95% CI) | 0.0 [0.0, 0.0] | |
| 11 Extracellular water ‐ fall after 48 hours Show forest plot | 1 | Mean Difference (IV, Fixed, 95% CI) | Totals not selected | |
| 11.1 Participants without hyponatraemia | 1 | Mean Difference (IV, Fixed, 95% CI) | 0.0 [0.0, 0.0] | |
| 11.2 Participants with hyponatraemia | 1 | Mean Difference (IV, Fixed, 95% CI) | 0.0 [0.0, 0.0] | |
| 12 Serum sodium Show forest plot | 2 | Mean Difference (IV, Fixed, 95% CI) | Totals not selected | |
| 12.1 All participants (24 hours) | 1 | Mean Difference (IV, Fixed, 95% CI) | 0.0 [0.0, 0.0] | |
| 12.2 Participants with hyponatraemia (48 hours) | 1 | Mean Difference (IV, Fixed, 95% CI) | 0.0 [0.0, 0.0] | |
| 12.3 Participants without hyponatraemia (48 hours) | 1 | Mean Difference (IV, Fixed, 95% CI) | 0.0 [0.0, 0.0] | |
| 12.4 Change from baseline at 48 hours ‐ without hyponatraemia | 1 | Mean Difference (IV, Fixed, 95% CI) | 0.0 [0.0, 0.0] | |
| 12.5 Change from baseline at 48 hours ‐ with hyponatraemia | 1 | Mean Difference (IV, Fixed, 95% CI) | 0.0 [0.0, 0.0] | |
| 13 Urinary sodium Show forest plot | 1 | Mean Difference (IV, Fixed, 95% CI) | Totals not selected | |
| 13.1 Participants without hyponatraemia (48 hours) | 1 | Mean Difference (IV, Fixed, 95% CI) | 0.0 [0.0, 0.0] | |
| 13.2 Participants with hyponatraemia (48 hours) | 1 | Mean Difference (IV, Fixed, 95% CI) | 0.0 [0.0, 0.0] | |
| 13.3 Change from baseline at 48 hours ‐ without hyponatraemia | 1 | Mean Difference (IV, Fixed, 95% CI) | 0.0 [0.0, 0.0] | |
| 13.4 Change from baseline at 48 hours ‐ with hyponatraemia | 1 | Mean Difference (IV, Fixed, 95% CI) | 0.0 [0.0, 0.0] | |
| 14 Plasma osmolality ‐ change after 48 hours Show forest plot | 1 | Mean Difference (IV, Fixed, 95% CI) | Totals not selected | |
| 14.1 Participants without hyponatraemia | 1 | Mean Difference (IV, Fixed, 95% CI) | 0.0 [0.0, 0.0] | |
| 14.2 Participants with hyponatraemia | 1 | Mean Difference (IV, Fixed, 95% CI) | 0.0 [0.0, 0.0] | |