Terapi cecair untuk meningitis bakteria akut
Información
- DOI:
- https://doi.org/10.1002/14651858.CD004786.pub5Copiar DOI

- Base de datos:
-
- Cochrane Database of Systematic Reviews
- Versión publicada:
-
- 04 noviembre 2016see what's new
- Tipo:
-
- Intervention
- Etapa:
-
- Review
- Grupo Editorial Cochrane:
-
Grupo Cochrane de Infecciones respiratorias agudas
- Copyright:
-
- Copyright © 2016 The Cochrane Collaboration. Published by John Wiley & Sons, Ltd.
Cifras del artículo
Altmetric:
Citado por:
Autores
Contributions of authors
Ian Maconochie (IM) jointly (with Richmal Oates‐Whitehead (ROW)) conceptualised the review, commented on drafts of the protocol, was involved in selecting trials for inclusion in the review, performed independent data extraction and quality assessment of the included trials.
Soumyadeep Bhaumik (SB) led this 2016 update and was part of the 2014 update. For both updates he performed independent selection of trials for inclusion in the review, worked on the manuscript of the review. Both authors used the GRADE approach to interpret the findings of the study and commented on the drafts of the review.
Sources of support
Internal sources
-
Liverpool School of Tropical Medicine, UK.
-
Royal College of Paediatrics and Child Health, UK.
External sources
-
No sources of support supplied
Declarations of interest
Ian Maconochie ‐ no known conflicts of interest to declare.
Soumyadeep Bhaumik ‐ no known conflicts of interest to declare.
Acknowledgements
The review authors would like to acknowledge the major contribution of the late Richmal Oates‐Whitehead. She was the person who turned the idea of this review into a reality by doing much of the work for the first published version (Oates‐Whitehead 2005). Richmal died suddenly and was not therefore able to contribute to this version. She jointly (with IM) conceptualised the review, took the lead in writing the protocol and overall review, performed initial searches of databases for trials, was involved in selecting trials for inclusion, and performed independent data extraction and quality assessment of the included trials. The late Richmal is not included as an author on this update although she was the original contact reviewer in the first published version in 2005. Richmal died after the publication of that version.
Morwenna Stewart (MS) was an author on the original review and the 2008 update. Morwenna performed independent data extraction and quality assessment of the included trials, and commented on all drafts of the review.
Harry Baumer (HB) commented on drafts of the protocol and was involved in selecting trials for inclusion in the review; performed independent data extraction and quality assessment of the included trials; and commented on all drafts of the review. HB led the previous update.
The review authors would like to thank Dr Keith Powell and Dr Sunit Singhi for taking time to reply to requests for further information on their respective studies; Liz Dooley, Managing Editor of the Cochrane Acute Respiratory Infections (ARI) Group, Carol Wical, Ruth Foxlee and Sarah Thorning, former members of the ARI Group editorial team, for their help and support. Finally, we would like to thank the following people for commenting on drafts of this review: Hayley Edmonds, Robert Heyderman, Sree Nair, George Swingler and Diederik van de Beek.
Version history
| Published | Title | Stage | Authors | Version |
| 2016 Nov 04 | Fluid therapy for acute bacterial meningitis | Review | Ian K Maconochie, Soumyadeep Bhaumik | |
| 2014 May 05 | Fluid therapy for acute bacterial meningitis | Review | Ian K Maconochie, Soumyadeep Bhaumik | |
| 2008 Jan 23 | Fluid therapy for acute bacterial meningitis | Review | Ian K Maconochie, J Harry Baumer | |
| 2005 Jul 20 | Fluid therapy for acute bacterial meningitis | Review | Richmal M Oates‐Whitehead, Ian K Maconochie, Harry Baumer, Morwenna Stewart | |
| 2004 Apr 19 | Fluid therapy for acute bacterial meningitis | Protocol | Richmal Marie Oates‐Whitehead, Ian K Maconochie, J H Baumer, Morwenna Stewart, Harry Baumer | |
Differences between protocol and review
There were insufficient data to explore any of the subgroup analyses, with the exception of hypoperfusion at entry. One study subgrouped each participant group into those with hyponatraemia and those without hyponatraemia at enrolment (Singhi 1995). Therefore, we could only perform a subgroup analysis on this trial.
Keywords
MeSH
Medical Subject Headings (MeSH) Keywords
Medical Subject Headings Check Words
Child; Humans; Infant;
PICO
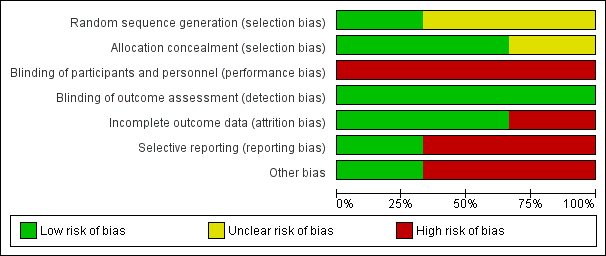
Risk of bias graph: review authors' judgements about each risk of bias item presented as percentages across all included studies.

Risk of bias summary: review authors' judgements about each risk of bias item for each included study.
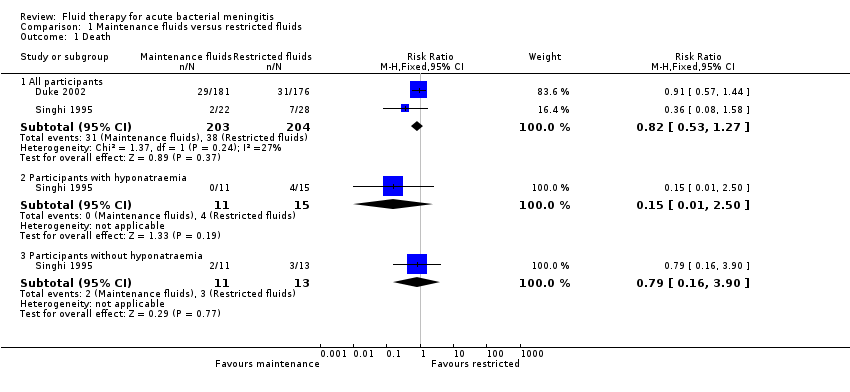
Comparison 1 Maintenance fluids versus restricted fluids, Outcome 1 Death.
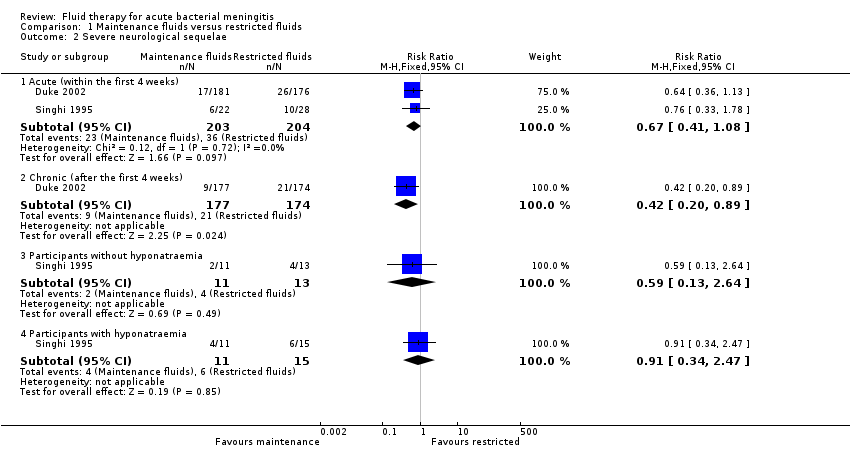
Comparison 1 Maintenance fluids versus restricted fluids, Outcome 2 Severe neurological sequelae.
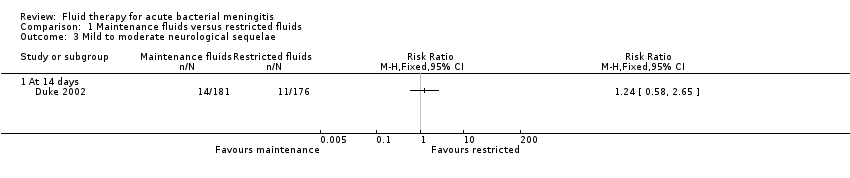
Comparison 1 Maintenance fluids versus restricted fluids, Outcome 3 Mild to moderate neurological sequelae.

Comparison 1 Maintenance fluids versus restricted fluids, Outcome 4 Hemiparesis/hemiplegia.
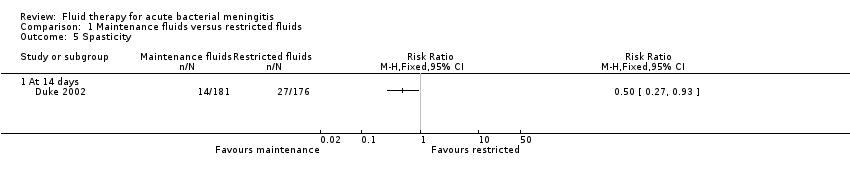
Comparison 1 Maintenance fluids versus restricted fluids, Outcome 5 Spasticity.

Comparison 1 Maintenance fluids versus restricted fluids, Outcome 6 Seizures.

Comparison 1 Maintenance fluids versus restricted fluids, Outcome 7 Visual impairment.

Comparison 1 Maintenance fluids versus restricted fluids, Outcome 8 No response to sound.

Comparison 1 Maintenance fluids versus restricted fluids, Outcome 9 Oedema.

Comparison 1 Maintenance fluids versus restricted fluids, Outcome 10 Total body water ‐ fall after 48 hours.

Comparison 1 Maintenance fluids versus restricted fluids, Outcome 11 Extracellular water ‐ fall after 48 hours.

Comparison 1 Maintenance fluids versus restricted fluids, Outcome 12 Serum sodium.
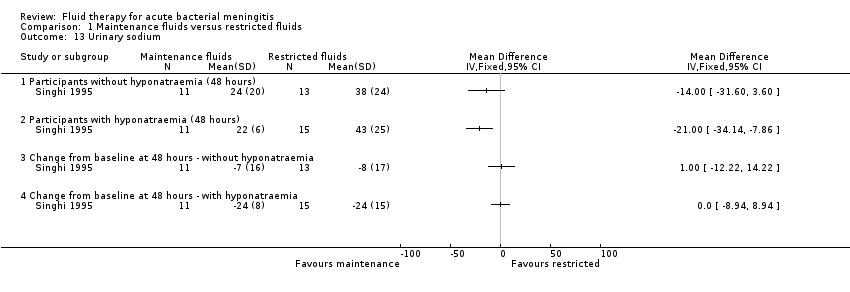
Comparison 1 Maintenance fluids versus restricted fluids, Outcome 13 Urinary sodium.

Comparison 1 Maintenance fluids versus restricted fluids, Outcome 14 Plasma osmolality ‐ change after 48 hours.
| Maintenance fluids versus restricted fluids for acute bacterial meningitis | |||||
| Patient or population: paediatric patients with acute bacterial meningitis Settings: hospital inpatient department Intervention: maintenance fluids Comparison: restricted fluids | |||||
| Outcomes | Illustrative comparative risks* (95% CI) | Relative effect | No of participants | Quality of the evidence | |
| Assumed risk | Corresponding risk | ||||
| Restricted fluids | Maintenance fluids | ||||
| Death ‐ all participants | Study population | RR 0.82 (0.53 to 1.27) | 407 | ⊕⊕⊝⊝ | |
| 186 per 1000 | 153 per 1000 (99 to 237) | ||||
| Moderate risk population | |||||
| 213 per 1000 | 175 per 1000 (113 to 271) | ||||
| Severe neurological sequelae ‐ acute (within the first 4 weeks) | Study population | RR 0.67 | 407 | ⊕⊕⊝⊝ | |
| 176 per 1000 | 118 per 1000 (72 to 191) | ||||
| Moderate risk population | |||||
| 252 per 1000 | 169 per 1000 (103 to 272) | ||||
| Severe neurological sequelae ‐ chronic (after the first 4 weeks) | Study population | RR 0.42 | 351 | ⊕⊝⊝⊝ | |
| 121 per 1000 | 51 per 1000 (24 to 108) | ||||
| Moderate risk population | |||||
| 121 per 1000 | 51 per 1000 (24 to 108) | ||||
| *The basis for the assumed risk (e.g. the median control group risk across studies) is provided in footnotes. The corresponding risk (and its 95% confidence interval) is based on the assumed risk in the comparison group and the relative effect of the intervention (and its 95% CI). | |||||
| GRADE Working Group grades of evidence | |||||
| 1 Total number of events is small and 95% CI around pooled estimate includes both appreciable benefit and harms. | |||||
| Outcome or subgroup title | No. of studies | No. of participants | Statistical method | Effect size |
| 1 Death Show forest plot | 2 | Risk Ratio (M‐H, Fixed, 95% CI) | Subtotals only | |
| 1.1 All participants | 2 | 407 | Risk Ratio (M‐H, Fixed, 95% CI) | 0.82 [0.53, 1.27] |
| 1.2 Participants with hyponatraemia | 1 | 26 | Risk Ratio (M‐H, Fixed, 95% CI) | 0.15 [0.01, 2.50] |
| 1.3 Participants without hyponatraemia | 1 | 24 | Risk Ratio (M‐H, Fixed, 95% CI) | 0.79 [0.16, 3.90] |
| 2 Severe neurological sequelae Show forest plot | 2 | Risk Ratio (M‐H, Fixed, 95% CI) | Subtotals only | |
| 2.1 Acute (within the first 4 weeks) | 2 | 407 | Risk Ratio (M‐H, Fixed, 95% CI) | 0.67 [0.41, 1.08] |
| 2.2 Chronic (after the first 4 weeks) | 1 | 351 | Risk Ratio (M‐H, Fixed, 95% CI) | 0.42 [0.20, 0.89] |
| 2.3 Participants without hyponatraemia | 1 | 24 | Risk Ratio (M‐H, Fixed, 95% CI) | 0.59 [0.13, 2.64] |
| 2.4 Participants with hyponatraemia | 1 | 26 | Risk Ratio (M‐H, Fixed, 95% CI) | 0.91 [0.34, 2.47] |
| 3 Mild to moderate neurological sequelae Show forest plot | 1 | Risk Ratio (M‐H, Fixed, 95% CI) | Totals not selected | |
| 3.1 At 14 days | 1 | Risk Ratio (M‐H, Fixed, 95% CI) | 0.0 [0.0, 0.0] | |
| 4 Hemiparesis/hemiplegia Show forest plot | 1 | Risk Ratio (M‐H, Fixed, 95% CI) | Totals not selected | |
| 4.1 At 14 days | 1 | Risk Ratio (M‐H, Fixed, 95% CI) | 0.0 [0.0, 0.0] | |
| 5 Spasticity Show forest plot | 1 | Risk Ratio (M‐H, Fixed, 95% CI) | Totals not selected | |
| 5.1 At 14 days | 1 | Risk Ratio (M‐H, Fixed, 95% CI) | 0.0 [0.0, 0.0] | |
| 6 Seizures Show forest plot | 1 | Risk Ratio (M‐H, Fixed, 95% CI) | Totals not selected | |
| 6.1 Within the first 72 hours | 1 | Risk Ratio (M‐H, Fixed, 95% CI) | 0.0 [0.0, 0.0] | |
| 6.2 At 14 days | 1 | Risk Ratio (M‐H, Fixed, 95% CI) | 0.0 [0.0, 0.0] | |
| 7 Visual impairment Show forest plot | 1 | Risk Ratio (M‐H, Fixed, 95% CI) | Totals not selected | |
| 7.1 At 14 days | 1 | Risk Ratio (M‐H, Fixed, 95% CI) | 0.0 [0.0, 0.0] | |
| 8 No response to sound Show forest plot | 1 | Risk Ratio (M‐H, Fixed, 95% CI) | Totals not selected | |
| 8.1 At 14 days | 1 | Risk Ratio (M‐H, Fixed, 95% CI) | 0.0 [0.0, 0.0] | |
| 9 Oedema Show forest plot | 1 | Risk Ratio (M‐H, Fixed, 95% CI) | Totals not selected | |
| 9.1 Acute facial oedema | 1 | Risk Ratio (M‐H, Fixed, 95% CI) | 0.0 [0.0, 0.0] | |
| 9.2 Acute pulmonary oedema | 1 | Risk Ratio (M‐H, Fixed, 95% CI) | 0.0 [0.0, 0.0] | |
| 9.3 Acute hydrocephalus | 1 | Risk Ratio (M‐H, Fixed, 95% CI) | 0.0 [0.0, 0.0] | |
| 10 Total body water ‐ fall after 48 hours Show forest plot | 1 | Mean Difference (IV, Fixed, 95% CI) | Totals not selected | |
| 10.1 Participants without hyponatraemia | 1 | Mean Difference (IV, Fixed, 95% CI) | 0.0 [0.0, 0.0] | |
| 10.2 Participants with hyponatraemia | 1 | Mean Difference (IV, Fixed, 95% CI) | 0.0 [0.0, 0.0] | |
| 11 Extracellular water ‐ fall after 48 hours Show forest plot | 1 | Mean Difference (IV, Fixed, 95% CI) | Totals not selected | |
| 11.1 Participants without hyponatraemia | 1 | Mean Difference (IV, Fixed, 95% CI) | 0.0 [0.0, 0.0] | |
| 11.2 Participants with hyponatraemia | 1 | Mean Difference (IV, Fixed, 95% CI) | 0.0 [0.0, 0.0] | |
| 12 Serum sodium Show forest plot | 2 | Mean Difference (IV, Fixed, 95% CI) | Totals not selected | |
| 12.1 All participants (24 hours) | 1 | Mean Difference (IV, Fixed, 95% CI) | 0.0 [0.0, 0.0] | |
| 12.2 Participants with hyponatraemia (48 hours) | 1 | Mean Difference (IV, Fixed, 95% CI) | 0.0 [0.0, 0.0] | |
| 12.3 Participants without hyponatraemia (48 hours) | 1 | Mean Difference (IV, Fixed, 95% CI) | 0.0 [0.0, 0.0] | |
| 12.4 Change from baseline at 48 hours ‐ without hyponatraemia | 1 | Mean Difference (IV, Fixed, 95% CI) | 0.0 [0.0, 0.0] | |
| 12.5 Change from baseline at 48 hours ‐ with hyponatraemia | 1 | Mean Difference (IV, Fixed, 95% CI) | 0.0 [0.0, 0.0] | |
| 13 Urinary sodium Show forest plot | 1 | Mean Difference (IV, Fixed, 95% CI) | Totals not selected | |
| 13.1 Participants without hyponatraemia (48 hours) | 1 | Mean Difference (IV, Fixed, 95% CI) | 0.0 [0.0, 0.0] | |
| 13.2 Participants with hyponatraemia (48 hours) | 1 | Mean Difference (IV, Fixed, 95% CI) | 0.0 [0.0, 0.0] | |
| 13.3 Change from baseline at 48 hours ‐ without hyponatraemia | 1 | Mean Difference (IV, Fixed, 95% CI) | 0.0 [0.0, 0.0] | |
| 13.4 Change from baseline at 48 hours ‐ with hyponatraemia | 1 | Mean Difference (IV, Fixed, 95% CI) | 0.0 [0.0, 0.0] | |
| 14 Plasma osmolality ‐ change after 48 hours Show forest plot | 1 | Mean Difference (IV, Fixed, 95% CI) | Totals not selected | |
| 14.1 Participants without hyponatraemia | 1 | Mean Difference (IV, Fixed, 95% CI) | 0.0 [0.0, 0.0] | |
| 14.2 Participants with hyponatraemia | 1 | Mean Difference (IV, Fixed, 95% CI) | 0.0 [0.0, 0.0] | |