Fluid therapy for acute bacterial meningitis
Abstract
Background
Acute bacterial meningitis remains a disease with high mortality and morbidity rates. However, with prompt and adequate antimicrobial and supportive treatment, the chances for survival have improved, especially among infants and children. Careful management of fluid and electrolyte balance is an important supportive therapy. Both over‐ and under‐hydration are associated with adverse outcomes.
Objectives
To evaluate treatment of acute bacterial meningitis with differing volumes of initial fluid administration (up to 72 hours after first presentation) and the effects on death and neurological sequelae.
Search methods
We searched the Cochrane Central Register of Controlled Trials (CENTRAL) (2013, Issue 10), MEDLINE (1966 to October week 5, 2013), EMBASE (1980 to November 2013), CINAHL (1981 to November 2013), LILACS (1982 to November 2013) and Web of Science (2010 to 2013).
Selection criteria
Randomised controlled trials (RCTs) of differing volumes of fluid given in the initial management of bacterial meningitis were eligible for inclusion.
Data collection and analysis
For this update we identified two abstracts, but after obtaining full texts we excluded them. Previous searches had identified six trials; on careful inspection three trials (415 children) met the inclusion criteria. All four of the original review authors extracted data and assessed trials for quality (one author, ROW, has died since the original review; see Acknowledgements). We combined data for meta‐analysis using risk ratios (RRs) for dichotomous data or mean difference (MD) for continuous data. We used a fixed‐effect statistical model. We assessed overall evidence quality using the GRADE approach.
Main results
There were no trials in adult populations. All included trials were on paediatric patient groups. The largest of the three trials was conducted in settings with high mortality rates. The meta‐analysis found no significant difference between the maintenance‐fluid and restricted‐fluid groups in number of deaths (RR 0.82, 95% confidence interval (CI) 0.53 to 1.27; 407 participants) (moderate trial quality); acute severe neurological sequelae (RR 0.67, 95% CI 0.41 to 1.08; 407 participants) (very low trial quality); or in mild to moderate sequelae (RR 1.24, 95% CI 0.58 to 2.65; 357 participants) (moderate trial quality). However, when neurological sequelae were defined further, there was a statistically significant difference in favour of the maintenance‐fluid group for spasticity (RR 0.50, 95% CI 0.27 to 0.93; 357 participants); seizures at both 72 hours (RR 0.59, 95% CI 0.42 to 0.83; 357 participants) and 14 days (RR 0.19, 95% CI 0.04 to 0.88; 357 participants); and chronic severe neurological sequelae at three months follow‐up (RR 0.42, 95% CI 0.20 to 0.89; 351 participants).
Authors' conclusions
The quality of evidence regarding fluid therapy in children with acute bacterial meningitis is not high‐grade and there is a need for further research. Some evidence supports maintaining intravenous fluids rather than restricting them in the first 48 hours in settings with high mortality rates and where children present late. However, where children present early and mortality rates are lower, there is insufficient evidence to guide practice.
PICOs
Plain language summary
Fluids for people with acute bacterial meningitis
Review question
We reviewed the evidence about the effect of differing volumes of initial fluid administration (up to 72 hours) on death and various neurological sequelae in people with acute bacterial meningitis.
Background
Bacterial meningitis is an infection of the fluid in the spinal cord and surrounding the brain. Antibiotics are prescribed as treatment. Supportive care includes other drugs and the regulation of fluid intake. Despite treatment, there is a risk of death or long‐term complications from the infection, especially in the youngest and oldest patients.
There has been disagreement as to whether fluids should be restricted (hormones secreted by very ill patients reduce normal fluid output by the body). There are potential risks from giving too much fluid (especially brain swelling) as well as too little fluid (especially shock).
Study characteristics
The evidence is current to November 2013. We did not find any trials in adult populations. We included three trials involving 415 children (over 350 of whom were in a single trial). All trials were set in countries where death rates are high and where patients seek help late.
In one study no funding source was mentioned. The remaining two studies were funded jointly by pharmaceutical concerns with government agencies and a charitable agency.
Key results
Analysis of available trials found no significant differences in death rates or overall effects on neurological function, either immediately or later. However, for acute neurological sequelae, one study found a significantly lower rate of seizures and spasticity (abnormal body tone) in children receiving normal amounts of fluid compared to those receiving restricted fluids. There was also some evidence favouring maintenance fluid therapy over restricted fluids for chronic severe neurological events at three months follow‐up.
An adverse effect in children with restricted fluid intake was that they were less likely to have low levels of sodium in their blood and therefore they would experience greater reductions in body fluids.
An adverse effect of unrestricted fluid administration was reported in one study as short‐term swelling of the face and low blood sodium levels one to two days after fluids were started, although the largest study found no difference in blood sodium levels.
No studies reported important healthcare outcomes like duration of hospital stay, raised intracranial pressure and status epilepticus. The review found limited evidence from these trials in support of not restricting fluids in settings with high mortality rates. As there were no trials in other settings, there is no evidence to guide clinicians when children with meningitis present early in settings with low mortality rates. There is no evidence to guide clinicians about fluid therapy in adult patients with acute bacterial meningitis.
Quality of the evidence
The quality of evidence was moderate for the outcomes of death, chronic severe neurological sequelae and mild to moderate neurological sequelae. The quality of evidence was very low for acute severe neurological sequelae.
Authors' conclusions
Summary of findings
| Maintenance fluids versus restricted fluids for acute bacterial meningitis in paediatric populations | ||||||
| Patient or population: patients with acute bacterial meningitis in paediatric populations 1 | ||||||
| Outcomes | Illustrative comparative risks* (95% CI) | Relative effect | No. of participants | Quality of the evidence | Comments | |
| Assumed risk | Corresponding risk | |||||
| Control | Maintenance fluids versus restricted fluids | |||||
| Death ‐ all patients | Study population | RR 0.82 | 407 | ⊕⊕⊕⊝ | ||
| 186 per 1000 | 153 per 1000 | |||||
| Moderate | ||||||
| 213 per 1000 | 175 per 1000 | |||||
| Severe neurological sequelae ‐ acute (within the first 4 weeks) | Study population | RR 0.67 | 407 | ⊕⊝⊝⊝ | ||
| 176 per 1000 | 118 per 1000 | |||||
| Moderate | ||||||
| 252 per 1000 | 169 per 1000 | |||||
| Severe neurological sequelae ‐ chronic (after the first 4 weeks) | Study population | RR 0.42 | 351 | ⊕⊕⊕⊝ | ||
| 121 per 1000 | 51 per 1000 | |||||
| Moderate | ||||||
| 121 per 1000 | 51 per 1000 | |||||
| Mild to moderate neurological sequelae | Study population | RR 1.24 | 357 | ⊕⊕⊕⊝ | ||
| 62 per 1000 | 78 per 1000 | |||||
| Moderate | ||||||
| 63 per 1000 | 78 per 1000 | |||||
| *The basis for the assumed risk (e.g. the median control group risk across studies) is provided in footnotes. The corresponding risk (and its 95% Confidence Interval) is based on the assumed risk in the comparison group and the relative effect of the intervention (and its 95% CI). | ||||||
| GRADE Working Group grades of evidence | ||||||
| 1 No studies were found comparing different intravenous fluid regimens in adult populations in the systematic review. | ||||||
Background
Description of the condition
Acute bacterial meningitis remains a disease with high mortality and morbidity rates. The outcome in individuals with bacterial meningitis is correlated with many factors, including the age of the person, time and clinical stability before effective antibiotic treatment is begun, type of micro‐organism, number of bacteria or quantity of active bacterial products in the cerebrospinal fluid (CSF) at the time of diagnosis, intensity of the host's inflammatory response and time elapsed to sterilise cerebral spinal fluid cultures (Feldman 1977; Mustafa 1990; Saez‐Llorens 1990; Waage 1987).
Description of the intervention
The highest rates of mortality and morbidity occur in the neonatal period and in the elderly. Nearly one in four adults with the illness will die, and many survivors sustain neurological deficits (Bohr 1983; Pfister 1993). Morbidity and mortality are high in neonates, infants and children. In fact, bacterial meningitis causes more than 100,000 deaths worldwide each year in infants and young children (Duke 1998). A 1993 meta‐analysis examined the overall and organism‐specific frequencies of death and persistent neurological sequelae in children two months to 19 years of age (Baraff 1993). A total of 4920 children with acute bacterial meningitis were included in 45 reports that met the inclusion criteria. Children described in the 19 reports of prospectively‐enrolled cohorts from high‐income countries had lower mortality than the children included in trials from low‐income countries (4.8% versus 8.1%) and were more likely to have no sequelae (82.5% versus 73.9%). A further study that examined the long‐term consequences of having meningitis during the first year of life found that 1.8% of children died within five years (Bedford 2001). Not only did almost a fifth of children with meningitis have a subsequent permanent, severe or moderately severe disability but subtle deficits were also more prevalent.
How the intervention might work
The chances for survival are improved with prompt and adequate antimicrobial and supportive treatment, especially in infants and children, for whom case fatality rates have been reduced to less than 10% for bacterial meningitis and less than 5% for meningococcal meningitis (Saez‐Llorens 2003). Two Cochrane reviews examine the effectiveness and safety of steroids and different antibiotic regimens, respectively, which are used in the treatment of acute bacterial meningitis (Brouwer 2013; Prasad 2007).
Careful management of fluid and electrolyte balance is also important in the treatment of meningitis. Over‐ or under‐hydration are associated with adverse outcomes. Fluid restriction in the initial management of meningitis in children has been widely advocated (Conner 1980; Feigin 1992). However, this has also been challenged (Conner 1980; Powell 1990; Singhi 1995). The practice of fluid restriction is based on reports of hyponatraemia (lower than normal concentration of sodium in the extracellular fluid/blood) that is attributed to increased concentrations of circulating antidiuretic hormone (ADH) (a hormone that prevents excretion of water from the body). Over 50% of children have hyponatraemia at the time of admission (Kaplan 1983). There are associations between the degree of hyponatraemia and the presence of seizures and severity of acute disease, and adverse neurodevelopmental outcomes (Feigin 1977). These findings have subsequently been linked with a high incidence of cerebral oedema (swelling of the brain) in those who die from acute bacterial meningitis (Conner 1980; Dodge 1965; Williams 1964), and it has been suggested that inappropriately increased concentrations of ADH lead to water retention, which in turn exacerbates cerebral swelling. Some researchers have concluded that fluid restriction will avoid exacerbating cerebral oedema and may improve neurological outcome (Brown 1994).
However, clinical dehydration has also been found in children with acute bacterial meningitis without any accompanying significant risk of mortality (Duke 1998). It has also been found that in children who received maintenance fluid plus replacement of volume deficits the high ADH concentrations normalised over 24 hours; in those who were restricted to two‐thirds maintenance fluids ADH concentrations remained high (Powell 1990). The conclusion from this was that ADH concentrations are increased in children with meningitis because of hypovolaemia (a decrease in the volume of circulating blood) and only become normal when sufficient sodium and fluid are given.
Why it is important to do this review
Although it is widely accepted that hyponatraemia is a marker of severe disease in childhood bacterial meningitis, there are different opinions regarding the cause of hyponatraemia at the time of presentation. If dehydration, rather than inappropriately increased antidiuresis, is the major factor in the pathogenesis of hyponatraemia in meningitis then the rationale for fluid restriction is open to question.
Objectives
To evaluate treatment of acute bacterial meningitis with differing volumes of initial fluid administration (up to 72 hours after first presentation) and the effects on death and neurological sequelae.
Methods
Criteria for considering studies for this review
Types of studies
Randomised controlled trials (RCTs) examining the effectiveness of different volumes of initial fluid administration in the treatment of acute bacterial meningitis were eligible for inclusion. We planned to consider trials of fluids administered to treat shock at presentation but we found no such trials.
Types of participants
All age groups with a diagnosis of acute bacterial meningitis, made either by clinical diagnosis or culture of cerebrospinal fluid (obtained at lumbar puncture) were eligible for inclusion.
Types of interventions
-
Fluid administered in the initial treatment of acute bacterial meningitis; irrespective of route of administration, type or volume of fluid.
-
Comparisons of the initial volume of fluid administered in the treatment of acute bacterial meningitis, irrespective of route of administration, or type of fluid or duration of fluid restriction.
Types of outcome measures
Primary outcomes
-
Death
-
Short‐term (within the first four weeks of illness) and long‐term (persisting after the first four weeks of illness) neurological sequelae
Secondary outcomes
-
Oedema (including cerebral)
-
Total body water
-
Extracellular water
-
Serum and urinary sodium
-
Plasma and urinary osmolality
-
Duration of hospital stay
-
Raised intracranial pressure
-
Status epilepticus
Search methods for identification of studies
Electronic searches
For this update we searched the Cochrane Central Register of Controlled Trials (CENTRAL) 2013, Issue 10, part of The Cochrane Library, www.thecochranelibrary.com (accessed 7 November 2013), which includes the Cochrane Acute Respiratory Infections Group's Specialised Register, MEDLINE (July 2010 to October week 5, 2013), EMBASE (August 2010 to November 2013), CINAHL (August 2010 to November 2013), LILACS (1982 to November 2013) and Web of Science (2010 to November 2013). See Appendix 1 and Appendix 2 for details of earlier searches.
We used the following search strategy to search CENTRAL and MEDLINE for this update. The MEDLINE search was combined with the Cochrane Highly Sensitive Search Strategy for identifying randomised trials in MEDLINE: sensitivity‐ and precision‐maximising version (2008 revision); Ovid format (Lefebvre 2011). The search strategy was adapted to search EMBASE (Appendix 3), CINAHL (Appendix 4), LILACS (Appendix 5) and Web of Science (Appendix 6).
MEDLINE (Ovid)
1 Meningitis/
2 exp Meningitis, Bacterial/
3 exp Meningococcal Infections/
4 exp Pneumococcal Infections/
5 exp Neisseria meningitidis/
6 exp Escherichia coli Infections/
7 ("escherichia coli" or "e coli").tw.
8 Listeria monocytogenes/ or Meningitis, Listeria/
9 "listeria monocytogenes".tw.
10 Haemophilus influenzae type b/
11 haemophilus infections/ or meningitis, haemophilus/
12 ((haemophilus or hemophilus or hib) adj2 (mening* or infect*)).tw.
13 Streptococcus agalactiae/
14 ("streptococcus group b" or "streptococcus agalactiae").tw.
15 (meningit* or meningococ*).tw.
16 or/1‐15
17 exp Fluid Therapy/
18 exp Body Fluids/
19 fluid*.tw.
20 solutions/ or exp hypertonic solutions/ or isotonic solutions/ or rehydration solutions/
21 solution*.tw.
22 (rehydrat* or dehydrat* or hydrat*).tw.
23 Sodium Chloride/
24 (saline* or sodium*).tw,nm.
25 hyponatr*.tw.
26 exp Infusions, Parenteral/
27 (parenteral adj2 (infusion* or solution*)).tw.
28 Water Deprivation/
29 exp Water‐Electrolyte Balance/
30 exp Water‐Electrolyte Imbalance/
31 electrolyt*.tw,nm.
32 exp Albumins/
33 albumin*.tw,nm.
34 exp Plasma/
35 exp Plasma Substitutes/
36 plasma*.tw.
37 (starch* or dextran* or gelofus* or haemacc* or hemacc*).tw,nm.
38 or/17‐37
39 16 and 38
Searching other resources
We searched references from relevant articles and contacted trial authors where necessary. In addition, we contacted experts in the field for unpublished works. We searched the following trial registers: ClinicalTrials.gov (6 November 2013), WHO ICTRP (6 November 2013), National Health and Medical Research Council (NHMRC) Clinical Trials Register, and Meta‐Register. We attempted to contact authors of all identified trials, whether open or unpublished. We sought publications in the literature that described, or may have described, the use of fluid therapy for the treatment of acute bacterial meningitis. We applied no language or publication status restrictions. We searched the citation lists of relevant publications, review articles, abstracts of scientific meetings and included both published and unpublished studies.
Data collection and analysis
Selection of studies
For this update two review authors (SB, IM) independently screened all the search results for consideration of inclusion as per eligibility criteria based on title, abstract and key words initially, and then after accessing full texts. Any disagreements were to be resolved by consensus, with the Review Group Editor acting as an arbiter. For previous versions of this review two review authors (HB, IM) undertook study selection after running the search strategies outlined above. Both review authors had independently assessed whether the studies met the inclusion criteria; any discrepancies then were to be resolved by a third author (ROW, see Acknowledgements) but this proved unnecessary.
We sought further information from the trial authors where papers contained insufficient information to make a decision about eligibility. We had to do this for two studies which we excluded based on these communications (Characteristics of excluded studies).
Data extraction and management
We collected information regarding location of the study, methods of the study (as per quality assessment checklist), participant characteristics (age range, eligibility criteria), types of interventions and outcomes for each included trial. Where possible, we sought missing data from the trial authors. Four review authors previously (IM, HB, MS (see Acknowledgements), ROW) independently performed data extraction. Any discrepancies were to be resolved by discussion but this proved unnecessary.
Assessment of risk of bias in included studies
We assessed the risk of bias in the included studies using the criteria described in the Cochrane Handbook for Systematic Reviews of Interventions (Higgins 2011). Two review authors independently extracted information about selection bias (random sequence generation and allocation concealment), detection bias (blinding of outcome assessment), attrition bias (incomplete outcome data), reporting bias (selective reporting), sample size, and exclusions after randomisation, and any other sources of bias .
Measures of treatment effect
We analysed each dichotomous outcome for effect in terms of a risk ratio (RR) with a 95% confidence interval (CI) and combined the outcomes for meta‐analysis using Review Manager 5 software (RevMan 2012). Where data were sufficient, we calculated a summary statistic for each outcome using a fixed‐effect model.
We analysed continuous outcomes as mean differences (MDs) between groups and 95% CIs. Where data was sufficient we used a fixed‐effect approach in the meta‐analysis.
Unit of analysis issues
We did not include any studies with non‐standard designs. The comparisons under consideration would not lend themselves to cluster‐randomised or other similar designs.
Dealing with missing data
Where there were missing participants due to drop‐out, we searched for the use of an intention‐to‐treat (ITT) analysis by the trial authors and reported this in the review. Where there were missing statistics (such as standard deviations or correlation coefficients) that made analysis impossible, we approached the trial authors. Where there remained missing data, we report this in the review.
Assessment of heterogeneity
We determined statistical heterogeneity by a combination of visual inspection of graphs of risk ratios (RRs) as well as using the I² statistic (Higgins 2003), and the Chi² test.
Assessment of reporting biases
We had intended to investigate for publication bias and other reporting biases initially by the use of funnel plots. However, as there were only three included studies, we were unable to do so.
Data synthesis
We entered and analysed all data using Review Manager 5 software (RevMan 2012). We discuss methods of analyses for subgroup analysis, investigation of heterogeneity and sensitivity analyses in the relevant sections .
Subgroup analysis and investigation of heterogeneity
We had planned that if there were a sufficient number of trials of adequate size, with the required information recorded in the trial publication, we would conduct subgroup analyses on the following:
-
age;
-
volume of fluid administered;
-
organism causing the meningitis;
-
hypoperfusion status at enrolment; and
-
clinical diagnosis versus laboratory‐confirmed diagnosis.
We assessed clinical heterogeneity by establishing the overall mortality rates and duration of symptoms where possible. We used this to distinguish between participants studied in different health settings. We did not deem meta‐analysis appropriate where it was evident that studies were undertaken in different health contexts.
Sensitivity analysis
We had planned to perform an a priori sensitivity analysis on results to look at the possible contribution of differences in methodological quality but we were unable to do this due to the paucity of trials.
Summarising and interpreting results
For this update two authors (SB, IM) used the GRADE approach to interpret the findings (Schunemann 2011). We used the GRADE profiler software (GRADE 2012) and imported data from RevMan 2012 to create a summary of findings Table for the main comparison. The table provided information about the overall quality of evidence from trials, the magnitude of effect of the interventions as well as the sum of the available data for the primary outcomes.
Results
Description of studies
Results of the search
For this update, with duplicates removed (including duplicates of the records sent in 2010) there were 496 search results. We removed animal studies (n = 49) and screened 447 search results. We excluded 445 search results on the basis of title or abstract and two on the basis of full‐text inspection. We did not find any studies in the grey literature. Reasons for their exclusion are given in the Characteristics of excluded studies table.
In the previous review update, six abstracts identified in the search initially appeared to fit the inclusion criteria for the review. After obtaining the full papers, we excluded three of these, leaving three trials eligible for inclusion (415 children). In the 2010 update, we retrieved 105 records from the search of the electronic databases. We did not find any new included trials for that update. We identified a further 91 records in this 2013 search.
Included studies
1. Trial design characteristics
a) Volume and constitution of fluid
The first trial (Duke 2002) compared milk‐based fluids delivered at 60% of that required for maintenance fluids with 100% of normal maintenance fluids. Maintenance fluids were defined as "100 ml/kg/day for the first 10 kg of body weight, 50 ml/kg for the second 10 kg, and 20 ml/kg for over 20 kg". The milk‐based fluids comprised expressed breast milk or other milk feed given via a nasogastric tube for at least 48 hours, or longer with reduced conscious state, convulsions, impaired upper airway reflexes or persistent respiratory distress. Normal maintenance fluids (defined as above) of a solution containing 0.45% sodium chloride and 5% dextrose plus 10 mmol/L of potassium chloride per litre were delivered intravenously for at least the first 48 hours.
The second trial (Powell 1990) compared two‐thirds of required maintenance fluids (similarly defined as "100 ml/kg for the first 10 kg of body weight, plus 50 ml/kg for the next 10 kg (10 kg to 20 kg), plus 20 ml/kg for each kilogram in excess of 20 kg") with full maintenance fluids, plus replacement fluids for any estimated deficit over 24 hours. Rehydration was begun by administering 10 or 15 ml/kg by rapid intravenous infusion. Fluids were given intravenously with the composition determined by the attending consultant.
The third trial (Singhi 1995) compared restricted fluids at 65% of the calculated maintenance fluid requirement with maintenance fluid requirements (110 ml/kg for first 10 kg, 50 ml/kg for next 10 kg and 25 ml/kg for subsequent weight), both given intravenously. The restricted fluids comprised one‐fifth normal saline in 5% dextrose for 24 hours, followed by "a gradual liberalisation at a rate of 10 ml/kg over eight hours, if, after 24 hours of hospital stay, the serum sodium and plasma osmolality had returned to normal and there were no clinical signs of dehydration".
b) Duration of fluid therapy
One study administered fluids for 48 hours (Duke 2002); one study administered fluids for 24 hours (Powell 1990); and the third study administered fluid for 24 hours with a gradual increase thereafter until children in both arms received the full normal maintenance requirement after 48 hours (Singhi 1995).
2. Baseline characteristics of participants
a) Age
All studies included only children. One study included children between one month and 12 years of age (Duke 2002), the second included children between three months and 16 years (Powell 1990), and the third included children between two months and seven years of age (Singhi 1995).
b) Health status
The children in the study carried out in Papua New Guinea (Duke 2002) were from a population in which 25% were undernourished at the time of their presentation. In regard to the meningitis symptoms, the mean duration of symptoms was six days, with two‐thirds of children having convulsions, before presentation; 20% of the children were hypoglycaemic.
The second study (Powell 1990) gave no specific details but said that they only enrolled "previously healthy children". Malnourished children were excluded from the Singhi 1995 study and children had a duration of symptoms ranging from one to 10 days on presentation.
c) Diagnostic techniques used to establish a diagnosis of bacterial meningitis
The first study (Duke 2002) made a diagnosis according to clinical signs of meningitis and a cloudy or turbid cerebrospinal fluid (CSF) with a moderate or large number of leucocytes and amount of protein, determined by dipstick testing (Multistix‐10‐SG, Bayer Australia Ltd, Sydney, Australia). The second study (Powell 1990) diagnosed meningitis on the basis of clinical examination, CSF cytology and chemical studies. The final study (Singhi 1995) made a diagnosis on a suggestive history, physical examination and CSF findings of hypoglycorrhachia, increased protein concentration and polymorphonuclear leucocytosis.
3. Studied outcomes
a) Death
Two studies reported death as an outcome (Duke 2002; Singhi 1995). Personal communication with the lead author of the third study (Powell 1990) reported no fatalities.
b) Short‐term (within the first four weeks of illness) and long‐term (persisting after the first four weeks of illness) neurological sequelae
Two studies reported acute neurological sequelae (Duke 2002; Singhi 1995). One of these studies also reported individual neurological components at 14 days (spasticity, hemiparesis/hemiplegia, visual impairment and no response to sound) and neurological sequelae at three months (Duke 2002).
c) Seizures
One study reported the incidence of seizures at both 72 hours and 14 days (Duke 2002). For this 2014 update, "seizures" was not treated as a separate secondary outcome since this outcome is already captured within the primary outcome "acute (short‐term) neurological sequelae".
d) Oedema (including cerebral)
One study reported facial oedema, pulmonary oedema and hydrocephalus (Duke 2002).
e) Total body water
One study reported total body water as an outcome (Singhi 1995).
f) Extracellular water
One study reported extracellular water as an outcome (Singhi 1995).
g) Serum and urinary sodium
Two studies (Powell 1990; Singhi 1995) reported comparisons of mean serum‐sodium concentrations. The third (Duke 2002) reported the proportion of children with serum‐sodium concentrations below 130 mmol/litre at 72 hours. One study reported urinary sodium as an outcome (Singhi 1995).
h) Plasma and urinary osmolality
One study reported plasma and urinary osmolality as an outcome (Singhi 1995).
i) Duration of hospital stay
No study reported duration of hospital stay as an outcome.
j) Raised intracranial pressure
No study reported on raised intracranial pressure.
k) Status epilepticus
No study reported on incidence of status epilepticus.
Excluded studies
Three studies were excluded as they were not RCTs (Brown 1994; Duke 1998; Floret 1999), one study was excluded because the interventions and comparators were not relevant (Berkley 2004) and another study was excluded because insufficient data on culture‐positive bacterial meningitis were available (Maitland 2013).
Risk of bias in included studies
A graphical representation of the risk of bias for the included studies is shown in Figure 1. A summary of methodological quality of the included trials is given in Figure 2.

Risk of bias graph: review authors' judgements about each risk of bias item presented as percentages across all included studies.
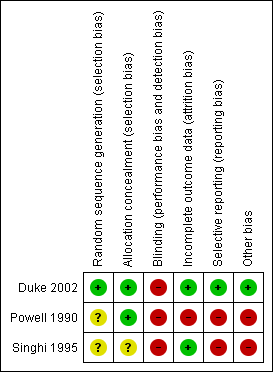
Risk of bias summary: review authors' judgements about each risk of bias item for each included study.
Allocation
Two studies used opaque, sealed, sequentially‐numbered envelopes (Duke 2002; Powell 1990). The remaining study used a random numbers table (Singhi 1995). Two trials displayed adequate allocation concealment (Duke 2002; Powell 1990). The quality of allocation concealment in the third study was unclear (Singhi 1995).
Blinding
Two studies had no blinding (Duke 2002; Powell 1990). It was unclear whether or not there was blinding in the remaining study (Singhi 1995).
Power calculations
Two studies documented power calculations (Duke 2002; Singhi 1995). One calculated a required participation of 354 to detect a one‐third reduction in adverse outcomes (Duke 2002). The study randomised 357 and analysed results for 346 children immediately at completion of treatment. The second study calculated that 31 children in each group were needed to detect a 25% change in intact survival rate from 50%, with a significance of 0.05 (Singhi 1995). This study was terminated early but enrolled 25 in each group.
Number of centres
One study had three participating centres (Duke 2002). The remaining two were single‐centre studies (Powell 1990; Singhi 1995).
Intention‐to‐treat (ITT) analysis
No study reported an ITT analysis.
Incomplete outcome data
The largest study had relatively small numbers of drop‐outs (11 of 357 enrolled children) by the end of treatment, when most of the outcomes were measured (Duke 2002). By three months from diagnosis there were over 10% drop‐outs.
The second study had five exclusions from 24 children enrolled, and this would have introduced the possibility of significant bias (Powell 1990). The third study (Singhi 1995) had no drop‐outs.
Selective reporting
There was no evidence of selective reporting of data in one study (Duke 2002). Both short‐term and longer‐term morbidities were reported. Powell 1990 only reported short‐term sodium levels. Singhi 1995 only reported total numbers with short‐term neurological impairment and did not attempt to break these down by type of impairment.
Other potential sources of bias
The main concern was the marked discrepancy in size between the largest study and the two other very small RCTs. The Singhi 1995 trial was stopped prematurely owing to observance of "a trend toward poor outcome in the restricted‐fluid group", and this is also a potential source of bias.
Effects of interventions
Primary outcomes
1. Death
All participants, regardless of serum sodium at enrolment
The meta‐analysis of the three studies (Duke 2002; Powell 1990; Singhi 1995) (415 children) for deaths, where one study reported no fatality amongst their participants (Powell 1990), found no significant difference between deaths in the maintenance‐fluid and restricted‐fluid groups; risk ratio (RR) 0.82, 95% confidence interval (CI) 0.53 to 1.27 (Analysis 1.1.1).
Participants with or without hyponatraemia
The study (Singhi 1995) that subdivided maintenance‐fluid and restricted‐fluid groups into children with or without hyponatraemia at presentation found no significant difference in death rates in either those presenting with hyponatraemia (26 children) or those without hyponatraemia (24 children). With hyponatraemia, the RR for children given the two different fluid intakes was RR 0.15, 95% CI 0.01 to 2.50 (Analysis 1.1.2); without hyponatraemia, the RR was 0.79, 95% CI 0.16 to 3.90 (Analysis 1.1.3).
2. Short‐term (within the first four weeks of illness) and long‐term (persisting after the first four weeks of illness) neurological sequelae
Short‐term neurological sequelae
The meta‐analysis of acute severe neurological sequelae (two studies, 407 children) found no significant difference between the maintenance‐fluids and restricted‐fluids groups (RR 0.67, 95% CI 0.41 to 1.08) (Analysis 1.2.1).
Data on mild to moderate sequelae at 14 days (one study, 357 children) also showed no significant difference between maintenance‐fluid and restricted‐fluid groups (RR 1.24, 95% CI 0.58 to 2.65) (Analysis 1.3.1).
However, when neurological sequelae were categorised further, the available data produced the following results:
-
Hemiparesis/hemiplegia (one study, 357 children): no significant difference between groups (RR 0.97, 95% CI 0.52 to 1.81) (Analysis 1.4.1).
-
Spasticity (one study, 357 children): there was a statistically significant difference in favour of the maintenance‐fluid group (RR 0.50, 95% CI 0.27 to 0.93) (Analysis 1.5.1).
-
Seizures (one study, 357 children): there was a statistically significant difference in seizure activity at both 72 hours (RR 0.59, 95% CI 0.42 to 0.83) and 14 days (RR 0.19, 95% CI 0.04 to 0.88) in favour of the maintenance‐fluid group (Analysis 1.6).
-
Visual impairment and response to sound (one study, 357 children): there was no statistically significant difference in either group. On visual impairment the RR was 0.77, 95% CI 0.44 to 1.35 (Analysis 1.7.1) and on response to sound, RR 0.60, 95% CI 0.25 to 1.41 (Analysis 1.8.1).
Participants with or without hyponatraemia
Analyses of data from participants with and without hyponatraemia at presentation showed no significant difference in acute neurological sequelae for either subgroup. Without hyponatraemia, the RR for children given maintenance fluids or restricted fluids was RR 0.59, 95% CI 0.13 to 2.64 (Analysis 1.2.3); with hyponatraemia, RR 0.91, 95% CI 0.34 to 2.47 (Analysis 1.2.4).
Long‐term neurological sequelae
The data relating to chronic severe neurological sequelae (one study, 351 children) showed a statistically significant difference at three‐month follow‐up in favour of those in the maintenance‐fluid groups RR 0.42, 95% CI 0.20 to 0.89 (Analysis 1.2.2).
Secondary outcomes
1. Oedema (including cerebral)
The data on facial oedema (one study, 357 children) showed a statistically significant difference in favour of the restricted‐fluids group: RR 5.47, 95% CI 2.65 to 11.27. There was no statistically significant difference in either pulmonary oedema (RR 8.75, 95% CI 0.47 to 161.38) or hydrocephalus (RR 0.28, 95% CI 0.06 to 1.32) (Analysis 1.9).
2. Total body water
The data on change in total body water at 48 hours after admission (one study; 24 children without hyponatraemia, 26 children with hyponatraemia) showed a statistically significantly greater reduction in the restricted‐fluids group in both non‐hyponatraemic and hyponatraemic children: MD (meq/litre) 24.50, 95% CI 9.91 to 39.09, and MD (meq/litre) 36.00, 95% CI 19.83 to 52.17, respectively (Analysis 1.10).
3. Extracellular water
The data on reduction in extracellular water at 48 hours after admission (one study; 24 children without hyponatraemia, 26 children with hyponatraemia) showed a greater reduction in the restricted‐fluid groups: non‐significant for non‐hyponatraemic children: MD (meq/litre) 22.90. 95% CI ‐1.11 to 46.91, and a statistically significant change in hyponatraemic children: MD (meq/litre) 35.00, 95% CI 16.86 to 53.14 (Analysis 1.11).
4. Serum and urinary sodium
One study (Duke 2002) reported the proportion of children with serum sodium concentrations below 130 mmol/litre at 72 hours and found no statistically significant difference between the restricted‐fluid and maintenance‐fluid groups: RR 0.72, 95% CI 0.34 to 1.55 (Analysis not shown).
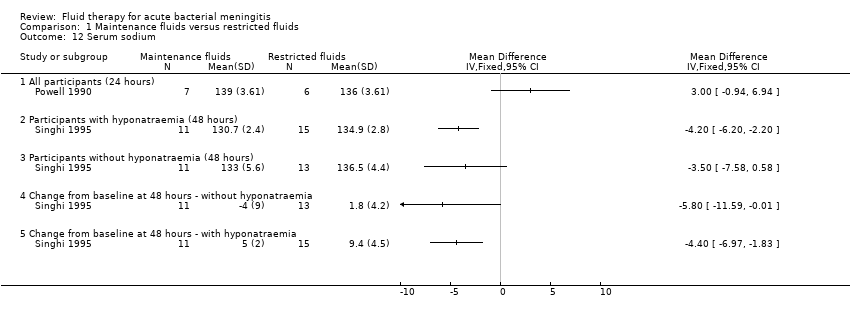
We did not attempt a meta‐analysis of the two studies comparing mean sodium concentrations, as one (Powell 1990) measured serum sodium at 24 hours and the other (Singhi 1995) at 48 hours. The Powell 1990 study (13 children with bacterial meningitis) reported all children together and found no statistically significant difference in mean serum sodium at 24 hours: MD (meq/litre) 3.00, 95% CI ‐0.94 to 6.94. The Singhi 1995 study (one study; 24 children without hyponatraemia, 26 children with hyponatraemia) subgrouped children by hyponatraemia status at study entry. The study found a statistically significant difference in favour of the restricted‐fluid group in children with hyponatraemia (MD (meq/litre) ‐4.20, 95% CI ‐6.20 to ‐2.2). In the original paper the statistical difference in favour of restricted fluids in children without hyponatraemia (MD (meq/litre) ‐3.50, 95% CI ‐7.58 to 0.58, P = 0.09) was reported as statistically significant in the original paper, but this is not the case, as evident from examination of the effect estimate and the 95% CI. This study also found a significant difference in the change in serum sodium from baseline, in favour of the restricted‐fluid group, in children both with and without hyponatraemia. Without hyponatraemia, the MD (meq/litre) was ‐5.8, 95% CI ‐11.59 to ‐0.01; with hyponatraemia, MD (meq/litre) ‐4.40, 95% CI ‐6.97 to ‐1.83 (Analysis 1.12).
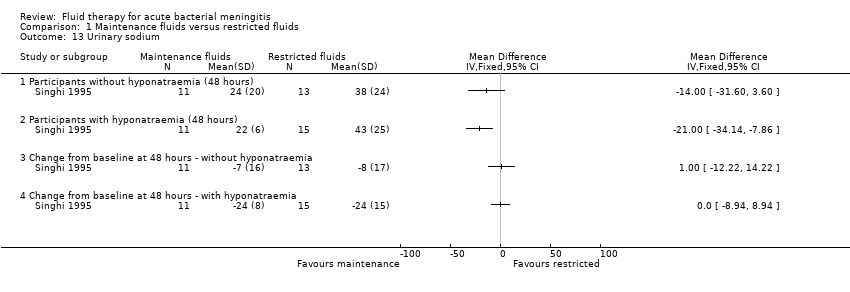
The one study (24 children without hyponatraemia at admission, 26 children with hyponatraemia) that reported urinary sodium found no significant difference at 48 hours in mean urinary sodium in children without hyponatraemia (MD (meq/litre) ‐14.0, 95% CI ‐31.60 to 3.6) but a statistically significant difference in children with hyponatraemia at admission (MD (meq/litre) ‐21.00, 95% CI ‐34.14 to ‐7.86). There was no significant change from baseline at 48 hours either in children without hyponatraemia (MD (meq/litre) 1.00, 95% CI ‐12.22 to 14.22) or with hyponatraemia (MD (meq/litre) 0.0, 95% CI ‐8.94 to 8.94) (Analysis 1.13).
5. Plasma and urinary osmolality
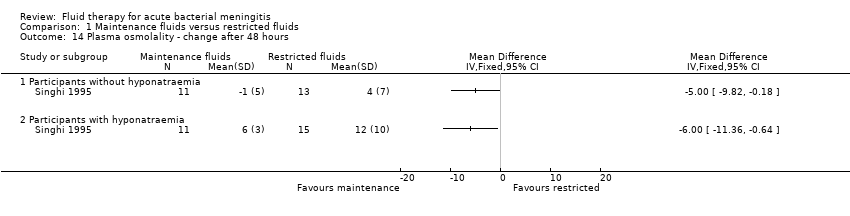
There was a statistically significant difference in the change in plasma osmolality after 48 hours, with a greater increase in the restricted‐fluid group, in both the children presenting without hyponatraemia (one study, 24 children): MD (meq/litre) ‐5.00, 95% CI ‐9.82 to ‐0.18; and children presenting with hyponatraemia (one study, 26 children): MD (meq/litre) ‐6.00, 95% CI ‐11.36 to ‐0.64 (Analysis 1.14).
6. Duration of hospital stay
No study reported on duration of hospital stay.
7. Raised intracranial pressure
No study reported on raised intracranial pressure.
8. Status Epilepticus
No study reported on incidence of status epilepticus.
Discussion
Summary of main results
The small number of studies identified by this review did not show any statistically significant difference in mortality from restricting fluids. Two studies reported high mortality rates overall, well above 10% (Duke 2002; Singhi 1995; 407 children). The third study included very small numbers (19 children analysed), and reported no deaths. Meta‐analysis of the two studies reporting neurological sequelae demonstrated statistically significant reductions in the rates of early spasticity and seizures, and later overall neurological sequelae, in children receiving maintenance fluids. There were no statistically significant differences in overall short‐term neurological sequelae or in risk of hemiparesis, visual or hearing impairment.
Two of the studies (Powell 1990; Singhi 1995) involved very small numbers of children from single centres. The mortality and morbidity results, therefore, are dominated by the Duke 2002 study. The long delays before presentation and a high rate of malnutrition in the children in this study may have been associated with a high rate of dehydration at presentation. The finding of a higher rate of neurological sequelae in the restricted‐fluid group in this study could result from inadequate initial treatment of dehydration. This might not be relevant in settings where patients present earlier.
Overall completeness and applicability of evidence
The three included studies were insufficient to evaluate the review objective of evaluating different volumes of initial fluid administrations on treatment outcomes of acute bacterial meningitis. We did not find any trial answering the review question for adult patients. All the trials were done in in‐hospital settings and no trials were done in primary care or out‐of‐hospital settings, where initial fluid therapy is often instituted, and the patients referred to a tertiary care set‐up for specialised care. Trials done in out‐of‐hospital and primary healthcare settings might be more relevant to low‐ and middle‐income nations, where healthcare delivery is not well monitored and generally unstructured (Maher 2011).
The largest of the three studies (Duke 2002) included multiple outcomes relevant to the review question. Its shortcoming was that it could only address the question in settings with high mortality and morbidity rates and long delays before presentation.
The other two included studies were too small to allow any conclusions to be drawn. None of the studies included adults.
The results of short‐term fluid and electrolyte balance do not in themselves provide adequate evidence on which to change practice. The reporting of sodium levels was inconsistent so that it was not possible to undertake a meta‐analysis.
The quality of evidence for the primary and secondary outcomes were low to moderate grade and thus insufficient to guide clinical practice.
Quality of the evidence
We assessed the overall quality of the evidence using the GRADE approach (Schunemann 2011). The overall quality of the evidence for maintenance‐fluid versus restricted‐fluid regimens for children with acute bacterial meningitis was moderate for the outcomes of death, chronic severe neurological sequelae, mild to moderate neurological sequelae, and very low for acute severe neurological sequelae. A moderate quality of evidence implies that the true effect is likely to be close to the effect estimate, but the possibility of substantial difference exists and future research might change effect estimates. A very low quality of evidence implies that the effect estimate is likely to be substantially different from the true estimates of effect and further research is needed. The GRADE summary of findings table is presented as summary of findings Table for the main comparison.
Potential biases in the review process
The nature of the intervention under review meant that electronic literature searches had to use a number of search terms in order to ensure that we identified all relevant randomised controlled trials. The methods used should otherwise have been able to avoid missing relevant studies.
Agreements and disagreements with other studies or reviews
There is some available evidence from non‐RCTs and this does not provide strong grounds for restricting fluid intake despite the common practice of initial fluid restriction. These other studies were not systematically reviewed.
Risk of bias graph: review authors' judgements about each risk of bias item presented as percentages across all included studies.
Risk of bias summary: review authors' judgements about each risk of bias item for each included study.

Comparison 1 Maintenance fluids versus restricted fluids, Outcome 1 Death.
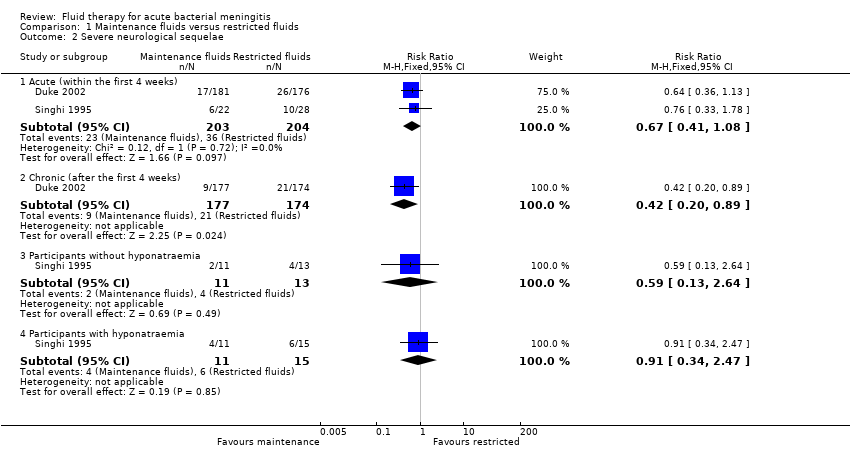
Comparison 1 Maintenance fluids versus restricted fluids, Outcome 2 Severe neurological sequelae.

Comparison 1 Maintenance fluids versus restricted fluids, Outcome 3 Mild to moderate neurological sequelae.

Comparison 1 Maintenance fluids versus restricted fluids, Outcome 4 Hemiparesis/hemiplegia.
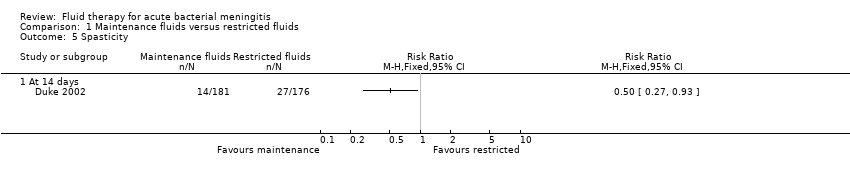
Comparison 1 Maintenance fluids versus restricted fluids, Outcome 5 Spasticity.

Comparison 1 Maintenance fluids versus restricted fluids, Outcome 6 Seizures.

Comparison 1 Maintenance fluids versus restricted fluids, Outcome 7 Visual impairment.

Comparison 1 Maintenance fluids versus restricted fluids, Outcome 8 No response to sound.
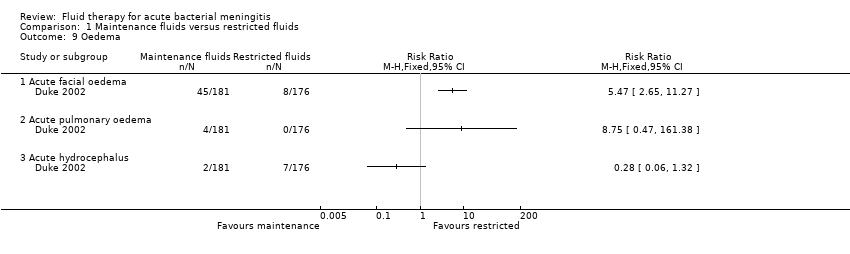
Comparison 1 Maintenance fluids versus restricted fluids, Outcome 9 Oedema.

Comparison 1 Maintenance fluids versus restricted fluids, Outcome 10 Total body water ‐ fall after 48 hours.

Comparison 1 Maintenance fluids versus restricted fluids, Outcome 11 Extracellular water ‐ fall after 48 hours.
Comparison 1 Maintenance fluids versus restricted fluids, Outcome 12 Serum sodium.
Comparison 1 Maintenance fluids versus restricted fluids, Outcome 13 Urinary sodium.
Comparison 1 Maintenance fluids versus restricted fluids, Outcome 14 Plasma osmolality ‐ change after 48 hours.
| Maintenance fluids versus restricted fluids for acute bacterial meningitis in paediatric populations | ||||||
| Patient or population: patients with acute bacterial meningitis in paediatric populations 1 | ||||||
| Outcomes | Illustrative comparative risks* (95% CI) | Relative effect | No. of participants | Quality of the evidence | Comments | |
| Assumed risk | Corresponding risk | |||||
| Control | Maintenance fluids versus restricted fluids | |||||
| Death ‐ all patients | Study population | RR 0.82 | 407 | ⊕⊕⊕⊝ | ||
| 186 per 1000 | 153 per 1000 | |||||
| Moderate | ||||||
| 213 per 1000 | 175 per 1000 | |||||
| Severe neurological sequelae ‐ acute (within the first 4 weeks) | Study population | RR 0.67 | 407 | ⊕⊝⊝⊝ | ||
| 176 per 1000 | 118 per 1000 | |||||
| Moderate | ||||||
| 252 per 1000 | 169 per 1000 | |||||
| Severe neurological sequelae ‐ chronic (after the first 4 weeks) | Study population | RR 0.42 | 351 | ⊕⊕⊕⊝ | ||
| 121 per 1000 | 51 per 1000 | |||||
| Moderate | ||||||
| 121 per 1000 | 51 per 1000 | |||||
| Mild to moderate neurological sequelae | Study population | RR 1.24 | 357 | ⊕⊕⊕⊝ | ||
| 62 per 1000 | 78 per 1000 | |||||
| Moderate | ||||||
| 63 per 1000 | 78 per 1000 | |||||
| *The basis for the assumed risk (e.g. the median control group risk across studies) is provided in footnotes. The corresponding risk (and its 95% Confidence Interval) is based on the assumed risk in the comparison group and the relative effect of the intervention (and its 95% CI). | ||||||
| GRADE Working Group grades of evidence | ||||||
| 1 No studies were found comparing different intravenous fluid regimens in adult populations in the systematic review. | ||||||
| Outcome or subgroup title | No. of studies | No. of participants | Statistical method | Effect size |
| 1 Death Show forest plot | 2 | Risk Ratio (M‐H, Fixed, 95% CI) | Subtotals only | |
| 1.1 All participants | 2 | 407 | Risk Ratio (M‐H, Fixed, 95% CI) | 0.82 [0.53, 1.27] |
| 1.2 Participants with hyponatraemia | 1 | 26 | Risk Ratio (M‐H, Fixed, 95% CI) | 0.15 [0.01, 2.50] |
| 1.3 Participants without hyponatraemia | 1 | 24 | Risk Ratio (M‐H, Fixed, 95% CI) | 0.79 [0.16, 3.90] |
| 2 Severe neurological sequelae Show forest plot | 2 | Risk Ratio (M‐H, Fixed, 95% CI) | Subtotals only | |
| 2.1 Acute (within the first 4 weeks) | 2 | 407 | Risk Ratio (M‐H, Fixed, 95% CI) | 0.67 [0.41, 1.08] |
| 2.2 Chronic (after the first 4 weeks) | 1 | 351 | Risk Ratio (M‐H, Fixed, 95% CI) | 0.42 [0.20, 0.89] |
| 2.3 Participants without hyponatraemia | 1 | 24 | Risk Ratio (M‐H, Fixed, 95% CI) | 0.59 [0.13, 2.64] |
| 2.4 Participants with hyponatraemia | 1 | 26 | Risk Ratio (M‐H, Fixed, 95% CI) | 0.91 [0.34, 2.47] |
| 3 Mild to moderate neurological sequelae Show forest plot | 1 | Risk Ratio (M‐H, Fixed, 95% CI) | Totals not selected | |
| 3.1 At 14 days | 1 | Risk Ratio (M‐H, Fixed, 95% CI) | 0.0 [0.0, 0.0] | |
| 4 Hemiparesis/hemiplegia Show forest plot | 1 | Risk Ratio (M‐H, Fixed, 95% CI) | Totals not selected | |
| 4.1 At 14 days | 1 | Risk Ratio (M‐H, Fixed, 95% CI) | 0.0 [0.0, 0.0] | |
| 5 Spasticity Show forest plot | 1 | Risk Ratio (M‐H, Fixed, 95% CI) | Totals not selected | |
| 5.1 At 14 days | 1 | Risk Ratio (M‐H, Fixed, 95% CI) | 0.0 [0.0, 0.0] | |
| 6 Seizures Show forest plot | 1 | Risk Ratio (M‐H, Fixed, 95% CI) | Totals not selected | |
| 6.1 Within the first 72 hours | 1 | Risk Ratio (M‐H, Fixed, 95% CI) | 0.0 [0.0, 0.0] | |
| 6.2 At 14 days | 1 | Risk Ratio (M‐H, Fixed, 95% CI) | 0.0 [0.0, 0.0] | |
| 7 Visual impairment Show forest plot | 1 | Risk Ratio (M‐H, Fixed, 95% CI) | Totals not selected | |
| 7.1 At 14 days | 1 | Risk Ratio (M‐H, Fixed, 95% CI) | 0.0 [0.0, 0.0] | |
| 8 No response to sound Show forest plot | 1 | Risk Ratio (M‐H, Fixed, 95% CI) | Totals not selected | |
| 8.1 At 14 days | 1 | Risk Ratio (M‐H, Fixed, 95% CI) | 0.0 [0.0, 0.0] | |
| 9 Oedema Show forest plot | 1 | Risk Ratio (M‐H, Fixed, 95% CI) | Totals not selected | |
| 9.1 Acute facial oedema | 1 | Risk Ratio (M‐H, Fixed, 95% CI) | 0.0 [0.0, 0.0] | |
| 9.2 Acute pulmonary oedema | 1 | Risk Ratio (M‐H, Fixed, 95% CI) | 0.0 [0.0, 0.0] | |
| 9.3 Acute hydrocephalus | 1 | Risk Ratio (M‐H, Fixed, 95% CI) | 0.0 [0.0, 0.0] | |
| 10 Total body water ‐ fall after 48 hours Show forest plot | 1 | Mean Difference (IV, Fixed, 95% CI) | Totals not selected | |
| 10.1 Participants without hyponatraemia | 1 | Mean Difference (IV, Fixed, 95% CI) | 0.0 [0.0, 0.0] | |
| 10.2 Participants with hyponatraemia | 1 | Mean Difference (IV, Fixed, 95% CI) | 0.0 [0.0, 0.0] | |
| 11 Extracellular water ‐ fall after 48 hours Show forest plot | 1 | Mean Difference (IV, Fixed, 95% CI) | Totals not selected | |
| 11.1 Participants without hyponatraemia | 1 | Mean Difference (IV, Fixed, 95% CI) | 0.0 [0.0, 0.0] | |
| 11.2 Participants with hyponatraemia | 1 | Mean Difference (IV, Fixed, 95% CI) | 0.0 [0.0, 0.0] | |
| 12 Serum sodium Show forest plot | 2 | Mean Difference (IV, Fixed, 95% CI) | Totals not selected | |
| 12.1 All participants (24 hours) | 1 | Mean Difference (IV, Fixed, 95% CI) | 0.0 [0.0, 0.0] | |
| 12.2 Participants with hyponatraemia (48 hours) | 1 | Mean Difference (IV, Fixed, 95% CI) | 0.0 [0.0, 0.0] | |
| 12.3 Participants without hyponatraemia (48 hours) | 1 | Mean Difference (IV, Fixed, 95% CI) | 0.0 [0.0, 0.0] | |
| 12.4 Change from baseline at 48 hours ‐ without hyponatraemia | 1 | Mean Difference (IV, Fixed, 95% CI) | 0.0 [0.0, 0.0] | |
| 12.5 Change from baseline at 48 hours ‐ with hyponatraemia | 1 | Mean Difference (IV, Fixed, 95% CI) | 0.0 [0.0, 0.0] | |
| 13 Urinary sodium Show forest plot | 1 | Mean Difference (IV, Fixed, 95% CI) | Totals not selected | |
| 13.1 Participants without hyponatraemia (48 hours) | 1 | Mean Difference (IV, Fixed, 95% CI) | 0.0 [0.0, 0.0] | |
| 13.2 Participants with hyponatraemia (48 hours) | 1 | Mean Difference (IV, Fixed, 95% CI) | 0.0 [0.0, 0.0] | |
| 13.3 Change from baseline at 48 hours ‐ without hyponatraemia | 1 | Mean Difference (IV, Fixed, 95% CI) | 0.0 [0.0, 0.0] | |
| 13.4 Change from baseline at 48 hours ‐ with hyponatraemia | 1 | Mean Difference (IV, Fixed, 95% CI) | 0.0 [0.0, 0.0] | |
| 14 Plasma osmolality ‐ change after 48 hours Show forest plot | 1 | Mean Difference (IV, Fixed, 95% CI) | Totals not selected | |
| 14.1 Participants without hyponatraemia | 1 | Mean Difference (IV, Fixed, 95% CI) | 0.0 [0.0, 0.0] | |
| 14.2 Participants with hyponatraemia | 1 | Mean Difference (IV, Fixed, 95% CI) | 0.0 [0.0, 0.0] | |