| 1 Failure of acute rejection reversal Show forest plot | 5 | 244 | Risk Ratio (M‐H, Random, 95% CI) | 1.07 [0.63, 1.81] |
|
| 1.1 Muromonab‐CD3 versus ATG | 3 | 173 | Risk Ratio (M‐H, Random, 95% CI) | 1.00 [0.17, 5.76] |
| 1.2 Muromonab‐CD3 versus ALG | 2 | 71 | Risk Ratio (M‐H, Random, 95% CI) | 1.12 [0.78, 1.60] |
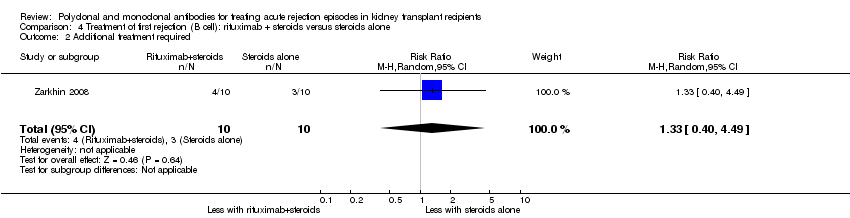
| 2 Additional treatment required Show forest plot | 1 | | Risk Ratio (M‐H, Random, 95% CI) | Subtotals only |
|
| 2.1 Muromonab‐CD3 versus ATG | 1 | 55 | Risk Ratio (M‐H, Random, 95% CI) | 1.16 [0.40, 3.35] |
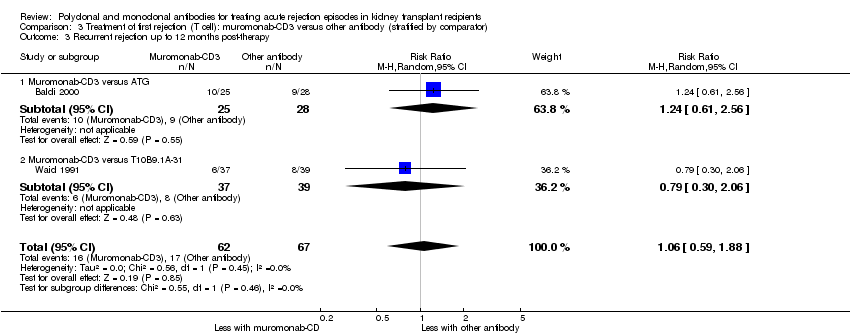
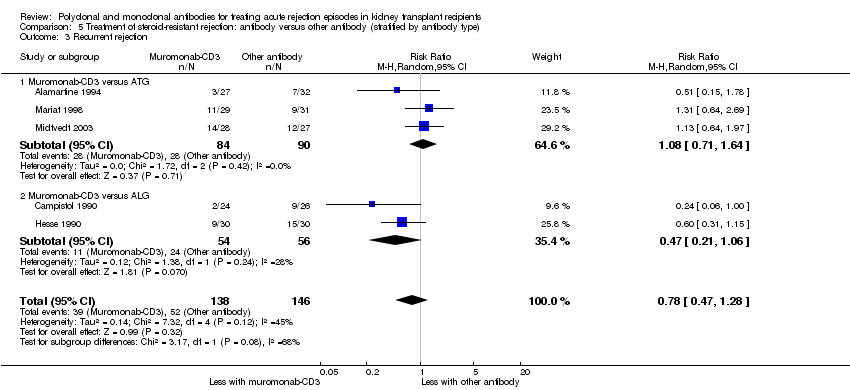
| 3 Recurrent rejection Show forest plot | 5 | 284 | Risk Ratio (M‐H, Random, 95% CI) | 0.78 [0.47, 1.28] |
|
| 3.1 Muromonab‐CD3 versus ATG | 3 | 174 | Risk Ratio (M‐H, Random, 95% CI) | 1.08 [0.71, 1.64] |
| 3.2 Muromonab‐CD3 versus ALG | 2 | 110 | Risk Ratio (M‐H, Random, 95% CI) | 0.47 [0.21, 1.06] |
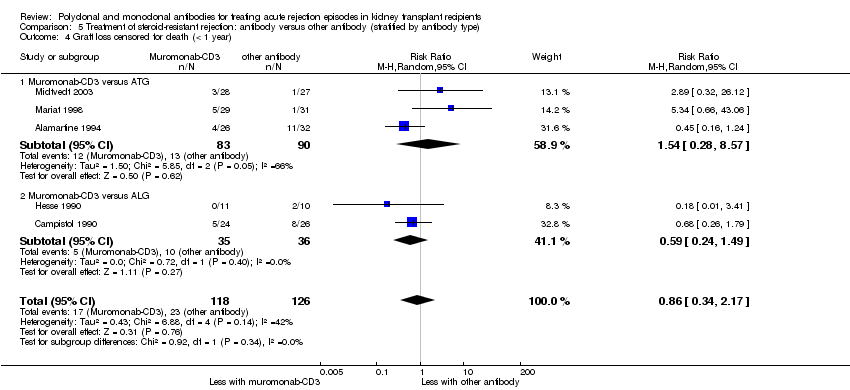
| 4 Graft loss censored for death (< 1 year) Show forest plot | 5 | 244 | Risk Ratio (M‐H, Random, 95% CI) | 0.86 [0.34, 2.17] |
|
| 4.1 Muromonab‐CD3 versus ATG | 3 | 173 | Risk Ratio (M‐H, Random, 95% CI) | 1.54 [0.28, 8.57] |
| 4.2 Muromonab‐CD3 versus ALG | 2 | 71 | Risk Ratio (M‐H, Random, 95% CI) | 0.59 [0.24, 1.49] |
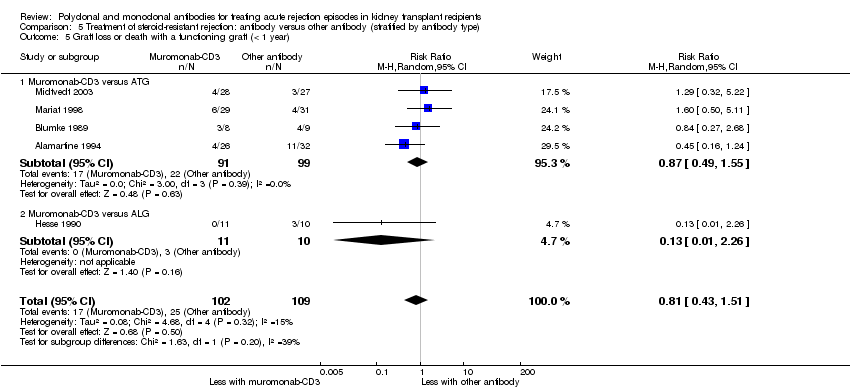
| 5 Graft loss or death with a functioning graft (< 1 year) Show forest plot | 5 | 211 | Risk Ratio (M‐H, Random, 95% CI) | 0.81 [0.43, 1.51] |
|
| 5.1 Muromonab‐CD3 versus ATG | 4 | 190 | Risk Ratio (M‐H, Random, 95% CI) | 0.87 [0.49, 1.55] |
| 5.2 Muromonab‐CD3 versus ALG | 1 | 21 | Risk Ratio (M‐H, Random, 95% CI) | 0.13 [0.01, 2.26] |
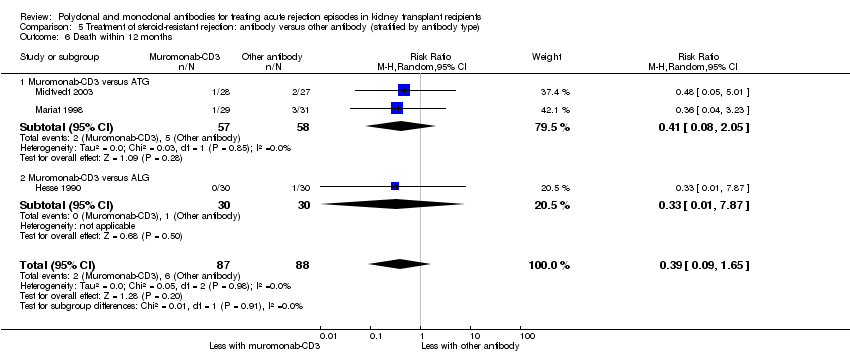
| 6 Death within 12 months Show forest plot | 3 | 175 | Risk Ratio (M‐H, Random, 95% CI) | 0.39 [0.09, 1.65] |
|
| 6.1 Muromonab‐CD3 versus ATG | 2 | 115 | Risk Ratio (M‐H, Random, 95% CI) | 0.41 [0.08, 2.05] |
| 6.2 Muromonab‐CD3 versus ALG | 1 | 60 | Risk Ratio (M‐H, Random, 95% CI) | 0.33 [0.01, 7.87] |
| 7 Treatment adverse events Show forest plot | 5 | | Risk Ratio (M‐H, Random, 95% CI) | Subtotals only |
|
| 7.1 Fever, chills, malaise after administration | 3 | 140 | Risk Ratio (M‐H, Random, 95% CI) | 2.54 [0.18, 34.92] |
| 7.2 Infection (bacterial) | 2 | 109 | Risk Ratio (M‐H, Random, 95% CI) | 8.64 [1.64, 45.56] |
| 7.3 Infection (viral) | 1 | 59 | Risk Ratio (M‐H, Random, 95% CI) | 0.53 [0.29, 0.97] |
| 7.4 Infection (fungal) | 1 | 50 | Risk Ratio (M‐H, Random, 95% CI) | 7.56 [0.41, 139.17] |
| 7.5 CMV infection | 5 | 284 | Risk Ratio (M‐H, Random, 95% CI) | 0.93 [0.60, 1.43] |
| 7.6 Malignancy (total) | 2 | 115 | Risk Ratio (M‐H, Random, 95% CI) | 2.09 [0.28, 15.66] |
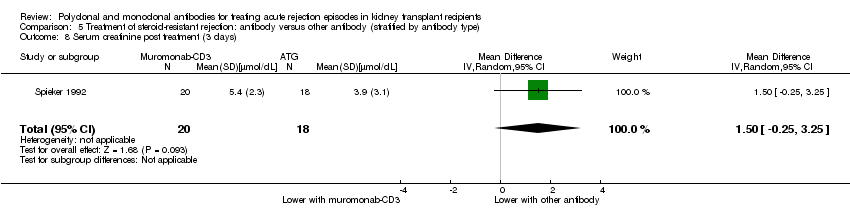
| 8 Serum creatinine post treatment (3 days) Show forest plot | 1 | 38 | Mean Difference (IV, Random, 95% CI) | 1.50 [‐0.25, 3.25] |
|
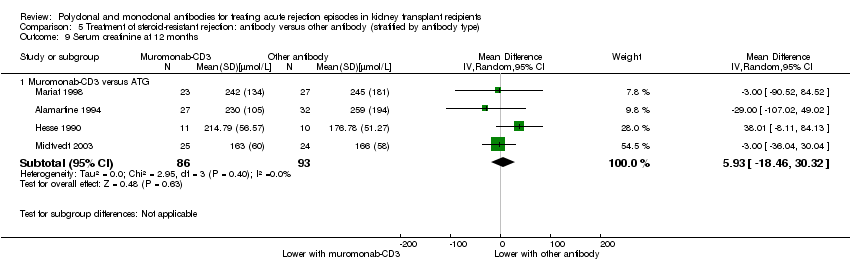
| 9 Serum creatinine at 12 months Show forest plot | 4 | | Mean Difference (IV, Random, 95% CI) | Subtotals only |
|
| 9.1 Muromonab‐CD3 versus ATG | 4 | 179 | Mean Difference (IV, Random, 95% CI) | 5.93 [‐18.46, 30.32] |