نقش آنتیبادیهای پلیکلونال و مونوکلونال برای درمان اپیزودهای رد حاد در گیرندگان پیوند کلیه
Referencias
منابع مطالعات واردشده در این مرور
منابع مطالعات خارجشده از این مرور
منابع مطالعات در حال انجام
منابع اضافی
منابع دیگر نسخههای منتشرشده این مرور
Characteristics of studies
Characteristics of included studies [ordered by study ID]
| Methods |
| |
| Participants |
| |
| Interventions | Treatment group
Control group
Baseline immunosuppression (both groups)
Co‐interventions
| |
| Outcomes |
| |
| Notes |
| |
| Risk of bias | ||
| Bias | Authors' judgement | Support for judgement |
| Random sequence generation (selection bias) | Unclear risk | Quote: "randomised"; method of randomisation not reported |
| Allocation concealment (selection bias) | Unclear risk | Insufficient information to permit judgement |
| Blinding (performance bias and detection bias) | Low risk | No mention of blinding, but outcomes are unlikely to be influenced by lack of blinding |
| Incomplete outcome data (attrition bias) | Low risk | No apparent loss of data to follow‐up |
| Selective reporting (reporting bias) | Low risk | No indication to suggest otherwise |
| Other bias | Unclear risk | Funding source not reported; similar baseline characteristics |
| Methods |
| |
| Participants |
| |
| Interventions | Treatment group
Control group
Baseline immunosuppression (both groups)
Co‐interventions
| |
| Outcomes |
| |
| Notes |
| |
| Risk of bias | ||
| Bias | Authors' judgement | Support for judgement |
| Random sequence generation (selection bias) | Unclear risk | Quote: "all kidney recipients...were randomized"; method of randomisation not reported |
| Allocation concealment (selection bias) | Unclear risk | Insufficient information to permit judgement |
| Blinding (performance bias and detection bias) | High risk | Muromonab‐CD3 group received antihistamine 1 h prior to muromonab‐CD3 administration, outcome measurement (treatment side effects) could be influenced |
| Incomplete outcome data (attrition bias) | Low risk | No apparent loss of data to follow‐up |
| Selective reporting (reporting bias) | Low risk | No indication to suggest otherwise |
| Other bias | Unclear risk | Funding source not reported; similar baseline characteristics except for higher proportion of immunized patients in the ATG group |
| Methods |
| |
| Participants |
| |
| Interventions | Treatment group
Control group
Baseline immunosuppression
Co‐interventions
| |
| Outcomes |
| |
| Notes |
| |
| Risk of bias | ||
| Bias | Authors' judgement | Support for judgement |
| Random sequence generation (selection bias) | Unclear risk | Quote: "allocated randomly"; method of randomisation not reported |
| Allocation concealment (selection bias) | Unclear risk | Insufficient information to permit judgement |
| Blinding (performance bias and detection bias) | Low risk | No mention of blinding, but outcome measurements are unlikely to be influenced by lack of blinding |
| Incomplete outcome data (attrition bias) | Low risk | 3 randomised but excluded without ITT; however, only 10% people missing and balanced between groups, thus unlikely to affect outcome |
| Selective reporting (reporting bias) | High risk | No measure of graft function (SCr or GFR) and treatment adverse effects |
| Other bias | Unclear risk | The study was supported by grants from King Christian X Fund, Ingemann O. Buck's Fund, P. Carl Petersen's Fund, Engineer Soren Alfred Andersen's Fund, C. C. Klestrup and Wife's Legacy and State Medical Research Fund; similar baseline characteristics |
| Methods |
| |
| Participants |
| |
| Interventions | Treatment group
Control group
Baseline immunosuppression (both groups)
Co‐interventions
| |
| Outcomes |
| |
| Notes |
| |
| Risk of bias | ||
| Bias | Authors' judgement | Support for judgement |
| Random sequence generation (selection bias) | Unclear risk | Quote: "randomized"; method of randomisation not reported |
| Allocation concealment (selection bias) | High risk | Alternate allocation to treatment group |
| Blinding (performance bias and detection bias) | Low risk | No mention of blinding, but outcome measurements are unlikely to be influenced by lack of blinding |
| Incomplete outcome data (attrition bias) | Low risk | No apparent loss of data on follow‐up |
| Selective reporting (reporting bias) | High risk | SD not reported for SCr and could not be meta‐analysed |
| Other bias | Unclear risk | Funding source not reported |
| Methods |
| |
| Participants |
| |
| Interventions | Treatment group
Control group
Baseline immunosuppression (both groups)
Co‐interventions
| |
| Outcomes |
| |
| Notes |
| |
| Risk of bias | ||
| Bias | Authors' judgement | Support for judgement |
| Random sequence generation (selection bias) | Unclear risk | Quote: "randomly allocated"; method of randomisation not reported |
| Allocation concealment (selection bias) | Unclear risk | Insufficient information to permit judgement |
| Blinding (performance bias and detection bias) | Low risk | No mention of blinding, but outcome measurements are unlikely to be influenced by lack of blinding |
| Incomplete outcome data (attrition bias) | Low risk | No apparent loss of data on follow‐up |
| Selective reporting (reporting bias) | Low risk | No indications to suggest otherwise |
| Other bias | High risk | Funded by Merieux Institute; similar baseline characteristics |
| Methods |
| |
| Participants |
| |
| Interventions | Treatment group
Control group
Baseline immunosuppression (both groups)
Co‐interventions
| |
| Outcomes |
| |
| Notes |
| |
| Risk of bias | ||
| Bias | Authors' judgement | Support for judgement |
| Random sequence generation (selection bias) | Unclear risk | Quote: "randomized trial"; method of randomisation not reported |
| Allocation concealment (selection bias) | Unclear risk | Insufficient information to permit judgement |
| Blinding (performance bias and detection bias) | Low risk | No mention of blinding, but outcome is unlikely to be influenced by lack of blinding |
| Incomplete outcome data (attrition bias) | Low risk | No apparent loss of data at follow‐up |
| Selective reporting (reporting bias) | Unclear risk | Insufficient information to permit judgement |
| Other bias | Unclear risk | Funding source not reported; similar baseline characteristics |
| Methods |
| |
| Participants |
| |
| Interventions | Treatment group
Control group
Baseline immunosuppression (both groups)
Co‐interventions
| |
| Outcomes |
| |
| Notes |
| |
| Risk of bias | ||
| Bias | Authors' judgement | Support for judgement |
| Random sequence generation (selection bias) | Unclear risk | Quote: "Randomly assigned"; method of randomisation not reported |
| Allocation concealment (selection bias) | Unclear risk | Insufficient information to permit judgement |
| Blinding (performance bias and detection bias) | Low risk | No mention of blinding, but outcomes are unlikely to be influenced by lack of blinding |
| Incomplete outcome data (attrition bias) | Low risk | No apparent loss of data at follow‐up |
| Selective reporting (reporting bias) | Low risk | No indication to suggest otherwise |
| Other bias | Unclear risk | Funding source not reported; similar baseline characteristics |
| Methods |
| |
| Participants |
| |
| Interventions | Treatment group
control group
Baseline immunosuppression (both groups)
Co‐interventions
| |
| Outcomes |
| |
| Notes |
| |
| Risk of bias | ||
| Bias | Authors' judgement | Support for judgement |
| Random sequence generation (selection bias) | Low risk | Card system of randomisation with allocation concealment |
| Allocation concealment (selection bias) | Low risk | Card system of randomisation with allocation concealment Quote: "primary care physicians had no control over the treatment group assigned to any given patient." |
| Blinding (performance bias and detection bias) | Low risk | No mention of blinding, but outcomes are unlikely to be influenced by lack of blinding |
| Incomplete outcome data (attrition bias) | Low risk | No apparent loss of data on follow‐up |
| Selective reporting (reporting bias) | High risk | No measure of graft function (SCr or GFR) or treatment adverse effects |
| Other bias | High risk | Funded by Upjohn ATGAM Company; similar baseline characteristics |
| Methods |
| |
| Participants |
| |
| Interventions | Treatment group
Control group
Baseline immunosuppression (both groups)
Co‐interventions
| |
| Outcomes |
| |
| Notes |
| |
| Risk of bias | ||
| Bias | Authors' judgement | Support for judgement |
| Random sequence generation (selection bias) | Low risk | Quote: "Randomised using a centralised procedure...unique randomization code" |
| Allocation concealment (selection bias) | Low risk | Quote: "each centre having a unique randomization code " Enrolments were stratified and randomised centrally |
| Blinding (performance bias and detection bias) | Low risk | Double blind; only pharmacist at each centre was unblinded |
| Incomplete outcome data (attrition bias) | Low risk | Complete follow‐up |
| Selective reporting (reporting bias) | Low risk | No indications to suggest otherwise |
| Other bias | High risk | Funded by The Hardardt Group, Parssipanny, NJ, SangStat Medical Corp; similar baseline characteristics |
| Methods |
| |
| Participants |
| |
| Interventions | Treatment group
Control group
Baseline immunosuppression (both groups)
Co‐interventions
| |
| Outcomes |
| |
| Notes |
| |
| Risk of bias | ||
| Bias | Authors' judgement | Support for judgement |
| Random sequence generation (selection bias) | High risk | Quote: "Assigning ...patients consecutively in order of their admission to the hospital" Quote: "recipients over the age of 50, all of them were assigned to group B" Consecutive allocation to various groups |
| Allocation concealment (selection bias) | Unclear risk | Insufficient information to permit judgement |
| Blinding (performance bias and detection bias) | Low risk | No mention of blinding, but the outcome measurements are unlikely to be influenced |
| Incomplete outcome data (attrition bias) | Low risk | No apparent loss of data to follow‐up |
| Selective reporting (reporting bias) | Low risk | No indications to suggest otherwise |
| Other bias | Unclear risk | Funding source not reported; similar baseline characteristics |
| Methods |
| |
| Participants |
| |
| Interventions | Treatment group
Control group
Baseline immunosuppression (both groups)
Co‐interventions
| |
| Outcomes |
| |
| Notes |
| |
| Risk of bias | ||
| Bias | Authors' judgement | Support for judgement |
| Random sequence generation (selection bias) | Low risk | Computer generated sequence at each centre |
| Allocation concealment (selection bias) | Unclear risk | Insufficient information to permit judgement |
| Blinding (performance bias and detection bias) | High risk | Muromonab‐CD3 group received skin prick test before administration; drug regimen different between groups; outcome measurement (treatment side effects) could be influenced |
| Incomplete outcome data (attrition bias) | High risk | 2 patients lost to follow up and 1 patient excluded without reason |
| Selective reporting (reporting bias) | High risk | No measure of graft function (SCr or GFR) |
| Other bias | High risk | Funded by Ortho Pharmaceutical corporation as part of pilot trial; similar baseline characteristics |
| Methods |
| |
| Participants |
| |
| Interventions | Treatment group
Control group
Baseline immunosuppression (both groups)
Co‐interventions
| |
| Outcomes |
| |
| Notes |
| |
| Risk of bias | ||
| Bias | Authors' judgement | Support for judgement |
| Random sequence generation (selection bias) | Unclear risk | Quote: "Randomized", method of randomisation not reported |
| Allocation concealment (selection bias) | Unclear risk | Insufficient information to permit judgement |
| Blinding (performance bias and detection bias) | Low risk | No mention of blinding, but outcome measurements are unlikely to be influenced by lack of blinding |
| Incomplete outcome data (attrition bias) | Low risk | No apparent loss of data to follow‐up |
| Selective reporting (reporting bias) | Low risk | No indication to suggest otherwise |
| Other bias | Unclear risk | Funding source not reported |
| Methods |
| |
| Participants |
| |
| Interventions | Treatment group
Control group
Baseline immunosuppression (both groups)
Co‐interventions
| |
| Outcomes |
| |
| Notes |
| |
| Risk of bias | ||
| Bias | Authors' judgement | Support for judgement |
| Random sequence generation (selection bias) | Unclear risk | Quote: "randomized trial"; method of randomisation not reported |
| Allocation concealment (selection bias) | Unclear risk | Insufficient information to permit judgement |
| Blinding (performance bias and detection bias) | Low risk | No mention of blinding, but outcomes are unlikely to be influenced by lack of blinding |
| Incomplete outcome data (attrition bias) | Low risk | No apparent loss of data on follow‐up |
| Selective reporting (reporting bias) | Low risk | No indication to suggest otherwise |
| Other bias | Unclear risk | Funding source not reported; similar baseline characteristics |
| Methods |
| |
| Participants |
| |
| Interventions | Treatment group
Control group
Baseline immunosuppression (both groups)
Co‐interventions
| |
| Outcomes |
| |
| Notes |
| |
| Risk of bias | ||
| Bias | Authors' judgement | Support for judgement |
| Random sequence generation (selection bias) | Low risk | Quote: "minimization method of Taves" |
| Allocation concealment (selection bias) | Unclear risk | Insufficient information to permit judgement |
| Blinding (performance bias and detection bias) | High risk | Different drug administration regimes rabbit‐ATG + steroid vs steroid alone ‐ no blinding used Outcome measurement (treatment side effects) could be influenced |
| Incomplete outcome data (attrition bias) | Low risk | No apparent loss of data to follow‐up |
| Selective reporting (reporting bias) | Low risk | No indication to suggest otherwise |
| Other bias | Low risk | Funded by Main Group for Health Research TNO Grant; similar baseline characteristics |
| Methods |
| |
| Participants |
| |
| Interventions | Treatment group
Control group
Baseline immunosuppression (both groups)
Co‐interventions
| |
| Outcomes |
| |
| Notes |
| |
| Risk of bias | ||
| Bias | Authors' judgement | Support for judgement |
| Random sequence generation (selection bias) | Unclear risk | Study was reported as randomised; method of randomisation not reported |
| Allocation concealment (selection bias) | Unclear risk | Insufficient information to permit judgement |
| Blinding (performance bias and detection bias) | Unclear risk | Insufficient information to permit judgement |
| Incomplete outcome data (attrition bias) | Low risk | None lost to follow‐up |
| Selective reporting (reporting bias) | Unclear risk | Insufficient information to permit judgement |
| Other bias | Unclear risk | Funding source not reported |
| Methods |
| |
| Participants |
| |
| Interventions | Treatment group
Control group
Baseline immunosuppression (both groups)
Co‐interventions
| |
| Outcomes |
| |
| Notes |
| |
| Risk of bias | ||
| Bias | Authors' judgement | Support for judgement |
| Random sequence generation (selection bias) | Unclear risk | Quote: "randomly assigned"; method of randomisation not reported |
| Allocation concealment (selection bias) | Unclear risk | Insufficient information to permit judgement |
| Blinding (performance bias and detection bias) | Low risk | Quote: "double blind" but no mention of blinding methodology. However, outcome measurement is unlikely to be influenced by lack of blinding. |
| Incomplete outcome data (attrition bias) | High risk | 12 patients excluded from analysis without ITT |
| Selective reporting (reporting bias) | High risk | No measure of graft function (SCr or GFR) and treatment adverse effect |
| Other bias | Low risk | Funded by US Public Health Services Grant |
| Methods |
| |
| Participants |
| |
| Interventions | Treatment group
Control group
Baseline immunosuppression (both groups)
Co‐interventions
| |
| Outcomes |
| |
| Notes |
| |
| Risk of bias | ||
| Bias | Authors' judgement | Support for judgement |
| Random sequence generation (selection bias) | Unclear risk | Quote: "Randomized"; method of randomisation not reported |
| Allocation concealment (selection bias) | Unclear risk | Insufficient information to permit judgement |
| Blinding (performance bias and detection bias) | High risk | Different drug regimens and cross over was made possible Possible variation in maintenance immunosuppressant protocols Outcome measurement (treatment side effects) could be influenced |
| Incomplete outcome data (attrition bias) | Unclear risk | No apparent loss of data to follow up, however, final outcomes reported in percentages instead of actual numbers |
| Selective reporting (reporting bias) | High risk | No measure of graft function (SCr or GFR) |
| Other bias | Unclear risk | Funding source not reported; similar baseline characteristics |
| Methods |
| |
| Participants |
| |
| Interventions | Treatment group
Control group
Baseline immunosuppression (both groups)
Co‐interventions
| |
| Outcomes |
| |
| Notes |
| |
| Risk of bias | ||
| Bias | Authors' judgement | Support for judgement |
| Random sequence generation (selection bias) | Unclear risk | Quote: "randomized"; method of randomisation not reported |
| Allocation concealment (selection bias) | Unclear risk | Insufficient information to permit judgement |
| Blinding (performance bias and detection bias) | Unclear risk | Different dose regimens. Antibody vials available in different quantities: OKT3 in 5ml vials and ALG in 25 ml. Outcome measurements (treatment side effects) did not have sufficient information to permit judgement |
| Incomplete outcome data (attrition bias) | Low risk | No apparent loss of data on follow‐up |
| Selective reporting (reporting bias) | Low risk | No indications to suggest otherwise |
| Other bias | Unclear risk | Funding source not reported; similar baseline characteristics except cold ischaemia time which was significantly different |
| Methods |
| |
| Participants |
| |
| Interventions | Treatment group
Control group
Baseline immunosuppression (both groups)
Co‐interventions
| |
| Outcomes |
| |
| Notes |
| |
| Risk of bias | ||
| Bias | Authors' judgement | Support for judgement |
| Random sequence generation (selection bias) | Unclear risk | Quote: "randomized"; method of randomisation not reported |
| Allocation concealment (selection bias) | Unclear risk | Insufficient information to permit judgement |
| Blinding (performance bias and detection bias) | Low risk | Similar drug regimens; no mention made of blinding, but outcomes are unlikely to be influenced by lack of blinding |
| Incomplete outcome data (attrition bias) | High risk | 5 patients lost to follow‐up due to graft loss excluded from analysis without ITT |
| Selective reporting (reporting bias) | High risk | No measure of graft function (SCr or GFR) and treatment adverse effect |
| Other bias | Unclear risk | Funding source not reported |
| Methods |
| |
| Participants |
| |
| Interventions | Treatment group
Control group
Baseline immunosuppression (both groups)
Co‐interventions
| |
| Outcomes |
| |
| Notes |
| |
| Risk of bias | ||
| Bias | Authors' judgement | Support for judgement |
| Random sequence generation (selection bias) | Unclear risk | Quote: "randomized, prospective single centre"; method of randomisation not reported |
| Allocation concealment (selection bias) | Unclear risk | Insufficient information to permit judgement |
| Blinding (performance bias and detection bias) | Low risk | Drug regimens are similar for priming and duration; no blinding mentioned, but outcome measurements are unlikely to be influenced lack of blinding. |
| Incomplete outcome data (attrition bias) | Low risk | Quote: "all patients were followed from the day of inclusion until the end of 2000" |
| Selective reporting (reporting bias) | Low risk | No indications to suggest otherwise |
| Other bias | Unclear risk | Funding source not reported; similar baseline characteristics |
| Methods |
| |
| Participants |
| |
| Interventions | Treatment group
Control group
Baseline immunosuppression (both groups)
Co‐interventions
| |
| Outcomes |
| |
| Notes |
| |
| Risk of bias | ||
| Bias | Authors' judgement | Support for judgement |
| Random sequence generation (selection bias) | High risk | Alternative allocation to treatment groups |
| Allocation concealment (selection bias) | High risk | Alternative allocation to treatment groups |
| Blinding (performance bias and detection bias) | High risk | Drug regimens were of different durations, 10 consecutive days (muromonab‐CD3) vs 5 consecutive days (15‐deoxyspergualin); outcome measurements (treatment side effect) could be influenced |
| Incomplete outcome data (attrition bias) | Low risk | No apparent loss of data on follow‐up |
| Selective reporting (reporting bias) | Low risk | No indications to suggest otherwise |
| Other bias | Unclear risk | Funding source not reported; similar baseline characteristics except for age, which was significantly different |
| Methods |
| |
| Participants |
| |
| Interventions | Treatment group
Control group
Baseline immunosuppression (both groups)
Co‐interventions
| |
| Outcomes |
| |
| Notes |
| |
| Risk of bias | ||
| Bias | Authors' judgement | Support for judgement |
| Random sequence generation (selection bias) | Unclear risk | Quote: “patients were randomised”; method of randomisation not reported |
| Allocation concealment (selection bias) | Unclear risk | Insufficient information to permit judgement |
| Blinding (performance bias and detection bias) | Low risk | No blinding used, but outcome is unlikely to be influenced by lack of blinding |
| Incomplete outcome data (attrition bias) | Low risk | Loss of study participants explained for, but no ITT analysis conducted. However, only 10% people missing and balanced between groups, thus unlikely to affect outcome |
| Selective reporting (reporting bias) | High risk | Unable to meta‐analyse data |
| Other bias | High risk | Possible cross‐over between groups, difficulty interpreting accuracy of results Funding sources from the Professor L‐E Gelin Memorial Foundation, Fresenius AG, Federal Republic of Germany, Riksforbundet for Njursjuka |
| Methods |
| |
| Participants |
| |
| Interventions | Treatment group
Control group
Baseline immunosuppression (both groups)
Co‐interventions
| |
| Outcomes |
| |
| Notes |
| |
| Risk of bias | ||
| Bias | Authors' judgement | Support for judgement |
| Random sequence generation (selection bias) | Low risk | Quote: "Randomization and allocation concealment were achieved by use of a centralized, computer generated, interactive, Web‐response system managed by the Roche laboratory, which had no role in recruitment. Randomization was stratified by centre, with permutation blocks of variable sizes" |
| Allocation concealment (selection bias) | Low risk | Quote: "Randomization and allocation concealment were achieved by use of a centralized, computer generated, interactive, Web‐response system managed by the Roche laboratory, which had no role in recruitment. Randomization was stratified by centre, with permutation blocks of variable sizes" |
| Blinding (performance bias and detection bias) | Low risk | No mention made of blinding methodology, also unblinding of a third infusion of rituximab was planned and this occurred in 7/19 patients in placebo group. However, outcome measurements are unlikely to be influenced |
| Incomplete outcome data (attrition bias) | Low risk | No mention made of blinding methodology, also unblinding of a third infusion of rituximab was planned and this occurred in 7/19 patients in placebo group. However, outcome measurements are unlikely to be influenced |
| Selective reporting (reporting bias) | Low risk | All outcomes reported, no indications to suggest otherwise |
| Other bias | Low risk | Funding sources from the French Ministry of Health and grants from the Roche Laboratory; no conflict of interests were declared from authors |
| Methods |
| |
| Participants |
| |
| Interventions | Treatment group
Control group
Baseline immunosuppression (both groups)
Co‐interventions
| |
| Outcomes |
| |
| Notes |
| |
| Risk of bias | ||
| Bias | Authors' judgement | Support for judgement |
| Random sequence generation (selection bias) | Unclear risk | Quote: "randomized"; method of randomisation not reported |
| Allocation concealment (selection bias) | Unclear risk | Insufficient information to permit judgement |
| Blinding (performance bias and detection bias) | Low risk | No mention of blinding, but outcome measurements are unlikely to be influenced by lack of blinding |
| Incomplete outcome data (attrition bias) | Low risk | Complete follow‐up |
| Selective reporting (reporting bias) | Low risk | All outcomes reported, no indications to suggest otherwise |
| Other bias | High risk | Funded by Upjohn Company and US public Health Services Grant |
| Methods |
| |
| Participants |
| |
| Interventions | Treatment group
Control group
Baseline immunosuppression (both groups)
Co‐interventions
| |
| Outcomes |
| |
| Notes |
| |
| Risk of bias | ||
| Bias | Authors' judgement | Support for judgement |
| Random sequence generation (selection bias) | Unclear risk | Quote: "randomized"; method of randomisation not reported |
| Allocation concealment (selection bias) | Unclear risk | Insufficient information to permit judgement |
| Blinding (performance bias and detection bias) | Low risk | No mention of blinding, but outcomes are unlikely to be influenced by lack of blinding |
| Incomplete outcome data (attrition bias) | Low risk | No apparent loss of data on follow‐up |
| Selective reporting (reporting bias) | Unclear risk | Insufficient information to permit judgement |
| Other bias | Unclear risk | Funding source not reported; similar baseline characteristics |
| Methods |
| |
| Participants |
| |
| Interventions | Treatment group
Control group
Baseline immunosuppression (both groups)
Co‐interventions
| |
| Outcomes |
| |
| Notes |
| |
| Risk of bias | ||
| Bias | Authors' judgement | Support for judgement |
| Random sequence generation (selection bias) | Unclear risk | Quote: "randomly allocated"; method of randomisation not reported |
| Allocation concealment (selection bias) | Unclear risk | Insufficient information to permit judgement |
| Blinding (performance bias and detection bias) | Low risk | Drug regimens were similar. No mention of blinding, but outcomes are unlikely to be influenced by lack of blinding |
| Incomplete outcome data (attrition bias) | Low risk | Complete follow‐up |
| Selective reporting (reporting bias) | Low risk | All outcomes reported, no indications to suggest otherwise |
| Other bias | Unclear risk | Funding source not reported; similar baseline characteristics |
| Methods |
| |
| Participants |
| |
| Interventions | Treatment group
Control group
Baseline immunosuppression (both groups)
Co‐interventions
| |
| Outcomes |
| |
| Notes |
| |
| Risk of bias | ||
| Bias | Authors' judgement | Support for judgement |
| Random sequence generation (selection bias) | Unclear risk | Quote: "randomly assigned"; method of randomisation not reported |
| Allocation concealment (selection bias) | Unclear risk | Insufficient information to permit judgement |
| Blinding (performance bias and detection bias) | Low risk | No blinding mentioned, but outcomes are unlikely to be influenced by lack of blinding |
| Incomplete outcome data (attrition bias) | Low risk | Complete follow‐up |
| Selective reporting (reporting bias) | Low risk | All outcomes reported, no indications to suggest otherwise |
| Other bias | Unclear risk | Funding source not reported |
| Methods |
| |
| Participants |
| |
| Interventions | Treatment group
Control group
Baseline immunosuppression (both groups)
Co‐interventions
| |
| Outcomes |
| |
| Notes |
| |
| Risk of bias | ||
| Bias | Authors' judgement | Support for judgement |
| Random sequence generation (selection bias) | Unclear risk | Quote: "patients were randomized"; method of randomisation not reported |
| Allocation concealment (selection bias) | Unclear risk | Insufficient information to permit judgement |
| Blinding (performance bias and detection bias) | Low risk | Quote: "Open label...trial" But outcomes are unlikely to be influenced by lack of blinding |
| Incomplete outcome data (attrition bias) | Unclear risk | Not sure of complete follow‐up as results are reported in % not numbers |
| Selective reporting (reporting bias) | Unclear risk | Insufficient information to permit judgement |
| Other bias | Unclear risk | Funding source not reported; similar baseline characteristics except for minor criteria |
| Methods |
| |
| Participants |
| |
| Interventions | Treatment group
Control group
Baseline immunosuppression (both groups)
Co‐interventions
| |
| Outcomes |
| |
| Notes |
| |
| Risk of bias | ||
| Bias | Authors' judgement | Support for judgement |
| Random sequence generation (selection bias) | Unclear risk | Quote: "randomised"; method of randomisation not reported |
| Allocation concealment (selection bias) | Unclear risk | Insufficient information to permit judgement |
| Blinding (performance bias and detection bias) | High risk | Drug regimen similar, but no mention of blinding; outcome measurement (treatment side effect) could be influenced |
| Incomplete outcome data (attrition bias) | Low risk | No apparent loss of data on follow‐up |
| Selective reporting (reporting bias) | High risk | No measure of graft function (SCr or GFR) |
| Other bias | Unclear risk | Funding source not reported; similar baseline characteristics |
| Methods |
| |
| Participants |
| |
| Interventions | Treatment group
Control group
Baseline immunosuppression (both groups)
Co‐interventions
| |
| Outcomes |
| |
| Notes |
| |
| Risk of bias | ||
| Bias | Authors' judgement | Support for judgement |
| Random sequence generation (selection bias) | Low risk | Quote: "(medication) was dispensed by the pharmacy according to a randomisation table" |
| Allocation concealment (selection bias) | Low risk | Quote: "(medication) was dispensed by the pharmacy according to a randomisation table"; pharmacy controlled allocation |
| Blinding (performance bias and detection bias) | Low risk | Quote: "double blind" Quote: " investigators, patients, nurses, and other personnel were all unaware of which mAb was being administered" Quote: "placebo injections...to maintain the blinded status" |
| Incomplete outcome data (attrition bias) | Unclear risk | No reasons for missing data provided in cytokine expression analysis |
| Selective reporting (reporting bias) | Low risk | No indications suggest otherwise |
| Other bias | Low risk | Funded by National Institutes of Health; cross‐over between groups documented in protocol, reported in outcomes |
| Methods |
| |
| Participants |
| |
| Interventions | Treatment group
Control group
Baseline immunosuppression (both groups)
Co‐intervention
| |
| Outcomes |
| |
| Notes |
| |
| Risk of bias | ||
| Bias | Authors' judgement | Support for judgement |
| Random sequence generation (selection bias) | Unclear risk | Quote: "randomized"; method of randomisation not reported |
| Allocation concealment (selection bias) | Unclear risk | Insufficient information to permit judgement |
| Blinding (performance bias and detection bias) | Low risk | Quote: "open‐label" however, outcome measurements are unlikely to be influenced by lack of blinding |
| Incomplete outcome data (attrition bias) | Low risk | Complete follow‐up |
| Selective reporting (reporting bias) | Low risk | No indications to suggest otherwise |
| Other bias | High risk | Funded by Genentech Inc. and BIOGEN‐IDEC Pharmaceuticals; similar baseline characteristics |
ALG ‐ antilymphocyte globulin; ATG ‐ antithymocyte globulin; AZA ‐ azathioprine; BP ‐ blood pressure; CsA ‐ cyclosporin; CMV ‐ cytomegalovirus; GFR ‐ glomerular filtration rate; HIV ‐ human immunodeficiency virus; HLA ‐ human leukocyte antigen; ITT ‐ intention‐to‐treat; IV ‐ intravenous; IVIg ‐ intravenous immunoglobulin; M/F ‐ male/female; MMF ‐ mycophenolate mofetil; MP ‐ methylprednisolone; PRED ‐ prednisone/prednisolone; RCT ‐ randomised controlled trial; SCr ‐ serum creatinine; SD ‐ standard deviation; TAC ‐ tacrolimus
Characteristics of excluded studies [ordered by study ID]
| Study | Reason for exclusion |
| Wrong population: patients with chronic rather than acute rejection |
Characteristics of ongoing studies [ordered by study ID]
| Trial name or title | Rationale and design of the RIACT‐study: a multi‐center placebo controlled double blind study to test the efficacy of Rituximab in Acute cellular tubulointerstitial rejection with B‐cell infiltrates in renal Transplant patients: study protocol for a randomized controlled trial |
| Methods |
|
| Participants |
|
| Interventions | Treatment group
Control group
Baseline immunosuppression (both groups)
Co‐interventions
|
| Outcomes |
|
| Starting date | May 2012 |
| Contact information | nephrologie@mh‐hannover.de |
| Notes | Funding source: German government grant (BMBF, Clinical studies Programme) Contact with study authors for additional information: yes |
Data and analyses
| Outcome or subgroup title | No. of studies | No. of participants | Statistical method | Effect size |
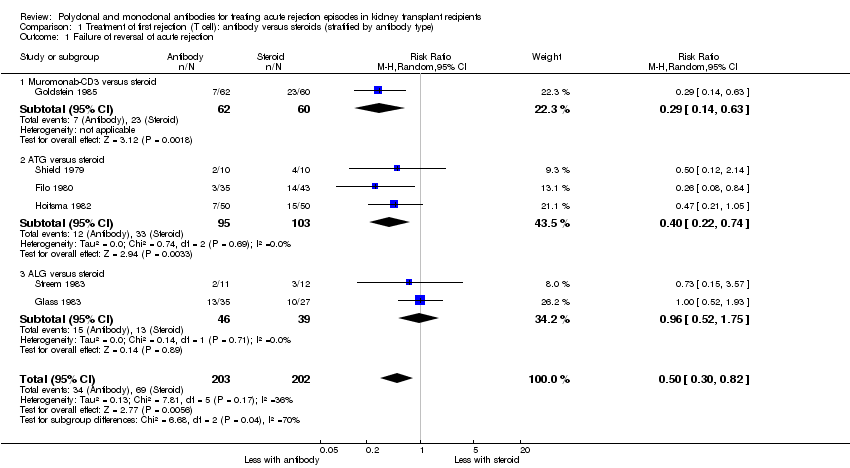
| 1 Failure of reversal of acute rejection Show forest plot | 6 | 405 | Risk Ratio (M‐H, Random, 95% CI) | 0.50 [0.30, 0.82] |
| Analysis 1.1  Comparison 1 Treatment of first rejection (T cell): antibody versus steroids (stratified by antibody type), Outcome 1 Failure of reversal of acute rejection. | ||||
| 1.1 Muromonab‐CD3 versus steroid | 1 | 122 | Risk Ratio (M‐H, Random, 95% CI) | 0.29 [0.14, 0.63] |
| 1.2 ATG versus steroid | 3 | 198 | Risk Ratio (M‐H, Random, 95% CI) | 0.40 [0.22, 0.74] |
| 1.3 ALG versus steroid | 2 | 85 | Risk Ratio (M‐H, Random, 95% CI) | 0.96 [0.52, 1.75] |
| 2 Additional treatment needed Show forest plot | 4 | 178 | Risk Ratio (M‐H, Random, 95% CI) | 0.74 [0.48, 1.15] |
| Analysis 1.2  Comparison 1 Treatment of first rejection (T cell): antibody versus steroids (stratified by antibody type), Outcome 2 Additional treatment needed. | ||||
| 2.1 ATG versus steroid | 2 | 120 | Risk Ratio (M‐H, Random, 95% CI) | 0.80 [0.49, 1.30] |
| 2.2 ALG versus steroid | 2 | 58 | Risk Ratio (M‐H, Random, 95% CI) | 0.50 [0.17, 1.49] |
| 3 Recurrent rejection up to 12 months post‐therapy Show forest plot | 9 | 508 | Risk Ratio (M‐H, Random, 95% CI) | 0.75 [0.56, 1.00] |
| Analysis 1.3 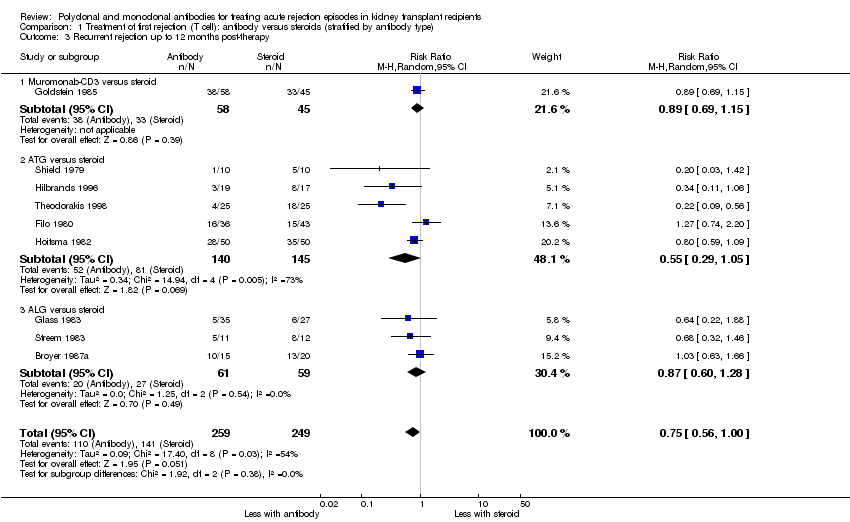 Comparison 1 Treatment of first rejection (T cell): antibody versus steroids (stratified by antibody type), Outcome 3 Recurrent rejection up to 12 months post‐therapy. | ||||
| 3.1 Muromonab‐CD3 versus steroid | 1 | 103 | Risk Ratio (M‐H, Random, 95% CI) | 0.89 [0.69, 1.15] |
| 3.2 ATG versus steroid | 5 | 285 | Risk Ratio (M‐H, Random, 95% CI) | 0.55 [0.29, 1.05] |
| 3.3 ALG versus steroid | 3 | 120 | Risk Ratio (M‐H, Random, 95% CI) | 0.87 [0.60, 1.28] |
| 4 Graft loss or death with a functioning graft within 12 months Show forest plot | 8 | 490 | Risk Ratio (M‐H, Random, 95% CI) | 0.84 [0.58, 1.22] |
| Analysis 1.4  Comparison 1 Treatment of first rejection (T cell): antibody versus steroids (stratified by antibody type), Outcome 4 Graft loss or death with a functioning graft within 12 months. | ||||
| 4.1 Muromonab‐CD3 versus steroid | 1 | 120 | Risk Ratio (M‐H, Random, 95% CI) | 1.36 [1.02, 1.81] |
| 4.2 ATG versus steroid | 5 | 285 | Risk Ratio (M‐H, Random, 95% CI) | 0.65 [0.48, 0.89] |
| 4.3 ALG versus steroid | 2 | 85 | Risk Ratio (M‐H, Random, 95% CI) | 0.90 [0.53, 1.50] |
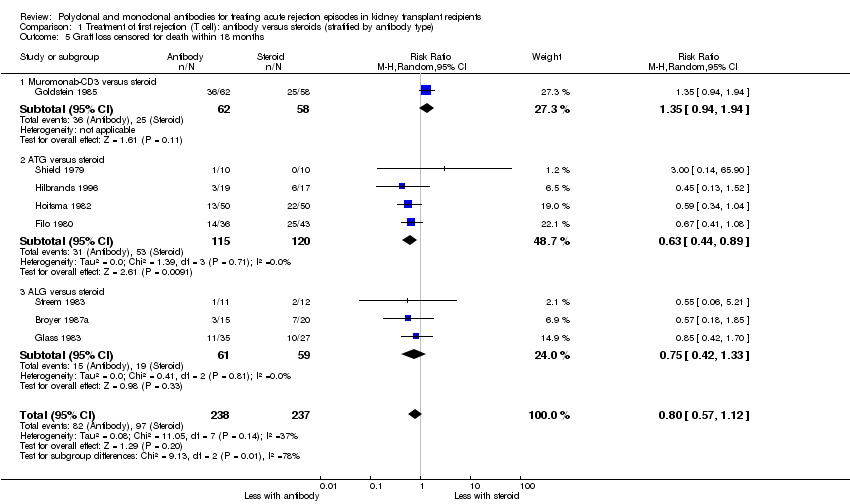
| 5 Graft loss censored for death within 18 months Show forest plot | 8 | 475 | Risk Ratio (M‐H, Random, 95% CI) | 0.80 [0.57, 1.12] |
| Analysis 1.5  Comparison 1 Treatment of first rejection (T cell): antibody versus steroids (stratified by antibody type), Outcome 5 Graft loss censored for death within 18 months. | ||||
| 5.1 Muromonab‐CD3 versus steroid | 1 | 120 | Risk Ratio (M‐H, Random, 95% CI) | 1.35 [0.94, 1.94] |
| 5.2 ATG versus steroid | 4 | 235 | Risk Ratio (M‐H, Random, 95% CI) | 0.63 [0.44, 0.89] |
| 5.3 ALG versus steroid | 3 | 120 | Risk Ratio (M‐H, Random, 95% CI) | 0.75 [0.42, 1.33] |
| 6 Death within 12 months Show forest plot | 7 | 413 | Risk Ratio (M‐H, Random, 95% CI) | 0.98 [0.51, 1.88] |
| Analysis 1.6  Comparison 1 Treatment of first rejection (T cell): antibody versus steroids (stratified by antibody type), Outcome 6 Death within 12 months. | ||||
| 6.1 Muromonab‐CD3 versus steroid | 1 | 120 | Risk Ratio (M‐H, Random, 95% CI) | 1.40 [0.53, 3.70] |
| 6.2 ATG versus steroid | 3 | 173 | Risk Ratio (M‐H, Random, 95% CI) | 0.49 [0.14, 1.74] |
| 6.3 ALG versus steroid | 3 | 120 | Risk Ratio (M‐H, Random, 95% CI) | 1.05 [0.31, 3.60] |
| 7 Treatment adverse events Show forest plot | 5 | Risk Ratio (M‐H, Random, 95% CI) | Subtotals only | |
| Analysis 1.7 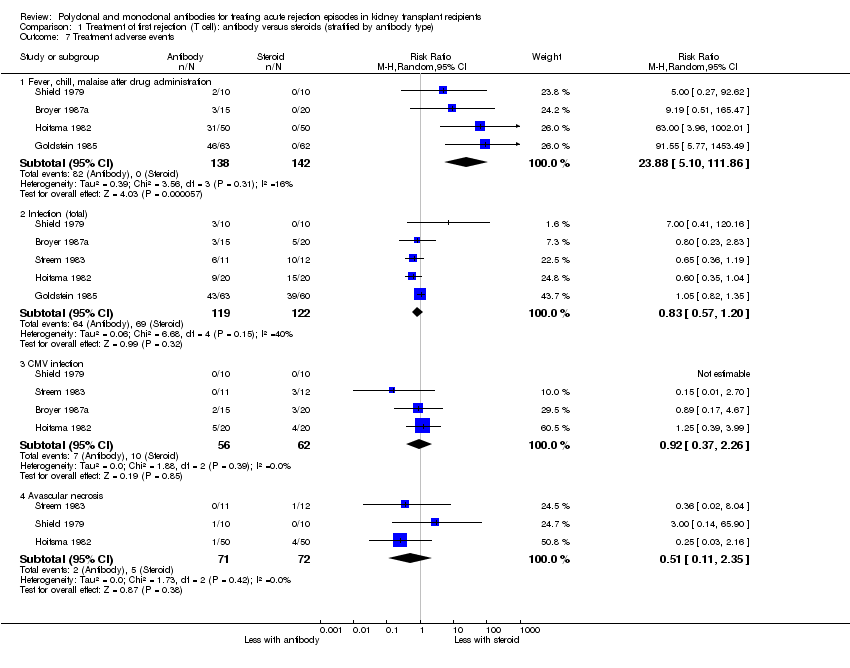 Comparison 1 Treatment of first rejection (T cell): antibody versus steroids (stratified by antibody type), Outcome 7 Treatment adverse events. | ||||
| 7.1 Fever, chill, malaise after drug administration | 4 | 280 | Risk Ratio (M‐H, Random, 95% CI) | 23.88 [5.10, 111.86] |
| 7.2 Infection (total) | 5 | 241 | Risk Ratio (M‐H, Random, 95% CI) | 0.83 [0.57, 1.20] |
| 7.3 CMV infection | 4 | 118 | Risk Ratio (M‐H, Random, 95% CI) | 0.92 [0.37, 2.26] |
| 7.4 Avascular necrosis | 3 | 143 | Risk Ratio (M‐H, Random, 95% CI) | 0.51 [0.11, 2.35] |
| 8 Serum creatinine post treatment (3 months) Show forest plot | 1 | 95 | Mean Difference (IV, Random, 95% CI) | ‐14.0 [‐37.53, 9.53] |
| Analysis 1.8 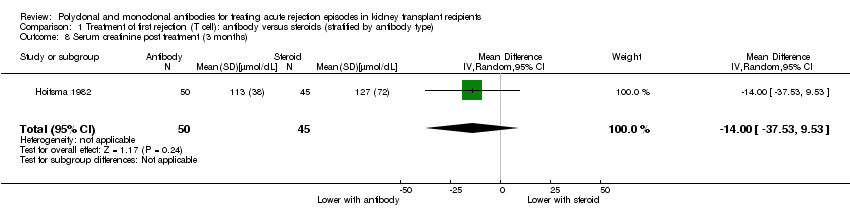 Comparison 1 Treatment of first rejection (T cell): antibody versus steroids (stratified by antibody type), Outcome 8 Serum creatinine post treatment (3 months). | ||||
| Outcome or subgroup title | No. of studies | No. of participants | Statistical method | Effect size |
| 1 Failure of reversal of acute rejection (AR) episode Show forest plot | 1 | Risk Ratio (M‐H, Random, 95% CI) | Totals not selected | |
| Analysis 2.1  Comparison 2 Treatment of first rejection (T cell): antibody + steroids versus steroids alone, Outcome 1 Failure of reversal of acute rejection (AR) episode. | ||||
| 1.1 ALG + steroids versus steroids alone | 1 | Risk Ratio (M‐H, Random, 95% CI) | 0.0 [0.0, 0.0] | |
| 2 Recurrent rejection within 3 months post‐therapy Show forest plot | 1 | Risk Ratio (M‐H, Random, 95% CI) | Totals not selected | |
| Analysis 2.2 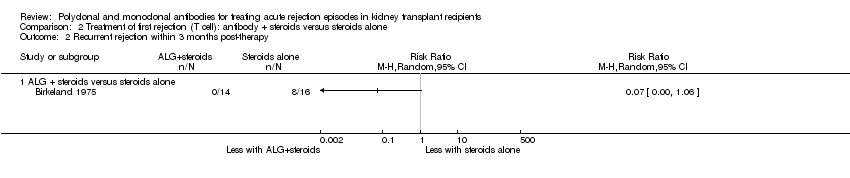 Comparison 2 Treatment of first rejection (T cell): antibody + steroids versus steroids alone, Outcome 2 Recurrent rejection within 3 months post‐therapy. | ||||
| 2.1 ALG + steroids versus steroids alone | 1 | Risk Ratio (M‐H, Random, 95% CI) | 0.0 [0.0, 0.0] | |
| 3 Graft loss or death with a functioning graft within 12 months Show forest plot | 2 | 52 | Risk Ratio (M‐H, Random, 95% CI) | 0.35 [0.02, 5.14] |
| Analysis 2.3  Comparison 2 Treatment of first rejection (T cell): antibody + steroids versus steroids alone, Outcome 3 Graft loss or death with a functioning graft within 12 months. | ||||
| 3.1 ALG + steroids versus steroids alone | 1 | 32 | Risk Ratio (M‐H, Random, 95% CI) | 1.0 [0.24, 4.23] |
| 3.2 ATG + steroids versus steroids alone | 1 | 20 | Risk Ratio (M‐H, Random, 95% CI) | 0.08 [0.00, 1.21] |
| 4 Graft loss censored for death within 12 months Show forest plot | 2 | 50 | Risk Ratio (M‐H, Random, 95% CI) | 0.33 [0.03, 4.16] |
| Analysis 2.4  Comparison 2 Treatment of first rejection (T cell): antibody + steroids versus steroids alone, Outcome 4 Graft loss censored for death within 12 months. | ||||
| 4.1 ALG + steroids versus steroids alone | 1 | 30 | Risk Ratio (M‐H, Random, 95% CI) | 0.86 [0.23, 3.19] |
| 4.2 ATG + steroids versus steroids alone | 1 | 20 | Risk Ratio (M‐H, Random, 95% CI) | 0.08 [0.00, 1.21] |
| 5 Death within 12 months Show forest plot | 2 | 50 | Risk Ratio (M‐H, Random, 95% CI) | 0.86 [0.53, 1.39] |
| Analysis 2.5 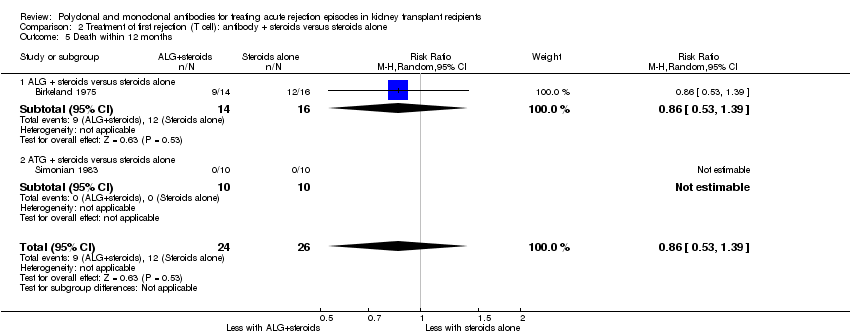 Comparison 2 Treatment of first rejection (T cell): antibody + steroids versus steroids alone, Outcome 5 Death within 12 months. | ||||
| 5.1 ALG + steroids versus steroids alone | 1 | 30 | Risk Ratio (M‐H, Random, 95% CI) | 0.86 [0.53, 1.39] |
| 5.2 ATG + steroids versus steroids alone | 1 | 20 | Risk Ratio (M‐H, Random, 95% CI) | 0.0 [0.0, 0.0] |
| Outcome or subgroup title | No. of studies | No. of participants | Statistical method | Effect size |
| 1 Failure of acute rejection reversal Show forest plot | 2 | 132 | Risk Ratio (M‐H, Random, 95% CI) | 1.84 [0.92, 3.67] |
| Analysis 3.1 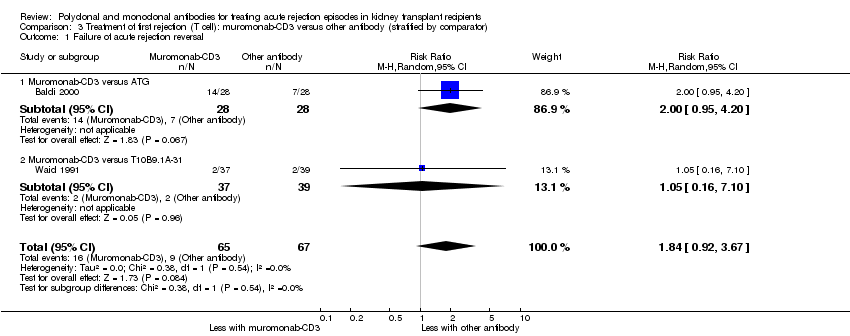 Comparison 3 Treatment of first rejection (T cell): muromonab‐CD3 versus other antibody (stratified by comparator), Outcome 1 Failure of acute rejection reversal. | ||||
| 1.1 Muromonab‐CD3 versus ATG | 1 | 56 | Risk Ratio (M‐H, Random, 95% CI) | 2.0 [0.95, 4.20] |
| 1.2 Muromonab‐CD3 versus T10B9.1A‐31 | 1 | 76 | Risk Ratio (M‐H, Random, 95% CI) | 1.05 [0.16, 7.10] |
| 2 Additional treatment needed Show forest plot | 2 | 132 | Risk Ratio (M‐H, Random, 95% CI) | 1.67 [0.77, 3.63] |
| Analysis 3.2  Comparison 3 Treatment of first rejection (T cell): muromonab‐CD3 versus other antibody (stratified by comparator), Outcome 2 Additional treatment needed. | ||||
| 2.1 Muromonab‐CD3 versus ATG | 1 | 56 | Risk Ratio (M‐H, Random, 95% CI) | 1.83 [0.79, 4.27] |
| 2.2 Muromonab‐CD3 versus T10B9.1A‐31 | 1 | 76 | Risk Ratio (M‐H, Random, 95% CI) | 1.05 [0.16, 7.10] |
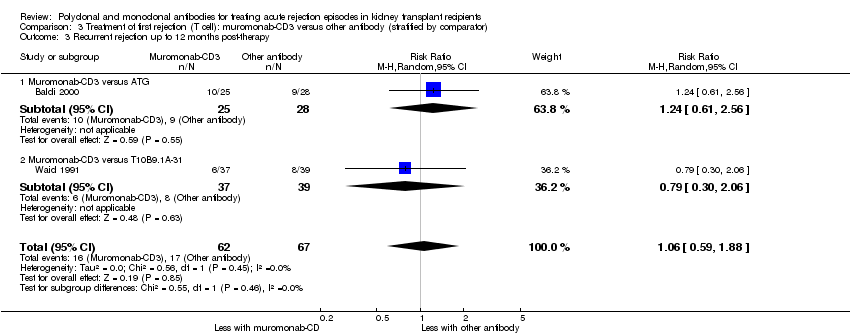
| 3 Recurrent rejection up to 12 months post‐therapy Show forest plot | 2 | 129 | Risk Ratio (M‐H, Random, 95% CI) | 1.06 [0.59, 1.88] |
| Analysis 3.3  Comparison 3 Treatment of first rejection (T cell): muromonab‐CD3 versus other antibody (stratified by comparator), Outcome 3 Recurrent rejection up to 12 months post‐therapy. | ||||
| 3.1 Muromonab‐CD3 versus ATG | 1 | 53 | Risk Ratio (M‐H, Random, 95% CI) | 1.24 [0.61, 2.56] |
| 3.2 Muromonab‐CD3 versus T10B9.1A‐31 | 1 | 76 | Risk Ratio (M‐H, Random, 95% CI) | 0.79 [0.30, 2.06] |
| 4 Treatment adverse events Show forest plot | 2 | Risk Ratio (M‐H, Random, 95% CI) | Subtotals only | |
| Analysis 3.4  Comparison 3 Treatment of first rejection (T cell): muromonab‐CD3 versus other antibody (stratified by comparator), Outcome 4 Treatment adverse events. | ||||
| 4.1 Fever, chills, malaise after drug administration | 2 | 132 | Risk Ratio (M‐H, Random, 95% CI) | 3.12 [1.87, 5.21] |
| 4.2 Gastrointestinal side effects | 2 | 132 | Risk Ratio (M‐H, Random, 95% CI) | 8.23 [0.90, 75.11] |
| 4.3 Neurological side effects | 2 | 132 | Risk Ratio (M‐H, Random, 95% CI) | 13.10 [1.43, 120.05] |
| 4.4 Infection (total) | 2 | 86 | Risk Ratio (M‐H, Random, 95% CI) | 1.53 [0.69, 3.40] |
| 4.5 CMV infection (total) | 2 | 132 | Risk Ratio (M‐H, Random, 95% CI) | 2.25 [0.31, 16.08] |
| 4.6 Malignancy (total) | 2 | 132 | Risk Ratio (M‐H, Random, 95% CI) | 0.26 [0.03, 2.30] |
| Outcome or subgroup title | No. of studies | No. of participants | Statistical method | Effect size |
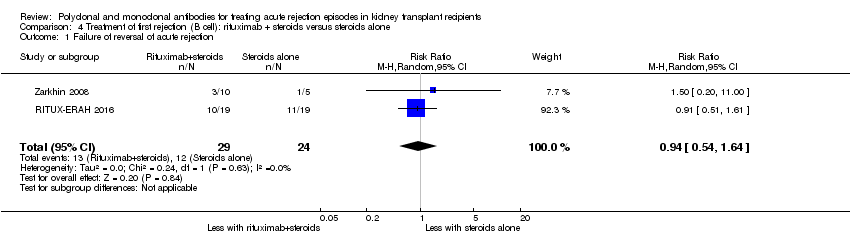
| 1 Failure of reversal of acute rejection Show forest plot | 2 | 53 | Risk Ratio (M‐H, Random, 95% CI) | 0.94 [0.54, 1.64] |
| Analysis 4.1  Comparison 4 Treatment of first rejection (B cell): rituximab + steroids versus steroids alone, Outcome 1 Failure of reversal of acute rejection. | ||||
| 2 Additional treatment required Show forest plot | 1 | 20 | Risk Ratio (M‐H, Random, 95% CI) | 1.33 [0.40, 4.49] |
| Analysis 4.2  Comparison 4 Treatment of first rejection (B cell): rituximab + steroids versus steroids alone, Outcome 2 Additional treatment required. | ||||
| 3 Graft loss or death with a functioning graft within 12 months Show forest plot | 2 | 58 | Risk Ratio (M‐H, Random, 95% CI) | 1.0 [0.23, 4.35] |
| Analysis 4.3  Comparison 4 Treatment of first rejection (B cell): rituximab + steroids versus steroids alone, Outcome 3 Graft loss or death with a functioning graft within 12 months. | ||||
| 4 Death within 12 months Show forest plot | 2 | 58 | Risk Ratio (M‐H, Random, 95% CI) | 0.0 [0.0, 0.0] |
| Analysis 4.4  Comparison 4 Treatment of first rejection (B cell): rituximab + steroids versus steroids alone, Outcome 4 Death within 12 months. | ||||
| 5 Treatment adverse events Show forest plot | 2 | Risk Ratio (M‐H, Random, 95% CI) | Subtotals only | |
| Analysis 4.5 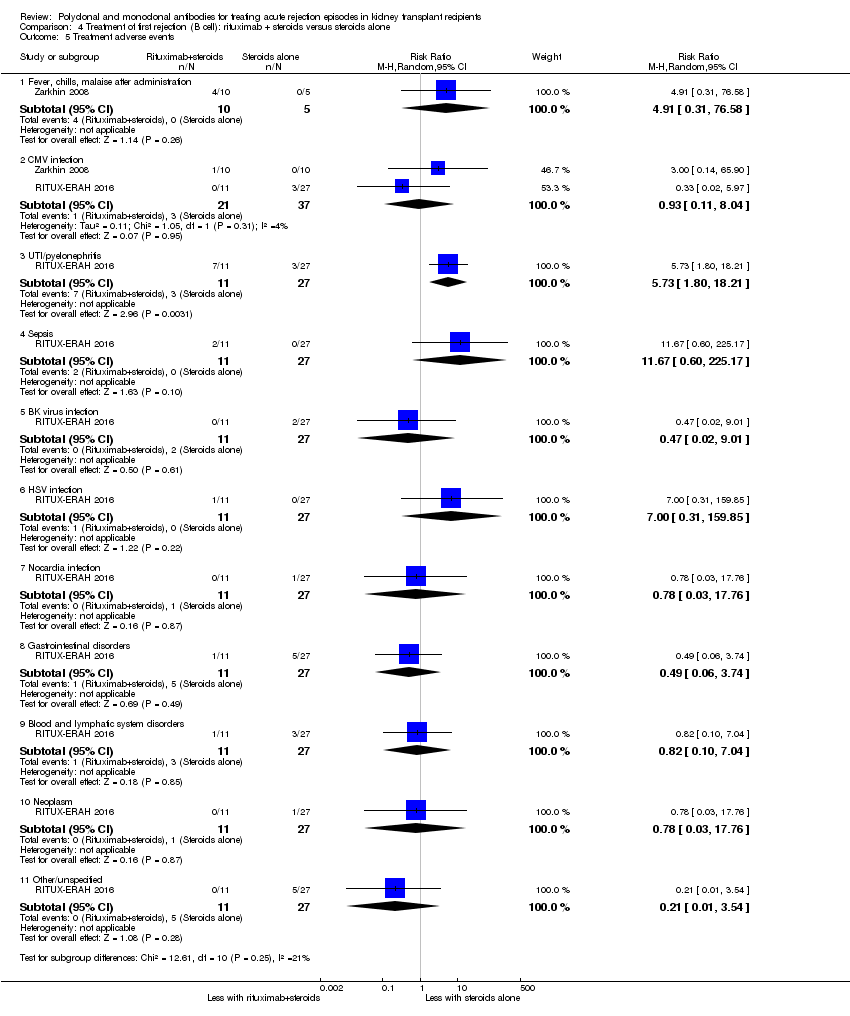 Comparison 4 Treatment of first rejection (B cell): rituximab + steroids versus steroids alone, Outcome 5 Treatment adverse events. | ||||
| 5.1 Fever, chills, malaise after administration | 1 | 15 | Risk Ratio (M‐H, Random, 95% CI) | 4.91 [0.31, 76.58] |
| 5.2 CMV infection | 2 | 58 | Risk Ratio (M‐H, Random, 95% CI) | 0.93 [0.11, 8.04] |
| 5.3 UTI/pyelonephritis | 1 | 38 | Risk Ratio (M‐H, Random, 95% CI) | 5.73 [1.80, 18.21] |
| 5.4 Sepsis | 1 | 38 | Risk Ratio (M‐H, Random, 95% CI) | 11.67 [0.60, 225.17] |
| 5.5 BK virus infection | 1 | 38 | Risk Ratio (M‐H, Random, 95% CI) | 0.47 [0.02, 9.01] |
| 5.6 HSV infection | 1 | 38 | Risk Ratio (M‐H, Random, 95% CI) | 7.00 [0.31, 159.85] |
| 5.7 Nocardia infection | 1 | 38 | Risk Ratio (M‐H, Random, 95% CI) | 0.78 [0.03, 17.76] |
| 5.8 Gastrointestinal disorders | 1 | 38 | Risk Ratio (M‐H, Random, 95% CI) | 0.49 [0.06, 3.74] |
| 5.9 Blood and lymphatic system disorders | 1 | 38 | Risk Ratio (M‐H, Random, 95% CI) | 0.82 [0.10, 7.04] |
| 5.10 Neoplasm | 1 | 38 | Risk Ratio (M‐H, Random, 95% CI) | 0.78 [0.03, 17.76] |
| 5.11 Other/unspecified | 1 | 38 | Risk Ratio (M‐H, Random, 95% CI) | 0.21 [0.01, 3.54] |
| Outcome or subgroup title | No. of studies | No. of participants | Statistical method | Effect size |
| 1 Failure of acute rejection reversal Show forest plot | 5 | 244 | Risk Ratio (M‐H, Random, 95% CI) | 1.07 [0.63, 1.81] |
| Analysis 5.1 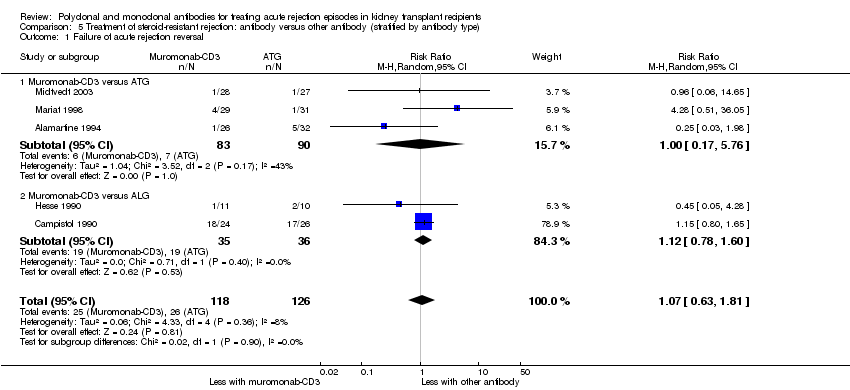 Comparison 5 Treatment of steroid‐resistant rejection: antibody versus other antibody (stratified by antibody type), Outcome 1 Failure of acute rejection reversal. | ||||
| 1.1 Muromonab‐CD3 versus ATG | 3 | 173 | Risk Ratio (M‐H, Random, 95% CI) | 1.00 [0.17, 5.76] |
| 1.2 Muromonab‐CD3 versus ALG | 2 | 71 | Risk Ratio (M‐H, Random, 95% CI) | 1.12 [0.78, 1.60] |
| 2 Additional treatment required Show forest plot | 1 | Risk Ratio (M‐H, Random, 95% CI) | Subtotals only | |
| Analysis 5.2  Comparison 5 Treatment of steroid‐resistant rejection: antibody versus other antibody (stratified by antibody type), Outcome 2 Additional treatment required. | ||||
| 2.1 Muromonab‐CD3 versus ATG | 1 | 55 | Risk Ratio (M‐H, Random, 95% CI) | 1.16 [0.40, 3.35] |
| 3 Recurrent rejection Show forest plot | 5 | 284 | Risk Ratio (M‐H, Random, 95% CI) | 0.78 [0.47, 1.28] |
| Analysis 5.3  Comparison 5 Treatment of steroid‐resistant rejection: antibody versus other antibody (stratified by antibody type), Outcome 3 Recurrent rejection. | ||||
| 3.1 Muromonab‐CD3 versus ATG | 3 | 174 | Risk Ratio (M‐H, Random, 95% CI) | 1.08 [0.71, 1.64] |
| 3.2 Muromonab‐CD3 versus ALG | 2 | 110 | Risk Ratio (M‐H, Random, 95% CI) | 0.47 [0.21, 1.06] |
| 4 Graft loss censored for death (< 1 year) Show forest plot | 5 | 244 | Risk Ratio (M‐H, Random, 95% CI) | 0.86 [0.34, 2.17] |
| Analysis 5.4  Comparison 5 Treatment of steroid‐resistant rejection: antibody versus other antibody (stratified by antibody type), Outcome 4 Graft loss censored for death (< 1 year). | ||||
| 4.1 Muromonab‐CD3 versus ATG | 3 | 173 | Risk Ratio (M‐H, Random, 95% CI) | 1.54 [0.28, 8.57] |
| 4.2 Muromonab‐CD3 versus ALG | 2 | 71 | Risk Ratio (M‐H, Random, 95% CI) | 0.59 [0.24, 1.49] |
| 5 Graft loss or death with a functioning graft (< 1 year) Show forest plot | 5 | 211 | Risk Ratio (M‐H, Random, 95% CI) | 0.81 [0.43, 1.51] |
| Analysis 5.5  Comparison 5 Treatment of steroid‐resistant rejection: antibody versus other antibody (stratified by antibody type), Outcome 5 Graft loss or death with a functioning graft (< 1 year). | ||||
| 5.1 Muromonab‐CD3 versus ATG | 4 | 190 | Risk Ratio (M‐H, Random, 95% CI) | 0.87 [0.49, 1.55] |
| 5.2 Muromonab‐CD3 versus ALG | 1 | 21 | Risk Ratio (M‐H, Random, 95% CI) | 0.13 [0.01, 2.26] |
| 6 Death within 12 months Show forest plot | 3 | 175 | Risk Ratio (M‐H, Random, 95% CI) | 0.39 [0.09, 1.65] |
| Analysis 5.6  Comparison 5 Treatment of steroid‐resistant rejection: antibody versus other antibody (stratified by antibody type), Outcome 6 Death within 12 months. | ||||
| 6.1 Muromonab‐CD3 versus ATG | 2 | 115 | Risk Ratio (M‐H, Random, 95% CI) | 0.41 [0.08, 2.05] |
| 6.2 Muromonab‐CD3 versus ALG | 1 | 60 | Risk Ratio (M‐H, Random, 95% CI) | 0.33 [0.01, 7.87] |
| 7 Treatment adverse events Show forest plot | 5 | Risk Ratio (M‐H, Random, 95% CI) | Subtotals only | |
| Analysis 5.7  Comparison 5 Treatment of steroid‐resistant rejection: antibody versus other antibody (stratified by antibody type), Outcome 7 Treatment adverse events. | ||||
| 7.1 Fever, chills, malaise after administration | 3 | 140 | Risk Ratio (M‐H, Random, 95% CI) | 2.54 [0.18, 34.92] |
| 7.2 Infection (bacterial) | 2 | 109 | Risk Ratio (M‐H, Random, 95% CI) | 8.64 [1.64, 45.56] |
| 7.3 Infection (viral) | 1 | 59 | Risk Ratio (M‐H, Random, 95% CI) | 0.53 [0.29, 0.97] |
| 7.4 Infection (fungal) | 1 | 50 | Risk Ratio (M‐H, Random, 95% CI) | 7.56 [0.41, 139.17] |
| 7.5 CMV infection | 5 | 284 | Risk Ratio (M‐H, Random, 95% CI) | 0.93 [0.60, 1.43] |
| 7.6 Malignancy (total) | 2 | 115 | Risk Ratio (M‐H, Random, 95% CI) | 2.09 [0.28, 15.66] |
| 8 Serum creatinine post treatment (3 days) Show forest plot | 1 | 38 | Mean Difference (IV, Random, 95% CI) | 1.50 [‐0.25, 3.25] |
| Analysis 5.8  Comparison 5 Treatment of steroid‐resistant rejection: antibody versus other antibody (stratified by antibody type), Outcome 8 Serum creatinine post treatment (3 days). | ||||
| 9 Serum creatinine at 12 months Show forest plot | 4 | Mean Difference (IV, Random, 95% CI) | Subtotals only | |
| Analysis 5.9  Comparison 5 Treatment of steroid‐resistant rejection: antibody versus other antibody (stratified by antibody type), Outcome 9 Serum creatinine at 12 months. | ||||
| 9.1 Muromonab‐CD3 versus ATG | 4 | 179 | Mean Difference (IV, Random, 95% CI) | 5.93 [‐18.46, 30.32] |

Study flow diagram.
Comparison 1 Treatment of first rejection (T cell): antibody versus steroids (stratified by antibody type), Outcome 1 Failure of reversal of acute rejection.

Comparison 1 Treatment of first rejection (T cell): antibody versus steroids (stratified by antibody type), Outcome 2 Additional treatment needed.

Comparison 1 Treatment of first rejection (T cell): antibody versus steroids (stratified by antibody type), Outcome 3 Recurrent rejection up to 12 months post‐therapy.

Comparison 1 Treatment of first rejection (T cell): antibody versus steroids (stratified by antibody type), Outcome 4 Graft loss or death with a functioning graft within 12 months.
Comparison 1 Treatment of first rejection (T cell): antibody versus steroids (stratified by antibody type), Outcome 5 Graft loss censored for death within 18 months.

Comparison 1 Treatment of first rejection (T cell): antibody versus steroids (stratified by antibody type), Outcome 6 Death within 12 months.

Comparison 1 Treatment of first rejection (T cell): antibody versus steroids (stratified by antibody type), Outcome 7 Treatment adverse events.

Comparison 1 Treatment of first rejection (T cell): antibody versus steroids (stratified by antibody type), Outcome 8 Serum creatinine post treatment (3 months).

Comparison 2 Treatment of first rejection (T cell): antibody + steroids versus steroids alone, Outcome 1 Failure of reversal of acute rejection (AR) episode.

Comparison 2 Treatment of first rejection (T cell): antibody + steroids versus steroids alone, Outcome 2 Recurrent rejection within 3 months post‐therapy.

Comparison 2 Treatment of first rejection (T cell): antibody + steroids versus steroids alone, Outcome 3 Graft loss or death with a functioning graft within 12 months.

Comparison 2 Treatment of first rejection (T cell): antibody + steroids versus steroids alone, Outcome 4 Graft loss censored for death within 12 months.

Comparison 2 Treatment of first rejection (T cell): antibody + steroids versus steroids alone, Outcome 5 Death within 12 months.

Comparison 3 Treatment of first rejection (T cell): muromonab‐CD3 versus other antibody (stratified by comparator), Outcome 1 Failure of acute rejection reversal.

Comparison 3 Treatment of first rejection (T cell): muromonab‐CD3 versus other antibody (stratified by comparator), Outcome 2 Additional treatment needed.
Comparison 3 Treatment of first rejection (T cell): muromonab‐CD3 versus other antibody (stratified by comparator), Outcome 3 Recurrent rejection up to 12 months post‐therapy.

Comparison 3 Treatment of first rejection (T cell): muromonab‐CD3 versus other antibody (stratified by comparator), Outcome 4 Treatment adverse events.
Comparison 4 Treatment of first rejection (B cell): rituximab + steroids versus steroids alone, Outcome 1 Failure of reversal of acute rejection.
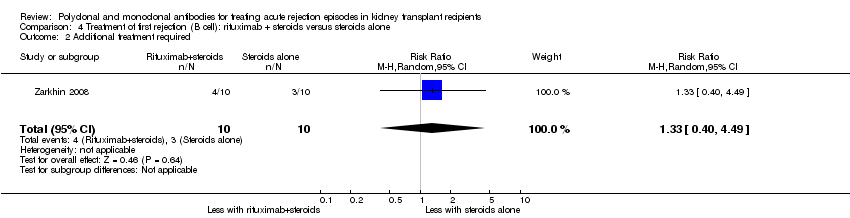
Comparison 4 Treatment of first rejection (B cell): rituximab + steroids versus steroids alone, Outcome 2 Additional treatment required.

Comparison 4 Treatment of first rejection (B cell): rituximab + steroids versus steroids alone, Outcome 3 Graft loss or death with a functioning graft within 12 months.

Comparison 4 Treatment of first rejection (B cell): rituximab + steroids versus steroids alone, Outcome 4 Death within 12 months.

Comparison 4 Treatment of first rejection (B cell): rituximab + steroids versus steroids alone, Outcome 5 Treatment adverse events.

Comparison 5 Treatment of steroid‐resistant rejection: antibody versus other antibody (stratified by antibody type), Outcome 1 Failure of acute rejection reversal.

Comparison 5 Treatment of steroid‐resistant rejection: antibody versus other antibody (stratified by antibody type), Outcome 2 Additional treatment required.
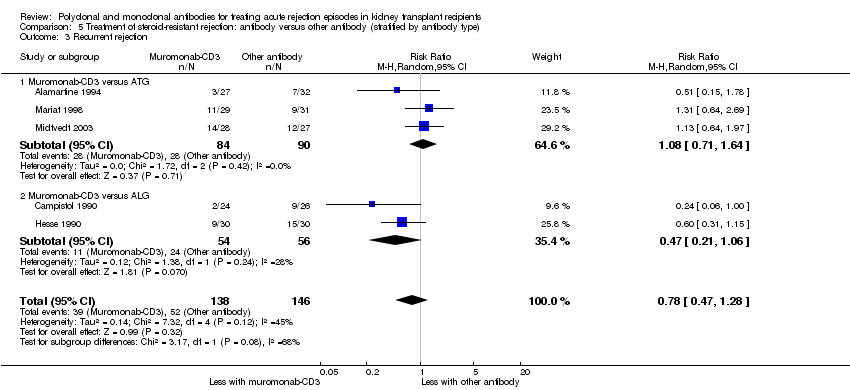
Comparison 5 Treatment of steroid‐resistant rejection: antibody versus other antibody (stratified by antibody type), Outcome 3 Recurrent rejection.
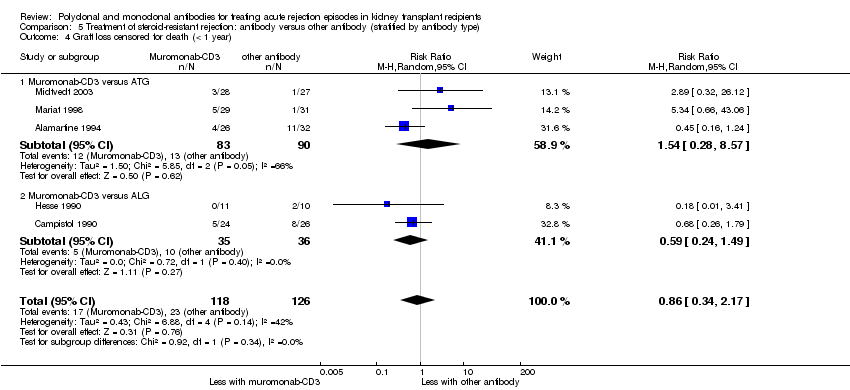
Comparison 5 Treatment of steroid‐resistant rejection: antibody versus other antibody (stratified by antibody type), Outcome 4 Graft loss censored for death (< 1 year).
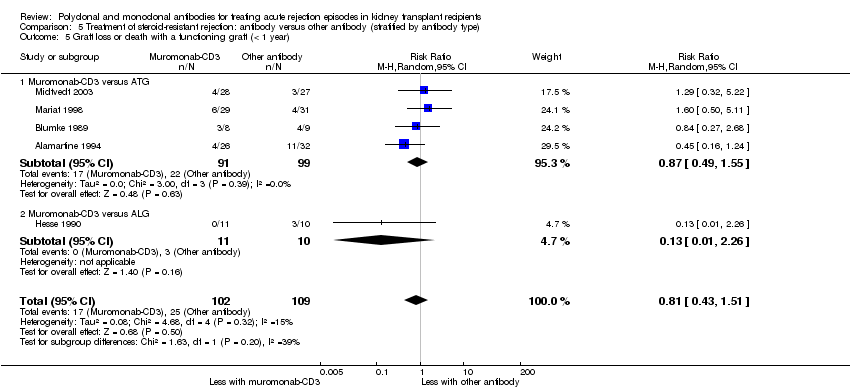
Comparison 5 Treatment of steroid‐resistant rejection: antibody versus other antibody (stratified by antibody type), Outcome 5 Graft loss or death with a functioning graft (< 1 year).
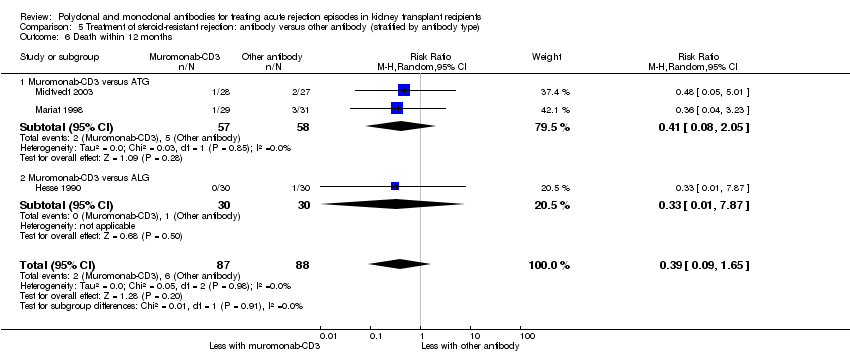
Comparison 5 Treatment of steroid‐resistant rejection: antibody versus other antibody (stratified by antibody type), Outcome 6 Death within 12 months.

Comparison 5 Treatment of steroid‐resistant rejection: antibody versus other antibody (stratified by antibody type), Outcome 7 Treatment adverse events.
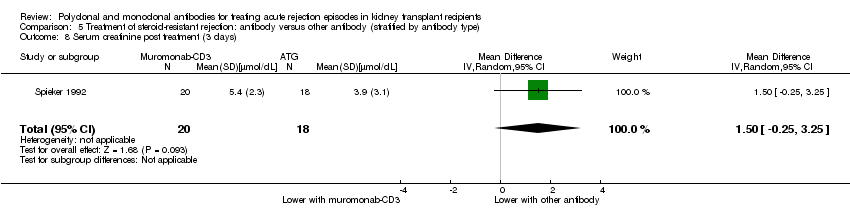
Comparison 5 Treatment of steroid‐resistant rejection: antibody versus other antibody (stratified by antibody type), Outcome 8 Serum creatinine post treatment (3 days).
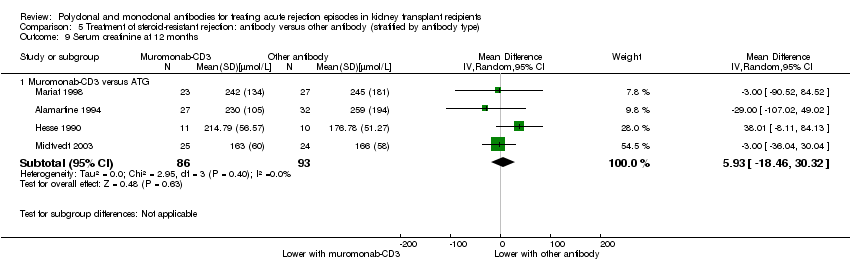
Comparison 5 Treatment of steroid‐resistant rejection: antibody versus other antibody (stratified by antibody type), Outcome 9 Serum creatinine at 12 months.
| Antibody (T cell) versus steroid (stratified by antibody type) for the treatment of first rejection episodes in kidney transplant recipients | |||||
| Patient or population: kidney transplant recipients: first rejection episode | |||||
| Outcomes | Anticipated absolute effects* (95% CI) | Relative effect | No. of participants | Quality of the evidence | |
| Risk with steroid (stratified by antibody type) | Risk with antibody (T cell) | ||||
| Failure of reversal of acute rejection | Study population | RR 0.50 | 405 (6) | ⊕⊕⊕⊝ | |
| 342 per 1,000 | 171 per 1,000 | ||||
| Recurrent rejection | Study population | RR 0.75 | 508 (9) | ⊕⊕⊕⊝ | |
| 566 per 1,000 | 425 per 1,000 | ||||
| Graft loss or death with a functioning graft | Study population | RR 0.84 | 490 (8) | ⊕⊕⊝⊝ | |
| 459 per 1,000 | 385 per 1,000 | ||||
| Graft loss censored for death | Study population | RR 0.80 | 475 (8) | ⊕⊕⊝⊝ | |
| 409 per 1,000 | 327 per 1,000 | ||||
| Death | Study population | RR 0.98 | 413 (7) | ⊕⊝⊝⊝ | |
| 83 per 1,000 | 81 per 1,000 | ||||
| Treatment adverse events: fever, chill, or malaise after drug administration | Study population | RR 23.88 | 280 (4) | ⊕⊝⊝⊝ | |
| 0 per 1,000 | 0 per 1,000 | ||||
| *The risk in the intervention group (and its 95% CI) is based on the assumed risk in the comparison group and the relative effect of the intervention (and its 95% CI). | |||||
| GRADE Working Group grades of evidence | |||||
| 1 Unclear/high risk in multiple studies for allocation concealment and selective reporting 2 CI includes null effect and potential for some harm and benefit 3 CI includes null effect and appreciable harm and benefit 4 High I2 (81%) and great variation in size of effect across all different treatment adverse effects | |||||
| Antibody (T cell) + steroid versus steroid alone for the treatment of first rejection episodes in kidney transplant recipients | |||||
| Patient or population: treatment of first rejection episodes in kidney transplant recipients: first rejection episode | |||||
| Outcomes | Anticipated absolute effects* (95% CI) | Relative effect | No. of participants | Quality of the evidence | |
| Risk with steroid alone | Risk with antibody (T cell) + steroid | ||||
| Failure of reversal of acute rejection episode | Study population | RR 0.42 | 30 (1) | ⊕⊕⊝⊝ | |
| 688 per 1,000 | 289 per 1,000 | ||||
| Recurrent rejection | Study population | RR 0.07 | 30 (1) | ⊕⊕⊝⊝ | |
| 500 per 1,000 | 35 per 1,000 | ||||
| Graft loss or death with a functioning graft | Study population | RR 0.35 | 52 (2) | ⊕⊝⊝⊝ | |
| 346 per 1,000 | 121 per 1,000 | ||||
| Graft loss censored for death | Study population | RR 0.33 | 50 (2) | ⊕⊝⊝⊝ | |
| 385 per 1,000 | 127 per 1,000 | ||||
| Death | Study population | RR 0.86 | 50 (2) | ⊕⊕⊝⊝ | |
| 462 per 1,000 | 397 per 1,000 | ||||
| *The risk in the intervention group (and its 95% CI) is based on the assumed risk in the comparison group and the relative effect of the intervention (and its 95% CI). | |||||
| GRADE Working Group grades of evidence | |||||
| 1 Small sample size and few number of events 2 Width of CI is very wide. CI includes null effect and is strongly one‐sided. 3 Unclear risk for random sequence generation and allocation concealment, and high risk for selective reporting 4 Big variation in size of effect with small overlap of CI and high I2 value 5 Width of CI is very wide. CI includes both null effect and appreciable benefit and harm 6 CI includes both null effect and appreciable benefit and harm | |||||
| Muromonab‐CD3 (T cell) versus other antibody (stratified by comparator) for the treatment of first rejection episodes in kidney transplant recipients | |||||
| Patient or population: kidney transplant recipients: first rejection episode | |||||
| Outcomes | Anticipated absolute effects* (95% CI) | Relative effect | No. of participants | Quality of the evidence | |
| Risk with other antibody (stratified by comparator) | Risk with muromonab‐CD3 (T cell) | ||||
| Failure of acute rejection reversal | Study population | RR 1.84 | 132 (2) | ⊕⊕⊕⊝ | |
| 134 per 1,000 | 247 per 1,000 | ||||
| Recurrent rejection | Study population | RR 1.06 | 129 (2) | ⊕⊕⊕⊝ | |
| 254 per 1,000 | 269 per 1,000 | ||||
| Treatment adverse events: fever, chills, malaise after drug administration | Study population | RR 3.12 | 132 (2) | ⊕⊕⊝⊝ | |
| 269 per 1,000 | 838 per 1,000 | ||||
| Treatment adverse events: neurological side effects | Study population | RR 13.10 (1.43 to 120.05) | 132 (2) | ⊕⊕⊝⊝ | |
| 15 per 1,000 | 196 per 1,000 (21 to 1,000) | ||||
| *The risk in the intervention group (and its 95% CI) is based on the assumed risk in the comparison group and the relative effect of the intervention (and its 95% CI). | |||||
| GRADE Working Group grades of evidence | |||||
| 1 Small sample size and few number of events 2 CI includes null effect and potential for some harm and benefit 3 High I2 value and wide variation in size of effect | |||||
| Rituximab (B cell) + steroid versus steroid alone for the treatment of first rejection episodes in kidney transplant recipients | |||||
| Patient or population: kidney transplant recipients: first rejection episode | |||||
| Outcomes | Anticipated absolute effects* (95% CI) | Relative effect | No. of participants | Quality of the evidence | |
| Risk with steroid alone | Risk with rituximab (B cell) + steroid | ||||
| Failure of reversal of acute rejection | Study population | RR 0.94 | 53 (2) | ⊕⊕⊕⊝ | |
| 500 per 1,000 | 470 per 1,000 | ||||
| Graft loss or death with a functioning graft | Study population | RR 1.00 | 58 (2) | ⊕⊕⊕⊝ | |
| 103 per 1,000 | 103 per 1,000 | ||||
| Death | Study population | not estimable | 58 (2) | ⊕⊕⊕⊕ | |
| 0 per 1,000 | 0 per 1,000 | ||||
| Treatment adverse events: UTI/pyelonephritis | Study population | RR 5.73 | 38 (1) | ⊕⊕⊕⊝ | |
| 111 per 1,000 | 637 per 1,000 | ||||
| *The risk in the intervention group (and its 95% CI) is based on the assumed risk in the comparison group and the relative effect of the intervention (and its 95% CI). | |||||
| GRADE Working Group grades of evidence | |||||
| 1 Small sample size and few number of events 2 CI includes both null effect and appreciable benefit and harm | |||||
| Antibody versus other antibody (stratified by antibody type) for the treatment of steroid‐resistant rejection episodes in kidney transplant recipients | |||||
| Patient or population: kidney transplant recipients: steroid‐resistant rejection episodes | |||||
| Outcomes | Anticipated absolute effects* (95% CI) | Relative effect | No. of participants | Quality of the evidence | |
| Risk with other antibody (stratified by antibody type) | Risk with antibody | ||||
| Failure of acute rejection reversal | Study population | RR 1.07 | 244 (5) | ⊕⊕⊝⊝ | |
| 206 per 1,000 | 221 per 1,000 | ||||
| Recurrent rejection | Study population | RR 0.78 | 284 (5) | ⊕⊕⊝⊝ | |
| 356 per 1,000 | 278 per 1,000 | ||||
| Graft loss censored for death | Study population | RR 0.86 | 244 (5) | ⊕⊕⊝⊝ | |
| 183 per 1,000 | 157 per 1,000 | ||||
| Graft loss or death with a functioning graft | Study population | RR 0.81 | 211 (5) | ⊕⊕⊝⊝ | |
| 229 per 1,000 | 186 per 1,000 | ||||
| Death | Study population | RR 0.39 | 175 (3) | ⊕⊕⊝⊝ | |
| 68 per 1,000 | 27 per 1,000 | ||||
| Treatment adverse events: fever, chills, malaise after drug administration | Study population | ⊕⊕⊝⊝ | |||
| 342 per 1,000 | 870 per 1,000 (62 to 1,000) | RR 2.54 (0.18 to 34.92) | 140 (3) | ||
| Treatment adverse events: bacterial infection | Study population | RR 8.64 | 109 (2) | ⊕⊝⊝⊝ | |
| 17 per 1,000 | 149 per 1,000 | ||||
| *The risk in the intervention group (and its 95% CI) is based on the assumed risk in the comparison group and the relative effect of the intervention (and its 95% CI). | |||||
| GRADE Working Group grades of evidence | |||||
| 1 CI includes both null effect and appreciable benefit and harm 2 Unclear risk for random sequence generation and allocation across all studies 3 Small sample size and few number of events 4 High I2 value and wide variation in size of effect | |||||
| Study ID | Days since transplant | Timing of randomisation | Criteria for rejection* | Criteria for rejection reversal* |
| Antibody versus steroid | ||||
| < 35 | Rejection | Scoring algorithm of biochemical, and physical signs, with confirmatory “biopsy where possible” | Day 2 of “persistent creatinine fall” | |
| < 90 | Rejection | “Clinical signs, imaging and renal function tests” | Increase in creatinine within 24 to 48 hours of bolus MP | |
| < 90 | Rejection | Increased creatinine, oliguria, sodium retention, weight gain, proteinuria, graft tenderness | Day 2 of 3 consecutive days of creatinine falling | |
| ns | Transplantation | Clinical criteria including creatinine rise for 3 sequential days | Improvement in creatinine and clinical signs at 7th day of treatment | |
| ns | Transplantation | Rise in creatinine and diminished function on I‐131 scan, with “supportive clinical findings” with confirmatory “biopsy where possible” | Day 2 of “persistent creatinine fall” | |
| 6‐90 | Rejection | Scoring algorithm of biochemical, and physical signs, with confirmatory “biopsy where possible” | 3 day progressive fall in creatinine, or investigator judged clinical reversal. | |
| > 8 | Rejection | “Rise in plasma creatinine” and “changes in kidney echogenicity” on ultrasound. If unsure, “rejection was confirmed by kidney biopsy” | ns | |
| < 90 | Rejection | ns | ns | |
| ns | Rejection | Clinical ± biopsy confirmation | Not assessed. Severity of rejection episode judged by AUC of serial 10 day creatinine measurements. | |
| Antibody and steroid versus steroid alone | ||||
| ns | Rejection | “Common clinical criteria”, with biopsy where possible | Day 2 of progressive rise in creatinine clearance | |
| ns | Rejection | ns | ns | |
| Antibody versus other antibody | ||||
| ns | Transplantation | Primarily by laboratory signs of increase in SCr ≥ 0.3 mg/dL on any given day, or “clinical signs associated with rejection” and “an increase in kidney size on ultrasound” | ns | |
| ns | Rejection | 4 of 7 clinical and biochemical signs, subsequently confirmed by biopsy | Absence of cross‐over, re‐treatment or graft loss | |
| ns | Rejection | 20% increase in creatinine with clinical suggestive signs, and biopsy if > 10 days from transplantation | ns | |
| Formulation comparisons | ||||
| ns | Rejection | Standard clinical indicators with supplementary “biopsy where possible” | 1st of 3 consecutive days of creatinine falling | |
| Antibody versus other treatment | ||||
| ns | Rejection | Rise in creatinine of 0.3 mg/dL and deterioration of renogram, “mostly confirmed by biopsy” | ns | |
| > 90 | 90 days post‐transplant | ns | ns | |
| * direct quotation from the text of study reports appears in quotation marks AUC ‐ area under the curve; ns ‐ not stated and could not be clarified or deduced; MP ‐ methylprednisolone; SCr ‐ serum creatinine | ||||
| Study ID | Days since transplant* | Timing of randomisation* | Criteria for rejection* | Criteria for rejection reversal* |
| Antibody versus placebo | ||||
| ns | Rejection | “Biopsy proven” and Banff graded | “Recovery of graft function to within 20% of the baseline pre‐rejection value 1, 3, 6, and 12 months after the episode”, and “Resolution of the Banff biopsy grade” | |
| ns | Rejection | “Biopsy proven” | “Improvement of renal function at day 12” | |
| * direct quotation from the text of study reports appears in quotation marks MP ‐ methylprednisolone; ns ‐ not stated and could not be clarified or deduced | ||||
| Study ID | Days since transplant* | Timing of randomisation* | Criteria for rejection* | Initial treatment of rejection* | Criteria for resistant rejection* |
| Antibody versus other antibody | |||||
| ns | “Steroid resistant rejection crisis” | ns | 3 bolus injections of cortisone | “Not sufficiently treated” with steroids | |
| ns | ns | Confirmed by renal biopsy | MP 1g for 3 days | ns | |
| < 42 | ns | Rise in creatinine of > 0.3 mg/dL and biopsy | MP 500 mg for 2 days | “Non response” | |
| “early” | ns | “Typical clinical symptoms”, renogram, and biopsy | MP 500‐1000 mg for 3 days | Lack of improvement in clinical and sonographic appearances | |
| ns | At biopsy | Biopsy with “histological diagnosis” | MP 15 mg/kg, 2 bolus doses | “Absence of a clear response to the steroids” | |
| ns | At biopsy | Delayed graft function or rise in creatinine in presence of urine output < 1 L/d, low sodium excretion, weight gain > 1 kg/d or graft tenderness | MP 15 mg/kg, 2 doses alternate days | No decline in creatinine after 2 steroid boluses, followed by biopsy | |
| ns | Day 5 of treatment | Rise in creatinine > 20% in the absence of obvious cause and biopsy (Banff criteria) | MP 500 mg then 250 mg for 3 days | No decline in creatinine | |
| Different formulations of antibody | |||||
| ns | At biopsy | Biopsy, Banff graded | MP 500 mg, for 3 days | Creatinine increase of 10% after 3 days of MP | |
| Different doses of same antibody | |||||
| < 90 | Day 5 of treatment | Rise in creatinine > 20% in absence of obvious cause | MP boluses, cumulative dose 1‐1.5 g | No decline in creatinine after 5 days of treatment | |
| Different duration of same antibody | |||||
| ns | At biopsy | “Diagnosed clinically and verified with a core needle biopsy” | MP 250‐500 mg, for 4 days | Not responding with improved kidney function on 5th day of steroid treatment | |
| Antibody versus other treatment | |||||
| < 365 | Day 4 of treatment | Accelerated rejection: “progressive rise in SCr level was observed within 7 days of transplant”. Acute rejection: “rise in SCr of 0.5 mg/dl or higher” was seen anytime during post‐transplant course. Acute on chronic rejection: “a similar rise in SCr occurred in a patient with sustained creatinine level of ≥2.5mg/dl due to a documented previous acute rejection episode” | MP 500‐1000 mg, for 3 days | “Serum creatinine did not revert to the basal level within a week from the onset” | |
| ns | At biopsy | Clinical suspicion and biopsy | MP 500 mg for 3 days | “Failure to show improved renal function” within 7 days of starting MP | |
| * direct quotation from the text of study reports appears in quotation marks MP ‐ methylprednisolone; ns ‐ not stated and could not be clarified or deduced | |||||
| Outcomes | Comparisons Relative effect (95% CI) | ||
| rabbit‐ATG versus horse‐ATG (1 study, 159 participants) | ATG versus ALG (1 study, 50 participants) | ALG versus IVIg (1 study, 45 participants) | |
| Failure of reversal of acute rejection | RR 0.88 (0.41 to 1.87) | RR 0.95 (0.28 to 3.27) | RR 2.40 (0.27 to 21.35) |
| Recurrent rejection post‐therapy | RR 1.24 (0.77 to 1.99) | RR: 0.95 (0.48 to 1.87) | RR 0.62 (0.28 to 1.38) |
| Graft loss or death with a functioning graft (≤ 12 months) | RR 0.73 (0.37 to 1.44) | RR 1.09 (0.60 to 1.99) | RR 1.00 (0.49 to 2.05) |
| Graft loss censored for death (≤ 12 months) | Not reported | RR 0.89 (0.41 to 1.93) | RR 0.93 (0.37 to 2.34) |
| Death (≤ 12 months) | Not reported | RR 2.00 (0.40 to 9.95) | RR 1.20 (0.22 to 6.50) |
| Malignancy (total) | Not reported | Not reported | RR 2.42 (0.10 to 56.46) |
| Treatment side effects: fevers, chills, malaise following administration | RR 0.38 (0.27 to 0.54) | RR 0.75 (0.19 to 3.01) | Not reported |
| Treatment side effects: thrombocytopenia | Not reported | RR 1.00 (0.07 to 15.12) | Not reported |
| ALG ‐ antilymphocyte globulin; ATG ‐ antithymocyte globulin; CI ‐ confidence interval; IVIg ‐ intravenous immunoglobulin; RR ‐ risk ratio | |||
| Outcome | Comparisons Relative effect (95% CI) | ||||
| rabbit‐ATG versus horse‐ATG (1 study, 163 participants) | ATG 3 days versus ALG 10 days (1 study, 30 participants) | Muromonab‐CD3half dose versus standard dose (1 study, 45 participants) | Muromonab‐CD3versus IVIg (1 study, 30 participants) | Muromonab‐CD3versus DSP (1 study, 25 participants) | |
| Failure of reversal of acute rejection | RR 0.52 (0.26 to 1.05) | RR 0.88 (0.43 to 1.80) | RR 1.50 (0.29 to 7.73) | RR 0.50 (0.11 to 2.33) | RR 0.92 (0.35, 2.41) |
| Further treatment required | Not reported | RR 9.60 (0.56 to 163.58) | Not reported | Not reported | Not reported |
| Recurrent rejection post‐therapy | RR 0.32 (0.15 to 0.66) | Not reported | RR 0.50 (0.05 to 4.94) | RR 1.65 (0.80 to 3.41) | RR 1.48 (0.67 to 3.27) |
| Graft loss or death with a functioning graft (≤ 12 months) | RR 0.68 (0.37 to 1.26) | RR 0.86 (0.38 to 1.95) | RR 2.00 (0.43 to 9.32) | RR 1.00 (0.24 to 4.18) | Not reported |
| Graft loss censored for death (≤ 12 months) | RR 0.46 (0.21 to 1.00) | Not reported | RR 1.00 (0.16 to 6.20) | RR 2.00 (0.20 to 19.78) | Not reported |
| Death (≤ 12‐24 months) | RR 1.98 (0.51 to 7.63) | Not reported | RR 5.00 (0.26 to 96.13) | RR 0.50 (0.05 to 4.94) | Not reported |
| Treatment side effects: fevers, chills, malaise following administration | Not reported | Not reported | Not reported | RR 31.00 (2.02 to 475.12) | RR 5.54 (1.55 to 19.82) |
| Treatment side effects: leukopenia | RR 1.93 (1.32 to 2.84) | Not reported | Not reported | Not reported | RR 0.10 (0.02 to 0.69) |
| Treatment side effects: anorexia | Not reported | Not reported | Not reported | Not reported | RR 0.92 (0.15 to 5.56) |
| Treatment failure | RR 0.51 (0.25 to 1.04) | Not reported | Not reported | Not reported | Not reported |
| Infection (total) | RR 0.99 (0.73 to 1.34) | Not reported | Not reported | Not reported | Not reported |
| Infection (bacterial) | RR 0.79 (0.51 to 1.23) | Not reported | RR 3.00 (0.13 to 68.26) | Not reported | Not reported |
| Infection (viral) | RR 1.87 (0.88 to 3.94) | Not reported | Not reported | Not reported | Not reported |
| Infection (fungal) | RR 0.99 (0.36 to 2.69) | Not reported | Not reported | Not reported | Not reported |
| CMV infection (total) | RR 1.01 (0.86 to 1.18) | Not reported | RR 1.00 (0.51 to 1.95) | Not reported | Not reported |
| Malignancy (total) | RR 0.99 (0.21 to 4.75) | Not reported | Not reported | Not reported | Not reported |
| PTLD/Lymphoma | RR 1.48 (0.25 to 8.64) | Not reported | Not reported | Not reported | Not reported |
| SCr | Not reported | Not reported | MD ‐10.00 (‐60.15 to 40.15) (18 months after treatment) | MD 0.47 (‐0.07 to 1.01) (3 months after treatment) | MD 62.00 (‐107.08 to 231.08) (1 month after treatment) |
| ALG ‐ antilymphocyte globulin; ATG ‐ antithymocyte globulin; CI ‐ confidence interval; CMV ‐ cytomegalovirus; DSP ‐ 15‐deoxyspergualin; IVIg ‐ intravenous immunoglobulin; MD ‐ mean difference; PTLD ‐ post‐transplant lymphoproliferative disease; RR ‐ risk ratio; SCr ‐ serum creatinine | |||||
| Outcome or subgroup title | No. of studies | No. of participants | Statistical method | Effect size |
| 1 Failure of reversal of acute rejection Show forest plot | 6 | 405 | Risk Ratio (M‐H, Random, 95% CI) | 0.50 [0.30, 0.82] |
| 1.1 Muromonab‐CD3 versus steroid | 1 | 122 | Risk Ratio (M‐H, Random, 95% CI) | 0.29 [0.14, 0.63] |
| 1.2 ATG versus steroid | 3 | 198 | Risk Ratio (M‐H, Random, 95% CI) | 0.40 [0.22, 0.74] |
| 1.3 ALG versus steroid | 2 | 85 | Risk Ratio (M‐H, Random, 95% CI) | 0.96 [0.52, 1.75] |
| 2 Additional treatment needed Show forest plot | 4 | 178 | Risk Ratio (M‐H, Random, 95% CI) | 0.74 [0.48, 1.15] |
| 2.1 ATG versus steroid | 2 | 120 | Risk Ratio (M‐H, Random, 95% CI) | 0.80 [0.49, 1.30] |
| 2.2 ALG versus steroid | 2 | 58 | Risk Ratio (M‐H, Random, 95% CI) | 0.50 [0.17, 1.49] |
| 3 Recurrent rejection up to 12 months post‐therapy Show forest plot | 9 | 508 | Risk Ratio (M‐H, Random, 95% CI) | 0.75 [0.56, 1.00] |
| 3.1 Muromonab‐CD3 versus steroid | 1 | 103 | Risk Ratio (M‐H, Random, 95% CI) | 0.89 [0.69, 1.15] |
| 3.2 ATG versus steroid | 5 | 285 | Risk Ratio (M‐H, Random, 95% CI) | 0.55 [0.29, 1.05] |
| 3.3 ALG versus steroid | 3 | 120 | Risk Ratio (M‐H, Random, 95% CI) | 0.87 [0.60, 1.28] |
| 4 Graft loss or death with a functioning graft within 12 months Show forest plot | 8 | 490 | Risk Ratio (M‐H, Random, 95% CI) | 0.84 [0.58, 1.22] |
| 4.1 Muromonab‐CD3 versus steroid | 1 | 120 | Risk Ratio (M‐H, Random, 95% CI) | 1.36 [1.02, 1.81] |
| 4.2 ATG versus steroid | 5 | 285 | Risk Ratio (M‐H, Random, 95% CI) | 0.65 [0.48, 0.89] |
| 4.3 ALG versus steroid | 2 | 85 | Risk Ratio (M‐H, Random, 95% CI) | 0.90 [0.53, 1.50] |
| 5 Graft loss censored for death within 18 months Show forest plot | 8 | 475 | Risk Ratio (M‐H, Random, 95% CI) | 0.80 [0.57, 1.12] |
| 5.1 Muromonab‐CD3 versus steroid | 1 | 120 | Risk Ratio (M‐H, Random, 95% CI) | 1.35 [0.94, 1.94] |
| 5.2 ATG versus steroid | 4 | 235 | Risk Ratio (M‐H, Random, 95% CI) | 0.63 [0.44, 0.89] |
| 5.3 ALG versus steroid | 3 | 120 | Risk Ratio (M‐H, Random, 95% CI) | 0.75 [0.42, 1.33] |
| 6 Death within 12 months Show forest plot | 7 | 413 | Risk Ratio (M‐H, Random, 95% CI) | 0.98 [0.51, 1.88] |
| 6.1 Muromonab‐CD3 versus steroid | 1 | 120 | Risk Ratio (M‐H, Random, 95% CI) | 1.40 [0.53, 3.70] |
| 6.2 ATG versus steroid | 3 | 173 | Risk Ratio (M‐H, Random, 95% CI) | 0.49 [0.14, 1.74] |
| 6.3 ALG versus steroid | 3 | 120 | Risk Ratio (M‐H, Random, 95% CI) | 1.05 [0.31, 3.60] |
| 7 Treatment adverse events Show forest plot | 5 | Risk Ratio (M‐H, Random, 95% CI) | Subtotals only | |
| 7.1 Fever, chill, malaise after drug administration | 4 | 280 | Risk Ratio (M‐H, Random, 95% CI) | 23.88 [5.10, 111.86] |
| 7.2 Infection (total) | 5 | 241 | Risk Ratio (M‐H, Random, 95% CI) | 0.83 [0.57, 1.20] |
| 7.3 CMV infection | 4 | 118 | Risk Ratio (M‐H, Random, 95% CI) | 0.92 [0.37, 2.26] |
| 7.4 Avascular necrosis | 3 | 143 | Risk Ratio (M‐H, Random, 95% CI) | 0.51 [0.11, 2.35] |
| 8 Serum creatinine post treatment (3 months) Show forest plot | 1 | 95 | Mean Difference (IV, Random, 95% CI) | ‐14.0 [‐37.53, 9.53] |
| Outcome or subgroup title | No. of studies | No. of participants | Statistical method | Effect size |
| 1 Failure of reversal of acute rejection (AR) episode Show forest plot | 1 | Risk Ratio (M‐H, Random, 95% CI) | Totals not selected | |
| 1.1 ALG + steroids versus steroids alone | 1 | Risk Ratio (M‐H, Random, 95% CI) | 0.0 [0.0, 0.0] | |
| 2 Recurrent rejection within 3 months post‐therapy Show forest plot | 1 | Risk Ratio (M‐H, Random, 95% CI) | Totals not selected | |
| 2.1 ALG + steroids versus steroids alone | 1 | Risk Ratio (M‐H, Random, 95% CI) | 0.0 [0.0, 0.0] | |
| 3 Graft loss or death with a functioning graft within 12 months Show forest plot | 2 | 52 | Risk Ratio (M‐H, Random, 95% CI) | 0.35 [0.02, 5.14] |
| 3.1 ALG + steroids versus steroids alone | 1 | 32 | Risk Ratio (M‐H, Random, 95% CI) | 1.0 [0.24, 4.23] |
| 3.2 ATG + steroids versus steroids alone | 1 | 20 | Risk Ratio (M‐H, Random, 95% CI) | 0.08 [0.00, 1.21] |
| 4 Graft loss censored for death within 12 months Show forest plot | 2 | 50 | Risk Ratio (M‐H, Random, 95% CI) | 0.33 [0.03, 4.16] |
| 4.1 ALG + steroids versus steroids alone | 1 | 30 | Risk Ratio (M‐H, Random, 95% CI) | 0.86 [0.23, 3.19] |
| 4.2 ATG + steroids versus steroids alone | 1 | 20 | Risk Ratio (M‐H, Random, 95% CI) | 0.08 [0.00, 1.21] |
| 5 Death within 12 months Show forest plot | 2 | 50 | Risk Ratio (M‐H, Random, 95% CI) | 0.86 [0.53, 1.39] |
| 5.1 ALG + steroids versus steroids alone | 1 | 30 | Risk Ratio (M‐H, Random, 95% CI) | 0.86 [0.53, 1.39] |
| 5.2 ATG + steroids versus steroids alone | 1 | 20 | Risk Ratio (M‐H, Random, 95% CI) | 0.0 [0.0, 0.0] |
| Outcome or subgroup title | No. of studies | No. of participants | Statistical method | Effect size |
| 1 Failure of acute rejection reversal Show forest plot | 2 | 132 | Risk Ratio (M‐H, Random, 95% CI) | 1.84 [0.92, 3.67] |
| 1.1 Muromonab‐CD3 versus ATG | 1 | 56 | Risk Ratio (M‐H, Random, 95% CI) | 2.0 [0.95, 4.20] |
| 1.2 Muromonab‐CD3 versus T10B9.1A‐31 | 1 | 76 | Risk Ratio (M‐H, Random, 95% CI) | 1.05 [0.16, 7.10] |
| 2 Additional treatment needed Show forest plot | 2 | 132 | Risk Ratio (M‐H, Random, 95% CI) | 1.67 [0.77, 3.63] |
| 2.1 Muromonab‐CD3 versus ATG | 1 | 56 | Risk Ratio (M‐H, Random, 95% CI) | 1.83 [0.79, 4.27] |
| 2.2 Muromonab‐CD3 versus T10B9.1A‐31 | 1 | 76 | Risk Ratio (M‐H, Random, 95% CI) | 1.05 [0.16, 7.10] |
| 3 Recurrent rejection up to 12 months post‐therapy Show forest plot | 2 | 129 | Risk Ratio (M‐H, Random, 95% CI) | 1.06 [0.59, 1.88] |
| 3.1 Muromonab‐CD3 versus ATG | 1 | 53 | Risk Ratio (M‐H, Random, 95% CI) | 1.24 [0.61, 2.56] |
| 3.2 Muromonab‐CD3 versus T10B9.1A‐31 | 1 | 76 | Risk Ratio (M‐H, Random, 95% CI) | 0.79 [0.30, 2.06] |
| 4 Treatment adverse events Show forest plot | 2 | Risk Ratio (M‐H, Random, 95% CI) | Subtotals only | |
| 4.1 Fever, chills, malaise after drug administration | 2 | 132 | Risk Ratio (M‐H, Random, 95% CI) | 3.12 [1.87, 5.21] |
| 4.2 Gastrointestinal side effects | 2 | 132 | Risk Ratio (M‐H, Random, 95% CI) | 8.23 [0.90, 75.11] |
| 4.3 Neurological side effects | 2 | 132 | Risk Ratio (M‐H, Random, 95% CI) | 13.10 [1.43, 120.05] |
| 4.4 Infection (total) | 2 | 86 | Risk Ratio (M‐H, Random, 95% CI) | 1.53 [0.69, 3.40] |
| 4.5 CMV infection (total) | 2 | 132 | Risk Ratio (M‐H, Random, 95% CI) | 2.25 [0.31, 16.08] |
| 4.6 Malignancy (total) | 2 | 132 | Risk Ratio (M‐H, Random, 95% CI) | 0.26 [0.03, 2.30] |
| Outcome or subgroup title | No. of studies | No. of participants | Statistical method | Effect size |
| 1 Failure of reversal of acute rejection Show forest plot | 2 | 53 | Risk Ratio (M‐H, Random, 95% CI) | 0.94 [0.54, 1.64] |
| 2 Additional treatment required Show forest plot | 1 | 20 | Risk Ratio (M‐H, Random, 95% CI) | 1.33 [0.40, 4.49] |
| 3 Graft loss or death with a functioning graft within 12 months Show forest plot | 2 | 58 | Risk Ratio (M‐H, Random, 95% CI) | 1.0 [0.23, 4.35] |
| 4 Death within 12 months Show forest plot | 2 | 58 | Risk Ratio (M‐H, Random, 95% CI) | 0.0 [0.0, 0.0] |
| 5 Treatment adverse events Show forest plot | 2 | Risk Ratio (M‐H, Random, 95% CI) | Subtotals only | |
| 5.1 Fever, chills, malaise after administration | 1 | 15 | Risk Ratio (M‐H, Random, 95% CI) | 4.91 [0.31, 76.58] |
| 5.2 CMV infection | 2 | 58 | Risk Ratio (M‐H, Random, 95% CI) | 0.93 [0.11, 8.04] |
| 5.3 UTI/pyelonephritis | 1 | 38 | Risk Ratio (M‐H, Random, 95% CI) | 5.73 [1.80, 18.21] |
| 5.4 Sepsis | 1 | 38 | Risk Ratio (M‐H, Random, 95% CI) | 11.67 [0.60, 225.17] |
| 5.5 BK virus infection | 1 | 38 | Risk Ratio (M‐H, Random, 95% CI) | 0.47 [0.02, 9.01] |
| 5.6 HSV infection | 1 | 38 | Risk Ratio (M‐H, Random, 95% CI) | 7.00 [0.31, 159.85] |
| 5.7 Nocardia infection | 1 | 38 | Risk Ratio (M‐H, Random, 95% CI) | 0.78 [0.03, 17.76] |
| 5.8 Gastrointestinal disorders | 1 | 38 | Risk Ratio (M‐H, Random, 95% CI) | 0.49 [0.06, 3.74] |
| 5.9 Blood and lymphatic system disorders | 1 | 38 | Risk Ratio (M‐H, Random, 95% CI) | 0.82 [0.10, 7.04] |
| 5.10 Neoplasm | 1 | 38 | Risk Ratio (M‐H, Random, 95% CI) | 0.78 [0.03, 17.76] |
| 5.11 Other/unspecified | 1 | 38 | Risk Ratio (M‐H, Random, 95% CI) | 0.21 [0.01, 3.54] |
| Outcome or subgroup title | No. of studies | No. of participants | Statistical method | Effect size |
| 1 Failure of acute rejection reversal Show forest plot | 5 | 244 | Risk Ratio (M‐H, Random, 95% CI) | 1.07 [0.63, 1.81] |
| 1.1 Muromonab‐CD3 versus ATG | 3 | 173 | Risk Ratio (M‐H, Random, 95% CI) | 1.00 [0.17, 5.76] |
| 1.2 Muromonab‐CD3 versus ALG | 2 | 71 | Risk Ratio (M‐H, Random, 95% CI) | 1.12 [0.78, 1.60] |
| 2 Additional treatment required Show forest plot | 1 | Risk Ratio (M‐H, Random, 95% CI) | Subtotals only | |
| 2.1 Muromonab‐CD3 versus ATG | 1 | 55 | Risk Ratio (M‐H, Random, 95% CI) | 1.16 [0.40, 3.35] |
| 3 Recurrent rejection Show forest plot | 5 | 284 | Risk Ratio (M‐H, Random, 95% CI) | 0.78 [0.47, 1.28] |
| 3.1 Muromonab‐CD3 versus ATG | 3 | 174 | Risk Ratio (M‐H, Random, 95% CI) | 1.08 [0.71, 1.64] |
| 3.2 Muromonab‐CD3 versus ALG | 2 | 110 | Risk Ratio (M‐H, Random, 95% CI) | 0.47 [0.21, 1.06] |
| 4 Graft loss censored for death (< 1 year) Show forest plot | 5 | 244 | Risk Ratio (M‐H, Random, 95% CI) | 0.86 [0.34, 2.17] |
| 4.1 Muromonab‐CD3 versus ATG | 3 | 173 | Risk Ratio (M‐H, Random, 95% CI) | 1.54 [0.28, 8.57] |
| 4.2 Muromonab‐CD3 versus ALG | 2 | 71 | Risk Ratio (M‐H, Random, 95% CI) | 0.59 [0.24, 1.49] |
| 5 Graft loss or death with a functioning graft (< 1 year) Show forest plot | 5 | 211 | Risk Ratio (M‐H, Random, 95% CI) | 0.81 [0.43, 1.51] |
| 5.1 Muromonab‐CD3 versus ATG | 4 | 190 | Risk Ratio (M‐H, Random, 95% CI) | 0.87 [0.49, 1.55] |
| 5.2 Muromonab‐CD3 versus ALG | 1 | 21 | Risk Ratio (M‐H, Random, 95% CI) | 0.13 [0.01, 2.26] |
| 6 Death within 12 months Show forest plot | 3 | 175 | Risk Ratio (M‐H, Random, 95% CI) | 0.39 [0.09, 1.65] |
| 6.1 Muromonab‐CD3 versus ATG | 2 | 115 | Risk Ratio (M‐H, Random, 95% CI) | 0.41 [0.08, 2.05] |
| 6.2 Muromonab‐CD3 versus ALG | 1 | 60 | Risk Ratio (M‐H, Random, 95% CI) | 0.33 [0.01, 7.87] |
| 7 Treatment adverse events Show forest plot | 5 | Risk Ratio (M‐H, Random, 95% CI) | Subtotals only | |
| 7.1 Fever, chills, malaise after administration | 3 | 140 | Risk Ratio (M‐H, Random, 95% CI) | 2.54 [0.18, 34.92] |
| 7.2 Infection (bacterial) | 2 | 109 | Risk Ratio (M‐H, Random, 95% CI) | 8.64 [1.64, 45.56] |
| 7.3 Infection (viral) | 1 | 59 | Risk Ratio (M‐H, Random, 95% CI) | 0.53 [0.29, 0.97] |
| 7.4 Infection (fungal) | 1 | 50 | Risk Ratio (M‐H, Random, 95% CI) | 7.56 [0.41, 139.17] |
| 7.5 CMV infection | 5 | 284 | Risk Ratio (M‐H, Random, 95% CI) | 0.93 [0.60, 1.43] |
| 7.6 Malignancy (total) | 2 | 115 | Risk Ratio (M‐H, Random, 95% CI) | 2.09 [0.28, 15.66] |
| 8 Serum creatinine post treatment (3 days) Show forest plot | 1 | 38 | Mean Difference (IV, Random, 95% CI) | 1.50 [‐0.25, 3.25] |
| 9 Serum creatinine at 12 months Show forest plot | 4 | Mean Difference (IV, Random, 95% CI) | Subtotals only | |
| 9.1 Muromonab‐CD3 versus ATG | 4 | 179 | Mean Difference (IV, Random, 95% CI) | 5.93 [‐18.46, 30.32] |