Antibodi polyklonal dan monoklonal untuk merawat episod penolakan akut dalam penerima pemindahan buah pinggang
Abstract
Background
Registry data shows that the incidence of acute rejection has been steadily falling. Approximately 10% to 35% of kidney recipients will undergo treatment for at least one episode of acute rejection within the first post‐transplant year. Treatment options include pulsed steroid therapy, the use of an antibody preparation, the alteration of background immunosuppression, or combinations of these options. Over recent years, new treatment strategies have evolved, and in many parts of the world there has been an increase in use of tacrolimus and mycophenolate and a reduction in the use of cyclosporin and azathioprine use as baseline immunosuppression to prevent acute rejection. There are also global variations in use of polyclonal and monoclonal antibodies to treat acute rejection. This is an update of a review published in 2006.
Objectives
The aim of this systematic review was to: (1) to evaluate the relative and absolute effects of different classes of antibody preparation in preventing graft loss and resolving cellular or humoral rejection episodes when used as a treatment for first episode of rejection in kidney transplant recipients; (2) evaluate the relative and absolute effects of different classes of antibody preparation in preventing graft loss and resolving cellular or humoral rejection episodes when used as a treatment for steroid‐resistant rejection in kidney transplant recipients; (3) determine how the benefits and adverse events vary for each type of antibody preparation; and (4) determine how the benefits and harms vary for different formulations of antibody within each type.
Search methods
We searched the Cochrane Kidney and Transplant Specialised Register to 18 April 2017 through contact with the Information Specialist using search terms relevant to this review.
Selection criteria
Randomised controlled trials (RCTs) in all languages comparing all mono‐ and polyclonal antibody preparations, given in combination with any other immunosuppressive agents, for the treatment of cellular or humoral graft rejection, when compared to any other treatment for acute rejection were eligible for inclusion.
Data collection and analysis
Two authors independently assessed the risk of bias of the included studies and extracted data. Statistical analyses were performed using a random‐effects model and results expressed as risk ratio (RR) or mean difference (MD) with 95% confidence intervals (CI).
Main results
We included 11 new studies (18 reports, 346 participants) in this update, bring the total number of included studies to 31 (76 reports, 1680 participants). Studies were generally small, incompletely reported, especially for potential harms, and did not define outcome measures adequately. The risk of bias was inadequate or unclear risk for random sequence generation (81%), allocation concealment (87%) and other bias (87%). There were, however, a predominance of low risk of bias for blinding (75%) and incomplete outcome data (80%) across all the studies. Selective reporting had a mixture of low (58%), high (29%), and unclear (13%) risk of bias.
Seventeen studies (1005 participants) compared therapies for first acute cellular rejection episodes. Antibody therapy was probably better than steroid in reversing acute cellular rejection (RR 0.50, 95% CI 0.30 to 0.82; moderate certainty) and preventing subsequent rejection (RR 0.70, 95% CI 0.50 to 0.99; moderate certainty), may be better for preventing graft loss (death censored: (RR 0.80, 95% CI 0.57 to 1.12; low certainty) but there was little or no difference in death at one year. Adverse effects of treatment (including fever, chills and malaise following drug administration) were probably reduced with steroid therapy (RR 23.88, 95% CI 5.10 to 111.86; I2 = 16%; moderate certainty).
Twelve studies (576 patients) investigated antibody treatment for steroid‐resistant rejection. There was little or no benefit of muromonab‐CD3 over ATG or ALG in reversing rejection, preventing subsequent rejection, or preventing graft loss or death. Two studies compared the use of rituximab for treatment of acute humoral rejection (58 patients). Muromonab‐CD3 treated patients suffered three times more than those receiving either ATG or T10B9, from a syndrome of fever, chills and malaise following drug administration (RR 3.12, 95% CI 1.87 to 5.21; I2 = 31%), and experienced more neurological side effects (RR 13.10 95% CI 1.43 to 120.05; I2 = 36%) (low certainty evidence).
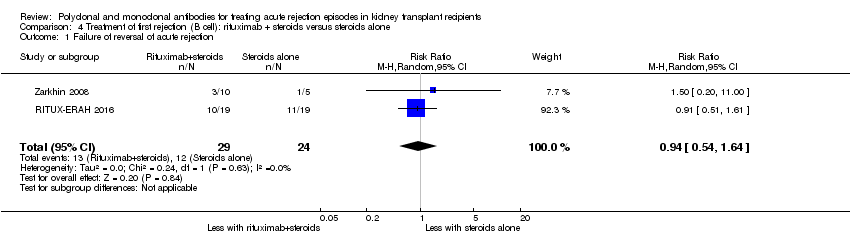
There was no evidence of additional benefit from rituximab in terms of either reversal of rejection (RR 0.94, 95% CI 0.54 to 1.64), or graft loss or death 12 months (RR 1.0, 95% CI 0.23 to 4.35). Rituximab plus steroids probably increases the risk of urinary tract infection/pyelonephritis (RR 5.73, 95% CI 1.80 to 18.21).
Authors' conclusions
In reversing first acute cellular rejection and preventing graft loss, any antibody is probably better than steroid, but there is little or no difference in subsequent rejection and patient survival. In reversing steroid‐resistant rejection there was little or no difference between different antibodies over a period of 12 months, with limited data beyond that time frame. In treating acute humoral rejection, there was no evidence that the use of antibody therapy conferred additional benefit in terms of reversal of rejection, or death or graft loss.
Although this is an updated review, the majority of newer included studies provide additional evidence from the cyclosporin/azathioprine era of kidney transplantation and therefore conclusions cannot necessarily be extrapolated to patients treated with more contemporary immunosuppressive regimens which include tacrolimus/mycophenolate or sirolimus. However, many kidney transplant centres around the world continue to use older immunosuppressive regimes and the findings of this review remain strongly relevant to their clinical practice.
Larger studies with standardised reproducible outcome criteria are needed to investigate the outcomes and risks of antibody treatments for acute rejection in kidney transplant recipients receiving contemporary immunosuppressive regimes.
PICO
Ringkasan bahasa mudah
Antibodi polyklonal dan monoklonal untuk merawat penolakan akut episod dalam penerima pemindahan buah pinggang
Apakah isunya?
Pemindahan buah pinggang adalah rawatan pilihan bagi kebanyakan pesakit dengan penyakit buah pinggang peringkat akhir. Strategi untuk meningkatkan penderma organ ketersediaan dan untuk memanjangkan kehidupan buah pinggang telah menjadi keutamaan dalam pemindahan buah pinggang. Kira‐kira 10% hingga 35% daripada semua penerima pemindahan buah pinggang akan mengalami satu episod penolakan yang akut pada tahun pertama. Pilihan untuk merawat episod ini termasuk terapi steroid berdenyut, penggunaan persediaan antibodi, perubahan latar belakang imunosupresi, atau kombinasi daripada pilihan yang berikut.
Apa yang kami lakukan?
Ulasan ini menyiasat peranan antibodi tunggal‐ atau polyklonal dalam rawatan akut selular atau penolakan humoral akut dalam buah pinggang. Tiga puluh satu ujikaji (1680 pesakit) turut disertakan.
Apa yang kami dapati?
Kami mengenal pasti 31 kajian yang mendaftar 1680 orang. Sebarang antibodi adalah lebih baik daripada rawatan steroid untuk menterbalikkan episod akut penolakan selular pertama dan menghalang kehilangan cantuman, tetapi menunjukkan sedikit atau perbezaan dalam menterbalikkan episod penolakan tahan steroid. Pesakit dirawat antibodi polyklonal adalah lebih cenderung untuk mengalami reaksi serta‐merta dengan demam, sejuk dan kelesuan daripada orang yang menerima rawatan steroid.
Kesimpulan
Rawatan antibodi adalah lebih baik daripada rawatan steroid untuk menterbalikkan penolakan selular akut pertama dan mencegah kehilangn cantuman tetapi rawatan ini adalah berkaitan dengan satu kejadian kesan buruk yang tinggi. Had utama ulasan ini adalah bahawa banyak kajian yang dimasukkan adalah dilakukan semasa era cyclosporin/azathioprine pemindahan buah pinggang dan oleh itu kesimpulan tidak semestinya menjadi extrapolasi kepada pesakit yang dirawat dengan lebih kontemporari sembuh imunosuppresif antaranya tacrolimus/mycophenolate atau sirolimus.
Authors' conclusions
Summary of findings
| Antibody (T cell) versus steroid (stratified by antibody type) for the treatment of first rejection episodes in kidney transplant recipients | |||||
| Patient or population: kidney transplant recipients: first rejection episode | |||||
| Outcomes | Anticipated absolute effects* (95% CI) | Relative effect | No. of participants | Quality of the evidence | |
| Risk with steroid (stratified by antibody type) | Risk with antibody (T cell) | ||||
| Failure of reversal of acute rejection | Study population | RR 0.50 | 405 (6) | ⊕⊕⊕⊝ | |
| 342 per 1,000 | 171 per 1,000 | ||||
| Recurrent rejection | Study population | RR 0.75 | 508 (9) | ⊕⊕⊕⊝ | |
| 566 per 1,000 | 425 per 1,000 | ||||
| Graft loss or death with a functioning graft | Study population | RR 0.84 | 490 (8) | ⊕⊕⊝⊝ | |
| 459 per 1,000 | 385 per 1,000 | ||||
| Graft loss censored for death | Study population | RR 0.80 | 475 (8) | ⊕⊕⊝⊝ | |
| 409 per 1,000 | 327 per 1,000 | ||||
| Death | Study population | RR 0.98 | 413 (7) | ⊕⊝⊝⊝ | |
| 83 per 1,000 | 81 per 1,000 | ||||
| Treatment adverse events: fever, chill, or malaise after drug administration | Study population | RR 23.88 | 280 (4) | ⊕⊝⊝⊝ | |
| 0 per 1,000 | 0 per 1,000 | ||||
| *The risk in the intervention group (and its 95% CI) is based on the assumed risk in the comparison group and the relative effect of the intervention (and its 95% CI). | |||||
| GRADE Working Group grades of evidence | |||||
| 1 Unclear/high risk in multiple studies for allocation concealment and selective reporting 2 CI includes null effect and potential for some harm and benefit 3 CI includes null effect and appreciable harm and benefit 4 High I2 (81%) and great variation in size of effect across all different treatment adverse effects | |||||
| Antibody (T cell) + steroid versus steroid alone for the treatment of first rejection episodes in kidney transplant recipients | |||||
| Patient or population: treatment of first rejection episodes in kidney transplant recipients: first rejection episode | |||||
| Outcomes | Anticipated absolute effects* (95% CI) | Relative effect | No. of participants | Quality of the evidence | |
| Risk with steroid alone | Risk with antibody (T cell) + steroid | ||||
| Failure of reversal of acute rejection episode | Study population | RR 0.42 | 30 (1) | ⊕⊕⊝⊝ | |
| 688 per 1,000 | 289 per 1,000 | ||||
| Recurrent rejection | Study population | RR 0.07 | 30 (1) | ⊕⊕⊝⊝ | |
| 500 per 1,000 | 35 per 1,000 | ||||
| Graft loss or death with a functioning graft | Study population | RR 0.35 | 52 (2) | ⊕⊝⊝⊝ | |
| 346 per 1,000 | 121 per 1,000 | ||||
| Graft loss censored for death | Study population | RR 0.33 | 50 (2) | ⊕⊝⊝⊝ | |
| 385 per 1,000 | 127 per 1,000 | ||||
| Death | Study population | RR 0.86 | 50 (2) | ⊕⊕⊝⊝ | |
| 462 per 1,000 | 397 per 1,000 | ||||
| *The risk in the intervention group (and its 95% CI) is based on the assumed risk in the comparison group and the relative effect of the intervention (and its 95% CI). | |||||
| GRADE Working Group grades of evidence | |||||
| 1 Small sample size and few number of events 2 Width of CI is very wide. CI includes null effect and is strongly one‐sided. 3 Unclear risk for random sequence generation and allocation concealment, and high risk for selective reporting 4 Big variation in size of effect with small overlap of CI and high I2 value 5 Width of CI is very wide. CI includes both null effect and appreciable benefit and harm 6 CI includes both null effect and appreciable benefit and harm | |||||
| Muromonab‐CD3 (T cell) versus other antibody (stratified by comparator) for the treatment of first rejection episodes in kidney transplant recipients | |||||
| Patient or population: kidney transplant recipients: first rejection episode | |||||
| Outcomes | Anticipated absolute effects* (95% CI) | Relative effect | No. of participants | Quality of the evidence | |
| Risk with other antibody (stratified by comparator) | Risk with muromonab‐CD3 (T cell) | ||||
| Failure of acute rejection reversal | Study population | RR 1.84 | 132 (2) | ⊕⊕⊕⊝ | |
| 134 per 1,000 | 247 per 1,000 | ||||
| Recurrent rejection | Study population | RR 1.06 | 129 (2) | ⊕⊕⊕⊝ | |
| 254 per 1,000 | 269 per 1,000 | ||||
| Treatment adverse events: fever, chills, malaise after drug administration | Study population | RR 3.12 | 132 (2) | ⊕⊕⊝⊝ | |
| 269 per 1,000 | 838 per 1,000 | ||||
| Treatment adverse events: neurological side effects | Study population | RR 13.10 (1.43 to 120.05) | 132 (2) | ⊕⊕⊝⊝ | |
| 15 per 1,000 | 196 per 1,000 (21 to 1,000) | ||||
| *The risk in the intervention group (and its 95% CI) is based on the assumed risk in the comparison group and the relative effect of the intervention (and its 95% CI). | |||||
| GRADE Working Group grades of evidence | |||||
| 1 Small sample size and few number of events 2 CI includes null effect and potential for some harm and benefit 3 High I2 value and wide variation in size of effect | |||||
| Rituximab (B cell) + steroid versus steroid alone for the treatment of first rejection episodes in kidney transplant recipients | |||||
| Patient or population: kidney transplant recipients: first rejection episode | |||||
| Outcomes | Anticipated absolute effects* (95% CI) | Relative effect | No. of participants | Quality of the evidence | |
| Risk with steroid alone | Risk with rituximab (B cell) + steroid | ||||
| Failure of reversal of acute rejection | Study population | RR 0.94 | 53 (2) | ⊕⊕⊕⊝ | |
| 500 per 1,000 | 470 per 1,000 | ||||
| Graft loss or death with a functioning graft | Study population | RR 1.00 | 58 (2) | ⊕⊕⊕⊝ | |
| 103 per 1,000 | 103 per 1,000 | ||||
| Death | Study population | not estimable | 58 (2) | ⊕⊕⊕⊕ | |
| 0 per 1,000 | 0 per 1,000 | ||||
| Treatment adverse events: UTI/pyelonephritis | Study population | RR 5.73 | 38 (1) | ⊕⊕⊕⊝ | |
| 111 per 1,000 | 637 per 1,000 | ||||
| *The risk in the intervention group (and its 95% CI) is based on the assumed risk in the comparison group and the relative effect of the intervention (and its 95% CI). | |||||
| GRADE Working Group grades of evidence | |||||
| 1 Small sample size and few number of events 2 CI includes both null effect and appreciable benefit and harm | |||||
| Antibody versus other antibody (stratified by antibody type) for the treatment of steroid‐resistant rejection episodes in kidney transplant recipients | |||||
| Patient or population: kidney transplant recipients: steroid‐resistant rejection episodes | |||||
| Outcomes | Anticipated absolute effects* (95% CI) | Relative effect | No. of participants | Quality of the evidence | |
| Risk with other antibody (stratified by antibody type) | Risk with antibody | ||||
| Failure of acute rejection reversal | Study population | RR 1.07 | 244 (5) | ⊕⊕⊝⊝ | |
| 206 per 1,000 | 221 per 1,000 | ||||
| Recurrent rejection | Study population | RR 0.78 | 284 (5) | ⊕⊕⊝⊝ | |
| 356 per 1,000 | 278 per 1,000 | ||||
| Graft loss censored for death | Study population | RR 0.86 | 244 (5) | ⊕⊕⊝⊝ | |
| 183 per 1,000 | 157 per 1,000 | ||||
| Graft loss or death with a functioning graft | Study population | RR 0.81 | 211 (5) | ⊕⊕⊝⊝ | |
| 229 per 1,000 | 186 per 1,000 | ||||
| Death | Study population | RR 0.39 | 175 (3) | ⊕⊕⊝⊝ | |
| 68 per 1,000 | 27 per 1,000 | ||||
| Treatment adverse events: fever, chills, malaise after drug administration | Study population | ⊕⊕⊝⊝ | |||
| 342 per 1,000 | 870 per 1,000 (62 to 1,000) | RR 2.54 (0.18 to 34.92) | 140 (3) | ||
| Treatment adverse events: bacterial infection | Study population | RR 8.64 | 109 (2) | ⊕⊝⊝⊝ | |
| 17 per 1,000 | 149 per 1,000 | ||||
| *The risk in the intervention group (and its 95% CI) is based on the assumed risk in the comparison group and the relative effect of the intervention (and its 95% CI). | |||||
| GRADE Working Group grades of evidence | |||||
| 1 CI includes both null effect and appreciable benefit and harm 2 Unclear risk for random sequence generation and allocation across all studies 3 Small sample size and few number of events 4 High I2 value and wide variation in size of effect | |||||
Background
Description of the condition
Improvements in induction and maintenance immunosuppressive algorithms now mean that most recipients of kidney transplants can expect a greater than 90% chance of a functioning graft at one year. The impact of acute rejection on both graft survival in the short and longer term and on patient morbidity in the short and longer term is widely recognised (Jalalzadeh 2015; Joseph 2001; Koo 2015; Opelz 1997). The timing, severity, number of episodes of rejection, effectiveness of treatment and degree of recovery of kidney function are all important factors in determining outcome (Madden 2000; Opelz 2008).
The incidence of acute rejection in the first year post‐transplant has been steadily falling over the last 20 years. In 1990’s acute rejection episodes were reported in almost 50% of kidney transplant recipients (USRDS 2014) More recently, Registry data (Matas 2014; USRDS 2014) and randomised controlled trials (RCTs) of immunosuppressive interventions (Masson 2014) report the incidence of acute rejection during the first post‐transplant year to have stabilized at around 10%.
Clinically, acute rejection is defined as an acute deterioration in graft function associated with specific pathologic changes seen on transplant biopsy. The Banff classification (Solez 1993;Solez 2008) identifies acute cellular (T‐cell mediated) rejection which is classified according to presence and severity of interstitial inflammation, tubulitis and arteritis. Acute cellular rejection is caused by the cell mediated immune response ‐ which occurs when recipient T cells recognize donor antigens, T cells become activated and undergo clonal expansion, lymphocytes and other inflammatory cells then infiltrate the transplant and cause tissue damage (Ingulli 2010; Issa 2010; Nankivell 2010).
Acute humoral rejection is caused by humoral or antibody‐mediated responses and is an increasingly recognised cause of acute transplant dysfunction resistant to treatment with steroids and T cell specific immunosuppressive agents. Acute humoral rejection is caused by donor specific antibodies to Class I and Class II HLA antigens although other non‐HLA antigens have also been recognized (Dheda 2013).
The Banff criteria for classifying acute humoral rejection require the presence of (Colvin 2005; Haas 2016; Solez 1993;Solez 2008) (1) histological evidence of acute tissue injury e.g. acute tubular necrosis, capillaritis, tubulitis, arteritis, (2) presence of circulating donor‐specific antibodies (DSA), and (3) immunologic evidence of an antibody‐mediated process with positive peritubular capillary C4d staining reflecting complement activation via the classical pathway.
The increase in diagnosis of acute humoral rejection maybe due to improved detection techniques e.g. development of C4d staining, improved recognition of DSA and increase in highly sensitized recipients accepted for transplantation (Colvin 2005).
Acute cellular and humoral rejection may co‐exist. It may be difficult to distinguish between acute humoral rejection and severe acute cellular rejection, and it is not uncommon for treatment for the two conditions to be given concurrently or sequentially.
Histological evidence of acute rejection in the absence of deterioration in kidney function is defined in the Banff classification as subclinical rejection. It is unclear whether treatment of subclinical rejection improves long term transplant outcomes (Nankivell 2010).
The histological findings on transplant biopsy have important implications for prognosis and influence the treatment given to treat acute rejection.
Description of the intervention
There have been significant changes in the type of immunosuppressive agents and strategies used over the last 20 years. In 1996, almost 80% patients received cyclosporin (CsA) as first‐line calcineurin inhibitor (CNI), whereas in 2012, 92% patients received tacrolimus (TAC) as baseline immunosuppression. Similarly, mycophenolate preparations have replaced azathioprine (AZA) as the anti‐metabolite of choice. Registry data shows differing global trends in the use of induction antibodies. In the USA, Interleukin 2 antibody ((IL2a) use has fallen from a peak of 40% in 2002 to 20% in 2011, whilst the use of T‐cell depleting antibodies continues to increase (USRDS 2014). Whereas, in Australia, use of IL2 antibodies for induction has remained fairly stable at 81% to 93% and ATG 3% to 4% (ANZDATA 2012).
The treatment of acute cellular rejection requires a short course of more intensive immunosuppression, added to baseline immunosuppression therapy. Options include pulsed steroid therapy, the use of an antibody preparation, alteration of background immunosuppression, or combinations of these options, (Chon 2014; Denton 1999). Treatment of acute humoral rejection generally includes plasmapheresis, administration of intravenous immunoglobulin (IVIg), use of an antibody preparation, modification of background immunosuppression or a combination of these options (Bartel 2011).
There are several different preparations of horse and rabbit‐derived polyclonal antibodies against the human lymphocyte or thymocyte ‐ anti‐lymphocyte globulin (ALG), anti‐thymocyte globulin (ATG; horse or rabbit), and T10B9. A mouse monoclonal antibody against the CD3 receptor on activated T‐cells (muromonab‐CD3) also became commercially available in the late 1980s, but has since been withdrawn from the market in most countries. The integration of these antibodies into acute cellular rejection treatment protocols has developed as newer immunosuppressive agents have become available and immunosuppressive strategies evolved.
Recent studies have illustrated that a significant amount of B‐cell infiltrate is identified in T‐cell mediated tubulointerstitial rejection (Mengel 2007) and use of monoclonal antibody preparations which target different aspects of the immune system have been reported as described below.
How the intervention might work
ATG and mouse monoclonal antibodies against the CD3 receptor on activated T‐cells are preparations remove the functional T‐cell population from circulation, producing powerful saturation immunosuppression. These agents are useful for induction immunosuppression and for the management of acute rejection.
Recent reports describe the use of newer monoclonal antibodies targeting different aspects of the immune system (Chon 2014; Halloran 2004; Hardinger 2013). For example, alemtuzumab a monoclonal antibody directed against CD 52 (Campath – 1H) effects T and B lymphocytes and natural killer cells. The use of this agent to treat acute cellular rejection has been reported in a few small studies (Basu 2005; Csapo 2005)
Rituximab, a monoclonal antibody directed against CD20, causes depletion of mature B‐cells and has been used in treatment of acute cellular rejection with B‐cell infiltrates.
In the treatment of acute humoral rejection plasmapheresis and immunoadsorption are thought to act by physically removing circulating antibodies. IVIg has immunomodulatory properties, and suppresses the production of anti‐HLA antibodies and modifies complement activation (Dheda 2013; Jordan 2011). Other treatment strategies for treatment of acute humoral rejection are targeted towards reducing donor specific antibody titres by modifying B cell (rituximab) and plasma cell function (bortezomib), or reducing tissue damage induced by complement activation (eculizumab) (Dheda 2013; Roberts 2012).
Why it is important to do this review
However, these agents especially if used in combination or sequentially can cause profound and prolonged immunosuppression and be complicated by higher rates of infection and malignancy. It is important to consider the implications of cumulative immunosuppressive treatment in the context of a patient with lifelong end‐stage kidney disease who may have multiple transplants.
Objectives
The aim of this systematic review was to identify and summarise the evidence for the efficacy and adverse effects of using monoclonal or polyclonal antibodies to treat acute cellular or humoral rejection in kidney transplant recipients.
-
To evaluate the relative and absolute effects of different classes of antibody preparation in preventing graft loss and resolving cellular or humoral rejection episodes when used as a treatment for first episode of rejection in kidney transplant recipients
-
To evaluate the relative and absolute effects of different classes of antibody preparation in preventing graft loss and resolving cellular or humoral rejection episodes when used as a treatment for steroid‐resistant rejection in kidney transplant recipients
-
To determine how the benefits and adverse events vary for each type of antibody preparation
-
To determine how the benefits and harms vary for different formulations of antibody within each type.
Methods
Criteria for considering studies for this review
Types of studies
All RCTs were included where an antibody was compared to any other treatment with the aim of reversing acute rejection. Eligibility for inclusion was not restricted on the basis of report language, age of recipients, or combinations of baseline immunosuppressive co‐interventions in either the control or intervention arm of the studies.
Types of participants
Adults and children who have had a kidney transplant Only studies involving kidney transplant as single organ were included; recipients of multi‐organ transplants were excluded from this review.
Types of interventions
All mono‐ and polyclonal antibody preparations, given in combination with any other immunosuppressive agents, for the treatment of acute graft rejection, compared to any other treatment for acute rejection. Treatments for acute cellular and humoral rejection were summarized separately. Comparisons examined were:
-
ATG versus ALG
-
ATG versus a different ATG (e.g. rabbit versus horse)
-
Monomurab‐CD3 versus ATG or ALG
-
Any antibody versus non‐antibody intervention
-
Any antibody in dosage comparisons
The class effect of anti‐lymphocyte preparations was initially assumed but differences in formulation were also examined (e.g. rabbit‐ versus horse‐based ATG formulations). All dosage regimens were included.
Types of outcome measures
Definitions used by each study for each outcome were recorded. Data on the following outcomes were collected wherever possible.
Primary outcomes
-
Reversal of acute rejection
-
Time to reversal
-
Recurrent rejection after the intervention rejection episode had been treated
-
Time to re‐rejection.
Secondary outcomes
-
Graft loss (censored and not censored for death)
-
Mortality
-
Graft function (measured by serum creatinine or calculated glomerular filtration rate (GFR))
-
Treatment failure necessitating a change in treatment either of the antibody or of the baseline immunosuppression
-
Immediate adverse effects of treatment
-
Occurrence of infection including cytomegalovirus disease (CMV)
-
Incidence of malignancy (including post‐transplant lymphoproliferative disorder (PTLD)).
'Summary of findings' tables
We presented the main results of the review in 'Summary of findings' tables. These tables present key information concerning the quality of the evidence, the magnitude of the effects of the interventions examined, and the sum of the available data for the main outcomes (Schünemann 2011a). The 'Summary of findings' tables also include an overall grading of the evidence related to each of the main outcomes using the GRADE (Grades of Recommendation, Assessment, Development and Evaluation) approach (GRADE 2008). The GRADE approach defines the quality of a body of evidence as the extent to which one can be confident that an estimate of effect or association is close to the true quantity of specific interest. The quality of a body of evidence involves consideration of within‐trial risk of bias (methodological quality), directness of evidence, heterogeneity, precision of effect estimates and risk of publication bias (Schünemann 2011b). We presented the following outcomes in the 'Summary of findings' tables.
-
Failure of reversal of acute rejection
-
Recurrent rejection follow up: 12 months
-
Graft loss or death with a functioning graft follow up: 12 months
-
Graft loss censored for death follow up: 18 months
-
Death follow up: 12 months
-
Treatment adverse events
Search methods for identification of studies
Electronic searches
We searched the Cochrane Kidney and Transplant Specialised Register to 18 April 2017 through contact with the Information Specialist using search terms relevant to this review. The Cochrane Kidney and Transplant Specialised Register contains studies identified from several sources.
-
Monthly searches of the Cochrane Central Register of Controlled Trials (CENTRAL)
-
Weekly searches of MEDLINE OVID SP
-
Hand searching of kidney‐related journals and the proceedings of major kidney conferences
-
Searching of the current year of EMBASE OVID SP
-
Weekly current awareness alerts for selected kidney and transplant journals
-
Searches of the International Clinical Trials Register (ICTRP) Search Portal and ClinicalTrials.gov.
Studies contained in the Specialised Register are identified through search strategies for CENTRAL, MEDLINE, and EMBASE based on the scope of Cochrane Kidney and Transplant. Details of these strategies, as well as a list of hand searched journals, conference proceedings and current awareness alerts, are available in the Specialised Register section of information about Cochrane Kidney and Transplant.
See Appendix 1 for search terms used in strategies for this review.
Searching other resources
-
Clinical practice guidelines, review articles and relevant studies.
-
Letters seeking information about unpublished or incomplete studies to investigators known to be involved in previous studies.
Data collection and analysis
Selection of studies
This update (2017) was undertaken by five authors.
The search strategy described was used to obtain titles and abstracts of studies that may be relevant to the review. The titles and abstracts were screened independently by at least two authors, who discarded studies that were not applicable, however studies and reviews that may have included relevant data or information on studies were retained initially. Two authors independently assessed retrieved abstracts and, where necessary the full text, of these studies to determine which studies satisfied the inclusion criteria.
Data extraction and management
Data extraction was carried out independently by two authors using standard data extraction forms. Studies reported in non‐English language journals were translated before assessment. Where more than one publication of one study existed, reports be grouped together and the publication with the most complete data was used in the analyses. When relevant outcomes were only published in earlier versions these data were used. Any discrepancy between published versions have been highlighted.
Assessment of risk of bias in included studies
For this update, the following items were independently assessed by two authors using the risk of bias assessment tool (Higgins 2011) (see Appendix 2).
-
Was there adequate sequence generation (selection bias)?
-
Was allocation adequately concealed (selection bias)?
-
Was knowledge of the allocated interventions adequately prevented during the study?
-
Participants and personnel (performance bias)
-
Outcome assessors (detection bias)
-
-
Were incomplete outcome data adequately addressed (attrition bias)?
-
Are reports of the study free of suggestion of selective outcome reporting (reporting bias)?
-
Was the study apparently free of other problems that could put it at a risk of bias (other bias)?
Measures of treatment effect
For dichotomous outcomes (e.g. rejection or no rejection) results were expressed as a risk ratio (RR) with 95% confidence intervals (CI). Where continuous scales of measurement were used to assess the effects of treatment (e.g. GFR), the mean difference (MD) was used, or the standardised mean difference (SMD) if different scales had been used.
Unit of analysis issues
When analysing the risk ratio for the dichotomous outcomes, we took used each individual person/participant as the unit of analysis rather than each rejection event that occurred.
Dealing with missing data
Where necessary we contacted study authors for additional information about their studies. Four study authors (Drs Midtvedt, Almartine, Howard and Birkeland) provided additional information. We analysed available data and have referred to areas of missing data in the text (Alamartine 1994; Birkeland 1975; Howard 1977; Midtvedt 1996; Midtvedt 2003).
Assessment of heterogeneity
We first assessed the heterogeneity by visual inspection of the forest plot. Heterogeneity was then analysed using a Chi2 test on N‐1 degrees of freedom, with an alpha of 0.05 used for statistical significance and with the I2 test (Higgins 2003). A guide to the interpretation of I2 values is as follows.
-
0% to 40%: might not be important
-
30% to 60%: may represent moderate heterogeneity
-
50% to 90%: may represent substantial heterogeneity
-
75% to 100%: considerable heterogeneity.
The importance of the observed value of I2 depends on the magnitude and direction of treatment effects and the strength of evidence for heterogeneity (e.g. P‐value from the Chi2 test, or a CI for I2) (Higgins 2011).
Assessment of reporting biases
We planned to construct funnel plots to assess for the potential existence of small study bias (Higgins 2011).
Data synthesis
In this update, data have been grouped by their treatment for first cellular (T cell) rejection, first humoral (B cell) rejection, or steroid‐resistant rejection, and then by the possible outcomes measured, including: failure reversal of acute rejection, recurrent rejection, graft loss (censored and not censored for death), mortality, treatment failure requiring additional treatment, adverse events, occurrence of infections or malignancy, and graft function.
Within these categories, the outcome analysis was further stratified by antibody type. Forest plots were compiled using the Mantel‐Haenszel method for dichotomous outcomes, and the generic inverse variance method for continuous outcomes. Additional tables were made to analyse the effect of the intervention for both first cellular and steroid‐resistant rejection by the differences in formulation (rabbit‐derived ATG versus horse‐derived ATG), regimen (3 days versus 10 days ALG), dosage (half dose versus standard dose muromonab‐CD3), and non‐antibody intervention (IVIg, 15‐deoxyspergualin).
Subgroup analysis and investigation of heterogeneity
Heterogeneity was minimised as much as possible by grouping studies as described earlier. Data was pooled using the random effects model in all subgroup analyses.
Possible sources of heterogeneity identified a priori were study quality, specific formulation of antibody, and combination of baseline immunosuppression. Subgroup‐analysis was planned to formally identify important clinical differences among the studies that might potentially be expected to alter the magnitude of treatment effect, but this was not possible because of the sparseness of the data and many were old studies.
Sensitivity analysis
Sensitivity analysis was undertaken to assess the contribution of individual studies to heterogeneity and to assess any changes in results following exclusion of that study.
Results
Description of studies
Results of the search
We searched the Specialised Register to 18 April 2017 and identified 31 new reports. After full‐text assessment, 12 new studies (19 reports) were identified. Ten new studies (17 reports) were included (Alamartine 1994; Blumke 1989; Broyer 1987a; Campistol 1990; Okubo 1993; Olausson 1995; RITUX‐ERAH 2016; Simonian 1983; Toledo‐Pereyra 1985; Zarkhin 2008), one study was excluded (Kulkarni 2016), and one ongoing study was identified and will be assessed in a future update of this review (RIACT Study 2012).
We also identified 12 new reports of 10 existing included studies, nine of which offered no new data (Gaber 1998; Goldstein 1985; Hesse 1990; Hourmant 1985; Howard 1977; Johnson 1989; Spieker 1992; Waid 1991). One report was the completed protocol of Hoitsma 1982 and included more participants and outcomes.
See Figure 1 for flow chart of study selection.
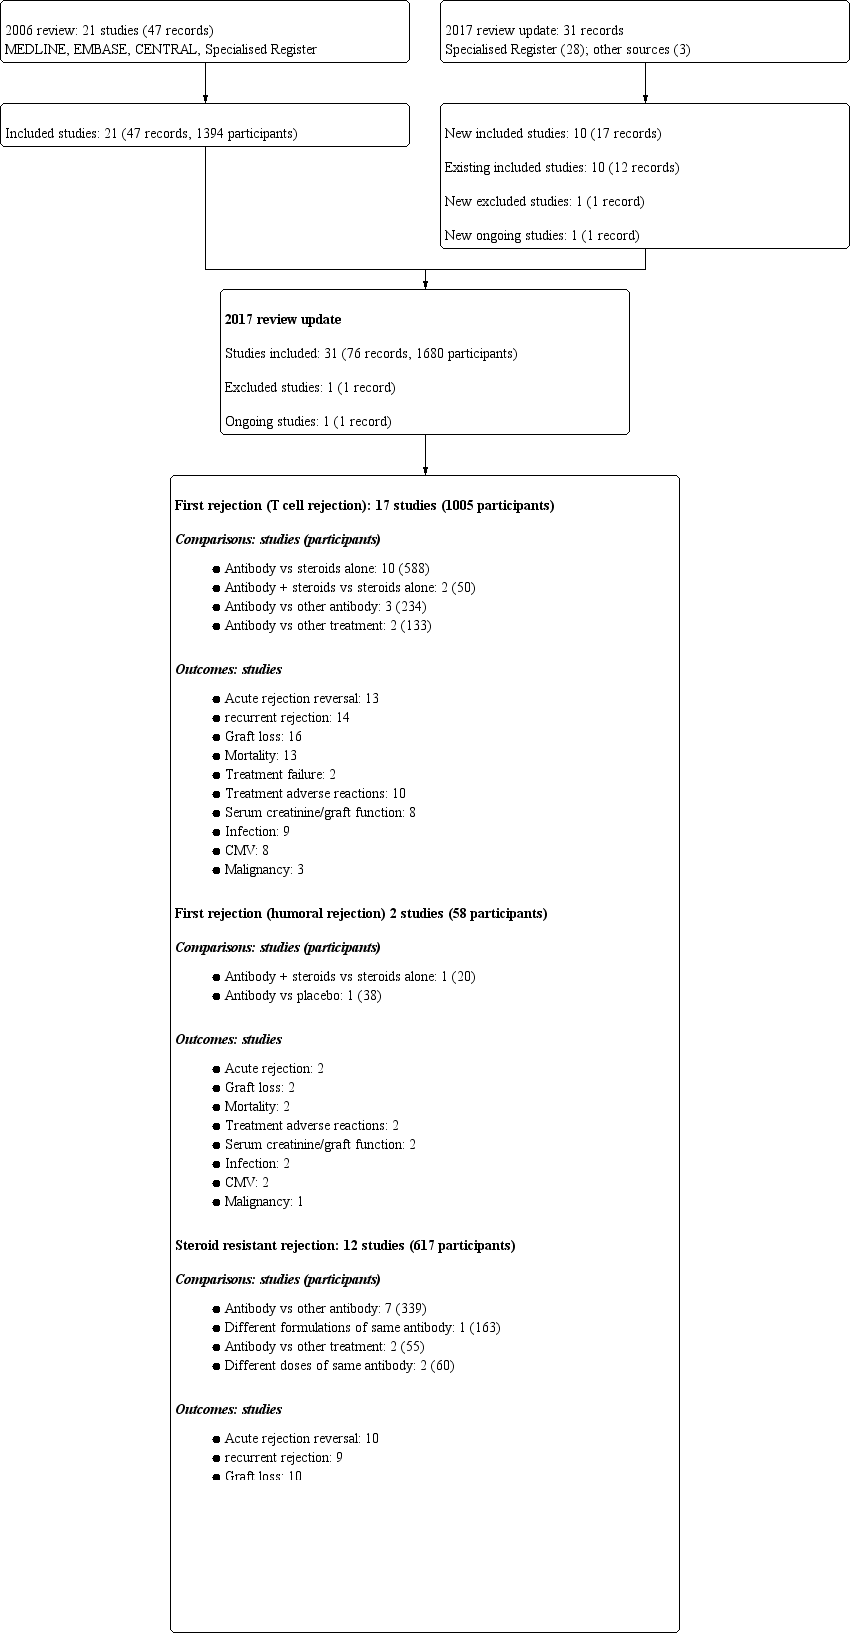
Study flow diagram.
Four studies (Alamartine 1994 (59 participants), Campistol 1990 (50 participants), Hilbrands 1996 (26 participants) and Simonian 1983 (20 participants)) were only reported as conference abstracts and the remaining 27 were reported in 10 different journals, published between 1975 and 2016. Twenty eight of the studies were reported in English, one was in German (Spieker 1992) and one in French (Hourmant 1985).
Included studies
Patient characteristics, baseline immunosuppression, randomised interventions and outcomes definitions varied across studies. There were two main groups of studies, those which evaluated interventions for first cellular or humoral rejection episodes and those which evaluated interventions in steroid‐resistant rejection episodes. There were no studies identified where IL2 receptor antagonists were investigated. Two studies investigated use of rituximab (RITUX‐ERAH 2016; Zarkhin 2008). One ongoing study (RIACT Study 2012), which will be included in a future update of this review, is also investigating rituximab.
Population demographics
Information on study population demographics was limited. Thirteen studies were conducted entirely in adult recipients (Alamartine 1994; Casadei 1998; Gaber 1998; Hesse 1990; Mariat 1998; Midtvedt 1996; Midtvedt 2003; Okubo 1993; Olausson 1995; RITUX‐ERAH 2016; Spieker 1992Streem 1983; Waid 1991) and four studies included a proportion (size not reported) of children (Broyer 1987a; Filo 1980; Howard 1977; Zarkhin 2008). Eight studies included a proportion (size not always stated) of patients with prior immunological sensitisation, as measured by panel reactive antibodies > 20 % (Alamartine 1994; Baldi 2000; Filo 1980; Gaber 1998; Goldstein 1985; Hoitsma 1982; Mariat 1998; Olausson 1995) and the remaining studies did not clearly define their recipient population. The proportion of grafts from deceased and living donor sources, and of recipients with prior failed transplants is given in the table of included studies.
Interventions
First cellular rejection
Seventeen studies (1005 participants) investigated the treatment of first cellular rejection episodes. For these studies, nine (530 participants) compared antibody to steroid (Broyer 1987a; Filo 1980; Glass 1983; Goldstein 1985; Hilbrands 1996; Hoitsma 1982; Shield 1979; Streem 1983; Theodorakis 1998); two (50 participants) compared antibody with steroid‐to‐steroid alone (Birkeland 1975; Simonian 1983); four (310 participants) compared antibody versus a different antibody (Baldi 2000; Johnson 1989; Toledo‐Pereyra 1985; Waid 1991). One (57 participants) compared ALG with IVIg (Howard 1977) and one (58 participants) compared ALG with steroid and a switch to CsA (Hourmant 1985).
ATG was rabbit‐derived for three studies, two manufactured by Fresenius (Baldi 2000; Theodorakis 1998) and the formulation unstated in Hilbrands 1996. Horse‐derived ATG was used for five studies, all Upjohn ATGAM (Filo 1980; Hoitsma 1982; Shield 1979; Simonian 1983; Toledo‐Pereyra 1985). ALG was entirely derived from horses, one manufactured by Merieux (Hourmant 1985), three by the University of Minnesota (Glass 1983; Streem 1983; Toledo‐Pereyra 1985), and formulations where unknown in three studies (Birkeland 1975; Broyer 1987a; Howard 1977).
Triple agent baseline immunosuppression with CsA, AZA and steroids was used in only one study (Baldi 2000), two studies used dual therapy with CsA and steroid (Hilbrands 1996; Theodorakis 1998) and the remainder used AZA and steroids, either with prior ALG induction therapy at the time of transplantation (Hourmant 1985; Streem 1983; Toledo‐Pereyra 1985) or without.
Humoral rejection
Two studies looking at humoral rejection using rituximab; Zarkhin 2008 (20 participants) compared rituximab with steroid‐to‐steroid alone, and RITUX‐ERAH 2016 (38 participants) compared rituximab with placebo. Zarkhin 2008 used anti‐CD 20 rituximab manufactured by BIOGEN‐IDEC Pharmaceuticals and Genentech Inc.
Steroid‐resistant rejection
Twelve studies (617 participants) investigated the treatment of steroid‐resistant rejection episodes; seven studies (339 participants) compared muromonab‐CD3 to treatment with another antibody (Alamartine 1994; Campistol 1990; Blumke 1989; Hesse 1990; Mariat 1998; Midtvedt 2003; Spieker 1992), one compared dosage schedules of muromonab‐CD3 (30 participants) (Midtvedt 1996), one compared dosage schedules of ATG (30 participants) (Olausson 1995), one compared muromonab‐CD3 to IVIg (30 participants) (Casadei 1998), and one compared muromonab‐CD3 to IV 15‐Deoxyspergualin (15‐DSP) (25 participants) (Okubo 1993).
ATG was rabbit‐derived for four studies, three manufactured by Genzyme (Gaber 1998; Mariat 1998; Midtvedt 2003), and one by Merieux (Alamartine 1994). Horse‐derived ATG was used by five studies, two used Upjohn ATGAM (Johnson 1989; Gaber 1998), two used Fresenius (Blumke 1989; Olausson 1995), and the formulation unstated in Spieker 1992. ALG was all horse‐derived, one used ALG manufactured by Merieux (Hesse 1990), and ALG was not defined in Campistol 1990.
Triple agent baseline immunosuppression with CsA, AZA and steroids was used for eight studies (Blumke 1989; Casadei 1998; Gaber 1998; Mariat 1998; Midtvedt 1996; Midtvedt 2003; Olausson 1995; Spieker 1992;) two studies used dual therapy with CsA and steroid (Campistol 1990; Hesse 1990) and one study used monotherapy with steroids (Alamartine 1994). No studies used tacrolimus or mycophenolate, or other antibody induction agents in either intervention rationale.
One study compared rabbit and horse preparations of ATG (163 participants) in recipients with mixed acute rejection scenarios; 33% had a previous rejection episodes, of which 40% had incomplete reversal at the time of randomisation to further treatment, and 11% had a first rejection episode that was steroid‐resistant (Gaber 1998).
Outcomes
The reporting of outcomes was variable (Figure 1) with graft‐focused outcomes reported more frequently (e.g. reversal of acute rejection, 23 studies) than patient‐focused complications of treatment (e.g. CMV infection, 16 studies) or specific adverse reactions. For many outcomes there was wide variation in the definitions used, the time post‐treatment at which the data was collected, and the detail provided for each definition. The variation in definitions used is illustrated in (Table 1, Table 2, Table 3). Data on time to reversal of acute rejection were often reported incompletely; although five studies reported mean time to rejection reversal and three studies the mean time to re‐rejection; only Filo 1980 reported the SD of the mean time, and so data could not be combined.
| Study ID | Days since transplant | Timing of randomisation | Criteria for rejection* | Criteria for rejection reversal* |
| Antibody versus steroid | ||||
| < 35 | Rejection | Scoring algorithm of biochemical, and physical signs, with confirmatory “biopsy where possible” | Day 2 of “persistent creatinine fall” | |
| < 90 | Rejection | “Clinical signs, imaging and renal function tests” | Increase in creatinine within 24 to 48 hours of bolus MP | |
| < 90 | Rejection | Increased creatinine, oliguria, sodium retention, weight gain, proteinuria, graft tenderness | Day 2 of 3 consecutive days of creatinine falling | |
| ns | Transplantation | Clinical criteria including creatinine rise for 3 sequential days | Improvement in creatinine and clinical signs at 7th day of treatment | |
| ns | Transplantation | Rise in creatinine and diminished function on I‐131 scan, with “supportive clinical findings” with confirmatory “biopsy where possible” | Day 2 of “persistent creatinine fall” | |
| 6‐90 | Rejection | Scoring algorithm of biochemical, and physical signs, with confirmatory “biopsy where possible” | 3 day progressive fall in creatinine, or investigator judged clinical reversal. | |
| > 8 | Rejection | “Rise in plasma creatinine” and “changes in kidney echogenicity” on ultrasound. If unsure, “rejection was confirmed by kidney biopsy” | ns | |
| < 90 | Rejection | ns | ns | |
| ns | Rejection | Clinical ± biopsy confirmation | Not assessed. Severity of rejection episode judged by AUC of serial 10 day creatinine measurements. | |
| Antibody and steroid versus steroid alone | ||||
| ns | Rejection | “Common clinical criteria”, with biopsy where possible | Day 2 of progressive rise in creatinine clearance | |
| ns | Rejection | ns | ns | |
| Antibody versus other antibody | ||||
| ns | Transplantation | Primarily by laboratory signs of increase in SCr ≥ 0.3 mg/dL on any given day, or “clinical signs associated with rejection” and “an increase in kidney size on ultrasound” | ns | |
| ns | Rejection | 4 of 7 clinical and biochemical signs, subsequently confirmed by biopsy | Absence of cross‐over, re‐treatment or graft loss | |
| ns | Rejection | 20% increase in creatinine with clinical suggestive signs, and biopsy if > 10 days from transplantation | ns | |
| Formulation comparisons | ||||
| ns | Rejection | Standard clinical indicators with supplementary “biopsy where possible” | 1st of 3 consecutive days of creatinine falling | |
| Antibody versus other treatment | ||||
| ns | Rejection | Rise in creatinine of 0.3 mg/dL and deterioration of renogram, “mostly confirmed by biopsy” | ns | |
| > 90 | 90 days post‐transplant | ns | ns | |
* direct quotation from the text of study reports appears in quotation marks
AUC ‐ area under the curve; ns ‐ not stated and could not be clarified or deduced; MP ‐ methylprednisolone; SCr ‐ serum creatinine
| Study ID | Days since transplant* | Timing of randomisation* | Criteria for rejection* | Criteria for rejection reversal* |
| Antibody versus placebo | ||||
| ns | Rejection | “Biopsy proven” and Banff graded | “Recovery of graft function to within 20% of the baseline pre‐rejection value 1, 3, 6, and 12 months after the episode”, and “Resolution of the Banff biopsy grade” | |
| ns | Rejection | “Biopsy proven” | “Improvement of renal function at day 12” | |
* direct quotation from the text of study reports appears in quotation marks
MP ‐ methylprednisolone; ns ‐ not stated and could not be clarified or deduced
| Study ID | Days since transplant* | Timing of randomisation* | Criteria for rejection* | Initial treatment of rejection* | Criteria for resistant rejection* |
| Antibody versus other antibody | |||||
| ns | “Steroid resistant rejection crisis” | ns | 3 bolus injections of cortisone | “Not sufficiently treated” with steroids | |
| ns | ns | Confirmed by renal biopsy | MP 1g for 3 days | ns | |
| < 42 | ns | Rise in creatinine of > 0.3 mg/dL and biopsy | MP 500 mg for 2 days | “Non response” | |
| “early” | ns | “Typical clinical symptoms”, renogram, and biopsy | MP 500‐1000 mg for 3 days | Lack of improvement in clinical and sonographic appearances | |
| ns | At biopsy | Biopsy with “histological diagnosis” | MP 15 mg/kg, 2 bolus doses | “Absence of a clear response to the steroids” | |
| ns | At biopsy | Delayed graft function or rise in creatinine in presence of urine output < 1 L/d, low sodium excretion, weight gain > 1 kg/d or graft tenderness | MP 15 mg/kg, 2 doses alternate days | No decline in creatinine after 2 steroid boluses, followed by biopsy | |
| ns | Day 5 of treatment | Rise in creatinine > 20% in the absence of obvious cause and biopsy (Banff criteria) | MP 500 mg then 250 mg for 3 days | No decline in creatinine | |
| Different formulations of antibody | |||||
| ns | At biopsy | Biopsy, Banff graded | MP 500 mg, for 3 days | Creatinine increase of 10% after 3 days of MP | |
| Different doses of same antibody | |||||
| < 90 | Day 5 of treatment | Rise in creatinine > 20% in absence of obvious cause | MP boluses, cumulative dose 1‐1.5 g | No decline in creatinine after 5 days of treatment | |
| Different duration of same antibody | |||||
| ns | At biopsy | “Diagnosed clinically and verified with a core needle biopsy” | MP 250‐500 mg, for 4 days | Not responding with improved kidney function on 5th day of steroid treatment | |
| Antibody versus other treatment | |||||
| < 365 | Day 4 of treatment | Accelerated rejection: “progressive rise in SCr level was observed within 7 days of transplant”. Acute rejection: “rise in SCr of 0.5 mg/dl or higher” was seen anytime during post‐transplant course. Acute on chronic rejection: “a similar rise in SCr occurred in a patient with sustained creatinine level of ≥2.5mg/dl due to a documented previous acute rejection episode” | MP 500‐1000 mg, for 3 days | “Serum creatinine did not revert to the basal level within a week from the onset” | |
| ns | At biopsy | Clinical suspicion and biopsy | MP 500 mg for 3 days | “Failure to show improved renal function” within 7 days of starting MP | |
* direct quotation from the text of study reports appears in quotation marks
MP ‐ methylprednisolone; ns ‐ not stated and could not be clarified or deduced
Excluded studies
Kulkarni 2016 was excluded as it assessed chronic not acute rejection.
Risk of bias in included studies
Allocation
Six studies (19%) reported adequate sequence generation (Filo 1980; Gaber 1998; Goldstein 1985; Hoitsma 1982; RITUX‐ERAH 2016; Waid 1991) two studies (6%) used inadequate sequence generation methods (Okubo 1993; Glass 1983) and the remaining 23 studies (75%) didn't provide sufficient information to assess the method of sequence generation.
Four studies (13%) reported adequate allocation concealment (Filo 1980; Gaber 1998; RITUX‐ERAH 2016; Waid 1991) two studies (6%) used inadequate allocation concealment (Blumke 1989; Okubo 1993) and the remaining 26 studies (81%) were randomised but gave no indication of the allocation method used.
Blinding
Twenty‐three studies (75%) adequately blinded (Alamartine 1994; Birkeland 1975; Blumke 1989; Broyer 1987a; Campistol 1990; Casadei 1998; Filo 1980; Gaber 1998; Glass 1983; Hesse 1990; Hilbrands 1996; Howard 1977; Midtvedt 1996; Midtvedt 2003; Olausson 1995; RITUX‐ERAH 2016; Shield 1979; Simonian 1983; Spieker 1992; Streem 1983; Theodorakis 1998; Waid 1991; Zarkhin 2008); six studies (19%) had no blinding (Baldi 2000; Goldstein 1985; Hoitsma 1982; Johnson 1989; Okubo 1993; Toledo‐Pereyra 1985) as evident by the differences in drug dosage, delivery and duration between the two groups; and two studies (6%) had insufficient information to suggest presence of absence of blinding (Hourmant 1985; Mariat 1998).
Incomplete outcome data
Three studies (10%) had incomplete data assessment having excluded randomised participants or had significant unexplained loss to follow‐up (Goldstein 1985; Howard 1977; Midtvedt 1996). Three studies (10%) had insufficient information to suggest the presence of incomplete outcome data (Johnson 1989, Theodorakis 1998, Waid 1991) and the remaining 25 studies (80%) had no loss to follow‐up or insignificant loss to follow‐up with intention‐to‐treat analysis performed.
Selective reporting
Nine studies (29%) had evidence of selective reporting (Birkeland 1975; Blumke 1989; Filo 1980; Goldstein 1985; Howard 1977; Johnson 1989; Midtvedt 1996; Olausson 1995; Toledo‐Pereyra 1985), and 18 studies (58%) had no risk of bias from selective reporting (Alamartine 1994; Baldi 2000; Broyer 1987a; Casadei 1998; Gaber 1998; Glass 1983; Hesse 1990; Hilbrands 1996; Hoitsma 1982; Mariat 1998; Midtvedt 2003; Okubo 1993; RITUX‐ERAH 2016; Shield 1979; Spieker 1992; Streem 1983; Waid 1991; Zarkhin 2008). Four studies (13%) had insufficient information to permit judgment about selective reporting (Campistol 1990; Hourmant 1985; Simonian 1983; Theodorakis 1998).
Other potential sources of bias
Seven studies (23%) had risk of bias due to possible conflict of interest from funding sources (Broyer 1987a; Filo 1980; Gaber 1998; Goldstein 1985; Olausson 1995; Shield 1979; Zarkhin 2008). Four studies (13%) were deemed as free of other biases (Hoitsma 1982; Howard 1977; RITUX‐ERAH 2016; Waid 1991) and the remaining 20 studies (64%) judged as having an unclear risk of other bias.
Effects of interventions
See: Summary of findings for the main comparison Antibody (T cell) versus steroid (stratified by antibody type) for the treatment of first rejection episodes in kidney transplant recipients; Summary of findings 2 Antibody (T cell) + steroid versus steroid alone for the treatment of first rejection episodes in kidney transplant recipients; Summary of findings 3 Muromonab‐CD3 (T cell) versus other antibody (stratified by comparator) for the treatment of first rejection episodes in kidney transplant recipients; Summary of findings 4 Rituximab (B cell) + steroid versus steroid alone for the treatment of first rejection episodes in kidney transplant recipients; Summary of findings 5 Antibody versus other antibody (stratified by antibody type) for the treatment of steroid‐resistant rejection episodes in kidney transplant recipients
Antibody therapy for the first cellular rejection episode
Antibody versus steroids
Reversal of an initial episode of cellular rejection was probably better with antibody when compared to steroid alone (Analysis 1.1 (6 studies, 405 participants): RR 0.50, 95% CI 0.30 to 0.82; I2 = 36%; moderate certainty evidence). Recurrent rejection within the first year (Analysis 1.3 (9 studies, 508 participants): RR 0.75, 95% CI 0.56 to 1.00; I2 =54%; moderate certainty evidence) was probably slightly reduced with the use of antibody compared to steroid alone.
For the studies of antibody versus steroid, there was little or no difference in treatment failure necessitating additional treatment (Analysis 1.2), preventing graft loss, whether censored for deaths (Analysis 1.5 (8 studies, 475 participants): RR 0.80, 95% CI 0.57 to 1.12; I2 = 37%) or including death with a functioning graft (Analysis 1.4), deaths within a year (Analysis 1.6), and serum creatinine three months post‐treatment (Analysis 1.8). No studies reported malignancy data. Adverse effects of treatment (including fever, chills and malaise following drug administration) were probably reduced with steroid therapy (Analysis 1.7.1 (4 studies, 280 participants): RR 23.88, 95% CI 5.10 to 111.86; I2 = 16%; moderate certainty). There was probably little or no difference in infection (total), CMV infection, and avascular necrosis of the femoral head between antibody and steroid treatment (Analysis 1.7.2; Analysis 1.7.3; Analysis 1.7.4) (moderate certainty).
Antibody plus steroids versus steroids alone
Two studies looked at antibody plus steroids versus steroids alone.
Antibody plus steroids may favour reversal of an initial episode of cellular rejection compared to steroids alone (Analysis 2.1 (1 study, 30 participants): RR 0.42, 95% CI 0.17 to 1.01; low certainty evidence). This was also the case for recurrent rejection within the first three months (Analysis 2.2 (1 study, 30 participants): RR 0.07, 95% CI 0.00 to 1.06).
It was uncertain whether antibody plus steroids reduced graft loss (both censored for deaths and including death with a functioning graft) because the certainty of the evidence was very low (Analysis 2.3; Analysis 2.4). Antibody plus steroids may make little or no difference to death within a year (Analysis 2.5) (low certainty evidence).
Muromonab‐CD3 versus other antibody
For the two studies comparing muromonab‐CD3 with another antibody, there was probably little of no evidence of an advantage for muromonab‐CD3 in reversing rejection (Analysis 3.1 (2 studies, 132 participants): RR 1.84, 95% CI 0.92 to 3.67; I2 = 0%), the requirement for additional treatment to achieve reversal (Analysis 3.2 (2 studies, 132 participants): RR 1.67, 95% CI 0.77 to 3.63; I2 = 0%), subsequent recurrent rejection (Analysis 3.3 (2 studies, 129 participants): RR 1.06, 95% CI 0.59 to 1.88; I2 = 0%), infection (Analysis 3.4.4 (2 studies, 86 participants): RR 1.53, 95% CI 0.69 to 3.40; 12 = 37%), CMV infection (Analysis 3.4.5 (2 studies, 132 participants): RR 2.25, 95% CI 0.31 to 16.08; I2 = 48%), and malignancy (Analysis 3.4.6 (2 studies, 132 participants): RR 0.26, 95% CI 0.03 to 2.30) (moderate certainty evidence).
Muromonab‐CD3 treated patients suffered three times more than those receiving either ATG or T10B9, from a syndrome of fever, chills and malaise following drug administration (Analysis 3.4.1 (2 studies, 132 participants): RR 3.12, 95% CI 1.87 to 5.21; I2 = 31%), and experienced more neurological side effects (Analysis 3.4.3 (2 studies, 132 participants): RR 13.10 95% CI 1.43 to 120.05; I2 = 36%) (low certainty evidence).
Other comparisons
Three other RCTs compared three other different intervention algorithms using antibody in the treatment of first cellular rejection episodes. Where rabbit‐derived ATG was compared to horse‐derived ATG or where ALG was compared to IVIg, there were little or no differences in any outcomes assessed, with the exception for immediate treatment side effects of fevers, chills, and malaise with less with rabbit‐derived ATG than horse‐derived ATG (Table 4: RR 0.38, 95% CI 0.27 to 0.54). When ATG was compared to ALG, no difference was found in outcome assessed any of the outcomes assessed (Table 4).
| Outcomes | Comparisons Relative effect (95% CI) | ||
| rabbit‐ATG versus horse‐ATG (1 study, 159 participants) | ATG versus ALG (1 study, 50 participants) | ALG versus IVIg (1 study, 45 participants) | |
| Failure of reversal of acute rejection | RR 0.88 (0.41 to 1.87) | RR 0.95 (0.28 to 3.27) | RR 2.40 (0.27 to 21.35) |
| Recurrent rejection post‐therapy | RR 1.24 (0.77 to 1.99) | RR: 0.95 (0.48 to 1.87) | RR 0.62 (0.28 to 1.38) |
| Graft loss or death with a functioning graft (≤ 12 months) | RR 0.73 (0.37 to 1.44) | RR 1.09 (0.60 to 1.99) | RR 1.00 (0.49 to 2.05) |
| Graft loss censored for death (≤ 12 months) | Not reported | RR 0.89 (0.41 to 1.93) | RR 0.93 (0.37 to 2.34) |
| Death (≤ 12 months) | Not reported | RR 2.00 (0.40 to 9.95) | RR 1.20 (0.22 to 6.50) |
| Malignancy (total) | Not reported | Not reported | RR 2.42 (0.10 to 56.46) |
| Treatment side effects: fevers, chills, malaise following administration | RR 0.38 (0.27 to 0.54) | RR 0.75 (0.19 to 3.01) | Not reported |
| Treatment side effects: thrombocytopenia | Not reported | RR 1.00 (0.07 to 15.12) | Not reported |
ALG ‐ antilymphocyte globulin; ATG ‐ antithymocyte globulin; CI ‐ confidence interval; IVIg ‐ intravenous immunoglobulin; RR ‐ risk ratio
Antibody therapy for the first humoral rejection episode
Rituximab plus steroids versus steroids alone
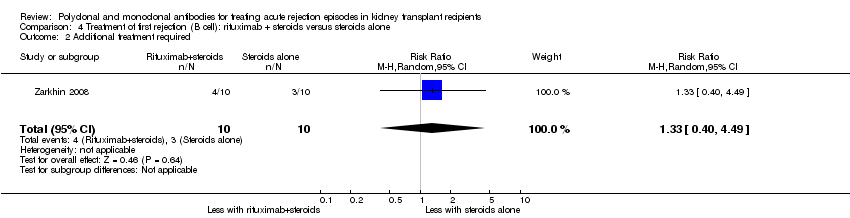
Two studies compared rituximab plus steroids against steroids alone, however was no evidence of difference when adding rituximab in terms of reversal of initial episode of humoral rejection (Analysis 4.1 (2 studies, 53 participants): RR 0.94, 95% CI 0.54 to 1.64; I2 = 0%), additional treatment to achieve reversal (Analysis 4.2 (1 study, 20 participants): RR 1.33, 95% CI 0.40 to 4.49), graft loss including death with a functioning graft (Analysis 4.3 (2 studies, 58 participants): RR 1.00, 95% CI 0.23 to 4.35; I2 = 0%), and death within a year (Analysis 4.4). Rituximab plus steroids probably increases the risk of urinary tract infection/pyelonephritis (Analysis 4.5.3 (1 study, 38 participants): RR 5.73, 95% CI 1.80 to 18.21).
Antibody therapy for steroid‐resistant rejection
Muromonab‐CD3 (OKT3) versus ATG or ALG
Muromonab‐CD3 may make little or no difference to reversing resistant rejection (Analysis 5.1 (5 studies, 244 participants): RR 1.07, 95% CI 0.63 to 1.81; I2 = 8%), requiring additional treatment achieve reversal (Analysis 5.2 (1 study, 11 participants): RR 1.16, 95% CI 0.40, 3.35), preventing subsequent rejection (Analysis 5.3 (5 studies, 284 participants): RR 0.78, 95% CI 0.47 to 1.28; I2 = 45%), or preventing graft loss (Analysis 5.4 censored for death (5 studies, 244 participants): RR 0.86, 95% CI 0.34 to 2.17; I2 = 42%) (Analysis 5.5 including death with a functioning graft (5 studies, 211 participants): RR 0.81, 95% CI 0.43 to 1.51; I2 = 15%) when compared to ALG or ATG (low certainty evidence). Similarly, there was probably little or no difference in death (Analysis 5.6 (3 studies, 175 participants): RR 0.39, 95% CI; I2 = 0%) or mean serum creatinine (Analysis 5.9 (4 studies, 179 participants): 5.93 µmol/L, 95% CI ‐18.46 to 30.32; I2 = 0%) at 12 months.
Patients taking muromonab‐CD3 were just as likely to experience a syndrome of fever, chills and malaise following drug administration (Analysis 5.7.1 (3 studies, 140 participants): RR 2.54, 95% CI 0.18 to 34.92; I2 = 93%), fungal infection (Analysis 5.7.4 (1 study, 50 participants): RR 7.56, 95% CI 0.41 to 139.17; I2 = 0%), CMV infection (Analysis 5.7.5 (5 studies, 284 participants): RR 0.93, 95% CI 0.60 to 1.43; I2 = 40%), and malignancy (Analysis 5.7.6 (2 studies, 115 participants): RR 2.09, 95% CI 0.28 to 15.66; I2 = 0%) as those treated with either ATG or ALG (low certainty evidence).
It is uncertain if muromonab‐CD3 leads to more bacterial infection than either ATG or ALG because the certainty of this evidence is very low (Analysis 5.7.2 (2 studies, 109 participants): RR 8.64, 95% CI 1.64 to 45.56; I2 = 0%). Muromonab‐CD3 may slightly reduce viral infections (Analysis 5.7.3: (1 study, 59 participants): RR 0.53, 95% CI 0.29 to 0.97).
Other comparisons
There were five additional studies each comparing unique paired interventions for treatment of steroid‐resistant rejection (Table 5). When rabbit‐derived ATG (thymoglobulin) was compared to horse‐derived ATG (ATGAM), rabbit‐derived ATG probably prevented recurrent rejection (RR 0.32 95% CI 0.15 to 0.66) compared to horse‐derived ATG. There was probably little or no difference for failure to reverse rejection, deaths, infections, or malignancy. Rabbit‐derived ATG probably slightly reduces graft loss compared to horse‐derived ATG (censored for death: RR 0.46, 95% CI 0.21 to 1.00).
| Outcome | Comparisons Relative effect (95% CI) | ||||
| rabbit‐ATG versus horse‐ATG (1 study, 163 participants) | ATG 3 days versus ALG 10 days (1 study, 30 participants) | Muromonab‐CD3half dose versus standard dose (1 study, 45 participants) | Muromonab‐CD3versus IVIg (1 study, 30 participants) | Muromonab‐CD3versus DSP (1 study, 25 participants) | |
| Failure of reversal of acute rejection | RR 0.52 (0.26 to 1.05) | RR 0.88 (0.43 to 1.80) | RR 1.50 (0.29 to 7.73) | RR 0.50 (0.11 to 2.33) | RR 0.92 (0.35, 2.41) |
| Further treatment required | Not reported | RR 9.60 (0.56 to 163.58) | Not reported | Not reported | Not reported |
| Recurrent rejection post‐therapy | RR 0.32 (0.15 to 0.66) | Not reported | RR 0.50 (0.05 to 4.94) | RR 1.65 (0.80 to 3.41) | RR 1.48 (0.67 to 3.27) |
| Graft loss or death with a functioning graft (≤ 12 months) | RR 0.68 (0.37 to 1.26) | RR 0.86 (0.38 to 1.95) | RR 2.00 (0.43 to 9.32) | RR 1.00 (0.24 to 4.18) | Not reported |
| Graft loss censored for death (≤ 12 months) | RR 0.46 (0.21 to 1.00) | Not reported | RR 1.00 (0.16 to 6.20) | RR 2.00 (0.20 to 19.78) | Not reported |
| Death (≤ 12‐24 months) | RR 1.98 (0.51 to 7.63) | Not reported | RR 5.00 (0.26 to 96.13) | RR 0.50 (0.05 to 4.94) | Not reported |
| Treatment side effects: fevers, chills, malaise following administration | Not reported | Not reported | Not reported | RR 31.00 (2.02 to 475.12) | RR 5.54 (1.55 to 19.82) |
| Treatment side effects: leukopenia | RR 1.93 (1.32 to 2.84) | Not reported | Not reported | Not reported | RR 0.10 (0.02 to 0.69) |
| Treatment side effects: anorexia | Not reported | Not reported | Not reported | Not reported | RR 0.92 (0.15 to 5.56) |
| Treatment failure | RR 0.51 (0.25 to 1.04) | Not reported | Not reported | Not reported | Not reported |
| Infection (total) | RR 0.99 (0.73 to 1.34) | Not reported | Not reported | Not reported | Not reported |
| Infection (bacterial) | RR 0.79 (0.51 to 1.23) | Not reported | RR 3.00 (0.13 to 68.26) | Not reported | Not reported |
| Infection (viral) | RR 1.87 (0.88 to 3.94) | Not reported | Not reported | Not reported | Not reported |
| Infection (fungal) | RR 0.99 (0.36 to 2.69) | Not reported | Not reported | Not reported | Not reported |
| CMV infection (total) | RR 1.01 (0.86 to 1.18) | Not reported | RR 1.00 (0.51 to 1.95) | Not reported | Not reported |
| Malignancy (total) | RR 0.99 (0.21 to 4.75) | Not reported | Not reported | Not reported | Not reported |
| PTLD/Lymphoma | RR 1.48 (0.25 to 8.64) | Not reported | Not reported | Not reported | Not reported |
| SCr | Not reported | Not reported | MD ‐10.00 (‐60.15 to 40.15) (18 months after treatment) | MD 0.47 (‐0.07 to 1.01) (3 months after treatment) | MD 62.00 (‐107.08 to 231.08) (1 month after treatment) |
ALG ‐ antilymphocyte globulin; ATG ‐ antithymocyte globulin; CI ‐ confidence interval; CMV ‐ cytomegalovirus; DSP ‐ 15‐deoxyspergualin; IVIg ‐ intravenous immunoglobulin; MD ‐ mean difference; PTLD ‐ post‐transplant lymphoproliferative disease; RR ‐ risk ratio; SCr ‐ serum creatinine
When a 3‐day course of ATG was compared to a 10‐day course, there was little or difference in reversal of rejection, graft loss, or any further treatment required for reversal of rejection (Table 5).
When muromonab‐CD3 was compared at standard and half dose there was little or no differences in any of the outcomes measured (Table 5). When compared to IVIg or DSP, muromonab‐CD3 probably leads to more side effects post administration with respect to fever, chills, and malaise in both cases (versus IVIg: RR 31.00, 95% CI 2.02 to 475.12; versus DSP: RR 5.54, 95% CI 1.55 to 19.82). There were probably less leukopenia with muronomab‐CD3 than DSP (RR 0.10, 95% CI 0.02 to 0.69).
Discussion
Summary of main results
In kidney transplant recipients on dual baseline immunosuppressive therapy with either AZA and steroids or CsA and steroids, antibody therapy is 50% more effective at reversing a first acute cellular rejection episode, and 20% more effective at preventing graft loss than further steroid treatment, but significant benefit in patient survival has not been demonstrated.
In kidney transplant recipients on triple baseline immunosuppression with CsA, AZA and steroids, experiencing acute rejection resistant to further steroid treatment, there is no evidence that the effects of muromonab‐CD3 and ATG or ALG are different in reversal or recurrence of acute rejection, or patient or graft survival.
Patients treated with an antibody for acute cellular rejection were 23 times more likely to experience an immediate reaction of fever, chills and malaise than those receiving steroid, and muromonab‐CD3 treated patients were three times more likely to experience this reaction than those treated with other antibodies for the treatment of first cellular rejection episode. Other adverse effects of antibody therapy for treatment of acute cellular rejection were inconsistently reported and could not be easily summarised because of sparsely reported data.
In treating acute humoral rejection, there was no evidence that the use of rituximab improved graft or patient survival at one year and there were more adverse events, although these were not statistically different adverse events.
Overall completeness and applicability of evidence
This systematic review was undertaken with widely inclusive criteria, in order to highlight and summarise the totality of RCT evidence available. This approach led to identification of 31 studies involving 1680 participants, including unpublished and non‐English language data sources. This enhances the external and internal validity of our review, as confining a systematic review and meta‐analysis to published or English language data alone has been demonstrated to over‐estimate positive treatment effects (Egger 2001).
We did not identify any studies investigating antibody therapy for the treatment of acute cellular rejection where contemporary immunosuppressive agents such as tacrolimus, mycophenolate or sirolimus were employed which may impact upon the applicability of this evidence to modern day practice. One ongoing study investigating the use of Rituximab for treatment of acute cellular tubule‐interstitial rejection with B‐cell infiltrates will include data from patients receiving modern baseline immunosuppressive regimen (RIACT Study 2012).
In studies investigating the use of antibody therapy for treatment of acute humoral rejection, patients received contemporary immunosuppressive agents such as tacrolimus and mycophenolate which makes this evidence applicable to current practice (RITUX‐ERAH 2016; Zarkhin 2008). However, data regarding treatment of acute humoral rejection remain sparse and further collaborative randomised studies are required.
Quality of the evidence
The reporting of key components for evaluating of the validity of RCTs was not comprehensive and not in line with current standards of reporting. In many cases this reflected design features which are sub‐optimal such as inadequate or unclear sequence generation (81%), inadequate or unclear allocation concealment (87%), inadequate blinding of either personnel (participants or study personnel) or outcome assessors (25%), incomplete outcome data, selective reporting and bias from other sources. These features are associated with substantial bias in favour of the investigational intervention (Peduzzi 1993; Sackett 1979). Many clinically relevant outcomes were not reported at all or only within a very limited time frame; in particular, it is uncertain whether these agents improve graft survival beyond one year. Additionally, the definitions and criteria used to define rejection, steroid‐resistant rejection, and other outcomes were not always reported, were not provided in sufficient detail to be reproducible, and when reported were not uniform across studies. Unfortunately these inconsistencies are not limited to studies on this topic, or to the field of transplantation, but are widely recognised by other investigators across diverse medical fields (Chan 2005; Hollis 1999; Loke 2001).
This review is limited by the quantity and quality of existing published studies, so residual uncertainty about the true effects of these compounds remains.
Potential biases in the review process
The relatively low number of small studies published in this area means that there is considerable imprecision around all estimates of effect. For example, our data suggest that antibody therapy for acute rejection may prevent further recurrent rejection episodes by around 25% compared to steroids, a clinically important difference, but the width of the 95% CI are consistent with a 46% reduction or a 0% reduction. We have insufficient data to conclude with reasonable certainty that antibody treatment for acute cellular rejection prevents further rejection, but this possibility is suggested by our data. Imprecision is a particular problem with estimating the harms of the interventions.
Reporting of potential harms of treatment was very limited and inconsistently expressed, so the potential of meta‐analysis to increase both power and precision through combining study results to expose significant differences in harmful effects occurring at low frequency in individual studies was not realised. More than half the studies did not report treatment side effects, or other adverse events such as infection or malignancy. It should be recognised that absence of evidence does not equate to evidence of absence of effect, and we recognise that at present, with such scant study data, these outcomes may be better informed by available registry data. The value of increasing available evidence of potential harms associated with interventions (compared with potential benefits alone) has been widely recognised and is also not a problem peculiar to this review, but is common to many RCTs (Cuervo 2003; Tunis 2003)
Agreements and disagreements with other studies or reviews
There have been no other systematic reviews of RCTs of antibody therapy in treating acute cellular rejection in kidney recipients, although systematic reviews of antibodies used as induction immunosuppressive therapy, at the time of transplantation, with the aim of rejection prophylaxis have been undertaken (Szczech 1997; Szczech 1998; Webster 2004).
A previous systematic review of the treatment of acute humoral rejection included data from five RCTs and seven non‐RCTs. This review reported benefit from rituximab or bortezomib in the treatment of acute humoral rejection in four small non‐RCTs (10 to 26 patients). (Roberts 2012). However, in this review of RCTs there was no evidence of benefit from treatment with rituximab in treating acute humoral rejection. There been no other systematic reviews to date of RCTs of antibody therapy in treating acute humoral rejection

Study flow diagram.
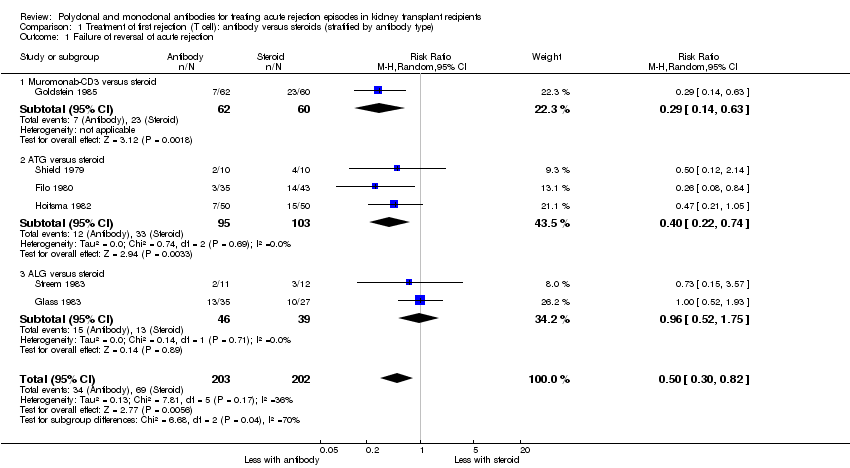
Comparison 1 Treatment of first rejection (T cell): antibody versus steroids (stratified by antibody type), Outcome 1 Failure of reversal of acute rejection.

Comparison 1 Treatment of first rejection (T cell): antibody versus steroids (stratified by antibody type), Outcome 2 Additional treatment needed.

Comparison 1 Treatment of first rejection (T cell): antibody versus steroids (stratified by antibody type), Outcome 3 Recurrent rejection up to 12 months post‐therapy.

Comparison 1 Treatment of first rejection (T cell): antibody versus steroids (stratified by antibody type), Outcome 4 Graft loss or death with a functioning graft within 12 months.
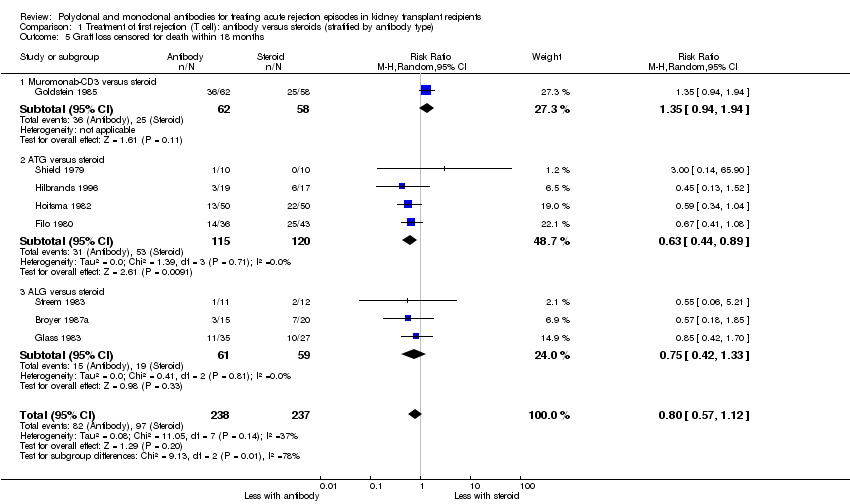
Comparison 1 Treatment of first rejection (T cell): antibody versus steroids (stratified by antibody type), Outcome 5 Graft loss censored for death within 18 months.

Comparison 1 Treatment of first rejection (T cell): antibody versus steroids (stratified by antibody type), Outcome 6 Death within 12 months.

Comparison 1 Treatment of first rejection (T cell): antibody versus steroids (stratified by antibody type), Outcome 7 Treatment adverse events.

Comparison 1 Treatment of first rejection (T cell): antibody versus steroids (stratified by antibody type), Outcome 8 Serum creatinine post treatment (3 months).

Comparison 2 Treatment of first rejection (T cell): antibody + steroids versus steroids alone, Outcome 1 Failure of reversal of acute rejection (AR) episode.

Comparison 2 Treatment of first rejection (T cell): antibody + steroids versus steroids alone, Outcome 2 Recurrent rejection within 3 months post‐therapy.

Comparison 2 Treatment of first rejection (T cell): antibody + steroids versus steroids alone, Outcome 3 Graft loss or death with a functioning graft within 12 months.

Comparison 2 Treatment of first rejection (T cell): antibody + steroids versus steroids alone, Outcome 4 Graft loss censored for death within 12 months.

Comparison 2 Treatment of first rejection (T cell): antibody + steroids versus steroids alone, Outcome 5 Death within 12 months.

Comparison 3 Treatment of first rejection (T cell): muromonab‐CD3 versus other antibody (stratified by comparator), Outcome 1 Failure of acute rejection reversal.

Comparison 3 Treatment of first rejection (T cell): muromonab‐CD3 versus other antibody (stratified by comparator), Outcome 2 Additional treatment needed.
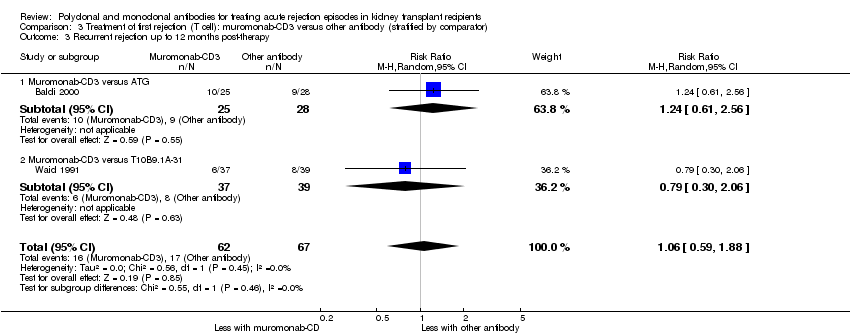
Comparison 3 Treatment of first rejection (T cell): muromonab‐CD3 versus other antibody (stratified by comparator), Outcome 3 Recurrent rejection up to 12 months post‐therapy.

Comparison 3 Treatment of first rejection (T cell): muromonab‐CD3 versus other antibody (stratified by comparator), Outcome 4 Treatment adverse events.
Comparison 4 Treatment of first rejection (B cell): rituximab + steroids versus steroids alone, Outcome 1 Failure of reversal of acute rejection.
Comparison 4 Treatment of first rejection (B cell): rituximab + steroids versus steroids alone, Outcome 2 Additional treatment required.

Comparison 4 Treatment of first rejection (B cell): rituximab + steroids versus steroids alone, Outcome 3 Graft loss or death with a functioning graft within 12 months.

Comparison 4 Treatment of first rejection (B cell): rituximab + steroids versus steroids alone, Outcome 4 Death within 12 months.

Comparison 4 Treatment of first rejection (B cell): rituximab + steroids versus steroids alone, Outcome 5 Treatment adverse events.

Comparison 5 Treatment of steroid‐resistant rejection: antibody versus other antibody (stratified by antibody type), Outcome 1 Failure of acute rejection reversal.

Comparison 5 Treatment of steroid‐resistant rejection: antibody versus other antibody (stratified by antibody type), Outcome 2 Additional treatment required.
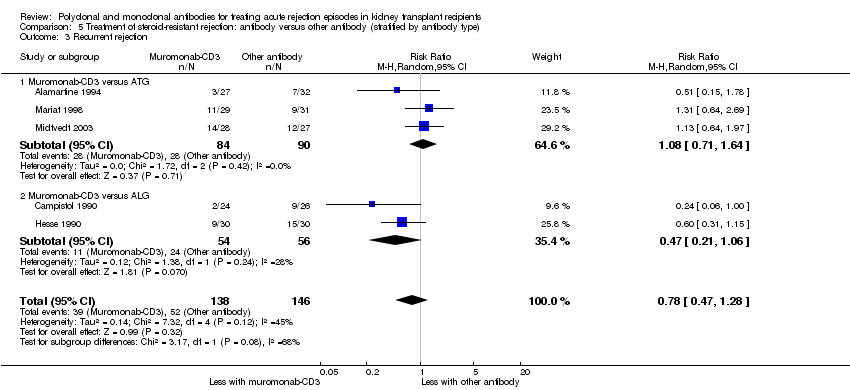
Comparison 5 Treatment of steroid‐resistant rejection: antibody versus other antibody (stratified by antibody type), Outcome 3 Recurrent rejection.
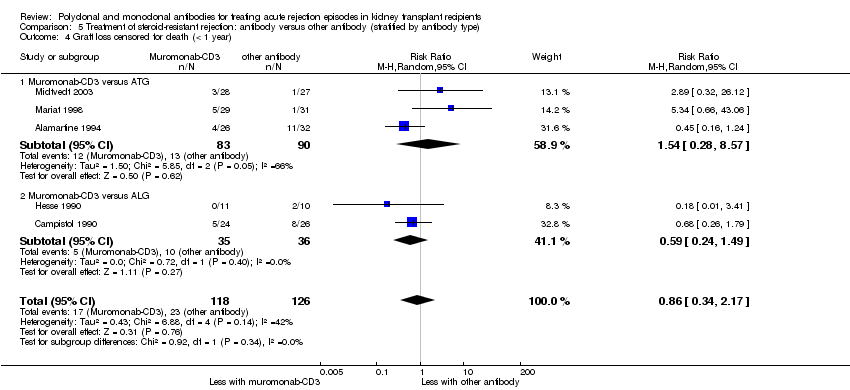
Comparison 5 Treatment of steroid‐resistant rejection: antibody versus other antibody (stratified by antibody type), Outcome 4 Graft loss censored for death (< 1 year).
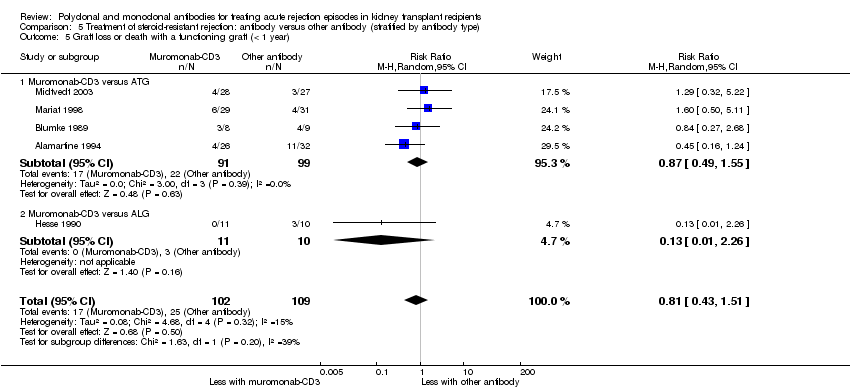
Comparison 5 Treatment of steroid‐resistant rejection: antibody versus other antibody (stratified by antibody type), Outcome 5 Graft loss or death with a functioning graft (< 1 year).
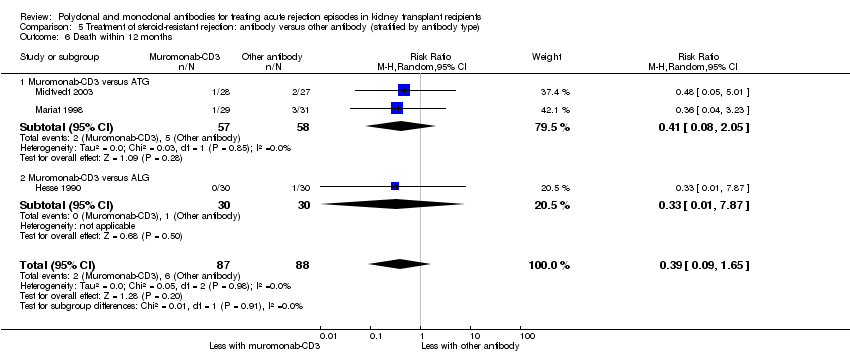
Comparison 5 Treatment of steroid‐resistant rejection: antibody versus other antibody (stratified by antibody type), Outcome 6 Death within 12 months.

Comparison 5 Treatment of steroid‐resistant rejection: antibody versus other antibody (stratified by antibody type), Outcome 7 Treatment adverse events.
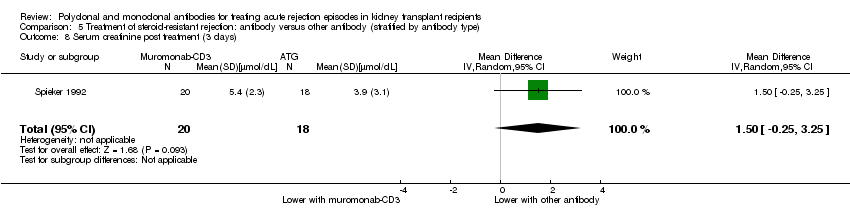
Comparison 5 Treatment of steroid‐resistant rejection: antibody versus other antibody (stratified by antibody type), Outcome 8 Serum creatinine post treatment (3 days).
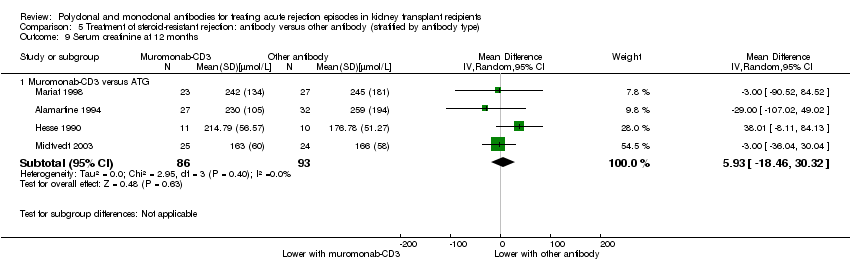
Comparison 5 Treatment of steroid‐resistant rejection: antibody versus other antibody (stratified by antibody type), Outcome 9 Serum creatinine at 12 months.
| Antibody (T cell) versus steroid (stratified by antibody type) for the treatment of first rejection episodes in kidney transplant recipients | |||||
| Patient or population: kidney transplant recipients: first rejection episode | |||||
| Outcomes | Anticipated absolute effects* (95% CI) | Relative effect | No. of participants | Quality of the evidence | |
| Risk with steroid (stratified by antibody type) | Risk with antibody (T cell) | ||||
| Failure of reversal of acute rejection | Study population | RR 0.50 | 405 (6) | ⊕⊕⊕⊝ | |
| 342 per 1,000 | 171 per 1,000 | ||||
| Recurrent rejection | Study population | RR 0.75 | 508 (9) | ⊕⊕⊕⊝ | |
| 566 per 1,000 | 425 per 1,000 | ||||
| Graft loss or death with a functioning graft | Study population | RR 0.84 | 490 (8) | ⊕⊕⊝⊝ | |
| 459 per 1,000 | 385 per 1,000 | ||||
| Graft loss censored for death | Study population | RR 0.80 | 475 (8) | ⊕⊕⊝⊝ | |
| 409 per 1,000 | 327 per 1,000 | ||||
| Death | Study population | RR 0.98 | 413 (7) | ⊕⊝⊝⊝ | |
| 83 per 1,000 | 81 per 1,000 | ||||
| Treatment adverse events: fever, chill, or malaise after drug administration | Study population | RR 23.88 | 280 (4) | ⊕⊝⊝⊝ | |
| 0 per 1,000 | 0 per 1,000 | ||||
| *The risk in the intervention group (and its 95% CI) is based on the assumed risk in the comparison group and the relative effect of the intervention (and its 95% CI). | |||||
| GRADE Working Group grades of evidence | |||||
| 1 Unclear/high risk in multiple studies for allocation concealment and selective reporting 2 CI includes null effect and potential for some harm and benefit 3 CI includes null effect and appreciable harm and benefit 4 High I2 (81%) and great variation in size of effect across all different treatment adverse effects | |||||
| Antibody (T cell) + steroid versus steroid alone for the treatment of first rejection episodes in kidney transplant recipients | |||||
| Patient or population: treatment of first rejection episodes in kidney transplant recipients: first rejection episode | |||||
| Outcomes | Anticipated absolute effects* (95% CI) | Relative effect | No. of participants | Quality of the evidence | |
| Risk with steroid alone | Risk with antibody (T cell) + steroid | ||||
| Failure of reversal of acute rejection episode | Study population | RR 0.42 | 30 (1) | ⊕⊕⊝⊝ | |
| 688 per 1,000 | 289 per 1,000 | ||||
| Recurrent rejection | Study population | RR 0.07 | 30 (1) | ⊕⊕⊝⊝ | |
| 500 per 1,000 | 35 per 1,000 | ||||
| Graft loss or death with a functioning graft | Study population | RR 0.35 | 52 (2) | ⊕⊝⊝⊝ | |
| 346 per 1,000 | 121 per 1,000 | ||||
| Graft loss censored for death | Study population | RR 0.33 | 50 (2) | ⊕⊝⊝⊝ | |
| 385 per 1,000 | 127 per 1,000 | ||||
| Death | Study population | RR 0.86 | 50 (2) | ⊕⊕⊝⊝ | |
| 462 per 1,000 | 397 per 1,000 | ||||
| *The risk in the intervention group (and its 95% CI) is based on the assumed risk in the comparison group and the relative effect of the intervention (and its 95% CI). | |||||
| GRADE Working Group grades of evidence | |||||
| 1 Small sample size and few number of events 2 Width of CI is very wide. CI includes null effect and is strongly one‐sided. 3 Unclear risk for random sequence generation and allocation concealment, and high risk for selective reporting 4 Big variation in size of effect with small overlap of CI and high I2 value 5 Width of CI is very wide. CI includes both null effect and appreciable benefit and harm 6 CI includes both null effect and appreciable benefit and harm | |||||
| Muromonab‐CD3 (T cell) versus other antibody (stratified by comparator) for the treatment of first rejection episodes in kidney transplant recipients | |||||
| Patient or population: kidney transplant recipients: first rejection episode | |||||
| Outcomes | Anticipated absolute effects* (95% CI) | Relative effect | No. of participants | Quality of the evidence | |
| Risk with other antibody (stratified by comparator) | Risk with muromonab‐CD3 (T cell) | ||||
| Failure of acute rejection reversal | Study population | RR 1.84 | 132 (2) | ⊕⊕⊕⊝ | |
| 134 per 1,000 | 247 per 1,000 | ||||
| Recurrent rejection | Study population | RR 1.06 | 129 (2) | ⊕⊕⊕⊝ | |
| 254 per 1,000 | 269 per 1,000 | ||||
| Treatment adverse events: fever, chills, malaise after drug administration | Study population | RR 3.12 | 132 (2) | ⊕⊕⊝⊝ | |
| 269 per 1,000 | 838 per 1,000 | ||||
| Treatment adverse events: neurological side effects | Study population | RR 13.10 (1.43 to 120.05) | 132 (2) | ⊕⊕⊝⊝ | |
| 15 per 1,000 | 196 per 1,000 (21 to 1,000) | ||||
| *The risk in the intervention group (and its 95% CI) is based on the assumed risk in the comparison group and the relative effect of the intervention (and its 95% CI). | |||||
| GRADE Working Group grades of evidence | |||||
| 1 Small sample size and few number of events 2 CI includes null effect and potential for some harm and benefit 3 High I2 value and wide variation in size of effect | |||||
| Rituximab (B cell) + steroid versus steroid alone for the treatment of first rejection episodes in kidney transplant recipients | |||||
| Patient or population: kidney transplant recipients: first rejection episode | |||||
| Outcomes | Anticipated absolute effects* (95% CI) | Relative effect | No. of participants | Quality of the evidence | |
| Risk with steroid alone | Risk with rituximab (B cell) + steroid | ||||
| Failure of reversal of acute rejection | Study population | RR 0.94 | 53 (2) | ⊕⊕⊕⊝ | |
| 500 per 1,000 | 470 per 1,000 | ||||
| Graft loss or death with a functioning graft | Study population | RR 1.00 | 58 (2) | ⊕⊕⊕⊝ | |
| 103 per 1,000 | 103 per 1,000 | ||||
| Death | Study population | not estimable | 58 (2) | ⊕⊕⊕⊕ | |
| 0 per 1,000 | 0 per 1,000 | ||||
| Treatment adverse events: UTI/pyelonephritis | Study population | RR 5.73 | 38 (1) | ⊕⊕⊕⊝ | |
| 111 per 1,000 | 637 per 1,000 | ||||
| *The risk in the intervention group (and its 95% CI) is based on the assumed risk in the comparison group and the relative effect of the intervention (and its 95% CI). | |||||
| GRADE Working Group grades of evidence | |||||
| 1 Small sample size and few number of events 2 CI includes both null effect and appreciable benefit and harm | |||||
| Antibody versus other antibody (stratified by antibody type) for the treatment of steroid‐resistant rejection episodes in kidney transplant recipients | |||||
| Patient or population: kidney transplant recipients: steroid‐resistant rejection episodes | |||||
| Outcomes | Anticipated absolute effects* (95% CI) | Relative effect | No. of participants | Quality of the evidence | |
| Risk with other antibody (stratified by antibody type) | Risk with antibody | ||||
| Failure of acute rejection reversal | Study population | RR 1.07 | 244 (5) | ⊕⊕⊝⊝ | |
| 206 per 1,000 | 221 per 1,000 | ||||
| Recurrent rejection | Study population | RR 0.78 | 284 (5) | ⊕⊕⊝⊝ | |
| 356 per 1,000 | 278 per 1,000 | ||||
| Graft loss censored for death | Study population | RR 0.86 | 244 (5) | ⊕⊕⊝⊝ | |
| 183 per 1,000 | 157 per 1,000 | ||||
| Graft loss or death with a functioning graft | Study population | RR 0.81 | 211 (5) | ⊕⊕⊝⊝ | |
| 229 per 1,000 | 186 per 1,000 | ||||
| Death | Study population | RR 0.39 | 175 (3) | ⊕⊕⊝⊝ | |
| 68 per 1,000 | 27 per 1,000 | ||||
| Treatment adverse events: fever, chills, malaise after drug administration | Study population | ⊕⊕⊝⊝ | |||
| 342 per 1,000 | 870 per 1,000 (62 to 1,000) | RR 2.54 (0.18 to 34.92) | 140 (3) | ||
| Treatment adverse events: bacterial infection | Study population | RR 8.64 | 109 (2) | ⊕⊝⊝⊝ | |
| 17 per 1,000 | 149 per 1,000 | ||||
| *The risk in the intervention group (and its 95% CI) is based on the assumed risk in the comparison group and the relative effect of the intervention (and its 95% CI). | |||||
| GRADE Working Group grades of evidence | |||||
| 1 CI includes both null effect and appreciable benefit and harm 2 Unclear risk for random sequence generation and allocation across all studies 3 Small sample size and few number of events 4 High I2 value and wide variation in size of effect | |||||
| Study ID | Days since transplant | Timing of randomisation | Criteria for rejection* | Criteria for rejection reversal* |
| Antibody versus steroid | ||||
| < 35 | Rejection | Scoring algorithm of biochemical, and physical signs, with confirmatory “biopsy where possible” | Day 2 of “persistent creatinine fall” | |
| < 90 | Rejection | “Clinical signs, imaging and renal function tests” | Increase in creatinine within 24 to 48 hours of bolus MP | |
| < 90 | Rejection | Increased creatinine, oliguria, sodium retention, weight gain, proteinuria, graft tenderness | Day 2 of 3 consecutive days of creatinine falling | |
| ns | Transplantation | Clinical criteria including creatinine rise for 3 sequential days | Improvement in creatinine and clinical signs at 7th day of treatment | |
| ns | Transplantation | Rise in creatinine and diminished function on I‐131 scan, with “supportive clinical findings” with confirmatory “biopsy where possible” | Day 2 of “persistent creatinine fall” | |
| 6‐90 | Rejection | Scoring algorithm of biochemical, and physical signs, with confirmatory “biopsy where possible” | 3 day progressive fall in creatinine, or investigator judged clinical reversal. | |
| > 8 | Rejection | “Rise in plasma creatinine” and “changes in kidney echogenicity” on ultrasound. If unsure, “rejection was confirmed by kidney biopsy” | ns | |
| < 90 | Rejection | ns | ns | |
| ns | Rejection | Clinical ± biopsy confirmation | Not assessed. Severity of rejection episode judged by AUC of serial 10 day creatinine measurements. | |
| Antibody and steroid versus steroid alone | ||||
| ns | Rejection | “Common clinical criteria”, with biopsy where possible | Day 2 of progressive rise in creatinine clearance | |
| ns | Rejection | ns | ns | |
| Antibody versus other antibody | ||||
| ns | Transplantation | Primarily by laboratory signs of increase in SCr ≥ 0.3 mg/dL on any given day, or “clinical signs associated with rejection” and “an increase in kidney size on ultrasound” | ns | |
| ns | Rejection | 4 of 7 clinical and biochemical signs, subsequently confirmed by biopsy | Absence of cross‐over, re‐treatment or graft loss | |
| ns | Rejection | 20% increase in creatinine with clinical suggestive signs, and biopsy if > 10 days from transplantation | ns | |
| Formulation comparisons | ||||
| ns | Rejection | Standard clinical indicators with supplementary “biopsy where possible” | 1st of 3 consecutive days of creatinine falling | |
| Antibody versus other treatment | ||||
| ns | Rejection | Rise in creatinine of 0.3 mg/dL and deterioration of renogram, “mostly confirmed by biopsy” | ns | |
| > 90 | 90 days post‐transplant | ns | ns | |
| * direct quotation from the text of study reports appears in quotation marks AUC ‐ area under the curve; ns ‐ not stated and could not be clarified or deduced; MP ‐ methylprednisolone; SCr ‐ serum creatinine | ||||
| Study ID | Days since transplant* | Timing of randomisation* | Criteria for rejection* | Criteria for rejection reversal* |
| Antibody versus placebo | ||||
| ns | Rejection | “Biopsy proven” and Banff graded | “Recovery of graft function to within 20% of the baseline pre‐rejection value 1, 3, 6, and 12 months after the episode”, and “Resolution of the Banff biopsy grade” | |
| ns | Rejection | “Biopsy proven” | “Improvement of renal function at day 12” | |
| * direct quotation from the text of study reports appears in quotation marks MP ‐ methylprednisolone; ns ‐ not stated and could not be clarified or deduced | ||||
| Study ID | Days since transplant* | Timing of randomisation* | Criteria for rejection* | Initial treatment of rejection* | Criteria for resistant rejection* |
| Antibody versus other antibody | |||||
| ns | “Steroid resistant rejection crisis” | ns | 3 bolus injections of cortisone | “Not sufficiently treated” with steroids | |
| ns | ns | Confirmed by renal biopsy | MP 1g for 3 days | ns | |
| < 42 | ns | Rise in creatinine of > 0.3 mg/dL and biopsy | MP 500 mg for 2 days | “Non response” | |
| “early” | ns | “Typical clinical symptoms”, renogram, and biopsy | MP 500‐1000 mg for 3 days | Lack of improvement in clinical and sonographic appearances | |
| ns | At biopsy | Biopsy with “histological diagnosis” | MP 15 mg/kg, 2 bolus doses | “Absence of a clear response to the steroids” | |
| ns | At biopsy | Delayed graft function or rise in creatinine in presence of urine output < 1 L/d, low sodium excretion, weight gain > 1 kg/d or graft tenderness | MP 15 mg/kg, 2 doses alternate days | No decline in creatinine after 2 steroid boluses, followed by biopsy | |
| ns | Day 5 of treatment | Rise in creatinine > 20% in the absence of obvious cause and biopsy (Banff criteria) | MP 500 mg then 250 mg for 3 days | No decline in creatinine | |
| Different formulations of antibody | |||||
| ns | At biopsy | Biopsy, Banff graded | MP 500 mg, for 3 days | Creatinine increase of 10% after 3 days of MP | |
| Different doses of same antibody | |||||
| < 90 | Day 5 of treatment | Rise in creatinine > 20% in absence of obvious cause | MP boluses, cumulative dose 1‐1.5 g | No decline in creatinine after 5 days of treatment | |
| Different duration of same antibody | |||||
| ns | At biopsy | “Diagnosed clinically and verified with a core needle biopsy” | MP 250‐500 mg, for 4 days | Not responding with improved kidney function on 5th day of steroid treatment | |
| Antibody versus other treatment | |||||
| < 365 | Day 4 of treatment | Accelerated rejection: “progressive rise in SCr level was observed within 7 days of transplant”. Acute rejection: “rise in SCr of 0.5 mg/dl or higher” was seen anytime during post‐transplant course. Acute on chronic rejection: “a similar rise in SCr occurred in a patient with sustained creatinine level of ≥2.5mg/dl due to a documented previous acute rejection episode” | MP 500‐1000 mg, for 3 days | “Serum creatinine did not revert to the basal level within a week from the onset” | |
| ns | At biopsy | Clinical suspicion and biopsy | MP 500 mg for 3 days | “Failure to show improved renal function” within 7 days of starting MP | |
| * direct quotation from the text of study reports appears in quotation marks MP ‐ methylprednisolone; ns ‐ not stated and could not be clarified or deduced | |||||
| Outcomes | Comparisons Relative effect (95% CI) | ||
| rabbit‐ATG versus horse‐ATG (1 study, 159 participants) | ATG versus ALG (1 study, 50 participants) | ALG versus IVIg (1 study, 45 participants) | |
| Failure of reversal of acute rejection | RR 0.88 (0.41 to 1.87) | RR 0.95 (0.28 to 3.27) | RR 2.40 (0.27 to 21.35) |
| Recurrent rejection post‐therapy | RR 1.24 (0.77 to 1.99) | RR: 0.95 (0.48 to 1.87) | RR 0.62 (0.28 to 1.38) |
| Graft loss or death with a functioning graft (≤ 12 months) | RR 0.73 (0.37 to 1.44) | RR 1.09 (0.60 to 1.99) | RR 1.00 (0.49 to 2.05) |
| Graft loss censored for death (≤ 12 months) | Not reported | RR 0.89 (0.41 to 1.93) | RR 0.93 (0.37 to 2.34) |
| Death (≤ 12 months) | Not reported | RR 2.00 (0.40 to 9.95) | RR 1.20 (0.22 to 6.50) |
| Malignancy (total) | Not reported | Not reported | RR 2.42 (0.10 to 56.46) |
| Treatment side effects: fevers, chills, malaise following administration | RR 0.38 (0.27 to 0.54) | RR 0.75 (0.19 to 3.01) | Not reported |
| Treatment side effects: thrombocytopenia | Not reported | RR 1.00 (0.07 to 15.12) | Not reported |
| ALG ‐ antilymphocyte globulin; ATG ‐ antithymocyte globulin; CI ‐ confidence interval; IVIg ‐ intravenous immunoglobulin; RR ‐ risk ratio | |||
| Outcome | Comparisons Relative effect (95% CI) | ||||
| rabbit‐ATG versus horse‐ATG (1 study, 163 participants) | ATG 3 days versus ALG 10 days (1 study, 30 participants) | Muromonab‐CD3half dose versus standard dose (1 study, 45 participants) | Muromonab‐CD3versus IVIg (1 study, 30 participants) | Muromonab‐CD3versus DSP (1 study, 25 participants) | |
| Failure of reversal of acute rejection | RR 0.52 (0.26 to 1.05) | RR 0.88 (0.43 to 1.80) | RR 1.50 (0.29 to 7.73) | RR 0.50 (0.11 to 2.33) | RR 0.92 (0.35, 2.41) |
| Further treatment required | Not reported | RR 9.60 (0.56 to 163.58) | Not reported | Not reported | Not reported |
| Recurrent rejection post‐therapy | RR 0.32 (0.15 to 0.66) | Not reported | RR 0.50 (0.05 to 4.94) | RR 1.65 (0.80 to 3.41) | RR 1.48 (0.67 to 3.27) |
| Graft loss or death with a functioning graft (≤ 12 months) | RR 0.68 (0.37 to 1.26) | RR 0.86 (0.38 to 1.95) | RR 2.00 (0.43 to 9.32) | RR 1.00 (0.24 to 4.18) | Not reported |
| Graft loss censored for death (≤ 12 months) | RR 0.46 (0.21 to 1.00) | Not reported | RR 1.00 (0.16 to 6.20) | RR 2.00 (0.20 to 19.78) | Not reported |
| Death (≤ 12‐24 months) | RR 1.98 (0.51 to 7.63) | Not reported | RR 5.00 (0.26 to 96.13) | RR 0.50 (0.05 to 4.94) | Not reported |
| Treatment side effects: fevers, chills, malaise following administration | Not reported | Not reported | Not reported | RR 31.00 (2.02 to 475.12) | RR 5.54 (1.55 to 19.82) |
| Treatment side effects: leukopenia | RR 1.93 (1.32 to 2.84) | Not reported | Not reported | Not reported | RR 0.10 (0.02 to 0.69) |
| Treatment side effects: anorexia | Not reported | Not reported | Not reported | Not reported | RR 0.92 (0.15 to 5.56) |
| Treatment failure | RR 0.51 (0.25 to 1.04) | Not reported | Not reported | Not reported | Not reported |
| Infection (total) | RR 0.99 (0.73 to 1.34) | Not reported | Not reported | Not reported | Not reported |
| Infection (bacterial) | RR 0.79 (0.51 to 1.23) | Not reported | RR 3.00 (0.13 to 68.26) | Not reported | Not reported |
| Infection (viral) | RR 1.87 (0.88 to 3.94) | Not reported | Not reported | Not reported | Not reported |
| Infection (fungal) | RR 0.99 (0.36 to 2.69) | Not reported | Not reported | Not reported | Not reported |
| CMV infection (total) | RR 1.01 (0.86 to 1.18) | Not reported | RR 1.00 (0.51 to 1.95) | Not reported | Not reported |
| Malignancy (total) | RR 0.99 (0.21 to 4.75) | Not reported | Not reported | Not reported | Not reported |
| PTLD/Lymphoma | RR 1.48 (0.25 to 8.64) | Not reported | Not reported | Not reported | Not reported |
| SCr | Not reported | Not reported | MD ‐10.00 (‐60.15 to 40.15) (18 months after treatment) | MD 0.47 (‐0.07 to 1.01) (3 months after treatment) | MD 62.00 (‐107.08 to 231.08) (1 month after treatment) |
| ALG ‐ antilymphocyte globulin; ATG ‐ antithymocyte globulin; CI ‐ confidence interval; CMV ‐ cytomegalovirus; DSP ‐ 15‐deoxyspergualin; IVIg ‐ intravenous immunoglobulin; MD ‐ mean difference; PTLD ‐ post‐transplant lymphoproliferative disease; RR ‐ risk ratio; SCr ‐ serum creatinine | |||||
| Outcome or subgroup title | No. of studies | No. of participants | Statistical method | Effect size |
| 1 Failure of reversal of acute rejection Show forest plot | 6 | 405 | Risk Ratio (M‐H, Random, 95% CI) | 0.50 [0.30, 0.82] |
| 1.1 Muromonab‐CD3 versus steroid | 1 | 122 | Risk Ratio (M‐H, Random, 95% CI) | 0.29 [0.14, 0.63] |
| 1.2 ATG versus steroid | 3 | 198 | Risk Ratio (M‐H, Random, 95% CI) | 0.40 [0.22, 0.74] |
| 1.3 ALG versus steroid | 2 | 85 | Risk Ratio (M‐H, Random, 95% CI) | 0.96 [0.52, 1.75] |
| 2 Additional treatment needed Show forest plot | 4 | 178 | Risk Ratio (M‐H, Random, 95% CI) | 0.74 [0.48, 1.15] |
| 2.1 ATG versus steroid | 2 | 120 | Risk Ratio (M‐H, Random, 95% CI) | 0.80 [0.49, 1.30] |
| 2.2 ALG versus steroid | 2 | 58 | Risk Ratio (M‐H, Random, 95% CI) | 0.50 [0.17, 1.49] |
| 3 Recurrent rejection up to 12 months post‐therapy Show forest plot | 9 | 508 | Risk Ratio (M‐H, Random, 95% CI) | 0.75 [0.56, 1.00] |
| 3.1 Muromonab‐CD3 versus steroid | 1 | 103 | Risk Ratio (M‐H, Random, 95% CI) | 0.89 [0.69, 1.15] |
| 3.2 ATG versus steroid | 5 | 285 | Risk Ratio (M‐H, Random, 95% CI) | 0.55 [0.29, 1.05] |
| 3.3 ALG versus steroid | 3 | 120 | Risk Ratio (M‐H, Random, 95% CI) | 0.87 [0.60, 1.28] |
| 4 Graft loss or death with a functioning graft within 12 months Show forest plot | 8 | 490 | Risk Ratio (M‐H, Random, 95% CI) | 0.84 [0.58, 1.22] |
| 4.1 Muromonab‐CD3 versus steroid | 1 | 120 | Risk Ratio (M‐H, Random, 95% CI) | 1.36 [1.02, 1.81] |
| 4.2 ATG versus steroid | 5 | 285 | Risk Ratio (M‐H, Random, 95% CI) | 0.65 [0.48, 0.89] |
| 4.3 ALG versus steroid | 2 | 85 | Risk Ratio (M‐H, Random, 95% CI) | 0.90 [0.53, 1.50] |
| 5 Graft loss censored for death within 18 months Show forest plot | 8 | 475 | Risk Ratio (M‐H, Random, 95% CI) | 0.80 [0.57, 1.12] |
| 5.1 Muromonab‐CD3 versus steroid | 1 | 120 | Risk Ratio (M‐H, Random, 95% CI) | 1.35 [0.94, 1.94] |
| 5.2 ATG versus steroid | 4 | 235 | Risk Ratio (M‐H, Random, 95% CI) | 0.63 [0.44, 0.89] |
| 5.3 ALG versus steroid | 3 | 120 | Risk Ratio (M‐H, Random, 95% CI) | 0.75 [0.42, 1.33] |
| 6 Death within 12 months Show forest plot | 7 | 413 | Risk Ratio (M‐H, Random, 95% CI) | 0.98 [0.51, 1.88] |
| 6.1 Muromonab‐CD3 versus steroid | 1 | 120 | Risk Ratio (M‐H, Random, 95% CI) | 1.40 [0.53, 3.70] |
| 6.2 ATG versus steroid | 3 | 173 | Risk Ratio (M‐H, Random, 95% CI) | 0.49 [0.14, 1.74] |
| 6.3 ALG versus steroid | 3 | 120 | Risk Ratio (M‐H, Random, 95% CI) | 1.05 [0.31, 3.60] |
| 7 Treatment adverse events Show forest plot | 5 | Risk Ratio (M‐H, Random, 95% CI) | Subtotals only | |
| 7.1 Fever, chill, malaise after drug administration | 4 | 280 | Risk Ratio (M‐H, Random, 95% CI) | 23.88 [5.10, 111.86] |
| 7.2 Infection (total) | 5 | 241 | Risk Ratio (M‐H, Random, 95% CI) | 0.83 [0.57, 1.20] |
| 7.3 CMV infection | 4 | 118 | Risk Ratio (M‐H, Random, 95% CI) | 0.92 [0.37, 2.26] |
| 7.4 Avascular necrosis | 3 | 143 | Risk Ratio (M‐H, Random, 95% CI) | 0.51 [0.11, 2.35] |
| 8 Serum creatinine post treatment (3 months) Show forest plot | 1 | 95 | Mean Difference (IV, Random, 95% CI) | ‐14.0 [‐37.53, 9.53] |
| Outcome or subgroup title | No. of studies | No. of participants | Statistical method | Effect size |
| 1 Failure of reversal of acute rejection (AR) episode Show forest plot | 1 | Risk Ratio (M‐H, Random, 95% CI) | Totals not selected | |
| 1.1 ALG + steroids versus steroids alone | 1 | Risk Ratio (M‐H, Random, 95% CI) | 0.0 [0.0, 0.0] | |
| 2 Recurrent rejection within 3 months post‐therapy Show forest plot | 1 | Risk Ratio (M‐H, Random, 95% CI) | Totals not selected | |
| 2.1 ALG + steroids versus steroids alone | 1 | Risk Ratio (M‐H, Random, 95% CI) | 0.0 [0.0, 0.0] | |
| 3 Graft loss or death with a functioning graft within 12 months Show forest plot | 2 | 52 | Risk Ratio (M‐H, Random, 95% CI) | 0.35 [0.02, 5.14] |
| 3.1 ALG + steroids versus steroids alone | 1 | 32 | Risk Ratio (M‐H, Random, 95% CI) | 1.0 [0.24, 4.23] |
| 3.2 ATG + steroids versus steroids alone | 1 | 20 | Risk Ratio (M‐H, Random, 95% CI) | 0.08 [0.00, 1.21] |
| 4 Graft loss censored for death within 12 months Show forest plot | 2 | 50 | Risk Ratio (M‐H, Random, 95% CI) | 0.33 [0.03, 4.16] |
| 4.1 ALG + steroids versus steroids alone | 1 | 30 | Risk Ratio (M‐H, Random, 95% CI) | 0.86 [0.23, 3.19] |
| 4.2 ATG + steroids versus steroids alone | 1 | 20 | Risk Ratio (M‐H, Random, 95% CI) | 0.08 [0.00, 1.21] |
| 5 Death within 12 months Show forest plot | 2 | 50 | Risk Ratio (M‐H, Random, 95% CI) | 0.86 [0.53, 1.39] |
| 5.1 ALG + steroids versus steroids alone | 1 | 30 | Risk Ratio (M‐H, Random, 95% CI) | 0.86 [0.53, 1.39] |
| 5.2 ATG + steroids versus steroids alone | 1 | 20 | Risk Ratio (M‐H, Random, 95% CI) | 0.0 [0.0, 0.0] |
| Outcome or subgroup title | No. of studies | No. of participants | Statistical method | Effect size |
| 1 Failure of acute rejection reversal Show forest plot | 2 | 132 | Risk Ratio (M‐H, Random, 95% CI) | 1.84 [0.92, 3.67] |
| 1.1 Muromonab‐CD3 versus ATG | 1 | 56 | Risk Ratio (M‐H, Random, 95% CI) | 2.0 [0.95, 4.20] |
| 1.2 Muromonab‐CD3 versus T10B9.1A‐31 | 1 | 76 | Risk Ratio (M‐H, Random, 95% CI) | 1.05 [0.16, 7.10] |
| 2 Additional treatment needed Show forest plot | 2 | 132 | Risk Ratio (M‐H, Random, 95% CI) | 1.67 [0.77, 3.63] |
| 2.1 Muromonab‐CD3 versus ATG | 1 | 56 | Risk Ratio (M‐H, Random, 95% CI) | 1.83 [0.79, 4.27] |
| 2.2 Muromonab‐CD3 versus T10B9.1A‐31 | 1 | 76 | Risk Ratio (M‐H, Random, 95% CI) | 1.05 [0.16, 7.10] |
| 3 Recurrent rejection up to 12 months post‐therapy Show forest plot | 2 | 129 | Risk Ratio (M‐H, Random, 95% CI) | 1.06 [0.59, 1.88] |
| 3.1 Muromonab‐CD3 versus ATG | 1 | 53 | Risk Ratio (M‐H, Random, 95% CI) | 1.24 [0.61, 2.56] |
| 3.2 Muromonab‐CD3 versus T10B9.1A‐31 | 1 | 76 | Risk Ratio (M‐H, Random, 95% CI) | 0.79 [0.30, 2.06] |
| 4 Treatment adverse events Show forest plot | 2 | Risk Ratio (M‐H, Random, 95% CI) | Subtotals only | |
| 4.1 Fever, chills, malaise after drug administration | 2 | 132 | Risk Ratio (M‐H, Random, 95% CI) | 3.12 [1.87, 5.21] |
| 4.2 Gastrointestinal side effects | 2 | 132 | Risk Ratio (M‐H, Random, 95% CI) | 8.23 [0.90, 75.11] |
| 4.3 Neurological side effects | 2 | 132 | Risk Ratio (M‐H, Random, 95% CI) | 13.10 [1.43, 120.05] |
| 4.4 Infection (total) | 2 | 86 | Risk Ratio (M‐H, Random, 95% CI) | 1.53 [0.69, 3.40] |
| 4.5 CMV infection (total) | 2 | 132 | Risk Ratio (M‐H, Random, 95% CI) | 2.25 [0.31, 16.08] |
| 4.6 Malignancy (total) | 2 | 132 | Risk Ratio (M‐H, Random, 95% CI) | 0.26 [0.03, 2.30] |
| Outcome or subgroup title | No. of studies | No. of participants | Statistical method | Effect size |
| 1 Failure of reversal of acute rejection Show forest plot | 2 | 53 | Risk Ratio (M‐H, Random, 95% CI) | 0.94 [0.54, 1.64] |
| 2 Additional treatment required Show forest plot | 1 | 20 | Risk Ratio (M‐H, Random, 95% CI) | 1.33 [0.40, 4.49] |
| 3 Graft loss or death with a functioning graft within 12 months Show forest plot | 2 | 58 | Risk Ratio (M‐H, Random, 95% CI) | 1.0 [0.23, 4.35] |
| 4 Death within 12 months Show forest plot | 2 | 58 | Risk Ratio (M‐H, Random, 95% CI) | 0.0 [0.0, 0.0] |
| 5 Treatment adverse events Show forest plot | 2 | Risk Ratio (M‐H, Random, 95% CI) | Subtotals only | |
| 5.1 Fever, chills, malaise after administration | 1 | 15 | Risk Ratio (M‐H, Random, 95% CI) | 4.91 [0.31, 76.58] |
| 5.2 CMV infection | 2 | 58 | Risk Ratio (M‐H, Random, 95% CI) | 0.93 [0.11, 8.04] |
| 5.3 UTI/pyelonephritis | 1 | 38 | Risk Ratio (M‐H, Random, 95% CI) | 5.73 [1.80, 18.21] |
| 5.4 Sepsis | 1 | 38 | Risk Ratio (M‐H, Random, 95% CI) | 11.67 [0.60, 225.17] |
| 5.5 BK virus infection | 1 | 38 | Risk Ratio (M‐H, Random, 95% CI) | 0.47 [0.02, 9.01] |
| 5.6 HSV infection | 1 | 38 | Risk Ratio (M‐H, Random, 95% CI) | 7.00 [0.31, 159.85] |
| 5.7 Nocardia infection | 1 | 38 | Risk Ratio (M‐H, Random, 95% CI) | 0.78 [0.03, 17.76] |
| 5.8 Gastrointestinal disorders | 1 | 38 | Risk Ratio (M‐H, Random, 95% CI) | 0.49 [0.06, 3.74] |
| 5.9 Blood and lymphatic system disorders | 1 | 38 | Risk Ratio (M‐H, Random, 95% CI) | 0.82 [0.10, 7.04] |
| 5.10 Neoplasm | 1 | 38 | Risk Ratio (M‐H, Random, 95% CI) | 0.78 [0.03, 17.76] |
| 5.11 Other/unspecified | 1 | 38 | Risk Ratio (M‐H, Random, 95% CI) | 0.21 [0.01, 3.54] |
| Outcome or subgroup title | No. of studies | No. of participants | Statistical method | Effect size |
| 1 Failure of acute rejection reversal Show forest plot | 5 | 244 | Risk Ratio (M‐H, Random, 95% CI) | 1.07 [0.63, 1.81] |
| 1.1 Muromonab‐CD3 versus ATG | 3 | 173 | Risk Ratio (M‐H, Random, 95% CI) | 1.00 [0.17, 5.76] |
| 1.2 Muromonab‐CD3 versus ALG | 2 | 71 | Risk Ratio (M‐H, Random, 95% CI) | 1.12 [0.78, 1.60] |
| 2 Additional treatment required Show forest plot | 1 | Risk Ratio (M‐H, Random, 95% CI) | Subtotals only | |
| 2.1 Muromonab‐CD3 versus ATG | 1 | 55 | Risk Ratio (M‐H, Random, 95% CI) | 1.16 [0.40, 3.35] |
| 3 Recurrent rejection Show forest plot | 5 | 284 | Risk Ratio (M‐H, Random, 95% CI) | 0.78 [0.47, 1.28] |
| 3.1 Muromonab‐CD3 versus ATG | 3 | 174 | Risk Ratio (M‐H, Random, 95% CI) | 1.08 [0.71, 1.64] |
| 3.2 Muromonab‐CD3 versus ALG | 2 | 110 | Risk Ratio (M‐H, Random, 95% CI) | 0.47 [0.21, 1.06] |
| 4 Graft loss censored for death (< 1 year) Show forest plot | 5 | 244 | Risk Ratio (M‐H, Random, 95% CI) | 0.86 [0.34, 2.17] |
| 4.1 Muromonab‐CD3 versus ATG | 3 | 173 | Risk Ratio (M‐H, Random, 95% CI) | 1.54 [0.28, 8.57] |
| 4.2 Muromonab‐CD3 versus ALG | 2 | 71 | Risk Ratio (M‐H, Random, 95% CI) | 0.59 [0.24, 1.49] |
| 5 Graft loss or death with a functioning graft (< 1 year) Show forest plot | 5 | 211 | Risk Ratio (M‐H, Random, 95% CI) | 0.81 [0.43, 1.51] |
| 5.1 Muromonab‐CD3 versus ATG | 4 | 190 | Risk Ratio (M‐H, Random, 95% CI) | 0.87 [0.49, 1.55] |
| 5.2 Muromonab‐CD3 versus ALG | 1 | 21 | Risk Ratio (M‐H, Random, 95% CI) | 0.13 [0.01, 2.26] |
| 6 Death within 12 months Show forest plot | 3 | 175 | Risk Ratio (M‐H, Random, 95% CI) | 0.39 [0.09, 1.65] |
| 6.1 Muromonab‐CD3 versus ATG | 2 | 115 | Risk Ratio (M‐H, Random, 95% CI) | 0.41 [0.08, 2.05] |
| 6.2 Muromonab‐CD3 versus ALG | 1 | 60 | Risk Ratio (M‐H, Random, 95% CI) | 0.33 [0.01, 7.87] |
| 7 Treatment adverse events Show forest plot | 5 | Risk Ratio (M‐H, Random, 95% CI) | Subtotals only | |
| 7.1 Fever, chills, malaise after administration | 3 | 140 | Risk Ratio (M‐H, Random, 95% CI) | 2.54 [0.18, 34.92] |
| 7.2 Infection (bacterial) | 2 | 109 | Risk Ratio (M‐H, Random, 95% CI) | 8.64 [1.64, 45.56] |
| 7.3 Infection (viral) | 1 | 59 | Risk Ratio (M‐H, Random, 95% CI) | 0.53 [0.29, 0.97] |
| 7.4 Infection (fungal) | 1 | 50 | Risk Ratio (M‐H, Random, 95% CI) | 7.56 [0.41, 139.17] |
| 7.5 CMV infection | 5 | 284 | Risk Ratio (M‐H, Random, 95% CI) | 0.93 [0.60, 1.43] |
| 7.6 Malignancy (total) | 2 | 115 | Risk Ratio (M‐H, Random, 95% CI) | 2.09 [0.28, 15.66] |
| 8 Serum creatinine post treatment (3 days) Show forest plot | 1 | 38 | Mean Difference (IV, Random, 95% CI) | 1.50 [‐0.25, 3.25] |
| 9 Serum creatinine at 12 months Show forest plot | 4 | Mean Difference (IV, Random, 95% CI) | Subtotals only | |
| 9.1 Muromonab‐CD3 versus ATG | 4 | 179 | Mean Difference (IV, Random, 95% CI) | 5.93 [‐18.46, 30.32] |