Administración diaria de suplementos de hierro por vía oral durante el embarazo
Resumen
Antecedentes
La administración de suplementos de hierro y ácido fólico fue la intervención preferida para mejorar las reservas de hierro y prevenir la anemia en las embarazadas; además, pueden mejorar otros resultados maternos y del parto.
Objetivos
Evaluar los efectos de la administración diaria de suplementos de hierro por vía oral en las embarazadas, solo o conjuntamente con ácido fólico, o con otras vitaminas y minerales como una intervención de salud pública en la atención prenatal.
Métodos de búsqueda
Se hicieron búsquedas en el registro de ensayos del Grupo Cochrane de Embarazo y Parto (Cochrane Pregnancy and Childbirth Group) (10 de enero 2015). También se buscó en la WHO International Clinical Trials Registry Platform (ICTRP) (26 de febrero 2015) y se estableció contacto con las organizaciones relevantes para identificar estudios en curso y no publicados (26 de febrero 2015).
Criterios de selección
Ensayos controlados aleatorizados o cuasialeatorizados que evaluaron los efectos de la administración preventiva de suplementos de hierro por vía oral con o sin ácido fólico, o hierro con otras vitaminas y minerales durante el embarazo.
Obtención y análisis de los datos
La calidad metodológica de los ensayos se evaluó mediante los criterios Cochrane estándar. Dos autores de la revisión de forma independiente evaluaron la elegibilidad del ensayo, extrajeron los datos y verificaron su exactitud. Se utilizaron los criterios GRADE para evaluar la calidad de la evidencia de los resultados primarios.
Se previó una gran heterogeneidad entre los ensayos, por lo que los resultados se agruparon mediante un modelo de efectos aleatorios y la interpretación de los resultados agrupados fue cautelosa; el modelo de efectos aleatorios proporciona el efecto promedio del tratamiento.
Resultados principales
Se incluyeron 61 ensayos. Cuarenta y tres ensayos con más de 43 274 mujeres aportaron datos y compararon los efectos de la administración diaria de suplementos de hierro por vía oral versus ningún suplemento de hierro o placebo.
La administración preventiva de suplementos de hierro redujo la anemia materna a término en el 70% (riesgo relativo [RR] 0,30; intervalo de confianza [IC] del 95%: 0,19 a 0,46; 14 ensayos, 2199 mujeres, evidencia de calidad baja), la anemia ferropénica a término (RR 0,33; IC del 95%: 0,16 a 0,69; seis ensayos, 1088 mujeres) y la deficiencia de hierro a término en el 57% (RR 0,43; IC del 95%: 0,27 a 0,66; siete ensayos, 1256 mujeres, evidencia de calidad baja). No hubo diferencias claras entre los grupos para la anemia grave en el segundo o tercer trimestres, o la infección materna durante el embarazo (RR 0,22; IC del 95%: 0,01 a 3,20; nueve ensayos, 2125 mujeres, evidencia de calidad muy baja; y RR 1,21; IC del 95%: 0,33 a 4.46; un ensayo, 727 mujeres, evidencia de calidad baja, respectivamente), o la mortalidad materna (RR 0,33; IC del 95%: 0,01 a 8,19; dos ensayos, 12 560 mujeres, evidencia de calidad muy baja), o el informe de los efectos secundarios (RR 1,29; IC del 95%: 0,83 a 2,02; 11 ensayos, 2423 mujeres, evidencia de calidad muy baja). Las pacientes que recibieron hierro tuvieron, como promedio, más probabilidades de presentar concentraciones mayores de hemoglobina (Hb) al término y en el posparto, pero tuvieron mayor riesgo de concentraciones de Hb mayores de 130 g/l durante el embarazo y a término.
En comparación con los controles, las mujeres que tomaron suplementos de hierro con menor frecuencia tuvieron recién nacidos de bajo peso al nacer (8,4% versus 10,3%; RR promedio 0,84; IC del 95%: 0,69 a 1,03; 11 ensayos, 17 613 mujeres, evidencia de calidad baja) y recién nacidos prematuros (RR 0,93; IC del 95%: 0,84 a 1,03; 13 ensayos, 19 286 mujeres, evidencia de calidad moderada). También parecieron dar a luz a recién nacidos con un peso ligeramente mayor (diferencia de medias [DM] 23,75; IC del 95%: ‐3,02 a 50,51; 15 ensayos, 18 590 mujeres, evidencia de calidad moderada). Ninguno de los resultados fue estadísticamente significativo. No hubo diferencias claras entre los grupos en cuanto a la muerte neonatal (RR 0,91; IC del 95%: 0,71 a 1,18; cuatro ensayos, 16 603 recién nacidos, evidencia de calidad baja), ni a las anomalías congénitas (RR 0,88; IC del 95%: 0,58 a 1,33; cuatro ensayos, 14 636 lactantes, evidencia de calidad baja).
Se realizaron 23 estudios en países que en el 2011 tenían algún riesgo de paludismo en determinadas áreas. En algunos de estos países/territorios, el paludismo está presente solo en ciertas áreas, o hasta una altitud específica. Solo dos de estos estudios informaron sobre los resultados de la malaria. No existe evidencia de que la administración de suplementos de hierro aumente el paludismo placentario. Para algunos resultados la heterogeneidad fue mayor del 50%.
Conclusiones de los autores
La administración de suplementos reduce el riesgo de anemia materna y de deficiencia de hierro en el embarazo, pero el efecto positivo sobre otros resultados maternos e infantiles es menos claro. La aplicación de las recomendaciones sobre la administración de suplementos de hierro puede producir resultados heterogéneos según el riesgo inicial de las poblaciones de tener bajo peso al nacer y anemia, así como el nivel de cumplimiento con la intervención.
PICO
Resumen en términos sencillos
Efectos y seguridad de la administración preventiva de suplementos de hierro por vía oral con o sin ácido fólico a embarazadas
Durante el embarazo las mujeres necesitan hierro y folato para satisfacer sus propias necesidades y las de su feto en desarrollo. La preocupación es que si hay deficiencia de estos nutrientes, las embarazadas no se los pueden proveer en cantidades suficientes al feto. El folato bajo antes de la concepción aumenta el riesgo de defectos del tubo neural en el feto. Los niveles bajos de hierro y folato pueden causar anemia, lo que puede provocar que las mujeres se sientan cansadas, se desmayen y aumente el riesgo de infección.
En la revisión se incluyeron 61 ensayos aleatorizados; 44 ensayos con más de 43 274 embarazadas contribuyeron a los análisis. El uso de hierro o de suplementos de hierro y ácido fólico se asoció con una reducción del riesgo de anemia y de deficiencia de hierro durante el embarazo. Hubo algunos indicios de que la administración de hierro a la madre durante el embarazo podría mejorar los resultados para los recién nacidos (peso al nacer y parto prematuro), pero la evidencia no fue de calidad alta. No hay evidencia de que la administración de suplementos de hierro aumente el paludismo placentario.
Authors' conclusions
Summary of findings
| (Infant outcomes) Any supplements containing iron compared with same supplements without iron or no treatment/placebo (no iron or placebo) | ||||
| Patient or population: Pregnant women of any gestational age and parity Setting: Hospital or community‐based antenatal clinics | ||||
| Outcomes | Relative effect | No of Participants | Quality of the evidence | Comments |
| Low birthweight (less than 2500 g) (ALL) | RR 0.84 | 17,613 | ⊕⊕⊝⊝ | |
| Birthweight (g) (ALL) | The mean birthweight (g) (ALL) in the intervention group was 23.75 higher (3.02 lower to 50.51 higher) | 18,590 | ⊕⊕⊕⊝ | |
| Preterm birth (less than 37 weeks of gestation) (ALL) | RR 0.93 | 19,286 | ⊕⊕⊕⊝ | |
| Neonatal death (within 28 days after delivery) (ALL) | RR 0.91 | 16,603 | ⊕⊕⊝⊝ | |
| Congenital anomalies (ALL) | RR 0.88 | 14,636 | ⊕⊕⊝⊝ | |
| CI: Confidence interval; RR: risk ratio | ||||
| GRADE Working Group grades of evidence | ||||
| 1Several studies contributing data had design limitations 2Wide 95% CI crossing the line of no effect | ||||
| (Maternal outcomes) Any supplements containing iron compared with same supplements without iron or no treatment/placebo (no iron or placebo) | ||||
| Patient or population: Pregnant women of any gestational age and parity | ||||
| Outcomes | Relative effect | No of Participants | Quality of the evidence | Comments |
| Maternal anaemia at term (Hb less than 110 g/L at 37 weeks' gestation or more) (ALL) | RR 0.30 | 2199 | ⊕⊕⊝⊝ | |
| Maternal iron deficiency at term (as defined by as defined by trialists, based on any indicator of iron status at 37 weeks's gestation or more) (ALL) | RR 0.43 | 1256 | ⊕⊕⊝⊝ | |
| Maternal death (death while pregnant or within 42 days of termination of pregnancy) (ALL) | RR 0.33 | 12,560 | ⊕⊝⊝⊝ | |
| Side effects (any reported throughout the intervention period) (ALL) | RR 1.29 | 2423 | ⊕⊝⊝⊝ | |
| Maternal severe anaemia at any time during second and third trimester (Hb less than 70 g/L) (ALL) | RR 0.22 | 2125 | ⊕⊝⊝⊝ | |
| Infection during pregnancy (including urinary tract infections) (ALL) | RR 1.21 | 727 | ⊕⊕⊝⊝ | |
| CI: Confidence interval; RR: risk ratio | ||||
| GRADE Working Group grades of evidence | ||||
| 1Several studies contributing data had design limitations and one had serious design limitations 2High heterogeneity I² > 80% 3Several studies contributing data had design limitations 4One of the studies contributing data had design limitations 5Wide 95% CI crossing the line of no effect. Low event rate 6Wide 95% CI crossing the line of no effect 7High heterogeneity I² = 69% | ||||
| Any supplements containing iron and folic acid compared with same supplements without iron nor folic acid (no iron nor folic acid or placebo) | ||||
| Patient or population: Pregnant women of any gestational age and parity | ||||
| Outcomes | Relative effect | No of Participants | Quality of the evidence | Comments |
| Low birthweight (less than 2500 g) (ALL) | RR 1.07 | 1311 | ⊕⊕⊝⊝ | |
| Birthweight (ALL) | The mean birthweight (ALL) in the intervention group was 57.73 higher (7.66 higher to 107.79 higher) | 1365 | ⊕⊕⊕⊝ | |
| Preterm birth (less than 37 weeks of gestation) (ALL) | RR 1.55 | 1497 | ⊕⊕⊝⊝ | |
| Neonatal death (within 28 days after delivery) (ALL) | RR 0.81 | 1793 | ⊕⊕⊝⊝ | |
| Congenital anomalies (ALL) | RR 0.70 | 1652 | ⊕⊕⊝⊝ | |
| CI: Confidence interval; RR: risk ratio | ||||
| GRADE Working Group grades of evidence | ||||
| 1Both studies contributing data had design limitations 2Wide 95% CI crossing the line of no effect 3All studies contributing data had design limitations 4Study contributing data had design limitations | ||||
| (Maternal outcomes) Any supplements containing iron and folic acid compared with same supplements without iron nor folic acid (no iron nor folic acid or placebo) | ||||
| Patient or population: Pregnant women of any gestational age and parity | ||||
| Outcomes | Relative effect | No of Participants | Quality of the evidence | Comments |
| Maternal anaemia at term (Hb less than 110 g/L at 37 weeks' gestation or more) (ALL) | RR 0.34 | 346 | ⊕⊕⊕⊝ | |
| Maternal iron deficiency at term (as defined by trialists, based on any indicator of iron status at 37 weeks' gestation or more) (ALL) | RR 0.24 | 131 | ⊕⊕⊝⊝ | |
| Maternal death (death while pregnant or within 42 days of termination of pregnancy) (ALL) | not estimable | 131 | ⊕⊕⊝⊝ | |
| Side effects (any reported throughout the intervention period) (ALL) | RR 44.32 | 456 | ⊕⊕⊕⊝ | |
| Maternal severe anaemia at any time during second and third trimester (Hb less than 70 g/L) (ALL) | RR 0.12 | 506 | ⊕⊝⊝⊝ | |
| Infection during pregnancy (including urinary tract infections) (ALL) | RR 1.00 | 48 | ⊕⊝⊝⊝ | |
| CI: Confidence interval; RR: risk ratio | ||||
| GRADE Working Group grades of evidence | ||||
| 1Studies contributing data had design limitations 2Study contributing data had design limitations 3Estimate based on small sample size 4Small sample size and no events 5Wide 95% CI crossing the line of no effect and low event rate 6Wide 95% CI crossing the line of no effect, small sample size and low event rate | ||||
Background
Description of the condition
Iron deficiency is thought to be the most common nutrient deficiency among pregnant women (WHO 1992). Iron deficiency involves an insufficient supply of iron to the cells following depletion of the body's reserves. Its main causes are a diet poor in absorbable iron, an increased requirement for iron (e.g. during pregnancy) not covered through the diet, a loss of iron due to parasitic infections, particularly hookworm, and other blood losses (Crompton 2002; INACG 2002a). Chronic iron deficiency frequently turns into iron‐deficiency anaemia. While iron deficiency is the most common cause of anaemia, other causes such as acute and chronic infections that cause inflammation; deficiencies of folate and of vitamins B2, B12, A, and C; and genetically inherited traits such as thalassaemia and drepanocytosis (sickle‐cell anaemia) may be independent or superimposed causal factors (WHO 2001; WHO 2015a). The global prevalence of anaemia among pregnant women was estimated to be 38.2% in 2011 (WHO 2015b).
Diagnosis of iron‐deficiency and anaemia during pregnancy
Anaemia during pregnancy is diagnosed if a woman's haemoglobin (Hb) concentration is lower than 110 g/L at sea level, although it is recognised that during the second trimester Hb concentrations naturally decrease by approximately 5 g/L (WHO 2011a). Although Hb and, less frequently, hematocrit tests are used to screen for iron deficiency, low Hb or hematocrit values are not specific to iron deficiency.
Iron deficiency in non‐pregnant populations can be measured quite precisely using laboratory tests such as serum ferritin, serum iron, transferrin, transferrin saturation and transferrin receptors. However, these tests are often not readily available and their results may be of limited value in some settings where different infections (e.g. malaria, HIV/AIDS, vaginosis) are highly prevalent (Nel 2015). Furthermore, the results of those tests do not correlate closely with one another because each reflects a different aspect of iron metabolism. For example, serum ferritin concentration is an indicator of iron reserves. During pregnancy, however, serum ferritin levels as well as levels of bone marrow iron fall even in women who ingest daily supplements with high amounts of iron, which casts doubts about their true significance in pregnancy and suggests the need to review cut‐off values (Puolakka 1980; Romslo 1983; Svanberg 1975). Currently, a serum ferritin concentration of less than 15 µg/L in healthy adults is an accepted cut‐off of depleted iron stores, even among pregnant women (WHO 2011b), although the review of cut‐off points is recognised as a research need (Garcia‐Casal 2014). Interestingly, the nadir of maternal serum ferritin occurs by week 28, before higher iron demands are believed to occur, a decrease only partially explained by the normal plasma volume expansion that occurs during pregnancy (Taylor 1982).
The ratio of serum transferrin receptors to serum ferritin has been suggested as a good indicator of iron nutrition among pregnant and non‐pregnant women (Cook 2003). Data from the United States National Health and Nutrition Examination Survey (NHANES) in 1999 to 2006 for 1171 pregnant women using this composed indicator showed that pregnant women in the first trimester had the highest mean total body iron compared with that of pregnant women in the second or third trimesters, and that the prevalence of iron deficiency in pregnant women increased with trimester (Mei 2011). However, the lack of a standard soluble transferrin receptor (sTfR) assay method and a standard reference material, limit the use and comparability of this indicator with other studies (WHO 2014a). There is still a need to improve the definition of the distribution of serum transferrin receptors during pregnancy in populations with different iron status (Nair 2004) in various environments (Milman 2007).
After considering various indicators, a World Health Organization (WHO) and Centers for Disease Control and Prevention (CDC) technical consultation concluded that Hb and ferritin were the most efficient combination of indicators for monitoring change in the iron status of a population as a consequence of iron supplementation (WHO/CDC 2005). Unfortunately, only two of the very varied studies on pregnant women were included, and only one of them demonstrated changes with iron supplementation. The use of multiple indicators (Hb, ferritin and sTfRs) is useful for population‐based assessments of iron‐deficiency anaemia, when this is feasible.
Low and high Hb concentrations, iron status and pregnancy outcomes
The consequences of iron‐deficiency anaemia are serious, and can include diminished intellectual and productive capacity (Hunt 2002), and possibly increased susceptibility to infections (Oppenheimer 2001). The lowest rates of low birthweight and premature birth appear to occur when maternal Hb levels are between 95 and 105 g/L during the second trimester of gestation (Murphy 1986; Steer 2000), and between 95 and 125 g of Hb/L at term (Hytten 1964; Hytten 1971). However, the results of several studies suggest that near‐term Hb levels below 95 g/L or even below 110 g/L may be associated with low birthweight, heavier placentas and increased frequency of premature births (Garn 1981; Godfrey 1991; Kim 1992; Klebanoff 1989; Klebanoff 1991; Murphy 1986). There is evidence that maternal Hb levels below 95 g/L before or during the second trimester of gestation are associated with increased risk of giving birth to a low birthweight infant and with premature delivery (Burke 2014). During pregnancy, low Hb levels, indicative of moderate (between 70 and 90 g/L) or severe (less than 70 g/L) anaemia, are associated with increased risk of maternal and child mortality and infectious diseases (INACG 2002b). Favourable pregnancy outcomes occur 30% to 45% less often in anaemic mothers, and it has been estimated that their infants have less than one‐half of normal iron reserves (Bothwell 1981).
Unfortunately, the time between birth and umbilical cord clamping has not been considered in the estimates of impact of maternal iron status and anaemia on the infant's iron reserves, even though late umbilical cord clamping (between one and three minutes) has been shown to improve them significantly (McDonald 2013; Rabe 2012), and is recommended to prevent maternal postpartum haemorrhage (WHO 2012b) and other outcomes (WHO 2014b). Iron deficiency may adversely affect the cognitive performance, development and physical growth of infants (WHO 2001; Black 2011) even in the long term (Lozoff 2006). Moderate or severe iron deficiency during infancy has been shown to have irreversible cognitive effects (Gleason 2007). A recent review concluded that correcting iron deficiency could have a beneficial impact in women's physical performance (Pasricha 2014). Studies in animal models suggest that suffering anaemia during the intrauterine period can lead to long‐term chronic diseases such as hypertension, as part of a phenomenon known as fetal programming (Andersen 2006).
Haemoglobin levels greater than 130 g/L at sea level have also been associated with negative pregnancy outcomes (Hytten 1964; Hytten 1971; Murphy 1986; Scholl 1997; Steer 2000). Large epidemiologic retrospective studies (Murphy 1986; Steer 2000; Xiong 2000), and one prospective study in China (Zhou 1998), have shown that both low and high prenatal Hb concentrations are associated with increased risks for premature delivery and low birthweight. In fact, the incidence of these negative consequences increases dramatically when women's Hb levels, at sea level, are below 95 to 105 g/L at any time in pregnancy or above 130 to 135 g/L after mid‐pregnancy. A randomised clinical trial in Mexico showed associations between prenatal daily iron supplement intake at recommended doses to be associated with high Hb concentrations and the risk for both low birthweight and premature delivery (Casanueva 2003a). A study (Ziaei 2007) also showed that women whose Hb concentration at gestational weeks 32 to 36 was greater than 132 g/L had more low birthweight babies and also higher blood pressure than women with lower Hb concentrations. Unfortunately, any women considered anaemic were excluded from the study. Observational studies have shown that among iron supplemented pregnant women, and particularly among those who are anaemic early in pregnancy, a failure of Hb and/or ferritin levels to decline during the second and third trimesters, and overall high ferritin levels during pregnancy, not due to infection, are associated with adverse pregnancy outcomes. However, when some confounding factors are controlled for, the association between high serum ferritin concentrations and the risk for premature delivery was not significant (Scholl 1998; Scholl 2000; Scholl 2005).
The association between iron deficiency without anaemia and adverse perinatal outcomes is less clear, although some studies have shown iron deficiency to be associated with inadequate pregnancy weight gain, decreased defence against infections, preterm delivery and low birthweight (Garn 1981; Kandoi 1991; Prema 1982; Scholl 1992).
Description of the intervention
The Institute of Medicine recommends that women consume 27 mg/day of iron during pregnancy (IOM 2001). Most women need additional iron as well as sufficient iron stores to prevent iron deficiency (Bothwell 2000), and so direct iron supplementation for pregnant women has been used extensively in most low‐ and middle‐income countries as an intervention to prevent and correct iron deficiency and anaemia during pregnancy. It has been recommended that iron supplements also contain folic acid, an essential B‐vitamin, because of the increased requirements of pregnancy, due to the rapidly dividing cells in the fetus and elevated urinary losses. Other vitamins and minerals for which deficiencies are documented, and when requirements during pregnancy are higher, this may justify their addition to the supplementation formula, although this is an ongoing area of controversy, particularly with differing conclusions on maternal and infant benefits from various reviews (Bhutta 2008; Christian 2010; Haider 2012; Shrimptom 2009).
International organisations have been advocating routine iron and folic acid supplementation for every pregnant woman in areas where anaemia is highly prevalent (Beard 2000; Villar 1997). While iron supplementation, with or without folic acid has been used in a variety of doses and regimens, some current recommendations for all pregnant adolescents and adult women include the provision of a standard daily dose of 30 to 60 mg of elemental iron and 400 μg (0.4 mg) of folic acid starting as soon as possible after gestation begins and continuing for the rest of the pregnancy (WHO 2012a). In settings where anaemia in pregnant women is a severe public health problem (40% of higher), a daily dose of 60 mg of elemental iron is preferred over a lower dose. Additionally, if iron deficiency prevalence in the country is high, (INACG 1998), or if a woman is diagnosed with anaemia in a clinical setting, she should be treated with daily iron (120 mg of elemental iron) and folic acid (400 μg or 0.4 mg) supplementation until her Hb concentration rises to normal (WHO 2012a). Recent data from national surveys from 46 countries during the years 2003 to 2009 estimated that 52% to 75% of mothers had received iron tablets during pregnancy, and that the duration of supplementation was usually short (Lutter 2011).
A dose of 60 mg of elemental iron was first established in 1959 and was based on estimated iron requirements for women during pregnancy (WHO 1959). This same dose was endorsed by subsequent expert consultations (INACG 1998; WHO 1968; WHO 2001). The use of folic acid during pregnancy was first suggested in 1967, during a technical consultation in Geneva, Switzerland. It was considered that a dose of 300 μg (0.3 mg) of folic acid per day throughout pregnancy would help prevent megaloblastic anaemia, which is associated with folate deficiency (WHO 2015a). This consultation was called three years after the start of a worldwide multi‐country collaborative study in India, Israel, Mexico, Poland, South Africa, the United Kingdom, the United States of America, and Venezuela (WHO 1968). The recommended supplemental dose increased to 400 μg (0.4 mg) per day in 1998 after various studies supported its periconceptional use for prevention of neural tube defects (INACG 1998). At the time it was acknowledged that the rationale for providing folic acid supplementation after the first trimester of pregnancy would not be to prevent congenital anomalies but that the 400 µg (0.4 mg) daily dose of folic acid would provide a safe and healthy intake for women during pregnancy and lactation, although probably more than was actually required to produce an optimal Hb response in pregnant women (INACG 1998).
The tolerable upper intake level for iron has been set based on the gastrointestinal side effects associated with high levels of iron consumed on an empty stomach. Iron has the potential to cause direct erosion and irritation of the gastrointestinal mucosa, to cause oxidative damage of lipid membranes, proteins or DNA, can stimulate inflammation or, as an essential nutrient, fertilise the growth of pathogens. High‐dose iron supplements are commonly associated with constipation and other gastrointestinal effects including nausea, vomiting and diarrhoea, with frequency and severity varying according to the amount of elemental iron released in the stomach. The Institute of Medicine has established the tolerable upper limit for iron during pregnancy as 45 mg/day of iron, a daily dose much lower than international recommendations (IOM 2001), although the methodology and assumptions used have been questionable (Schümann 2007). In most industrialised countries, the decision to prescribe or recommend antenatal iron with folic acid supplementation to women during pregnancy is left to the healthcare personnel, and is based on the individual maternal condition (Nisar 2014; Sanghvi 2010). In the United States, iron supplementation as a primary prevention intervention involves smaller daily iron doses (i.e. 30 mg/day), but therapeutic doses of up to 120 mg elemental iron daily are recommended for the treatment of anaemia (CDC 1998). In the UNited Kingdom, the British Committee for Standards in Haematology does not recommend routine iron supplementation for all women in pregnancy (BCSH 2011).
Why it is important to do this review
Several studies have shown that iron supplementation, with or without folic acid during pregnancy, helps cover the iron intake gap and results in a substantial reduction in women's risk of anaemia in late pregnancy, at delivery and six weeks postpartum (Mahomed 1997; Mahomed 2000a; Villar 2003). However, the overall impact of iron supplementation interventions under field conditions has been limited, and the effectiveness of these interventions has been questioned (Beaton 1999). The limited success has been attributed to inadequate infrastructure and poor compliance (Mora 2002), although few studies have evaluated these issues adequately. The effectiveness of iron supplementation for pregnant women has been evaluated mostly in terms of improvement in Hb concentration, rather than improvements in maternal or infant health (Beaton 2000). This narrow scope may have been an important omission in most studies addressing the efficacy, effectiveness and safety of iron and iron with folic acid supplementation during pregnancy.
An additional important consideration arises when providing iron supplements to women is the presence of malaria. Approximately 40% of the world population is exposed to the parasite and it is endemic in over 100 countries (WHO 2010). Of all the complications associated with this disease, anaemia is the most common and causes the highest number of malaria‐related deaths. Malaria in pregnant women increases the risk of maternal death, miscarriage, stillbirth and low birthweight with an associated risk of neonatal death (WHO 2010; WHO 2014c). Provision of iron in malaria‐endemic areas has been a long standing controversy due to concerns that iron therapy may exacerbate infections, in particular malaria in childhood (Oppenheimer 2001). Although the mechanisms by which additional iron can benefit the parasite are far from clear, it is possible that lower‐dose supplementation might be an effective intervention to prevent anaemia and improve malaria treatment in malaria endemic areas since less iron is available for the parasite (NIH 2011). The potential interaction between malaria interventions and iron interventions in pregnancy has not been well studied. Malaria intermittent preventive treatment (IPT) is recommended for pregnant women in areas of high transmission who are particularly vulnerable to contracting malaria or suffering its consequences. A total of 34 out of 45 countries in Africa with ongoing malaria transmission, had adopted IPT for pregnant women as national policy by 2013 (WHO 2014c).
This review updates a previously published Cochrane Review on iron and iron + folic acid supplementation (Peña‐Rosas 2012) that has clearly shown improvements on biochemical and haematological parameters, and evaluates the issues related to dose and formulation as well as the potential benefits and hazards of daily iron supplementation as a preventive intervention for women during pregnancy.
The effectiveness of different iron treatments for anaemia among pregnant women in clinical practice (Reveiz 2011), and the effects of supplementation with iron and vitamin A during pregnancy (Van den Broek 2010) are covered in other Cochrane reviews. A Cochrane review assesses the effectiveness of oral folate supplementation alone during pregnancy on haematological and biochemical parameters during pregnancy and on pregnancy outcomes (Lassi 2013). The effects and safety of periconceptional folate supplementation for preventing birth defects (De‐Regil 2010), and the effects of multiple vitamin and mineral supplements during pregnancy have also been reviewed elsewhere (Haider 2012; Ramakrishnan 2013). A separate review addresses the effectiveness of intermittent iron and folic acid supplementation regimens for women during pregnancy (Peña‐Rosas 2012a).
Objectives
To assess the effects of daily oral use of iron supplements by pregnant women, either alone or in conjunction with folic acid or with other vitamins and minerals as a public health intervention in antenatal care.
Methods
Criteria for considering studies for this review
Types of studies
We included randomised, cluster‐randomised and quasi‐randomised trials comparing the effects of daily oral prenatal supplements of iron, or iron + folic acid or iron + other vitamins and minerals supplements among pregnant women.
We excluded studies that assessed the effects of multiple combinations of vitamins and minerals, except studies that examined the 'additional effect' of iron or iron + folic acid supplements, i.e. when women in all arms of the trial were provided with the same other micronutrient supplements (with the exception of iron or iron + folic acid).
We have not reviewed the effects of supplementation with multiple micronutrients containing iron or iron + folic acid in comparison to supplementation with iron or iron + folic acid or in comparison to placebo or no treatment. We have excluded studies dealing specifically with iron supplementation as a medical treatment. We also excluded trials addressing the effects of intermittent (i.e. weekly, twice weekly) iron supplementation regimens in comparison to daily supplementation regimens.
Types of participants
Pregnant women of any gestational age and parity.
Types of interventions
We have included a range of interventions providing daily oral supplementation (e.g. tablets, capsules) containing iron alone, iron + folic acid or iron + other vitamins and minerals.
The oral supplements forms include tablets or capsules (WHO 2008). Tablets (soluble tablets, effervescent tablets, tablets for use in the mouth, and modified‐release tablets) are solid dosage forms containing one or more active ingredients. They are obtained by single or multiple compression (in certain cases they are moulded) and may be uncoated or coated. Capsules are solid dosage forms with hard or soft shells, various shapes and sizes, that contain a single dose of one or more active ingredients. Capsules may be hard, soft, and modified‐release capsules and are generally intended for oral administration.
Where data were available we planned to compare the following.
-
Any supplements containing iron versus same supplements without iron or no treatment/placebo (no iron or placebo).
-
Any supplements containing iron and folic acid versus same supplements without iron or folic acid (no iron + folic acid or placebo).
-
Supplementation with iron alone versus no treatment/placebo.
-
Supplementation with iron + folic acid versus no treatment/placebo.
-
Supplementation with iron + folic acid versus folic acid alone (without iron) supplementation.
-
Supplementation with iron + other vitamins and minerals supplementation versus same other vitamins and minerals (without iron) supplementation.
-
Supplementation with iron + folic acid + other vitamins and minerals versus folic acid + same other vitamins and minerals (without iron) supplementation.
-
Supplementation with iron + folic acid + other vitamins and minerals versus same other vitamins and minerals (without iron + folic acid) supplementation.
Comparisons 3, 5, 6, and 7 are summarised in comparison 1. Comparisons 4 and 8 are summarised in comparison 2. Comparisons 1 and 2 are used in the 'Summary of findings' tables; we have produced separate tables for infant and maternal outcomes (summary of findings Table for the main comparison; summary of findings Table 2; summary of findings Table 3; summary of findings Table 4).
Interventions that combined daily oral iron or iron + folic acid supplementation with co‐interventions such as education or other approaches were included, only if the other co‐interventions were the same in both the intervention and comparison groups. Studies examining supplemental iron alone or vitamins and minerals provided from supplementary food‐based interventions (i.e. interventions with multiple micronutrient powders, lipid‐based supplements, fortified complementary foods, and other fortified foods) were excluded. Likewise, regimens providing iron supplements in intermittent regimens were excluded from this review.
Types of outcome measures
Maternal, perinatal and postpartum clinical and laboratory outcomes and infant clinical and laboratory outcomes as described below.
Primary
Infant
-
Low birthweight (less than 2500 g).
-
Birthweight (in g).
-
Preterm birth (less than 37 weeks' gestation).
-
Neonatal death (within 28 days after delivery).
-
Congenital anomalies, including neural tube defects (as defined by trialists).
Maternal
-
Maternal anaemia at term (Hb less than 110 g/L at 37 weeks' gestation or more).
-
Maternal iron deficiency at term (as defined by trialists, based on any indicator of iron status at 37 weeks' gestation or more).
-
Maternal iron‐deficiency anaemia at term (as defined by trialists at 37 weeks' gestation or more).
-
Maternal death (death while pregnant or within 42 days of termination of pregnancy).
-
Side effects (any reported throughout intervention period)*.
-
Severe anaemia at any time during second or third trimesters (Hb less than 70 g/L).
-
Clinical malaria (as defined by trialists).
-
Infection during pregnancy (including urinary tract infections and others as specified by trialists).
Secondary
Infant
-
Very low birthweight (less than 1500 g).
-
Very premature birth (less than 34 weeks' gestation).
-
Hb concentration in the first six months (in g/L, counting the last reported measure after birth within this period).
-
Ferritin concentration in the first six months (in μg/L, counting the last reported measure after birth within this period).
-
Development and motor skills (as defined by trialists).
-
Admission to special care unit.
Maternal
-
Maternal anaemia at or near term (Hb less than 110 g/L at 34 weeks' gestation or more).
-
Maternal iron deficiency at or near term (as defined by trialists, based on any indicator of iron status at 34 weeks' gestation or more).
-
Maternal iron‐deficiency anaemia at or near term ((Hb less than 110 g/L and at least one additional laboratory indicator at 34 weeks' gestation or more).
-
Maternal Hb concentration at or near term (in g/L, at 34 weeks' gestation or more).
-
Maternal Hb concentration within six weeks postpartum (in g/L).
-
Maternal high Hb concentrations at any time during second or third trimester (defined as Hb greater than 130 g/L).
-
Maternal high Hb concentrations at or near term (Hb more than 130 g/L at 34 weeks' gestation or more).
-
Moderate anaemia at postpartum (Hb between 80 and 109 g/L).
-
Maternal severe anaemia at or near term (Hb less than 70 g/L at 34 weeks' gestation or more).
-
Severe anaemia postpartum (Hb less than 80 g/L).
-
Puerperal infection (as defined by trialists).
-
Antepartum haemorrhage (as defined by trialists).
-
Postpartum haemorrhage (intrapartum and postnatal, as defined by trialists).
-
Transfusion given (as defined by trialists).
-
Diarrhoea (as defined by trialists).
-
Constipation (as defined by trialists).
-
Nausea (as defined by trialists).
-
Heartburn (as defined by trialists).
-
Vomiting (as defined by trialists).
-
Maternal well being/satisfaction (as defined by trialists).
-
Placental abruption (as defined by trialists).
-
Premature rupture of membranes (as defined by trialists).
-
Pre‐eclampsia (as defined by trialists).
* For trials reporting individual side effects separately but not specifying the number of women reporting any side effects, for our primary outcome, we have selected the side effect with the greatest number of women (in the intervention and control groups combined) reporting that particular problem. We did this to avoid double counting any women reporting more than one side effect.
Search methods for identification of studies
The following methods section of this review is based on a standard template used by the Cochrane Pregnancy and Childbirth Group.
Electronic searches
We searched the Cochrane Pregnancy and Childbirth Group’s Trials Register by contacting the Trials Search Co‐ordinator (10 January 2015).
The Cochrane Pregnancy and Childbirth Group’s Trials Register is maintained by the Trials Search Co‐ordinator and contains trials identified from:
-
monthly searches of the Cochrane Central Register of Controlled Trials (CENTRAL);
-
weekly searches of MEDLINE (Ovid);
-
weekly searches of Embase (Ovid);
-
monthly searches of CINAHL (EBSCO);
-
handsearches of 30 journals and the proceedings of major conferences;
-
weekly current awareness alerts for a further 44 journals plus monthly BioMed Central email alerts.
Details of the search strategies for CENTRAL, MEDLINE, Embase and CINAHL, the list of handsearched journals and conference proceedings, and the list of journals reviewed via the current awareness service can be found in the ‘Specialized Register’ section within the editorial information about the Cochrane Pregnancy and Childbirth Group.
Trials identified through the searching activities described above are each assigned to a review topic (or topics). The Trials Search Co‐ordinator searches the register for each review using the topic list rather than keywords.
In addition, we searched the International Clinical Trials Registry Platform (ICTRP) for any ongoing or planned trials (26 February 2015) using the search terms described in Appendix 1.
Searching other resources
For assistance in identifying ongoing or unpublished studies, we also contacted the Departments of Reproductive Health and Research and Nutrition for Health and Development from the World Health Organization (WHO), the nutrition section of the United Nations Children's Fund (UNICEF), the World Food Programme (WFP), the U.S. Centers for Disease Control and Prevention (CDC), the Micronutrient Initiative (MI), the Global Alliance for Improved Nutrition (GAIN), Hellen Keller International (HKI), and the Sight and Life (26 February 2015) .
We did not apply any language or date restrictions.
Data collection and analysis
For methods used when assessing trials identified in the previous version of this review, see Peña‐Rosas 2012.
For this update, we used the following methods when assessing the trials identified by the updated search (Korkmaz 2014; Liu 2012). These methods are based on a standard template used by the Cochrane Pregnancy and Childbirth Group.
Selection of studies
Two review authors independently assessed and selected the trials for inclusion in this review. We resolved any disagreement on eligibility for inclusion by discussion.
It was not possible for us to assess the relevance of the trials blinded because we knew the authors' names, institution, journal of publication and results, when we applied the inclusion criteria.
Data extraction and management
We designed a form to facilitate the process of data extraction and to request additional (unpublished) information from the authors of the original reports. We resolved any disagreements among us by discussion, and, if necessary, sought clarification from the authors of the original reports. We extracted data relating to the setting and cadre from all the included studies specifying whether the intervention was reported as being done by a physician, obstetrician, lay health worker, midwife, dietitian or a combination of health professionals. We also extracted the type of healthcare facility and the geographical location of the intervention, when this information was available.
We entered data onto Review Manager software (RevMan 2014) and checked for accuracy.
Assessment of risk of bias in included studies
Two review authors independently assessed risk of bias for each study using the criteria outlined in the Cochrane Handbook for Systematic Reviews of Interventions (Higgins 2011). We resolved any disagreement by discussion.
(1) Sequence generation (checking for possible selection bias)
We have described for each included study the method used to generate the allocation sequence. We assessed the method as:
-
low risk of bias (any truly random process, e.g. random number table; computer random number generator);
-
high risk of bias (any non‐random process, e.g. odd or even date of birth; hospital or clinic record number);
-
unclear.
(2) Allocation concealment (checking for possible selection bias)
We have described for each included study the method used to conceal the allocation sequence and assessed whether intervention allocation could have been foreseen in advance of, or during recruitment, or changed after assignment.
We assessed the methods as:
-
low risk of bias (e.g. telephone or central randomisation; consecutively numbered sealed opaque envelopes);
-
high risk of bias (open random allocation; unsealed or non‐opaque envelopes, alternation; date of birth);
-
unclear.
(3.1) Blinding of participants and personnel (checking for possible performance)
We have described for each included study the methods used, if any, to blind study participants and personnel from knowledge of which intervention a participant received. For this type of intervention, where different regimens were compared, it would be theoretically possible to blind study participants and staff by providing both active and placebo tablets to women allocated to intermittent regimens and placebo tablets to women in no supplementation arms of trials.
Blinding was assessed separately for different outcomes or classes of outcomes and we have noted where there was partial blinding.
We assessed the methods as:
-
low, high or unclear risk of bias for participants;
-
low, high or unclear risk of bias for personnel.
(3.2) Blinding of outcome assessment (checking for possible detection bias)
We have described for each included study the methods used, if any, to blind outcome assessors from knowledge of which intervention a participant received. We assessed blinding separately for different outcomes or classes of outcomes.
We assessed methods used to blind outcome assessment as:
-
low, high or unclear risk of bias.
(4) Incomplete outcome data (checking for possible attrition bias through withdrawals, dropouts, protocol deviations)
We assessed losses to follow‐up and post‐randomisation exclusions systematically for each trial.
We have described for each included study, and for each outcome or class of outcomes, the completeness of data including attrition and exclusions from the analysis. We have noted whether attrition and exclusions were reported, the numbers included in the analysis at each stage (compared with the total randomised participants), reasons for attrition or exclusion where reported, and whether missing data were balanced across groups or were related to outcomes. We assessed methods as:
-
low risk of bias;
-
high risk of bias; or
-
unclear.
We considered follow‐up to be adequate if more than 80% of participants initially randomised in a trial were included in the analysis and any loss was balanced across groups, unclear if the percentage of initially randomised participants included in the analysis was unclear, and inadequate if less than 80% of those initially randomised were included in the analysis or if loss was imbalanced in different treatment groups.
(5) Selective reporting bias
We have described for each included study how we investigated the possibility of selective outcome reporting bias and what we found.
We assessed the methods as:
-
low risk of bias (where it is clear that all of the study’s pre‐specified outcomes and all expected outcomes of interest to the review had been reported);
-
high risk of bias (where not all the study’s pre‐specified outcomes had been reported; one or more reported primary outcomes were not pre‐specified; outcomes of interest were reported incompletely and so could not be used; study failed to include results of a key outcome that would have been expected to have been reported);
-
unclear.
(6) Other sources of bias
We assessed whether each study was free of other problems that could put it at risk of bias. We have noted for each included study any important concerns we had about other possible sources of bias.
We assessed whether each study was free of other problems that could put it at risk of bias:
-
low risk of further bias;
-
high risk of further bias;
-
unclear whether there is a risk of further bias.
(7) Overall risk of bias
We have made explicit judgements about whether studies are at high risk of bias, according to the criteria given in the Handbook (Higgins 2011) and for primary outcomes have explored the impact of the level of bias through undertaking sensitivity analyses ‐ seeSensitivity analysis.
Assessment of the quality of evidence using GRADE
For the assessment across studies, we employed the GRADE approach to interpret findings (Langendam 2013) and the GRADE profiler (GRADEpro 2014) allowed us to import data from Review Manager 5.3 (RevMan 2014) to create 'Summary of findings' (SoF) tables (set out in summary of findings Table for the main comparison; summary of findings Table 2; summary of findings Table 3; summary of findings Table 4). The primary outcomes for each comparison have been listed with estimates of relative effects along with the number of participants and studies contributing data for those outcomes. These tables provide outcome‐specific information concerning the overall quality of evidence from studies included in the comparison, the magnitude of effect of the interventions examined, and the sum of available data on the outcomes we considered. Only primary outcomes were included in the 'Summary of findings' tables. For each individual outcome, two review authors independently assessed the quality of the evidence using the GRADE approach (Balshem 2010).
For assessments of the overall quality of evidence for each outcome that included pooled data from included trials, we downgraded the evidence from 'high quality' by one level for serious (or by two for very serious) study limitations (risk of bias), indirectness of evidence, serious inconsistency, imprecision of effect estimates or potential publication bias. This assessment was limited only to the trials included in this review and as we did not consider there was a serious risk of indirectness or publication bias, we did not downgrade in these domains.
Measures of treatment effect
For dichotomous data, we present results as summary risk ratio (RR) with 95% confidence intervals (CI).
For continuous data, we have used the mean difference (MD) if outcomes were measured in the same way between trials. We planned to use the standardised mean difference (SMD) to combine trials measuring the same outcome, but using different scales or methods.
Unit of analysis issues
Cluster‐randomised trials
We included cluster‐randomised trials in the analyses along with individually‐randomised trials. Cluster‐randomised trials are labelled with a (C). Where possible, we estimated the intracluster correlation co‐efficient (ICC) from trials' original data sets and reported the design effect. On the basis of this information we used the methods set out in the Handbook to calculate the adjusted sample sizes (Higgins 2011).
We included four cluster‐randomised trials (Christian 2003 (C); Hoa 2005 (C); Menendez 1994 (C); Zeng 2008 (C)). One of these trials did not contribute data to the analysis (Hoa 2005 (C)). For the remaining three cluster‐randomised trials (Christian 2003 (C); Menendez 1994 (C); Zeng 2008 (C)), data have been adjusted to take account of the design effect. In the study by Christian 2003 (C), adjusted data were provided by the author using outcome‐specific ICCs. For the Zeng 2008 (C) trial, we adjusted the published results and calculated an effective sample size by dividing figures by the design effect calculated using the ICC for the trial’s primary outcome: birthweight ICC = 0.03. We used the same sample adjustment for all outcomes. We used the same method for the Menendez 1994 (C) trial, however in this case there was insufficient information in the study reports to allow us to calculate the design effect and so we estimated it using the ICC for Hb at term (ICC = 0.03) reported in another study with similar average cluster sizes (Winichagoon 2003). We used this same ICC for all outcomes.
Where we have identified both cluster‐randomised trials and individually‐randomised trials reporting data for the same outcome, we considered that it was reasonable to combine the results from both if there was little heterogeneity between the study designs and the interaction between the effect of intervention and the choice of randomisation unit was considered to be unlikely.
Cross‐over trials
We did not include cross‐over trials.
Dealing with missing data
For included studies, we noted levels of attrition in the Characteristics of included studies tables. We explored the impact of including studies with high levels of missing data in the overall assessment of treatment effect by using sensitivity analysis.
When possible, we conducted an available case analysis and reinstated previously excluded cases, i.e. we attempted to include all participants randomised to each group in the analyses. The denominator for each outcome in each trial is the number randomised minus any participants whose outcomes are known to be missing.
Assessment of heterogeneity
We examined the forest plots for the analyses visually to assess any obvious heterogeneity in terms of the size or direction of treatment effect between studies. We used the I², and Tau² statistics and the P value of the Chi² test for heterogeneity to quantify heterogeneity among the trials in each analysis. The I² statistic quantifies inconsistency and describes the percentage of the variability in effect estimates that is due to heterogeneity rather than sampling error (chance).
Assessment of reporting biases
For our primary outcomes, we investigated publication bias on outcomes with more than 10 trials by examining the funnel plots for signs of asymmetry, although we gave consideration to reasons other than publication bias that could explain the asymmetry, when present.
Data synthesis
We carried out statistical analysis using the Review Manager software (RevMan 2014).
Because of our experience in conducting other reviews in this area, we anticipated high heterogeneity among trials and we pooled trial results using a random‐effects model and were cautious in our interpretation of the pooled results. We have indicated in the text that the random‐effects model gives the average treatment effect. For statistically significant results where there are high levels of heterogeneity ((I² greater than 50%), we have given the values of I², Tau² and the P value of the Chi² test for heterogeneity and have provided an estimate of the 95% range of underlying intervention effects (prediction interval (PI)).
Subgroup analysis and investigation of heterogeneity
Where more than one trial was included in a comparison, we conducted both overall analysis of the effects of various supplementation regimens on primary outcomes and subgroup analysis on the primary outcomes based on the following criteria:
-
by gestational age: early, if supplementation started before 20 weeks' gestation or prior to pregnancy; late if supplementation started at 20 weeks of gestation or later; or, unspecified or mixed gestational ages at the start of supplementation;
-
by anaemic status at start of intervention: anaemic when Hb below 110 g/L during first and third trimesters or below 105 g/L in second trimester; non‐anaemic if Hb 110 g/L or above during first and third trimesters or Hb 105 g/L or above if in second trimester; or unspecified/mixed anaemic status;
-
by dose of iron: low daily dose of iron if 30 mg or less of elemental iron; medium daily dose of iron (more than 30 mg and less than 60 mg elemental iron) and higher daily dose of iron if dose is 60 mg elemental iron or more);
-
by type of formulation: slow release iron supplement (as defined by trialists) or normal release iron supplement/not specified;
-
by iron compound bioavailability in comparison to ferrous sulphate: higher bioavailability: NaFeEDTA; equivalent or lower relative bioavailability: ferrous sulphate, ferrous fumarate, ferrous gluconate; other/not specified;
-
by malaria risk setting: study carried out in malaria risk‐free countries or study carried out in countries with some malaria risk or explicitly described as a malaria risk study site.
In the subgroup analyses we have provided totals and subtotals and have assessed subgroup differences by interaction tests available in RevMan (RevMan 2014). Where there was evidence of a difference between subgroups, we have reported this in the text and presented the results for the subgroup analyses quoting the Chi² statistic and P value, and the interaction I² value. However, for some outcomes few studies contributed data, and for some outcomes, all the trials were in the same subgroup; as more data become available, in updates of the review, we will explore possible subgroup differences as a means of exploring heterogeneity.
Sensitivity analysis
In previous versions of the review for primary outcomes we conducted sensitivity analysis based on risk of bias. We considered a study to be of high quality if it was assessed as low risk of bias in both the randomisation and allocation concealment and in either blinding or loss to follow‐up. In this updated version of the review, for our main comparisons (comparisons 1 and 2) for primary outcomes we have now graded the overall quality of the evidence (taking into account risk or bias, heterogeneity, imprecision of findings and possible publication bias); we considered that this would give a better indication of the overall quality of evidence at the outcome level. The quality of the evidence is noted both in the text (Effects of interventions) and in tables (summary of findings Table for the main comparison; summary of findings Table 2; summary of findings Table 3; summary of findings Table 4).
For comparisons 3 onwards we have carried out planned sensitivity analysis because for these comparisons the overall quality of the evidence was not graded.
Results
Description of studies
Results of the search
A single search was carried out for this and a related review examining intermittent iron and iron plus folic acid supplementation in pregnancy (Peña‐Rosas 2012a). The study flow is depicted in Figure 1. In this updated review, we have included 61 and excluded 136 trials. Data from two new trials have been included (Korkmaz 2014; Liu 2012) and a trial that was included in the previous version of the review has now been excluded as it was not clear that the control and intervention groups were comparable, and both groups received iron (Hemminki 1991). We confirmed that seven trials are still ongoing. Forty‐four trials involving 43,274 women contributed data for the comparisons in this review.

Study flow diagram.
Studies by Chanarin 1965, Dommisse 1983, Fenton 1977, Fleming 1974, Fleming 1985, Foulkes 1982, Freire 1989, Groner 1986, Han 2011, Hoa 2005 (C), Ma 2010, Simmons 1993, Suharno 1993, Sun 2010 and Tholin 1993 were all assessed as eligible for inclusion but these studies have not contributed data to the review. We were not able to include data, either because the studies did not report data on any of the review's prespecified outcomes, or because the results were not presented in a way that allowed us to enter them into the analyses (e.g. results were not reported separately for randomised groups, or standard deviations or standard errors were not reported for continuous outcomes). In addition, two studies that were otherwise eligible for inclusion (Butler 1967; Kuizon 1979) had such serious attrition (up to 80% for some outcomes) that we considered results were difficult to interpret, and we have not included data from these trials in the review. Details of all included studies can be found in the Characteristics of included studies tables.
In addition to the published papers, abstracts and reports identified by the search, several trial authors provided additional unpublished information for inclusion in the review, including individual patient data sets for ad hoc statistical analysis (Butler 1967; Eskeland 1997; Lee 2005); some authors provided re analysed data for this review (Christian 2003 (C); Makrides 2003; Paintin 1966), or additional information useful for description and 'Risk of bias' assessment of the studies (Cogswell 2003; Freire 1989; Harvey 2007; Siega‐Riz 2001; Zeng 2008 (C); Ziaei 2007; Ziaei 2008).
For the trials contributing to the analyses, we have treated a study carried out collaboratively in two different sites as two different trials, one conducted in Rotterdam (Wallenburg 1983) and one conducted in Antwerp (Buytaert 1983). Some trials included more than two arms and may therefore, be included in more than one comparison.
Included studies
Sixty‐one studies were included in this review.
Settings
The studies included in the review were carried out since 1936 in countries across the globe: 24 trials in Europe with 12 trials in United Kingdom (Butler 1967; Chanarin 1965; Chisholm 1966;.Chanarin 1971; Fenton 1977; Foulkes 1982; Harvey 2007; Kerr 1958; Paintin 1966; Taylor 1982 Willoughby 1967; Wills 1947); two trials in Norway (Eskeland 1997; Romslo 1983); one trial in Finland (Puolakka 1980); two trials in Sweden (Svanberg 1975; Tholin 1993); two trials in The Netherlands (Van Eijk 1978; Wallenburg 1983); one each in Denmark (Milman 1991); Ireland (Barton 1994); Belgium (Buytaert 1983); France (De Benaze 1989); and Italy (Tura 1989).
Eleven trials were conducted in the Americas with eight trials conducted in the United States of America (Cogswell 2003; Corrigan 1936; Groner 1986; Holly 1955; Hood 1960; Meier 2003; Pritchard 1958; Siega‐Riz 2001); one in Canada (Cantlie 1971); one in Ecuador (Freire 1989); and one in Jamaica (Simmons 1993). Four trials were conducted in Africa with one trial in South Africa (Dommisse 1983); one in Nigeria (Fleming 1985); one in Gambia (Menendez 1994 (C)); and one in Niger (Preziosi 1997). Four trials were conducted in Iran (Falahi 2010; Ouladsahebmadarek 2011; Ziaei 2007; Ziaei 2008). One trial was conducted in Hong Kong (Chan 2009), and five in China (Han 2011; Liu 2000; Ma 2010; Sun 2010; Zeng 2008 (C)). Three trials were conducted in Australia (Fleming 1974; Hankin 1963; Makrides 2003). Eight trials were conducted in Asia with one trial each in Myanmar (Burma) (Batu 1976); Thailand (Charoenlarp 1988); Nepal (Christian 2003 (C)); Vietnam (Hoa 2005 (C)); Philippines (Kuizon 1979); South Korea (Lee 2005); Indonesia (Suharno 1993); and Turkey (Korkmaz 2014).
Most included trials were published between the years 2000‐2009 and 1980‐1989. Two trials were published before the 1950s, three trials in the period 1950‐1959, seven trials between 1960‐1969, eight trials between 1970‐1979, 13 trials in the period 1980‐1989, nine trials between 1990‐1999, 13 trials in the period 2000‐2009 and only six included trials have been published since 2010 to the present.
Twenty‐three studies were conducted in countries that in 2011 (WHO 2014c; WHO 2011c) had some malaria risk in parts of the country, of diverse characteristics (Batu 1976; Chan 2009; Charoenlarp 1988; Christian 2003 (C); Dommisse 1983; Falahi 2010; Fleming 1985; Freire 1989; Han 2011; Hoa 2005 (C); Kuizon 1979; Lee 2005; Liu 2000; Ma 2010; Menendez 1994 (C); Ouladsahebmadarek 2011; Preziosi 1997; Simmons 1993; Suharno 1993; Sun 2010; Zeng 2008 (C); Ziaei 2007; Ziaei 2008). Only two of these reported malaria outcomes (Fleming 1985; Menendez 1994 (C)). In some of these countries/territories, malaria is present only in certain areas or up to a particular altitude. In many countries, malaria has a seasonal pattern (WHO 2011c). These details as well as information on the predominant malaria species, status of resistance to antimalarial drugs for each country where an included study was conducted were extracted for 2011 (WHO 2011c) and provided in the notes section of the Characteristics of included studies tables. Thirty‐seven of the included trials, mostly from Australia, Canada, United States of America, or countries in Europe were carried out in areas that generally are considered malaria‐free.
Participants
In 24 trials it was specifically stated that all women recruited were non‐anaemic at the start of supplementation (Barton 1994; Buytaert 1983; Cantlie 1971; Chisholm 1966; Cogswell 2003; De Benaze 1989; Eskeland 1997; Falahi 2010; Harvey 2007; Korkmaz 2014; Liu 2000; Makrides 2003; Meier 2003; Liu 2012; Ouladsahebmadarek 2011; Puolakka 1980; Romslo 1983; Siega‐Riz 2001; Svanberg 1975; Tholin 1993; Tura 1989; Wallenburg 1983; Ziaei 2007; Ziaei 2008). For the remaining trials, it was not always stated whether or not women were anaemic and some studies included some women with mild and moderate anaemia so samples were mixed in terms of women's anaemia status at the start of supplementation. In some of these trials it was specifically stated that women with severe anaemia were excluded (Batu 1976; Butler 1967; Chan 2009; Charoenlarp 1988; Kerr 1958; Korkmaz 2014; Paintin 1966; Willoughby 1967). Five studies specifically recruited women with mild and moderate anaemia (Hb between 80 to 110 g/L), but none of these trials contribute data to the review (Han 2011; Ma 2010; Simmons 1993; Suharno 1993; Sun 2010).
In most of the trials, women began taking supplements before 20 weeks' gestation and continued taking supplements up until delivery. In 13 trials supplementation started at or after 20 weeks' gestation (Batu 1976; Chanarin 1965; Chisholm 1966; Eskeland 1997; Fleming 1974; Freire 1989; Hood 1960; Kerr 1958; Korkmaz 2014; Makrides 2003; Menendez 1994 (C); Paintin 1966; Preziosi 1997). In 16 studies it was not clear at what gestational age women started to take supplements, or gestational ages were mixed and samples included both women who started supplements before and after the 20th week of pregnancy (Cantlie 1971; Charoenlarp 1988; Corrigan 1936; Fleming 1985; Hankin 1963; Holly 1955; Kuizon 1979; Lee 2005; Liu 2000; Ma 2010; Meier 2003; Pritchard 1958; Simmons 1993; Suharno 1993; Sun 2010; Willoughby 1967).
Interventions
Daily iron dose
The daily dose of elemental iron in some of the groups in the included trials ranged between 9 mg to 900 mg of elemental iron daily. One trial provided 9 mg elemental iron daily (Eskeland 1997); one trial provided 12 mg elemental iron (Paintin 1966); one trial provided 20 mg elemental iron daily (Makrides 2003); one trial provided 27 mg elemental iron (Eskeland 1997); six trials provided 30 mg elemental iron (Chanarin 1971; Cogswell 2003; Lee 2005; Ouladsahebmadarek 2011; Siega‐Riz 2001; Zeng 2008 (C); one trial provided 40 mg elemental iron (Tura 1989); one trial 45 mg elemental iron (De Benaze 1989); one trial 50 mg elemental iron (Ziaei 2007, Ziaei 2008); and one trial 55 mg elemental iron (Hood 1960); 18 trials provided 60 mg elemental iron (Barton 1994; Batu 1976; Chan 2009; Christian 2003 (C); Falahi 2010; Fenton 1977; Fleming 1974; Fleming 1985; Groner 1986; Han 2011; Hoa 2005 (C); Korkmaz 2014; Ma 2010; Meier 2003; Menendez 1994 (C); Suharno 1993; Sun 2010; Zeng 2008 (C)); two trials provided 65 mg of elemental iron (Kuizon 1979; Taylor 1982); one trial 66 mg elemental iron (Milman 1991); two trials provided 78 mg elemental iron (Cantlie 1971; Freire 1989); one trial provided 80 mg elemental iron (Wills 1947); eight trials provided 100 mg of elemental iron (Foulkes 1982; Hankin 1963; Harvey 2007; Liu 2000; Preziosi 1997; Simmons 1993; Tholin 1993; Van Eijk 1978); five trials provided 105 mg of elemental iron daily (Buytaert 1983; Kerr 1958; Paintin 1966; Wallenburg 1983; Willoughby 1967); one trial provided 112 mg elemental iron (Pritchard 1958); two trials provided 120 mg of elemental iron (Charoenlarp 1988; Dommisse 1983); one trial provided 122 mg of elemental iron (Butler 1967); three trials provided 200 mg of elemental iron (Puolakka 1980; Romslo 1983; Svanberg 1975); one trial 220 mg elemental iron (Hood 1960); one trial 240 mg of elemental iron (Charoenlarp 1988); and one trial 900 mg elemental iron (Chisholm 1966). One trial did not report the amount of iron as elemental iron and only referred the amount provided as a total daily dose 0.6 g of ferrous sulphate (Corrigan 1936), while another referred a dose of 1 g of iron salt daily (Holly 1955).
Folic acid daily dose
For trials providing folic acid daily as part of the intervention, the doses ranged from 10 μg (0.01 mg) folic acid to 5000 μg (5 mg) folic acid daily along with the iron. In one trial each, the dose of folic acid provided was: 10 μg (0.01 mg) folic acid (Chanarin 1965); 30 μg (0.03 mg) folic acid (Chanarin 1965); 100 μg (0.1 mg) of folic acid (Willoughby 1967); 175 μg (0.17 mg) folic acid (Lee 2005); 250 μg (0.25 mg) folic acid (Hoa 2005 (C)); 300 μg (0.3 mg) of folic acid (Willoughby 1967). In three trials, participants received a daily dose of 350 μg (0.35 mg) folic acid (Foulkes 1982; Lee 2005; Taylor 1982). In six trials the daily doses provided to participants in some of the groups were: 400 μg (0.4 mg) folic acid (Christian 2003 (C); Korkmaz 2014; Ma 2010; Simmons 1993; Sun 2010; Zeng 2008 (C)); 450 μg (0.45 mg) folic acid (Willoughby 1967); three trials provided 500 μg (0.5 mg) folic acid daily (Chisholm 1966; Fleming 1974; Siega‐Riz 2001); five trials provided participants in some of the groups with 1000 μg (1 mg) folic acid daily (Barton 1994; Batu 1976; Fleming 1985; Meier 2003; Ziaei 2007); and one trial provided participants in some of the groups with 3400 μg (3.4 mg) of folic acid daily (Butler 1967). Four trials of iron and folic acid supplementation provided 5000 μg (5 mg) folic acid daily (Charoenlarp 1988; Chisholm 1966; Fleming 1974; Menendez 1994 (C).
Type of iron compounds
With the exception of six trials that explicitly described the supplements as slow or sustained release (Buytaert 1983; Hood 1960; Liu 2000; Simmons 1993; Svanberg 1975; Wallenburg 1983), all other trials appeared to be standard preparations.
Eight trials did not specify the iron compound used in the trials and described the iron daily dose only in terms of elemental iron (Barton 1994; Fleming 1985; Foulkes 1982; Korkmaz 2014; Makrides 2003; Ouladsahebmadarek 2011; Paintin 1966; Zeng 2008 (C)).
Most supplements used in trials were equivalent or lower, rather than high relative bioavailability iron compounds (ferrous sulphate and ferrous fumarate). Thirty‐six trials used iron supplements in one of the groups that was provided as ferrous sulphate (Batu 1976; Butler 1967; Buytaert 1983; Chan 2009; Charoenlarp 1988; Cogswell 2003; Corrigan 1936; Dommisse 1983; Falahi 2010; Fenton 1977; Fleming 1974; Freire 1989; Han 2011; Hoa 2005 (C); Holly 1955; Hood 1960; Kerr 1958; Kuizon 1979; Lee 2005; Liu 2000; Ma 2010; Meier 2003; Menendez 1994 (C); Puolakka 1980; Romslo 1983; Siega‐Riz 2001; Simmons 1993; Suharno 1993; Sun 2010; Svanberg 1975; Taylor 1982; Tholin 1993; Van Eijk 1978; Wallenburg 1983; Ziaei 2007; Ziaei 2008). Six trials used ferrous fumarate as the form of iron provided to the participants (Chanarin 1965; Chanarin 1971; Christian 2003 (C); Eskeland 1997; Groner 1986; Milman 1991). One trial used ferrous iron (Cantlie 1971).
Ferrous gluconate was used in six included trials (Chisholm 1966; Hankin 1963; Harvey 2007; Kerr 1958; Pritchard 1958; Wills 1947). Two trials used ferrous betainate hydrochloride (De Benaze 1989; Preziosi 1997), one trial used heme iron from porcine blood (Eskeland 1997), one trial used ferritin in a micro granulated gastric resistant capsule (Tura 1989), one used chelated iron aminoates (Willoughby 1967), and one study (Han 2011) used iron EDTA.
Bioavailability of iron compounds is assessed in comparison (relative) to ferrous sulphate.
Supervision and co‐interventions
In most of the studies, women took the supplements without supervision. Some trials report that intake of the supplements was supervised in all or some of the groups (Batu 1976; Charoenlarp 1988; Preziosi 1997). In Christian 2003 (C), the intake was unsupervised but trial personnel visited women twice each week to monitor supplement intake.
Some studies included co‐interventions in addition to the iron or iron + folic acid supplement. For example, in the study by Cantlie 1971, participants from both groups received one tablet of multiple micronutrient supplement daily containing: 2 mg copper citrate, 6 mg magnesium stearate, 0.3 mg manganese carbonate, 1000 IU vitamin A , 500 IU vitamin D, bone flour 130 mg, 1 mg vitamin B1, 1 mg vitamin B2, 50 mg brewer yeast concentrate, 5 mg niacinamide, 25 mg vitamin C, 0.2 mg sodium iodide and 0.049 μg folate (naturally occurring), and in Christian 2003 (C), all participants were offered a 1000 μg retinol equivalents vitamin A supplement daily and deworming treatment (albendazole 400 mg single dose) in the second and third trimester. In Fleming 1974, all participants received 50 mg of ascorbic acid daily from the first visit until the 20th week. In Fleming 1985, the participants from the groups included in this review received chloroquine 600 mg base once, followed by proguanil 100 mg per day. In Menendez 1994 (C), all pregnant women received a weekly tablet of 5000 μg (5 mg) of folic acid but no antimalarial chemoprophylaxis. In the study by Siega‐Riz 2001, folic acid supplements were prescribed for all women who had received the positive pregnancy test until the first prenatal visit. In Simmons 1993, all women received 400 μg (0.4 mg) of folic acid.
Intervention settings and health worker cadre
In the majority of these studies (52 studies, 86%), the intervention was delivered in hospital or community‐based antenatal clinics usually by physicians or other healthcare professionals including midwives, dieticians or social workers. In eight of the studies the intervention was delivered by community workers, traditional birth attendants or village‐based healthcare staff, and supplements were provided during visits to women's homes or in local community settings. The supplements were provided by village‐based traditional birth attendants in the study by Menendez 1994 (C). In the Han 2011 trial, village nurses made visits to women's homes to deliver supplements and monitor women's health. Community health or village workers were involved in delivering supplementation programmes in the trials by Charoenlarp 1988; Christian 2003 (C); Hoa 2005 (C); Ma 2010; Suharno 1993; and Sun 2010.
Comparisons
Comparison 1: the 44 trials that contributed data compared the effects of any daily oral supplements containing iron versus same daily oral supplements without iron. This included data from 35 trials that compared the effects of daily iron supplementation with the effects of no iron or placebo (Batu 1976; Buytaert 1983; Chan 2009; Chanarin 1971; Charoenlarp 1988; Chisholm 1966; Cogswell 2003; Corrigan 1936; De Benaze 1989; Eskeland 1997; Falahi 2010; Hankin 1963; Harvey 2007; Holly 1955; Hood 1960; Kerr 1958; Korkmaz 2014; Liu 2012; Makrides 2003; Meier 2003; Menendez 1994 (C); Milman 1991; Ouladsahebmadarek 2011; Paintin 1966; Preziosi 1997; Pritchard 1958; Puolakka 1980; Romslo 1983; Svanberg 1975; Tura 1989; Van Eijk 1978; Wallenburg 1983; Willoughby 1967; Wills 1947; Ziaei 2008). Data from eight trials included in this comparison evaluated the effects of daily iron + folic acid supplementation with the effects of no treatment (Barton 1994; Batu 1976; Charoenlarp 1988; Chisholm 1966; Christian 2003 (C); Lee 2005; Taylor 1982; Willoughby 1967). Data from one study (Christian 2003 (C)) which met the criteria for high quality examined groups receiving daily iron + folic acid versus women receiving folic acid (without iron), with vitamin A supplementation as co‐intervention. Six studies provided data comparing the effects of daily iron + folic acid with daily folic acid alone (without iron) supplementation (Batu 1976; Chisholm 1966; Christian 2003 (C); Liu 2012; Zeng 2008 (C); Ziaei 2007). Data from four studies compared women receiving oral iron + other vitamins and minerals with women receiving other vitamins and minerals (without iron) supplementation (Cantlie 1971; Liu 2000; Ouladsahebmadarek 2011; Siega‐Riz 2001). Some trials provide data from different arms of the study for different comparisons. Of all the studies that provided data in this comparison, 15 trials were of high quality according to our pre‐established criteria (Barton 1994; Buytaert 1983; Chisholm 1966; Christian 2003 (C); Cogswell 2003; Eskeland 1997; Harvey 2007; Makrides 2003; Preziosi 1997; Siega‐Riz 2001; Tura 1989; Wallenburg 1983; Zeng 2008 (C); Ziaei 2007; Ziaei 2008).
Comparison 2: eight trials compared the effects of daily iron + folic acid supplementation with the effects of same supplements without iron + folic acid (no iron + folic acid or placebo). Seven of them compared the effects of daily iron + folic acid supplementation with the effects of no treatment (Barton 1994; Batu 1976; Charoenlarp 1988; Chisholm 1966; Lee 2005; Taylor 1982; Willoughby 1967). Only two of these (Barton 1994; Chisholm 1966), met the criteria for high quality. No studies compared women receiving daily oral iron + folic acid + other vitamins and minerals with women receiving other vitamins and minerals (without iron + folic acid). One study (Christian 2003 (C)) included a group that compared daily iron + folic acid supplementation in comparison to no treatment, considering the vitamin A supplementation and deworming as co‐interventions in the compared groups.
Comparison 3: 33 trials compared the effects of daily iron alone supplementation with the effects of no iron or placebo (Batu 1976; Buytaert 1983; Chan 2009; Chanarin 1971; Charoenlarp 1988; Chisholm 1966; Cogswell 2003; Corrigan 1936; De Benaze 1989; Eskeland 1997; Falahi 2010; Hankin 1963; Harvey 2007; Holly 1955; Hood 1960; Kerr 1958; Korkmaz 2014; Makrides 2003; Meier 2003; Menendez 1994 (C); Milman 1991; Paintin 1966; Preziosi 1997; Pritchard 1958; Puolakka 1980; Romslo 1983; Svanberg 1975; Tura 1989; Van Eijk 1978; Wallenburg 1983; Willoughby 1967; Wills 1947; Ziaei 2008). Of these, 12 trials were of high quality according to our pre‐established criteria (Buytaert 1983; Chisholm 1966, Cogswell 2003; Christian 2003 (C); Eskeland 1997; Harvey 2007; Korkmaz 2014; Makrides 2003; Preziosi 1997;Tura 1989; Wallenburg 1983; Ziaei 2008).
Comparison 4: eight trials compared the effects of daily iron + folic acid supplementation with the effects of no treatment (Barton 1994; Batu 1976; Charoenlarp 1988; Chisholm 1966; Christian 2003 (C); Lee 2005; Taylor 1982; Willoughby 1967). Only three of them (Barton 1994; Chisholm 1966; Christian 2003 (C)), met the criteria for high quality. One study (Christian 2003 (C)), included a group that compared daily iron + folic acid supplementation in comparison to no treatment, considering the vitamin A supplementation and deworming as co‐interventions in the compared groups.
Comparison 5: five studies compared the effects of daily iron + folic acid with daily folic acid alone (without iron) supplementation (Batu 1976; Chisholm 1966; Christian 2003 (C); Zeng 2008 (C); Ziaei 2007). Four of the trials met the criteria for high quality (Chisholm 1966; Christian 2003 (C); Zeng 2008 (C); Ziaei 2007). The study (Christian 2003 (C)) included a group that compared daily iron + folic acid supplementation in comparison daily folic acid alone, considering the vitamin A supplementation and deworming as co‐interventions in the compared groups.
Comparison 6: three studies compared women receiving oral iron + other vitamins and minerals with women receiving other vitamins and minerals (without iron) supplementation (Cantlie 1971; Ouladsahebmadarek 2011; Siega‐Riz 2001). One of the studies met the criteria for high quality (Siega‐Riz 2001). One group in the study Liu 2000, provided iron with vitamin C, but the comparison groups had different nutrients.
Comparison 7: no studies compared women receiving daily iron + folic acid + other vitamins and minerals versus women receiving folic acid and other vitamins and minerals (without iron).
Comparison 8: no studies compared women receiving daily oral iron + folic acid + other vitamins and minerals with women receiving same other vitamins and minerals (without iron + folic acid).
See the tables of Characteristics of included studies for a detailed description of all the studies. All included studies met the pre‐stated inclusion criteria.
Excluded studies
Altogether, we excluded 136 studies; some studies were excluded for more than one reason. The main reason for excluding studies was that participants in all arms of trials received iron and were therefore not eligible for any of the comparisons included in this review. This reason applied to a total of 95 trials.
-
In 49 trials women received different types of iron (for example ferrous iron versus iron fumarate), or women received iron with or without other vitamins or supplements (Afifi 1978; Babior 1985; Balmelli 1974; Burslem 1968; Buss 1981; Carrasco 1962; Castren 1968; Chanarin 1968; Coelho 2000; Dawson 1987; Dijkhuizen 2004; Ekstrom 1996; Fletcher 1971; Giles 1971; Gringras 1982; Hartman‐Craven 2009; Hosokawa 1989; Hossain 2014; Kaestel 2005; Kann 1988; Lira 1989; Ma 2008; Mbaye 2006; Metz 1965; Hemminki 1991; Milman 2014; Parkkali 2013: Morrison 1977; Nogueira 2002; Ogunbode 1984; Ogunbode 1992; Osrin 2005; Payne 1968; Rae 1970; Ramakrishnan 2003; Rayado 1997; Rolschau 1979; Roth 1980; Rybo 1971; Saha 2007; Shatrugna 1999; Sjostedt 1977; Srisupandit 1983; Stone 1975; Trigg 1976; Weil 1977; West 2014; Willoughby 1966; Willoughby 1968;).
-
In 38 trials both groups received iron and either different doses or regimens of iron supplementation were compared (Aaseth 2001; Ahn 2006; Arija 2014; Brown 1972; Guldholt 1991; Horgan 1966; Madan 1999; Milman 2005; Nguyen 2008; Reddaiah 1989; Thane‐Toe 1982; Thomsen 1993; Vogel 1963; Zhou 2009), or different types of regimen (for example, daily versus weekly iron) (Agrawal 2011; Bhatla 2009; Casanueva 2003a; Chew 1996a; Chew 1996b; Ekstrom 2002; Gomber 2002; Goonewardene 2001; Grover 1998; Hemminki 1991; Liu 1996; Mukhopadhyay 2004; Mumtaz 2000; Peña‐Rosas 2003; Pita Martin 1999; Quintero 2004; Ridwan 1996; Robinson 1998; Rukhsana 2006; Winichagoon 2003; Yecta 2011; Young 2000; Yu 1998; Zamani 2008). (Daily versus intermittent oral iron regimens in pregnancy are examined in a related Cochrane review (Peña‐Rosas 2012a)).
-
In seven trials different types of administration were compared (for example, intravenous iron versus oral supplements) (Bencaiova 2007; Kumar 2005; Sinha 2011; Sood 1979; Swain 2011; Wali 2002; Zutschi 2004).
-
In two trials both groups received iron and one group received an additional intervention such as education (Adhikari 2009; Sachdeva 1993).
The second most frequent reason for exclusion was that the studies were not prospective, parallel, randomised controlled trials. A total of 20 trials were excluded for this reason (Abel 2000; Angeles‐Agdeppa 2003; Berger 2003; Chawla 1995; Dawson 1962; Edgar 1956; Gopalan 2004; Iyengar 1970; Kulkarni 2010; Menon 1962; Morgan 1961; Ortega‐Soler 1998; Osifo 1970; Powers 1985; Roztocil 1994; Sandstad 2003; Schoorl 2012; Tange 1993; Wu 1998; Young 2010).
The remaining studies were excluded for other reasons: the studies by Bergsjo 1987 and Steer 1992 were not completed, and results are not available for the Hawkins 1987 trial; studies by Hermsdorf 1986, Tampakoudis 1996 and Tan 1995 were reported as abstracts and there was insufficient information on methods to allow us to assess risk of bias; Cook 1990, Khambalia 2009 and Picha 1975 did not examine iron supplementation in pregnant women; and Hampel 1974 recruited women, and reported outcomes at different gestational ages so we were unable to interpret results; Bokhari 2011 and McKenna 2002 looked at iron fortified food or drink; in the study from Khambalia 2009 the iron and folic acid were delivered as point‐of‐use fortification of foods (Sprinkles®); and finally, Blot 1980 and Seck 2008 examined comparisons outside the scope of this review.
Risk of bias in included studies
See the 'Risk of bias' tables included in Characteristics of included studies for an assessment of the risk of bias for each included trial and Figure 2 and Figure 3 for an overall summary of the methodological quality of all included trials. In the description below we have summarised risk of bias only for those 44 trials contributing outcome data to the review.

'Risk of bias' graph: review authors' judgements about each risk of bias item presented as percentages across all included studies.

'Risk of bias' summary: review authors' judgements about each risk of bias item for each included study.
In the 'Summary of findings' tables we examined risk of bias for each outcome separately, considering only those trials contributing data for each primary outcome.
Allocation
Sequence generation
We assessed 21 trials as having adequate methods for generating the randomisation sequence (Barton 1994; Buytaert 1983; Chan 2009; Charoenlarp 1988; Christian 2003 (C); Cogswell 2003; Eskeland 1997; Harvey 2007; Kerr 1958; Korkmaz 2014; Lee 2005; Liu 2012; Makrides 2003; Meier 2003; Preziosi 1997; Siega‐Riz 2001; Tura 1989; Wallenburg 1983; Zeng 2008 (C); Ziaei 2007; Ziaei 2008). Eighteen trials did not report or did not state clearly the randomisation method used (Batu 1976; Cantlie 1971; Chisholm 1966; De Benaze 1989; Falahi 2010; Holly 1955; Hood 1960; Menendez 1994 (C); Milman 1991; Ouladsahebmadarek 2011; Paintin 1966; Pritchard 1958; Puolakka 1980; Romslo 1983; Svanberg 1975; Taylor 1982; Van Eijk 1978; Willoughby 1967). Four trials were quasi‐randomised using alternate sequence allocation (Chanarin 1971; Corrigan 1936; Hankin 1963; Wills 1947).
In three of these trials clusters rather than individual women were randomised (Christian 2003 (C); Menendez 1994 (C); Zeng 2008 (C)).
Allocation concealment
We judged that 20 trials had adequate methods of allocation concealment (Buytaert 1983; Chan 2009; Chisholm 1966; Christian 2003 (C); Cogswell 2003; De Benaze 1989; Eskeland 1997; Falahi 2010; Harvey 2007; Korkmaz 2014; Liu 2012; Makrides 2003; Paintin 1966; Preziosi 1997; Siega‐Riz 2001; Tura 1989; Wallenburg 1983; Zeng 2008 (C); Ziaei 2007; Ziaei 2008). The method of concealing allocation used in the remaining trials was unclear (Barton 1994; Batu 1976; Cantlie 1971; Charoenlarp 1988; Holly 1955; Hood 1960; Kerr 1958; Liu 2000; Lee 2005; Meier 2003; Milman 1991; Ouladsahebmadarek 2011; Pritchard 1958; Puolakka 1980; Romslo 1983; Svanberg 1975; Taylor 1982; Willoughby 1967). Some trials used an inadequate method or did not use any allocation concealment at all (Chanarin 1971; Corrigan 1936; Hankin 1963; Liu 2000; Menendez 1994 (C); Van Eijk 1978; Wills 1947).
Blinding
Blinding of participants, staff (performance bias)
Investigators in 20 trials attempted to blind participants and staff by using placebos of similar appearance to active treatment or coded or opaque bottles (Barton 1994; Batu 1976; Chanarin 1971; Chisholm 1966; Christian 2003 (C); Cogswell 2003; De Benaze 1989; Eskeland 1997; Falahi 2010; Korkmaz 2014; Liu 2012; Makrides 2003; Meier 2003; Ouladsahebmadarek 2011; Paintin 1966; Preziosi 1997; Siega‐Riz 2001; Svanberg 1975; Ziaei 2007; Ziaei 2008). In the remaining trials, blinding was either not mentioned or not attempted, or we were not clear whether or not attempted blinding would be convincing to women and or staff (e.g. where placebo and active treatment were not identical).
Blinding of outcome assessors (detection bias)
The majority of the trials (34) were assessed as being at low risk of bias for detection bias, this was irrespective of whether or not a placebo was provided as we judged that for most outcomes (e.g. Hb level or iron‐deficiency anaemia), the fact that there was no blinding of women or staff providing care was unlikely to impact on these sorts of laboratory outcomes. In nine cases we were not clear whether lack of blinding could lead to bias (Buytaert 1983; Chan 2009; Chanarin 1971; Charoenlarp 1988; Corrigan 1936; Hankin 1963; Hood 1960; Kerr 1958; Zeng 2008 (C)). This was because in some cases lack of blinding may have led to a change in clinical management of some women (e.g. women who developed anaemia were identified and withdrawn from trials or received additional treatment), or we thought that only certain outcomes would be blinded and others would not be (e.g. where those staff providing an unmasked intervention also collected data on side effects).
Incomplete outcome data
We judged that trials with more than 20% loss to follow‐up, or with imbalanced loss to follow‐up in different arms of trials were inadequate in terms of completeness of outcome data. Ten trials were assessed as having high levels of attrition, or loss was not balanced across groups and may have occurred for reasons associated with treatment (for example, if women were withdrawn from trials if they experienced side effects) (Batu 1976; Cantlie 1971; Chan 2009; Christian 2003 (C); Cogswell 2003; Eskeland 1997; Kerr 1958; Meier 2003; Menendez 1994 (C); Siega‐Riz 2001).
Selective reporting
We did not formally assess outcome reporting bias; for most of the included trials we did not have access to study protocols and assessing outcome reporting bias from published reports alone can be difficult. However, we have noted in the Characteristics of included studies tables where we suspected a problem relating to outcome reporting. Although for most outcomes too few studies contributed data to allow us to examine possible publication bias through generating funnel plots, in the data and analyses tables and in the forest plots, we have arranged studies by weight to allow us to visually examine plots to decide whether there is any evidence of a greater effect size in smaller studies.
Other potential sources of bias
We have noted other concerns about studies in the notes and other 'Risk of bias' sections of the Characteristics of included studies tables.
Effects of interventions
See: Summary of findings for the main comparison (Infant outcomes) Any supplements containing iron compared with same supplements without iron or no treatment/placebo (no iron or placebo) for pregnant women; Summary of findings 2 (Maternal outcomes) Any supplements containing iron compared with same supplements without iron or no treatment/placebo (no iron or placebo) for pregnant women; Summary of findings 3 (Infant outcomes) Any supplements containing iron and folic acid compared with same supplements without iron nor folic acid (no iron nor folic acid or placebo) for pregnant women; Summary of findings 4 (Maternal outcomes) Any supplements containing iron and folic acid compared with same supplements without iron nor folic acid (no iron nor folic acid or placebo) for pregnant women
In this review we have included data from 44 trials, involving 43,274 women although in trials that included more than two treatment arms, we may not have included all arms in our analyses. We have organised the summary of results by supplementation regimens compared, and by primary and secondary outcomes. Most of the included studies focused on haematological indices and few reported on any of the other outcomes prespecified in the review protocol. Many of the findings showed heterogeneity that could not be explained by standard sensitivity analyses including quality assessment, and so we used a random‐effects model to analyse the results. All results therefore represent the average treatment effect. Using random‐effects means that for many outcomes the width of the 95% CIs is increased compared with using a fixed‐effect model.
See the Data and analyses section for detailed results on primary and secondary outcomes.
For each comparison we have indicated the number of studies contributing data to that comparison. Some studies, with more than two treatment arms are included in more than one comparison. For most outcomes only a relatively small proportion of studies included in the comparison reported data; for some outcomes a single study reported results; for this reason we have indicated for each outcome the number of studies contributing data and the number of women included in those studies. For those outcomes including data from cluster‐randomised trials the number included is the effective sample size; that is, sample sizes and event rates have been adjusted for cluster‐trials to take account of the design effect.
(1) Any supplements containing iron versus same supplements without iron or no treatment/placebo (no iron or placebo) (44 studies)
Infant outcomes
Low birthweight (less than 2500 g)
Overall, iron supplements reduced the prevalence of low birthweight (less than 2500 g) although using random‐effects analysis the difference between groups did not reach statistical significance. Among 17,613 women in 11 trials, 8.4% of those who took daily iron supplementation during pregnancy had a baby with birthweight below 2500 g versus 10.2% of those who received no iron or placebo (average risk ratio (RR) 0.84; 95% confidence interval (CI) 0.69 to 1.03, evidence assessed as low quality) (Analysis 1.1). There was no clear evidence of differences between subgroups (Analysis 1.2; Analysis 1.3; Analysis 1.4; Analysis 1.5), or obvious funnel plot asymmetry (Figure 4).
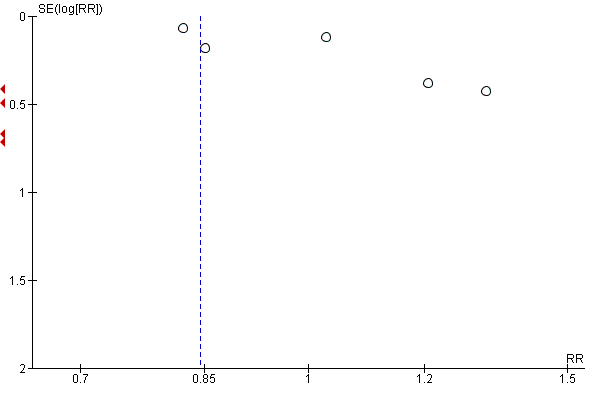
Funnel plot of comparison: 1 Any supplements containing iron versus same supplements without iron or no treatment/placebo (no iron or placebo), outcome: 1.1 Low birthweight (less than 2500 g) (ALL).
Birthweight (g)
Among infants born to 18,590 participants in 15 trials, women receiving supplements had slightly heavier newborns compared with women in the control group, but the difference between groups was not statistically significant. The mean difference (MD) in birthweight between those whose mothers had taken iron supplements and those whose mothers had not was 23.75 g (95% CI ‐3.02 to 50.51, moderate quality evidence) (Analysis 1.6). We did not find evidence of subgroup differences (Analysis 1.7; Analysis 1.8; Analysis 1.9; Analysis 1.10), or obvious funnel plot asymmetry (Figure 5).

Funnel plot of comparison: 1 Any supplements containing iron versus same supplements without iron or no treatment/placebo (no iron or placebo), outcome: 1.6 Birthweight (g) (ALL).
Preterm birth (less than 37 weeks' gestation)
Thirteen trials with 19,286 women provided data on preterm birth (before 37 week's gestation); while women receiving iron supplements were less likely to experience premature delivery the difference between groups did not reach statistical significance (average RR 0.93; 95% CI 0.84 to 1.03, moderate quality evidence).There was no clear evidence of differences between subgroups (Analysis 1.12; Analysis 1.13; Analysis 1.14; Analysis 1.15). Visual inspection of the funnel plot for this outcome suggested that smaller studies tended to report more pronounced treatment effects (Figure 6).
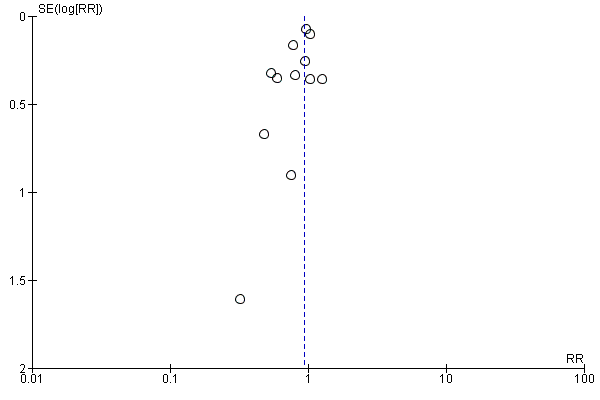
Funnel plot of comparison: 1 Any supplements containing iron versus same supplements without iron or no treatment/placebo (no iron or placebo), outcome: 1.11 Preterm birth (less than 37 weeks of gestation) (ALL).
Neonatal death
Four studies with 16,603 participants reported neonatal mortality and there was no clear evidence of any difference between groups (average RR 0.91; 95% CI 0.71 to 1.18, low quality evidence) (Analysis 1.16). We did not find evidence of subgroup differences for this outcome (Analysis 1.17; Analysis 1.18; Analysis 1.19; Analysis 1.20).
Congenital anomalies
Four studies with 14,636 women reported the number of infants with congenital anomalies; there was no clear evidence of any difference between groups (average RR 0.88; 95% CI 0.58 to 1.33) (Analysis 1.21).
Maternal primary outcomes
Maternal anaemia at term (Hb less than 110 g/L at 37 weeks' gestation or more)
Among 2199 women in 14 trials (Batu 1976; Chanarin 1971; Chisholm 1966; Cogswell 2003; De Benaze 1989; Eskeland 1997; Holly 1955; Liu 2000; Makrides 2003; Milman 1991; Preziosi 1997; Pritchard 1958; Puolakka 1980; Romslo 1983), 13.06% of those who received daily iron supplements during pregnancy had anaemia at term in comparison with 35.71% who did not receive iron (average RR 0.30; 95% CI 0.19 to 0.46, low quality evidence) (Analysis 1.26). However, because the heterogeneity in study results was substantial our results have to be interpreted with caution (heterogeneity: Tau² = 0.40, I² = 80%, Chi² test for heterogeneity P < 0.00001. We did not find any differences between subgroups in most of the subgroup analyses (Analysis 1.27; Analysis 1.28; Analysis 1.29; Analysis 1.30), although the treatment effect appeared more pronounced in non‐malarial settings (Analysis 1.30: Test for subgroup differences: Chi² = 11.85, df = 1 (P = 0.0006), I² = 91.6%). Visual inspection of the funnel plot for this outcome suggested that the treatment effect was more pronounced in smaller studies (not shown) although we did not downgrade for publication bias.
Maternal iron deficiency at term (as defined by as defined by trialists, based on any indicator of iron status at 37 weeks' gestation or more)
Seven studies (1256 women) reported data for this outcome, with women in groups receiving iron as part of supplements being less likely to have iron deficiency at term (average RR 0.43; 95% CI 0.27 to 0.66, low quality evidence) (Analysis 1.31). Subgroup analyses suggested that mixed or unspecified anaemia status at the start of supplementation and higher doses of iron were associated with more pronounced treatment effects (test for subgroup differences: Chi² = 10.96, df = 1 (P = 0.0009), I² = 90%, and, Chi² = 19.52, df = 2 (P = 0.0001), I² = 89%, respectively) (Analysis 1.33; Analysis 1.34).
Maternal iron‐deficiency anaemia at term (Hb below 110 g/L and at least one additional laboratory indicator at 37 weeks' gestation or more)
Data from six trials involving 1088 women showed that 4.4% of women who received daily iron supplements and 13.2% of those who did not had iron‐deficiency anaemia at term (average RR 0.33; 95% CI 0.16 to 0.69). We did not find evidence of differences between subgroups (Analysis 1.37; Analysis 1.38; Analysis 1.39; Analysis 1.40).
Maternal death
In two studies including 12,560 women, there was no clear difference between groups for maternal mortality (average RR 0.33; 95% CI 0.01 to 8.19, very low quality evidence) (Analysis 1.41).
Side effects (any)
Data from 11 trials involving 2423 women suggest that there was no clear difference between groups receiving iron and those receiving placebo or no iron for reporting side effects (25.3% versus 9.91% reporting side effects respectively; average RR 1.29; 95% CI 0.83 to 2.02) (Analysis 1.42). However, the heterogeneity between the treatment effects is substantial and the results have to be interpreted with caution (heterogeneity: T2 = 0.30, I = 81%, Chi test for heterogeneity P < 0.00001). There were no clear subgroup differences (Analysis 1.43; Analysis 1.44; Analysis 1.45; Analysis 1.46). There was no obvious funnel plot asymmetry for this outcome (not shown).
Severe (Hb < 70/L) anaemia at any time during the second or third trimester
Nine trials with 2125 women reported results for this outcome, but estimable data were available for only three trials involving 786 women; this showed that women who received iron supplements were as likely to become severely anaemic during second and third trimesters (average RR 0.22; 95% CI 0.01 to 3.20, very low quality evidence). In many cases, women who became anaemic were treated and excluded from the analysis in the trials, independently of the group assigned, so very few cases became severely anaemic. As only three trials contributed estimable data, this result and the associated subgroup analysis have to be interpreted with caution.
Other maternal primary outcomes
In one study (727 women), there was no clear difference in infection during pregnancy (Analysis 1.53), low quality evidence.
Two studies reported on placental malaria and parasitaemia (Fleming 1985; Menendez 1994 (C)) and found no differences between groups.
Infant secondary outcomes
Very premature birth (less than 34 weeks' gestation)
This outcome was reported in five trials with 3743 women; results suggest that babies born to mothers receiving iron were less likely to be born before 34 weeks' gestation (average RR 0.51; 95% CI 0.29 to 0.91) (Analysis 1.59).
Infant ferritin concentration at six months in μg/L
This outcome was measured in a single study with 197 participants; at six months the MD was 11.00 (95% CI 4.37 to 17.63) (Analysis 1.61).
Other infant secondary outcomes
There was no evidence of statistically significant differences between groups for the following infant secondary outcomes: very low birthweight; low Apgar score at five minutes; mean infant Hb levels at three and six months; admission to special care; head circumference at birth; and stunting at long‐term follow‐up.
No trials reported on the remaining prespecified infant secondary outcomes such as infant anaemia or infant iron‐deficiency anaemia at birth or soon after.
Maternal secondary outcomes
Maternal Hb concentration at or near term (in g/L, at 34 weeks' gestation or more) and within six weeks postpartum period (in g/L)
Haemoglobin concentration at or near term was reported in 19 studies, involving 3704 participants. There were high levels of heterogeneity for this outcome and results should be interpreted with caution. Women who received iron were on average likely to have higher Hb levels at term (MD 8.88 g/L; 95% CI 6.96 to 10.80) (heterogeneity: Tau² = 13.92, I² = 87%, Chi² test for heterogeneity P < 0.00001) (Analysis 1.66).
At six weeks postpartum, the difference between groups remained significant with women receiving iron as part of supplements having higher Hb levels (MD 7.61; 95% CI 5.50 to 9.72; reported in seven studies with 956 women) (heterogeneity: Tau² = 3.09, I² = 40%, Chi² test for heterogeneity P = 0.12) (Analysis 1.67).
Maternal high Hb concentrations (Hb greater than 130 g/L) at any time during second or third trimester
There was evidence from nine studies (2188 women) with estimable data that high Hb concentrations were more likely in the second and third trimesters in women who had received iron as part of supplements (average RR 2.37; 95% CI 1.34 to 4.21). There was high heterogeneity for this outcome ( heterogeneity: Tau² = 0.57, I² = 89%, Chi² test for heterogeneity P < 0.00001 ) (Analysis 1.68).
Maternal high Hb concentrations at term (defined as Hb greater than 130 g/L at 37 weeks' gestation or more)
Women who received iron were at higher risk of haemoconcentration at term (average RR 3.07; 95% CI 1.18 to 8.02; reported in eight studies 2156 women). Again, there was high heterogeneity for this outcome and results should be interpreted cautiously (heterogeneity: Tau² = 1.34, I² = 96%, Chi² test for heterogeneity P < 0.00001, 95% PI 0.19 to 39.15) (Analysis 1.69).
Maternal severe anaemia at or near term (Hb less than 70 g/L at 34 weeks' gestation or more)
Data from eight trials involving 1819 women reported results for this outcome; in six trials no cases of severe anaemia were identified, so only two trials with 494 women contributed estimable data. Results from these two trials showed no significant difference between women who receive iron or not (average RR 0.47; 95% CI 0.01 to 44.11) (Analysis 1.70).
Severe anaemia at postpartum (Hb less than 80 g/L)
While eight trials reported severe anaemia in the postnatal period only two studies with estimable data for 553 women contributed to this analysis; women receiving iron as part of supplements were less at risk of severe anaemia in the weeks after the birth (average RR 0.04; 95% CI 0.01 to 0.28) (Analysis 1.71).
Transfusion provided
The number of women receiving transfusions was reported in two studies (759 participants), with no apparent difference between groups (average RR 0.96; 95% CI 0.10 to 8.98) (Analysis 1.76).
Puerperal infection
There was a statistically significant difference between groups in the number of women reported to have puerperal infection; with women receiving iron being at reduced risk, (four studies, 4374 participants) (average RR 0.68; 95% CI 0.50 to 0.92) (Analysis 1.73).
Other secondary outcomes
There was no statistically significant evidence of differences between groups for the following secondary outcomes: ante‐ or postpartum haemorrhage, individual side effects, maternal well being, placental abruption, preterm rupture of the membranes, pre‐eclampsia and moderate anaemia in the postpartum period. Several of these outcomes were reported in only a small number of studies.
No trials reported on the remaining prespecified secondary outcomes.
(2) Any supplements containing iron and folic acid versus same supplements without iron nor folic acid (no iron nor folic acid or placebo) (eight studies)
Infant primary outcomes
Low birthweight (less than 2500 g)
Two trials with 1311 participants examined this outcome (Christian 2003 (C); Taylor 1982). There was no clear evidence of significant differences between infants of women receiving daily iron + folic acid supplementation versus no supplements (average RR 1.07; 95% CI 0.31 to 3.74, low quality evidence) (Analysis 2.1). Data from the same two trials suggest that infant birthweight was higher in the supplemented group (MD 57.73; 95% CI 7.66 to 107.79, moderate quality evidence) (Analysis 2.8).
Preterm birth (less than 37 weeks' gestation)
Three studies with 1497 women examined this outcome (Christian 2003 (C); Lee 2005; Taylor 1982). We found no evidence of differences in the numbers experiencing preterm birth between women who received daily iron and folic acid supplements and those receiving no treatment or placebo (average RR 1.55; 95% CI 0.40 to 6.00, low quality evidence). Only one of these trials met the criteria for high quality (Christian 2003 (C)) (Analysis 2.3). There were no significant differences between subgroups (Analysis 2.4; Analysis 2.5; Analysis 2.6; Analysis 2.7).
Neonatal death
Three studies (1793 participants) reported on this outcome (Barton 1994; Christian 2003 (C); Taylor 1982); there were a total of 69 perinatal deaths, and no clear evidence of any difference between groups (average RR 0.81; 95% CI 0.51 to 1.30, low quality evidence) (Analysis 2.2). No subgroup differences were apparent.
Congenital anomalies
One study with 1652 women reported the number of infants with congenital anomalies; and there was no clear evidence of any difference between groups (RR 0.70; 95% CI 0.35 to 1.40), low quality evidence (Analysis 2.13).
Maternal primary outcomes
Maternal anaemia at term (Hb less than 110 g/L at 37 weeks' gestation or more)
The data from three trials including 346 women (Barton 1994; Batu 1976; Chisholm 1966) suggest that women who routinely receive daily iron and folic acid supplementation during pregnancy are less likely to have anaemia at term than those not taking any iron and folic acid supplements at all (defined as Hb less than 110 g/L) (7.2% versus 28.3%; average RR 0.34; 95% CI 0.21 to 0.54, moderate quality evidence) (Analysis 2.14). Only one study with no estimable data met the prespecified criteria for high quality. We did not identify any differences between subgroups.
Maternal iron deficiency at term (as defined by as defined by trialists, based on any indicator of iron status at 37 weeks' gestation or more)
Data from one trial involving 131 women (Lee 2005) suggest that women who routinely receive daily oral supplementation with iron are less likely to have iron deficiency at term than women taking placebo or not taking any iron and folic acid supplements at all although the difference between groups did not reach statistical significance (3.6% versus 15%; RR 0.24; 95% CI 0.06 to 0.99, low quality evidence) (Analysis 2.19).
Maternal iron‐deficiency anaemia at term (Hb less than 110 g/L and at least one additional laboratory indicator at 37 weeks' gestation or more)
No evidence of significant differences was found between women who received daily iron and folic acid supplements and those receiving no treatment or placebo in the single trial including 131 women contributing data to this analysis (RR 0.43; 95% CI 0.17 to 1.09) (Analysis 2.20). The study contributing data did not meet prespecified criteria for high quality.
Side effects (any)
One trial including 456 women (Charoenlarp 1988) suggests that women routinely receiving iron and folic acid supplementation are more likely to report any side effects; none of those receiving no supplementation reported side effects, however, the CI is very broad for this finding (RR 44.32; 95% CI 2.77 to 709.09) (Analysis 2.22), moderate quality evidence. This trial did not meet criteria for high methodological quality.
Severe anaemia at any time during second and third trimester (Hb less than 70 g/L)
Four studies including 506 women had estimable data for this outcome; there was no evidence of a statistically significant difference between groups (RR 0.12; 95% CI 0.02 to 0.63, very low quality evidence) (Analysis 2.23).
Other outcomes
One trial with 48 women reported on infection in pregnancy (Taylor 1982); there were four events in total, two in each group (Analysis 2.29), very low quality evidence. A single study reported on maternal deaths and there were no estimable data (Analysis 2.21), low quality evidence.
There were no data on the remaining prespecified primary outcomes.
Infant secondary outcomes
No evidence of significant differences was found between infants from these groups of women receiving daily iron + folic acid supplementation and those taking placebo or not taking any supplements at all in the following secondary outcomes: very low birthweight (less than 1500 g), very premature delivery, or admission to special care unit.
No trials reported on the remaining infant secondary outcomes.
Maternal secondary outcomes
Maternal Hb concentration at term (in g/L at 34 weeks' gestation or more)
The data from three trials including 140 women (Barton 1994; Batu 1976; Taylor 1982) suggest that women who routinely receive daily iron and folic acid supplementation reach term with higher Hb concentration than women taking placebo or not taking any iron and folic acid supplement at all (MD 16.13 g/L; 95% CI 12.74 to 19.52) (Analysis 2.36). The effect of iron‐folic acid supplementation was associated with higher Hb concentrations in the single high‐quality trial (MD 17.10; 95% CI 8.44 to 25.76) (Barton 1994).
Maternal high Hb concentrations at term (defined as Hb greater than 130 g/L)
No evidence of significant differences was found between women who received daily iron and folic acid supplements and those receiving no treatment or placebo (Analysis 2.39).
Maternal high Hb concentrations at any time during second or third trimesters (defined as Hb greater than 130 g/L)
No evidence of significant differences was found between women who received daily iron and folic acid supplements and those receiving no treatment or placebo (RR 1.78; 95% CI 0.63 to 5.04, two studies, 446 women) (Analysis 2.38).
Maternal Hb concentration within six weeks postpartum in g/L
Two studies (Christian 2003 (C); Taylor 1982) involving 459 women reported this outcome. The data from these trials suggest that women receiving daily iron + folic acid supplementation achieve a higher concentration of Hb at one month postpartum than women not taking any supplements at all (MD 10.07; 95% CI 7.33 to 12.81) (Analysis 2.37) but no firm conclusions can be drawn given the scarcity of the data.
Maternal severe anaemia at or near term (Hb less than 70 g/L at 34 weeks' gestation or more)
Three trials reported severe anaemia at or near term; there were estimable data for only one trial and overall only three women were identified with severe anaemia (Analysis 2.41).
Maternal severe or moderate anaemia at postpartum (Hb less than 80 g/L)
Two of three trials reported estimable data for moderate anaemia in the postpartum period and women receiving iron were less likely to have anaemia (RR 0.33; 95% CI 0.17 to 0.65) (Analysis 2.40). For severe anaemia in the postpartum period only one trial of three reported estimable data with all cases of severe anaemia occurring in the women who did not receive supplements (RR 0.05; 95% CI 0.00 to 0.76) (Analysis 2.42). The scarcity of data makes it difficult to draw any firm conclusions on these outcomes.
Other secondary maternal outcomes
No evidence of significant differences was found in the following secondary outcomes: puerperal infection, antepartum haemorrhage, postpartum haemorrhage, placental abruption, and pre‐eclampsia. No trials reported on the remaining maternal secondary outcomes.
(3) Supplementation with iron alone versus no treatment/placebo (33 studies)
Infant primary outcomes
Low birthweight (less than 2500 g)
Overall, we found no statistically significant difference in the prevalence of low birthweight (less than 2500 g) between newborns of mothers in these two groups (Analysis 3.1). Among 1136 women in six trials (Cogswell 2003; Eskeland 1997; Falahi 2010; Makrides 2003; Meier 2003; Menendez 1994 (C)), 4.3% of those who took daily iron supplementation during pregnancy had a baby with a birthweight below 2500 g versus 6.9% of those who received no iron or placebo (average RR 0.63; 95% CI 0.30 to 1.32) (Analysis 3.1). When we limited our analysis to studies meeting criteria for high quality (Cogswell 2003; Eskeland 1997; Makrides 2003; Menendez 1994 (C)), the difference in the percentage of mothers with low birthweight babies remained non‐significant (data not shown). There were no clear differences between subgroups Analysis 3.2; Analysis 3.3; Analysis 3.4; Analysis 3.5).
Birthweight (g)
We found no significant difference in birthweight (Analysis 3.6), in children from mothers of the two groups. Among infants born to 1331 participants in nine trials (Cogswell 2003; Eskeland 1997; Falahi 2010; Harvey 2007; Korkmaz 2014; Makrides 2003; Paintin 1966; Preziosi 1997; Puolakka 1980), the MD in birthweight between those whose mothers had taken iron supplements and those whose mothers had not was ‐1.04 g and was not statistically significant (95% CI ‐78.77 to 76.70) . When we temporarily removed from the analysis the studies that did not meet our criteria for high quality the results remained non‐significant (data not shown). No subgroup differences were apparent (Analysis 3.7; Analysis 3.8; Analysis 3.9; Analysis 3.10).
Preterm birth (less than 37 weeks' gestation)
Six trials with data for 1713 women provided data on preterm birth (before 37 weeks' gestation). There were no clear differences between groups for this outcome (average RR 0.82; 95% CI 0.58 to 1.14) (Analysis 3.11). When we temporarily removed from the analysis the one study that did not meet our criteria for high quality (Chan 2009), the results remained non‐significant (data not shown). We found no significant differences between subgroups (Analysis 3.12; Analysis 3.13; Analysis 3.14; Analysis 3.15).
Other primary infant outcomes
There were no estimable data for neonatal mortality (Analysis 3.16). Two studies reported the number of infants with congenital anomalies; again, there was no clear evidence of any difference between groups (average RR 0.86; 95% CI 0.55 to 1.35; 2402 participants) (Analysis 3.17).
Maternal primary outcomes
Maternal anaemia at term (Hb less than 110 g/L at 37 weeks' gestation or more)
Among 2136 women in 14 trials (Batu 1976; Chanarin 1971; Chisholm 1966; Cogswell 2003; De Benaze 1989; Eskeland 1997; Holly 1955; Liu 2000; Makrides 2003; Milman 1991; Preziosi 1997; Pritchard 1958; Puolakka 1980; Romslo 1983), 12.5% of those who received daily iron supplements during pregnancy and 34.3% who did not receive iron had anaemia at term (average RR 0.29; 95% CI 0.19 to 0.47 (Analysis 3.18). However, because the heterogeneity in study results was substantial our results have to be interpreted with caution (heterogeneity: Tau² = 0.44, I² = 80%, Chi² test for heterogeneity P < 0.0001. When we temporarily removed studies from the analyses that did not meet our criteria for high quality, the difference between groups remained significant and heterogeneity was reduced although it remained over 50% (data not shown). We did not find differences between subgroups in terms of women's gestational age or anaemia status at the start of supplementation, or for the dose of iron (Analysis 3.19; Analysis 3.20; Analysis 3.21). The treatment effect appeared more pronounced in non‐malarial settings, however only two of the trials contributing data to this analysis were carried out in a malarial setting so any difference between these subgroups may have occurred by chance (test for subgroup differences: Chi² = 11.75, df = 1 (P = 0.0006), I² = 91.5%) (Analysis 3.22).
Maternal iron deficiency at term (as defined by as defined by trialists, based on any indicator of iron status at 37 weeks' gestation or more)
Data from seven trials involving 1256 women (Cogswell 2003; Eskeland 1997; Falahi 2010; Makrides 2003; Milman 1991; Preziosi 1997; Tura 1989) showed that 28.5% of women who received daily iron supplements had iron‐deficiency at term, compared with 51.3% of those who received no iron supplements (average RR 0.43; 95% CI 0.27 to 0.66) (Analysis 3.23). The heterogeneity between the treatment effects is high and the results should be interpreted with caution (heterogeneity: Tau² = 0.26, I² = 85%, Chi² test for heterogeneity P < 0.00001). Subgroup analyses indicated that mixed or unspecified anaemia status at the start of supplementation and higher doses of iron were associated with more pronounced treatment effects (test for subgroup differences: Chi² = 10,96 df = 1 (P = 0.0009), I² = 90.9%, and Chi² = 19.52, df = 2 (P = 0.0001), I² = 89.8%, respectively (Analysis 3.25; Analysis 3.26).
Maternal iron‐deficiency anaemia at term (Hb below 110 g/L and at least one additional laboratory indicator at 37 weeks' gestation or more)
Data from six trials involving 1088 women (Cogswell 2003; Eskeland 1997; Falahi 2010; Makrides 2003; Milman 1991; Tura 1989) showed that 4.4% of women who received daily iron supplements and 13.2% of those who did not, had iron‐deficiency anaemia at term (average RR 0.33; 95% CI 0.16 to 0.69). The heterogeneity between the treatment effects was moderate (I² 49%) (Analysis 3.28). There were no differences identified between subgroups (Analysis 3.29; Analysis 3.30; Analysis 3.31; Analysis 3.32).
Side effects (any)
Data from nine trials (Charoenlarp 1988; Cogswell 2003; De Benaze 1989; Eskeland 1997; Harvey 2007; Hood 1960; Kerr 1958; Makrides 2003; Paintin 1966) suggest that women who receive daily oral iron supplementation are more likely to report side effects of any kind than women taking placebo or not taking any iron supplements although the difference between groups was of borderline statistical significance (29% versus 21%; (average RR 1.59; 95% CI 1.00 to 2.52; nine studies, 1677 participants; I² = 75%)) (Analysis 3.34). However, the heterogeneity between the treatment effects is substantial and the results have to be interpreted with caution. The difference between groups appeared more pronounced in malarial settings although this was due to the findings in a single study carried out in a malarial setting (test for subgroup differences: Chi² = 7.09, df = 1 (P = 0.008), I² = 85.9%) (Analysis 3.38). When we restricted the analyses to those trials meeting criteria for high quality, the difference between groups did not reach statistical significance (data not shown).
Maternal severe (Hb < 70 g/L) anaemia at any time during the second or third trimester
Data from seven trials involving 1078 women was available for this outcome, although only two trials with 466 women reported estimable data which showed that women who received iron supplements were as likely to become severely anaemic during second and third trimesters (average RR 0.75; 95% CI 0.02 to 29.10) as those not receiving iron (Analysis 3.39). However, results are difficult to interpret as very few trials reported events, and in many cases women who became anaemic were treated and excluded from the analysis in the trials. We found no differences between subgroups (Analysis 3.40; Analysis 3.41; Analysis 3.42; Analysis 3.43).
Other maternal primary outcomes
Maternal mortality was reported in one small trial including 47 women and no events were reported (Analysis 3.33). Infection during pregnancy was not reported.
No studies reported findings for other maternal primary outcomes: malaria.
Infant secondary outcomes
Infant ferritin concentration in the first 6 months (in g/L, counting the last reported measure after birth within this period)
The MD was 11.00 μg/L; 95% CI 4.37 to 17.63 μg/L (one trial involving 197 women) (Preziosi 1997) (Analysis 3.49).
Very premature birth (less than 34 weeks' gestation)
This outcome was reported in three trials, involving 690 participants; results suggest that babies born to mothers receiving iron were less likely to be born before 34 weeks' gestation (average RR 0.32; 95% CI 0.10 to 1.09) (Analysis 3.47).
Other infant secondary outcomes
We found no evidence of significant difference by treatment group in the following secondary outcomes: very low birthweight (less than 1500 g) (Analysis 3.46); infant Hb concentration in the first six months (in g/L, counting the last reported measure after birth within this period) (Analysis 3.48); admission to special care unit (Analysis 3.50).
No trials reported on the remaining infant secondary outcomes such as infant anaemia or infant iron‐deficiency anaemia at birth or soon after.
Maternal secondary outcomes
Maternal Hb concentration at or near term (in g/L, at 34 weeks' gestation or more)
Among 1851 women who participated in 16 trials (Batu 1976; Buytaert 1983; Cantlie 1971; Chanarin 1971; Cogswell 2003; De Benaze 1989; Eskeland 1997; Falahi 2010; Makrides 2003; Milman 1991; Puolakka 1980; Romslo 1983; Tura 1989; Van Eijk 1978; Wallenburg 1983; Ziaei 2008), those who took iron supplements had a mean Hb concentration 8.95 g/L higher at term in comparison to those who took no iron supplements at all (MD 8.95; 95% CI 6.37 to 11.53 g/L) (Analysis 3.54). However, because the heterogeneity among the treatment effects found in individual studies was substantial our results have to be interpreted with caution (heterogeneity: Tau² = 21.70, I² = 89%, Chi² test for heterogeneity P < 0.00001). When we restricted the analysis to studies meeting the criteria for high quality the difference between groups remained significant (data not shown).
Maternal Hb concentration within six weeks postpartum (in g/L)
The data from six trials involving 659 women (Cantlie 1971; Hankin 1963; Lee 2005; Menendez 1994 (C); Milman 1991; Wills 1947) suggest that women that routinely receive daily iron supplementation have a higher concentration of Hb within six weeks postpartum than those taking placebo or not taking any iron supplements at all (MD 7.26 g/L; 95% CI 4.78 to 9.74 g/L). Heterogeneity of the results is Tau² = 3.99, I² = 44%, Chi² test for heterogeneity P < 0.0001 (Analysis 3.55).
Maternal high Hb concentrations at any time during second or third trimester (Hb greater than 130 g/L)
Seven trials evaluated the effects of oral routine supplementation with iron alone and high Hb concentrations at any time during the second or third trimesters (Cogswell 2003; Eskeland 1997; Harvey 2007; Holly 1955; Makrides 2003; Milman 1991; Pritchard 1958). Among women who received daily iron supplements, 30.6% were found to have high Hb concentrations at some time during their second or third trimesters, compared with 15.2% of those who received no iron supplements (average RR 1.90; 95% CI 1.07 to 3.35; seven studies, 1146 participants; I² = 80%) (Analysis 3.56). However, because the heterogeneity between studies was substantial, the results have to be interpreted with caution. The difference between groups remained significant when we temporarily removed from the analysis those studies which did not meet our criteria for high quality (data not shown).
Maternal high Hb concentrations at or near term (defined as Hb greater than 130 g/L, at 34 weeks' gestation or more)
Data from seven trials (Chisholm 1966; Cogswell 2003; Eskeland 1997; Holly 1955; Makrides 2003; Milman 1991; Pritchard 1958) indicated that 30.1% of women who took daily iron supplementation during pregnancy and 9.87% of those who did not had high Hb concentrations at term ((average RR 3.80; 95% CI 1.74 to 8.28; seven studies, 1189 participants; I² = 69%) (Analysis 3.57). The heterogeneity between the treatment effects was substantial and the results have to be interpreted with caution. The difference between groups remained significant when we restricted the analysis to studies meeting criteria for high quality (data not shown).
Transfusion provided
The data from a single trial (Puolakka 1980) suggest no clear differences between women that routinely receive daily iron supplementation and those that do not (average RR 0.33; 95% CI 0.01 to 7.62; 32 participants) (Analysis 3.64).
Maternal well being/satisfaction
Eskeland 1997 assessed maternal well being at 28 and 36 weeks' gestation, and found no differences between the iron supplemented mothers or those receiving placebo (Analysis 3.70).
Other secondary outcomes
There was no evidence of significant differences between women receiving daily iron supplementation and women receiving placebo or not taking any iron supplements at all, in the following secondary outcomes: diarrhoea, placental abruption, pre‐eclampsia, moderate anaemia at postpartum, maternal severe anaemia a postpartum; puerperal infection, antepartum haemorrhage and postpartum haemorrhage, constipation, nausea, heartburn, or vomiting. No trials reported on the remaining secondary outcomes.
(4) Supplementation with iron + folic acid versus no treatment/placebo (eight studies)
Infant primary outcomes
Low birthweight (less than 2500 g)
Two studies with 1311 participants examined this outcome (Christian 2003 (C); Taylor 1982). There was no clear evidence of significant differences between infants of women receiving daily iron + folic acid supplementation versus no supplements (average RR 1.07; 95% CI 0.31 to 3.74) (Analysis 4.1).
Data from these trials suggest that infant birthweight were 57.73 g heavier 95% CI 7.66 to 107.79 g in comparison to no treatment/placebo (Analysis 4.2). One trial (Christian 2003 (C)) met our criteria for high quality.
Preterm birth (less than 37 weeks' gestation)
Three studies with 1497 participants examined this outcome (Christian 2003 (C); Lee 2005; Taylor 1982). We found no evidence of differences in the numbers experiencing preterm birth between women who received daily iron and folic acid supplements and those receiving no treatment or placebo (Analysis 4.3). One of these trials met the criteria for high quality (Christian 2003 (C)). There were no subgroup differences; only two of these trials had estimable data for this outcome (Analysis 4.4; Analysis 4.5; Analysis 4.6; Analysis 4.7).
Neonatal death
Three studies with 1793 women reported on this outcome (Barton 1994; Christian 2003 (C); Taylor 1982); there was no clear evidence of any difference between groups (average RR 0.81; 95% CI 0.51 to 1.30) (Analysis 4.8).
Congenital anomalies
Only one study (1652 participants) reported data on this outcome (Christian 2003 (C)) and there appears to be no differences between the groups compared (RR 0.70; 95% CI 0.35 to 1.40) (Analysis 4.13).
Maternal primary outcomes
Maternal anaemia at term (Hb less than 110 g/L at 37 weeks' gestation or more)
The data from three trials including 346 women (Barton 1994; Batu 1976; Chisholm 1966) suggest that women who routinely receive daily iron and folic acid supplementation during pregnancy are less likely to have anaemia at term than those not taking any iron and folic acid supplements at all (defined as Hb less than 110 g/L) (7.2% versus 28.2%; average RR 0.34; 95% CI 0.21 to 0.54) (Analysis 4.14). Only one study with no estimable data met the prespecified criteria for high quality. There was no evidence of subgroup differences.
Maternal iron deficiency at term (as defined by as defined by trialists, based on any indicator of iron status at 37 weeks' gestation or more)
Data from one trial involving 131 women (Lee 2005) suggest that women who routinely receive daily oral supplementation with iron are less likely to have iron deficiency at term than women taking placebo or not taking any iron and folic acid supplements at all, although the difference between groups did not reach statistical significance (3.6% versus 15%; RR 0.24; 95% CI 0.06 to 0.99) (Analysis 4.19).
Maternal iron‐deficiency anaemia at term (Hb less than 110 g/L and at least one additional laboratory indicator at 37 weeks' gestation or more)
No evidence of significant differences was found between women who received daily iron and folic acid supplements and those receiving no treatment or placebo in the single trial contributing data to this analysis (RR 0.43; 95% CI 0.17 to 1.09) (Analysis 4.20). The study (131 participants) contributing data did not meet the prespecified criteria for high quality.
Side effects (any)
One trial including 456 women (Charoenlarp 1988) suggests that women routinely receiving iron and folic acid supplementation are more likely to report any side effects; none of those receiving no supplementation reported side effects, however the CI is very broad for this finding (average RR 44.32; 95% CI 2.77 to 709.09) (Analysis 4.22). This trial did not meet the criteria for high methodological quality.
Maternal severe anaemia at any time during second and third trimester (Hb less than 70 g/L)
Two of four trials reported estimable data for this outcome and results suggest that women were less likely to be identified with severe anaemia in the group receiving iron (average RR 0.12; 95% CI 0.02 to 0.63) (Analysis 4.23).
Other outcomes
One trial with 48 women reported on infection in pregnancy (Taylor 1982); there were four events in total, two in each group (Analysis 4.25). A single study reported on maternal deaths and there were no estimable data (Analysis 4.21). There were no data on the remaining prespecified primary outcomes.
Infant secondary outcomes
No evidence of significant differences was found between infants from these groups of women receiving daily iron + folic acid supplementation and those taking placebo or not taking any supplements at all in the following secondary outcomes: very low birthweight (less than 1500 g), very premature birth (less than 34 weeks) or admission to special care unit.
There were no data on other infant secondary outcomes.
Maternal secondary outcomes
Maternal anaemia at or near term (Hb less than 110 g/L at 34 weeks' gestation or more)
The data from three trials including 346 women (Barton 1994; Batu 1976; Chisholm 1966) suggest that women who routinely receive daily iron and folic acid supplementation during pregnancy are less likely to have anaemia at term than those not taking any iron and folic acid supplements at all (defined as Hb less than 110 g/L) (7.2% versus 28.2%; average RR 0.34; 95% CI 0.21 to 0.54) (Analysis 4.31). Only one study with no estimable data met the prespecified criteria for high quality.
Maternal iron deficiency at or near term (as defined by as defined by trialists, based on any indicator of iron status at 34 weeks' gestation or more)
Data from one trial involving 131 women (Lee 2005), suggest that women who routinely receive daily oral supplementation with iron are less likely to have iron deficiency at term than women taking placebo or not taking any iron and folic acid supplements at all, although the difference between groups was not statistically significant (3.6% versus 15%; RR 0.24; 95% CI 0.06 to 0.99) (Analysis 4.32).
Maternal iron‐deficiency anaemia at or near term (Hb less than 110 g/L and at least one additional laboratory indicator at 34 weeks' gestation or more)
No evidence of significant differences was found between women who received daily iron and folic acid supplements and those receiving no treatment or placebo in the single trial contributing data to this analysis (Analysis 4.33). The study contributing data did not meet the prespecified criteria for high quality.
Maternal Hb concentration at or near term (in g/L at 34 weeks' gestation or more)
The data from three trials including 140 women (Barton 1994; Batu 1976; Taylor 1982) suggest that women who routinely receive daily iron and folic acid supplementation reach term with a higher Hb concentration than women taking placebo or not taking any iron and folic acid supplement at all (MD 16.13 g/L; 95% CI 12.74 to 19.52) (Analysis 4.34). The effect of iron‐folic acid supplementation was associated with higher Hb concentrations in the single high‐quality trial (MD 17.10; 95% CI 8.44 to 25.76) (Barton 1994).
Maternal high Hb concentrations at any time during second or third trimesters (defined as Hb greater than 130 g/L)
No evidence of significant differences was found between women who received daily iron and folic acid supplements and those receiving no treatment or placebo (Analysis 4.36).
Maternal high Hb concentrations at term (defined as Hb greater than 130 g/L at 37 weeks' gestation or more)
No evidence of significant differences was found between women who received daily iron and folic acid supplements and those receiving no treatment or placebo (Analysis 4.37).
Maternal Hb concentration within six weeks postpartum in g/L
Two studies (Christian 2003 (C); Taylor 1982) involving 459 women reported this outcome. The data from these trials suggest that women receiving daily iron + folic acid supplementation achieve a higher concentration of Hb within six weeks postpartum than women not taking any supplements at all (MD 10.07; 95% CI 7.33 to 12.81) (Analysis 4.35), but no firm conclusions can be made given the scarcity of the data.
Maternal severe anaemia at or near term (Hb less than 70 g/L at 34 weeks' gestation or more)
Three trials reported severe anaemia at term, but only one study had cases (Analysis 4.39).
Maternal severe or moderate anaemia at postpartum (Hb less than 80 g/L)
There was only one trial with estimable data on women with severe or moderate anaemia in the postpartum period (Analysis 4.38; Analysis 4.40). The scarcity of data makes it difficult to draw any conclusions on these outcomes.
Other secondary maternal outcomes
No evidence of significant differences was found in the following secondary outcomes: very premature delivery, moderate anaemia at term, moderate anaemia at any time during second or third trimesters, puerperal infection, antepartum haemorrhage, postpartum haemorrhage, placental abruption and pre‐eclampsia. No trials reported on the remaining maternal secondary outcomes.
(5) Supplementation with iron + folic acid versus folic acid alone (without iron) supplementation (five studies)
The study by Zeng 2008 (C) was a cluster‐randomised trial and the sample size and event rate have been adjusted to take account of the design effect. In the results below we have used the effective sample size rather than the total number of women included in the study.
Infant primary outcomes
Low birthweight (less than 2500 g)
Four studies with an effective sample size of 16,146 contributed data to this outcome, all studies met the criteria for high quality (Christian 2003 (C); Liu 2012 ; Zeng 2008 (C); Ziaei 2007). There was a slight difference between groups receiving iron and folic acid versus folic acid alone (average RR 0.88; 95% CI 0.78 to 1.00) (Analysis 5.1). These studies reported mean infant birthweight but there was no difference between groups (MD 19.50; 95% CI ‐6.90 to 45.89) (Analysis 5.6).
Preterm birth (less than 37 weeks' gestation)
Four studies with an effective sample size of 16,146 contributed data to this outcome; all studies met the criteria for high quality (Christian 2003 (C); Liu 2012 ; Zeng 2008 (C); Ziaei 2007). There was no statistically significant difference between groups receiving iron and folic acid versus folic acid alone and no subgroup differences were apparent (average RR 0.97; 95% CI 0.87 to 1.08) (Analysis 5.11).
Neonatal death
Four studies (16,603 participants) (Christian 2003 (C); Liu 2012; Zeng 2008 (C); Ziaei 2007) contributed data; there was no evidence of a difference between groups (average RR 0.91; 95% CI 0.71 to 1.18) (Analysis 5.16). There were no differences between subgroups identified.
Congenital anomalies
Two studies with 13,586 women reported the number of infants with congenital anomalies; and there was no clear evidence of any difference between groups (average RR 0.78; 95% CI 0.44 to 1.39) (Analysis 5.21).
Maternal primary outcomes
Maternal anaemia at term (at 37 weeks' gestation or more)
Two studies with 303 women reported on the number of women with anaemia at term (Batu 1976; Chisholm 1966). The group receiving iron and folic acid were less likely to be anaemic compared to those receiving folic acid alone (9.7% versus 30.4%; average RR 0.34; 95% CI 0.21 to 0.55) (Analysis 5.22). The result remained significant when the study that did not meet our criteria for high quality was removed (data not shown). We did not find subgroup differences.
Maternal iron‐deficiency anaemia at term (at 37 weeks' gestation or more)
A single study (Ziaei 2007) reported on the number of women with iron‐deficiency anaemia at term; there were no estimable data for this outcome (Analysis 5.28).
Side effects (any)
One study reported on side effects (Ziaei 2007). There were no significant differences between the compared groups (Analysis 5.30).
Maternal severe anaemia at any time during second and third trimester (Hb less than 70 g/L)
Three studies reported on maternal severe anaemia in pregnancy although there were estimable data for only one (Christian 2003 (C)). In this study women receiving supplements were less likely to be identified with severe anaemia (average RR 0.06; 95% CI 0.01 to 0.47) (Analysis 5.31).
Infection during pregnancy
This outcome was reported in a single study with 727 women. There was no evidence of significant differences between groups (Analysis 5.33).
Studies did not provide data on our remaining maternal prespecified outcomes (maternal iron deficiency, maternal death or clinical malaria).
Infant secondary outcomes
There was no evidence of differences between groups for very premature birth, very low birthweight. There were no data reported on our remaining infant secondary outcomes.
Maternal secondary outcomes
Maternal anaemia at or near term (at 34 weeks' gestation or more)
Two studies with 303 women reported on the number of women with anaemia at term (Batu 1976; Chisholm 1966). The group receiving iron and folic acid were less likely to be anaemic compared to those receiving folic acid alone (9.7% versus 30.4%; average RR 0.34; 95% CI 0.21 to 0.55) (Analysis 5.39). The result remained significant when the study that did not meet our criteria for high quality was removed (data not shown).
Maternal iron‐deficiency anaemia at or near term (at 34 weeks' gestation or more)
A single study (Ziaei 2007) reported on the number of women with iron‐deficiency anaemia at term; there were no estimable data for this outcome (Analysis 5.41).
Maternal Hb at or near term (in g/L, at 34 weeks' gestation or more)
Two studies with 771 women contributed data to this outcome (Batu 1976; Ziaei 2007). The mean concentration of Hb was higher in the women receiving iron and folic acid as opposed to those receiving folic acid alone (MD 12.44; 95% CI 0.95 to 23.93). However, with only two studies contributing data this result should be treated with caution (Analysis 5.42).
Maternal high Hb concentrations at or near term (at 37 weeks' gestation or more) and during pregnancy
Two studies with 967 participants reported data for the number of women with high Hb concentrations at term (Chisholm 1966; Ziaei 2007). The evidence of difference between groups was not statistically significant (average RR 1.87; 95% CI 0.32 to 10.84) (Analysis 5.45).
Two studies with 1042 women reported on high Hb concentrations in the third trimester of pregnancy. Women receiving iron in addition to folic acid were more likely to have high Hb concentrations during pregnancy (average RR 4.33; 95% CI 2.26 to 8.30) (Analysis 5.44).
Other outcomes
There was no evidence of significant differences between groups for the following secondary outcomes: maternal high Hb concentrations during second or third trimester, puerperal infection, antepartum haemorrhage, postpartum haemorrhage, transfusion provided, diarrhoea, heartburn, nausea or constipation, placental abruption, premature rupture of the membranes or pre‐eclampsia.
Studies did not report data on our remaining maternal secondary outcomes.
(6) Supplementation with iron + other vitamins and minerals supplementation versus same other vitamins and minerals (without iron) supplementation (three studies)
We have included data from three trials (Cantlie 1971;Ouladsahebmadarek 2011; Siega‐Riz 2001).
Infant primary outcomes
Two studies provided data for this comparison (Ouladsahebmadarek 2011; Siega‐Riz 2001).
There was no evidence of a statistically significant differences between groups for low birthweight or preterm birth (Analysis 6.1; Analysis 6.3). Mean birthweight was slightly greater in the iron supplemented group (Analysis 6.2). There were no data on perinatal death or other prespecified primary outcomes.
Maternal primary outcomes
One study provided data on side effects and no significant differences between groups were identified (Analysis 6.10). No studies provided information on maternal anaemia at term, maternal infection or any of our other prespecified maternal outcomes.
Infant secondary outcomes
There were no data reported for our remaining infant secondary outcomes.
Maternal secondary outcomes
Two studies with 809 women reported on mean maternal Hb levels at term and women receiving iron were more likely to have higher Hb levels compared with those without iron (average RR 10.85; 95% CI 7.29 to 14.42) (Analysis 6.22). Cantlie 1971 also reported on mean maternal Hb levels in the postpartum period and women receiving iron in addition to other vitamins and minerals were more likely to have higher Hb levels compared with those receiving other vitamins and minerals without iron (MD 14.00; 95% CI 3.56 to 24.44) (Analysis 6.23).
Siega‐Riz 2001 reported on side effects; there were no differences between groups in terms of the number of women suffering constipation, vomiting or heartburn (Analysis 6.33; Analysis 6.35; Analysis 6.36). Women in the iron supplemented group were slightly more likely to experience diarrhoea (Analysis 6.37).
Ouladsahebmadarek 2011 reported on placental abruption, premature rupture of the membranes and pre‐eclampsia for 782 women; there were no significant differences between groups for any of these outcomes (Analysis 6.39; Analysis 6.40; Analysis 6.41).
No information was reported on our remaining maternal secondary outcomes.
(7) Daily oral iron + folic acid + other vitamins and minerals supplementation versus daily oral folic acid + same other vitamins and minerals (without iron) supplementation (no studies)
No studies compared women receiving daily oral iron + folic acid + other vitamins and minerals supplementation versus daily oral folic acid + same other vitamins and minerals (without iron) supplementation.
(8) Daily oral iron + folic acid + other vitamins and minerals supplementation versus daily oral same other vitamins and minerals (without iron nor folic acid) supplementation (no studies)
No studies compared women receiving daily oral iron + folic acid + other vitamins and minerals with women receiving other vitamins and minerals (without either folic acid or iron).
Discussion
Summary of main results
We have set out a summary of our main findings along with an overall assessment of the quality of the evidence in additional tables (summary of findings Table for the main comparison; summary of findings Table 2; summary of findings Table 3; summary of findings Table 4).
Forty‐four trials compared the effects of daily oral supplements containing iron versus no iron or placebo. The majority of them (35) compared arms receiving iron alone versus no treatment and placebo. Compared with controls, women taking iron supplements were less likely to have low birthweight and preterm newborns and have heavier babies although these findings did not reach statistical significance. Results also suggest that babies born to mothers receiving iron were less likely to be born before 34 weeks' gestation. For other infant outcomes there were no clear differences between groups.
Regarding maternal outcomes, women receiving iron compared with those receiving no treatment or placebo were less likely to be anaemic at term (13.06% versus 35.71%) and were less likely to have iron deficiency (28.50% versus 51.33%) and iron‐deficiency anaemia at term (4.37% versus 13.18%). Women who received iron supplements appeared more likely than controls to report side effects (25.30% versus 9.91%), although this was not statistically significant. Participants also had increased risk of high haemoglobin (Hb) concentrations at any time during second or third trimester and at term. Women receiving iron were also on average more likely to have higher Hb levels at term and in the postpartum period. For several outcomes where there was evidence of differences between groups, the size of the treatment effect in individual studies varied considerably, and so our results should be interpreted with caution.
Only nine trials compared the effects of daily iron + folic acid supplementation with the effects of same supplements without iron + folic acid. There were clear positive effects on maternal haematological status while the effects on infant outcomes were uncertain.
Overall completeness and applicability of evidence
This review included 61 randomised controlled trials carried out since 1936 in 27 countries across the globe. Trials were mostly conducted during the last 20 years. There was some equilibrium between the trials that included non‐anaemic women and those focused on populations with high prevalence of anaemia as well among the trials assessing early or late gestational iron supplementation. Although it was not possible to extract data from all the trials, these numbers clearly reflect the wide applicability of this review.
We addressed the effects of the use of iron or iron + folic acid by pregnant women, either provided alone or in combination with other vitamins and minerals. The effects can be determined if the differences between the comparison groups relies only in the presence of iron or iron + folic acid, that is, we are estimating the effects of the addition of iron or iron + folic acid to the pregnant women independently of any other co‐interventions given to both groups being compared.
Most of the trials focused primarily on maternal changes in Hb and on some haematological indices after a certain period of supplementation. The results consistently show that iron supplementation in pregnancy improves maternal haematological outcomes independently of the dosage. However, those women who consumed higher amounts of iron (60 mg of iron or more per day) tended to have higher Hb values at the end or near term of pregnancy. In some cases, women reached levels above the threshold of 130 g/L at sea level which may be associated with negative pregnancy outcomes, including preterm birth, low birthweight and pre‐eclampsia. Although the clinical significance of high Hb concentration is still being debated, it seems sensible to provide supplements with lower iron concentrations to those populations with lower prevalence of anaemia and iron deficiency.
Side effects are also a clear drawback to most current iron compounds used as supplements, either alone or with folic acid. The results of this review suggest that women who consume daily supplements containing 60 mg of elemental iron or more may be more likely to report side effects, particularly diarrhoea, than those who consume lower doses per day although differences between subgroups were not statistically significant. This concurs with the Institute of Medicine's approach which set 45 mg of elemental iron as the upper tolerable limit per day based on the likelihood of having side effects (IOM 2001). As a result, investigators are now testing highly bioavailable iron compounds (e.g. FeNaEDTA) that may produce fewer side effects and that can be administered at low doses, but their information in pregnant women is still limited.
This updated version includes two new trials, showing that the amount of evidence in this area grows slowly. Although the results indicate that iron may have positive effects on infant outcomes, the effects on low birthweight and infant weight at birth are less clear than in the previous version of this review and no longer reached statistical significance. There are two possible reasons for this. First, trials were conducted in areas where the background risk for low birthweight is not as high as in previous studies and thus the effect of supplements is less prominent. Secondly, the selection of random‐effects as analytical model results in broader confidence intervals than a fixed‐effect model and gives less weight to large trials with a large number of events. In the previous version, a single trial reporting an 18% reduction in low birthweight was responsible of 46% of the overall effect in this outcome while in this version the contribution of such trial was diluted to 33%.
Quality of the evidence
The overall quality of the evidence in this review is mixed, with many studies being at risk of bias. In more than half of the included trials the methods used to conceal allocation were not described. Blinding of women, care providers and outcome assessors was not attempted in more than a third of trials, although in some studies technical staff carrying out laboratory investigations were reported to be unaware of group allocation. While for some outcomes (e.g. infant birthweight), the lack of blinding may have been unlikely to have had any impact on results, for others (e.g. maternal reports of side effects to care providers), lack of blinding may represent a potentially serious source of bias. Attrition was a problem in some studies and it was not always clear that loss was balanced across groups.
The overall quality of the evidence for iron supplementation versus no iron was moderate for birthweight, preterm birth and maternal infection. The evidence was rated as low quality for low birthweight, neonatal death, congenital anomalies, maternal severe anaemia, and infections during pregnancy, maternal anaemia at term and maternal iron deficiency at term; whereas, it was of very low quality for maternal death and side effects (seesummary of findings Table for the main comparison).
The overall quality of the evidence for iron + folic acid supplementation versus no iron + folic acid was moderate for maternal anaemia at term, side effects and low birthweight. The evidence was of low or very low quality for other outcomes due to imprecision and heterogeneity (seesummary of findings Table 2).
Potential biases in the review process
We were aware of the possibility of introducing bias at every stage of the reviewing process. In this updated review, we tried to minimise bias in a number of ways; two review authors assessed eligibility for inclusion, carried out data extraction and assessed risk of bias. Each worked independently. Nevertheless, the process of assessing risk of bias, for example, is not an exact science and includes many personal judgements. Further, the process of reviewing research studies is known to be affected by prior beliefs and attitudes. It is difficult to control for this type of bias in the reviewing process.
While we attempted to be as inclusive as possible in the search strategy, the literature identified was predominantly written in English and published in North American and European journals. Although we did attempt to assess reporting bias, constraints of time meant that this assessment largely relied on information available in the published trial reports and thus, reporting bias was not usually apparent.
Assessing the quality of the evidence relating to specific outcomes is a difficult process, but we attempted to produce 'Summary of findings' tables using a transparent process. Two review authors independently assessed the evidence for each outcome for each quality domain and discussed any disagreements. The inclusion of the new trials modified the overall quality of the evidence in low birthweight from moderate to low.
Agreements and disagreements with other studies or reviews
Iron supplementation to pregnant women has been a long standing public health intervention that has been subject to multiple reviews, some of which also include a meta‐analysis. In general, those meta‐analyses tend to report the results in a segmented manner. Most of them are focused only on maternal anaemia (Sloan 2002; Yakoob 2011), while others also include a few infant outcomes (Imdad 2012). This topic has also been studied from the social determinants perspective (Nagata 2011). Our results are not in agreement with a recent systematic review (Cantor 2015) that did not find conclusive evidence on whether routine prenatal iron supplementation improved maternal or infant clinical health outcomes, but only might improve maternal haematologic indices. This systematic review included only English‐language articles and addressed other aspects such as the benefits or harms of screening iron deficiency anaemia in pregnant women. Unlike our review, the authors included also non‐randomised, controlled trials; and cohort studies addressing their questions and excluded what authors had assessed as poor‐quality studies if deemed good‐ and fair‐quality studies were available.
A recent overview of reviews on the prevention and treatment of maternal anaemia identified 11 systematic reviews assessing the effects of iron and folic acid supplementation during the antenatal period, but only five were deemed as high quality, using A Measurement Tool to Assess Systematic Reviews (short AMSTAR) as the assessment tool for methodological quality (Parker 2012).
This Cochrane review is the most comprehensive assessment on the effects of daily iron supplementation on both maternal and infant outcomes. After two updates, there is consistent evidence that providing iron supplements to pregnant women as part of the antenatal care helps improve gestational outcomes and that these benefits can be observed at lower iron doses than usual, with less side effects.

Study flow diagram.

'Risk of bias' graph: review authors' judgements about each risk of bias item presented as percentages across all included studies.
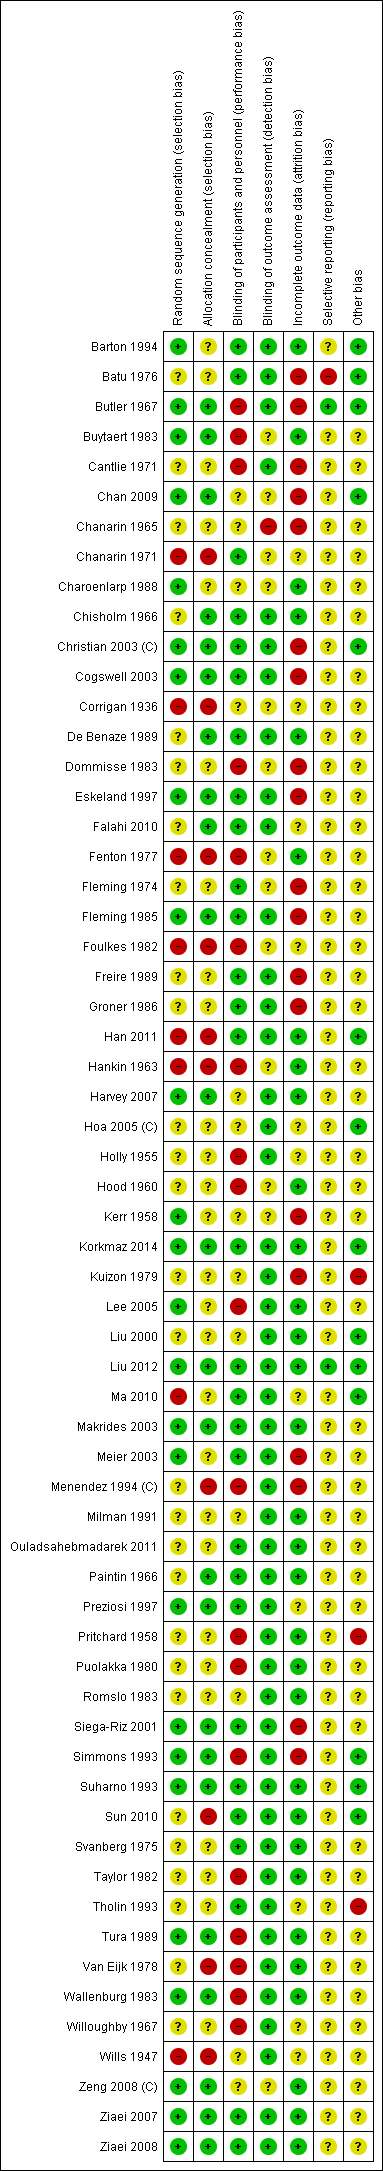
'Risk of bias' summary: review authors' judgements about each risk of bias item for each included study.

Funnel plot of comparison: 1 Any supplements containing iron versus same supplements without iron or no treatment/placebo (no iron or placebo), outcome: 1.1 Low birthweight (less than 2500 g) (ALL).

Funnel plot of comparison: 1 Any supplements containing iron versus same supplements without iron or no treatment/placebo (no iron or placebo), outcome: 1.6 Birthweight (g) (ALL).

Funnel plot of comparison: 1 Any supplements containing iron versus same supplements without iron or no treatment/placebo (no iron or placebo), outcome: 1.11 Preterm birth (less than 37 weeks of gestation) (ALL).
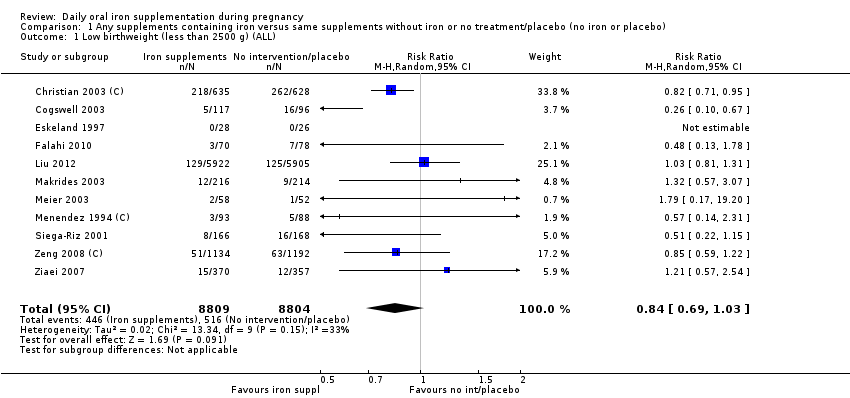
Comparison 1 Any supplements containing iron versus same supplements without iron or no treatment/placebo (no iron or placebo), Outcome 1 Low birthweight (less than 2500 g) (ALL).
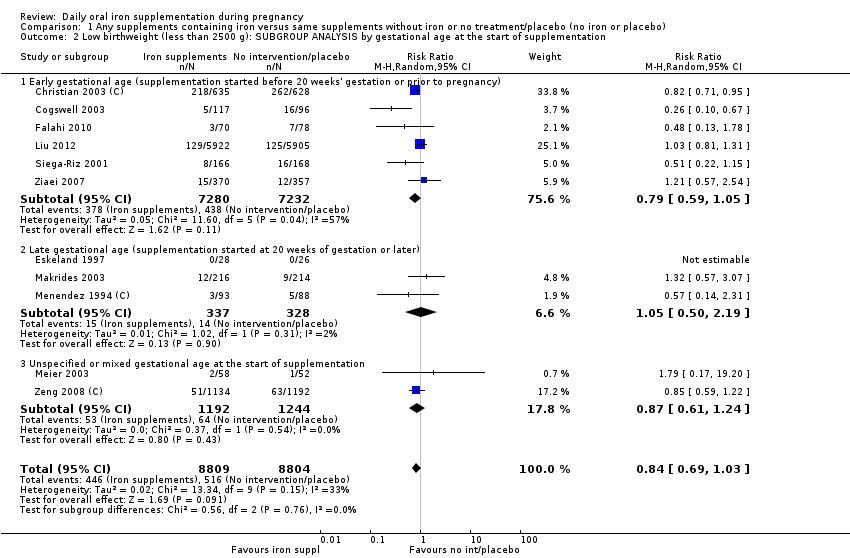
Comparison 1 Any supplements containing iron versus same supplements without iron or no treatment/placebo (no iron or placebo), Outcome 2 Low birthweight (less than 2500 g): SUBGROUP ANALYSIS by gestational age at the start of supplementation.

Comparison 1 Any supplements containing iron versus same supplements without iron or no treatment/placebo (no iron or placebo), Outcome 3 Low birthweight (less than 2500 g): SUBGROUP ANALYSIS by anaemia status at the start of supplementation.
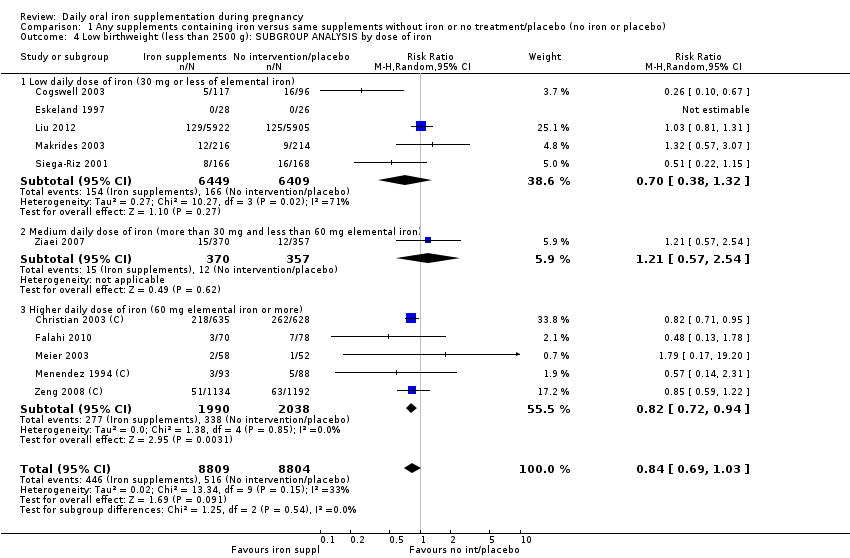
Comparison 1 Any supplements containing iron versus same supplements without iron or no treatment/placebo (no iron or placebo), Outcome 4 Low birthweight (less than 2500 g): SUBGROUP ANALYSIS by dose of iron.

Comparison 1 Any supplements containing iron versus same supplements without iron or no treatment/placebo (no iron or placebo), Outcome 5 Low birthweight (less than 2500 g): SUBGROUP ANALYSIS by malarial status of setting.

Comparison 1 Any supplements containing iron versus same supplements without iron or no treatment/placebo (no iron or placebo), Outcome 6 Birthweight (g) (ALL).

Comparison 1 Any supplements containing iron versus same supplements without iron or no treatment/placebo (no iron or placebo), Outcome 7 Birthweight (g): SUBGROUP ANALYSIS by gestational age at the start of supplementation.

Comparison 1 Any supplements containing iron versus same supplements without iron or no treatment/placebo (no iron or placebo), Outcome 8 Birthweight (g): SUBGROUP ANALYSIS by anaemia status at the start of supplementation.

Comparison 1 Any supplements containing iron versus same supplements without iron or no treatment/placebo (no iron or placebo), Outcome 9 Birthweight (g): SUBGROUP ANALYSIS by dose of iron.
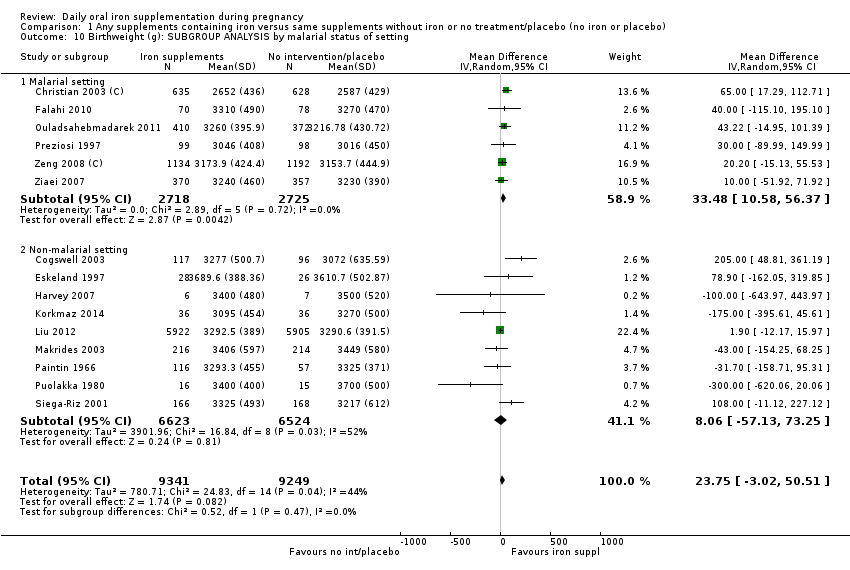
Comparison 1 Any supplements containing iron versus same supplements without iron or no treatment/placebo (no iron or placebo), Outcome 10 Birthweight (g): SUBGROUP ANALYSIS by malarial status of setting.

Comparison 1 Any supplements containing iron versus same supplements without iron or no treatment/placebo (no iron or placebo), Outcome 11 Preterm birth (less than 37 weeks of gestation) (ALL).
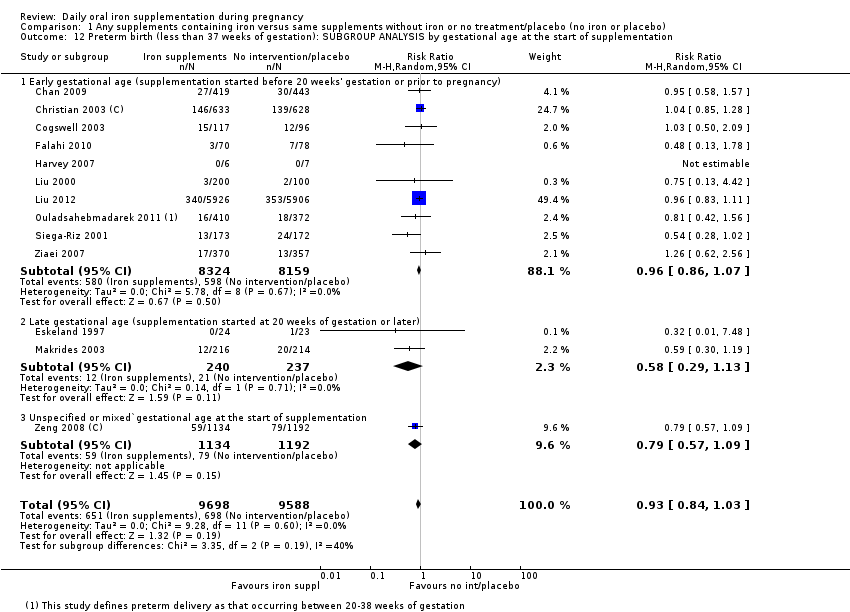
Comparison 1 Any supplements containing iron versus same supplements without iron or no treatment/placebo (no iron or placebo), Outcome 12 Preterm birth (less than 37 weeks of gestation): SUBGROUP ANALYSIS by gestational age at the start of supplementation.

Comparison 1 Any supplements containing iron versus same supplements without iron or no treatment/placebo (no iron or placebo), Outcome 13 Preterm birth (less than 37 weeks of gestation): SUBGROUP ANALYSIS by anaemia status at the start of supplementation.
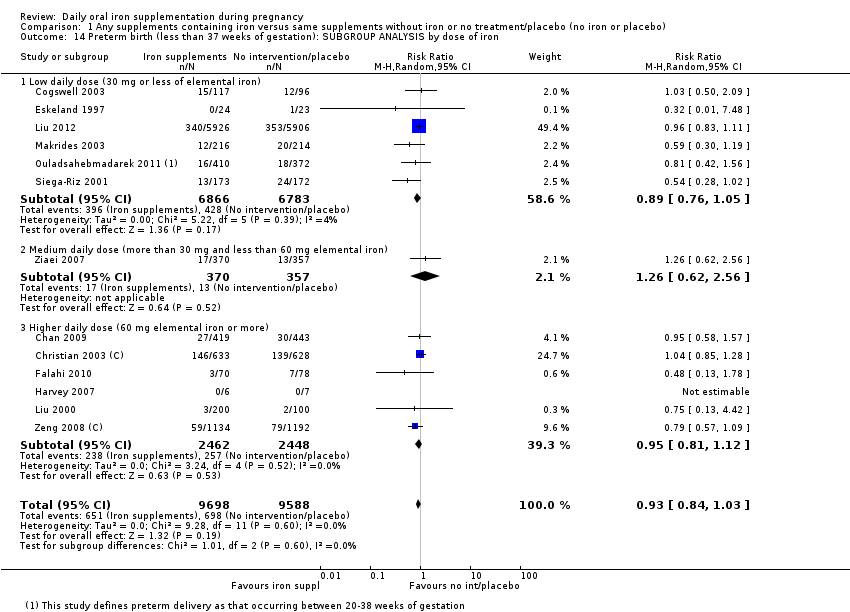
Comparison 1 Any supplements containing iron versus same supplements without iron or no treatment/placebo (no iron or placebo), Outcome 14 Preterm birth (less than 37 weeks of gestation): SUBGROUP ANALYSIS by dose of iron.
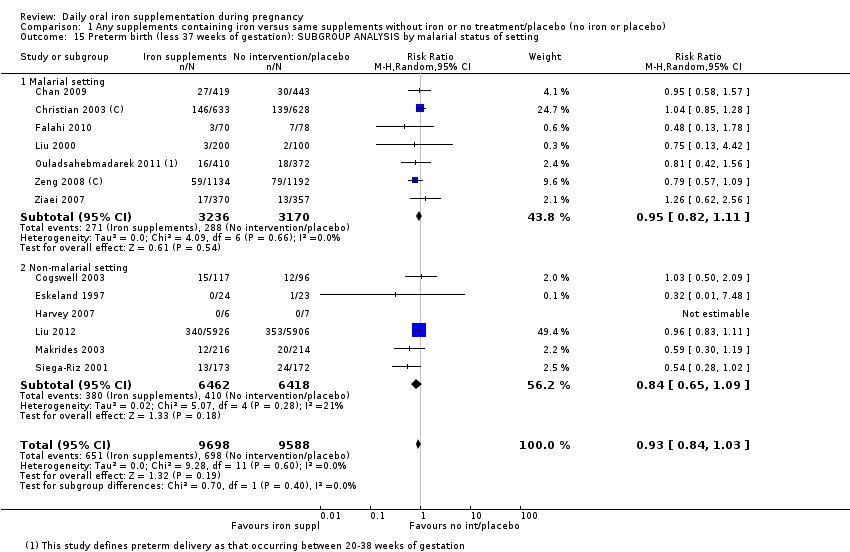
Comparison 1 Any supplements containing iron versus same supplements without iron or no treatment/placebo (no iron or placebo), Outcome 15 Preterm birth (less 37 weeks of gestation): SUBGROUP ANALYSIS by malarial status of setting.

Comparison 1 Any supplements containing iron versus same supplements without iron or no treatment/placebo (no iron or placebo), Outcome 16 Neonatal death (within 28 days after delivery) (ALL).

Comparison 1 Any supplements containing iron versus same supplements without iron or no treatment/placebo (no iron or placebo), Outcome 17 Neonatal death (within 28 days after delivery): SUBGROUP ANALYSIS by gestational age at the start of supplementation.

Comparison 1 Any supplements containing iron versus same supplements without iron or no treatment/placebo (no iron or placebo), Outcome 18 Neonatal death (within 28 days after delivery): SUBGROUP ANALYSIS by anaemia status at the start of supplementation.

Comparison 1 Any supplements containing iron versus same supplements without iron or no treatment/placebo (no iron or placebo), Outcome 19 Neonatal death (within 28 days after delivery): SUBGROUP ANALYSIS by dose of iron.

Comparison 1 Any supplements containing iron versus same supplements without iron or no treatment/placebo (no iron or placebo), Outcome 20 Neonatal death (within 28 days after delivery): SUBGROUP ANALYSIS by malarial status of setting.

Comparison 1 Any supplements containing iron versus same supplements without iron or no treatment/placebo (no iron or placebo), Outcome 21 Congenital anomalies (ALL).

Comparison 1 Any supplements containing iron versus same supplements without iron or no treatment/placebo (no iron or placebo), Outcome 22 Congenital anomalies: SUBGROUP ANALYSIS by gestational age at the start of supplementation).

Comparison 1 Any supplements containing iron versus same supplements without iron or no treatment/placebo (no iron or placebo), Outcome 23 Congenital anomalies: SUBGROUP ANALYSIS by anaemia status at the start of supplementation.
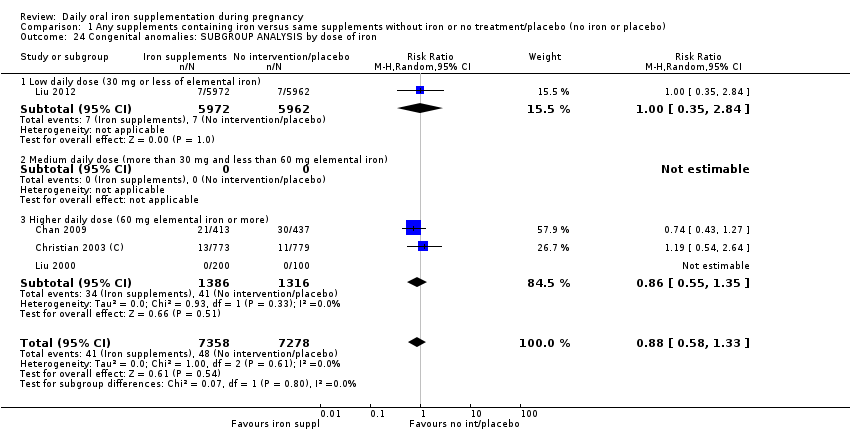
Comparison 1 Any supplements containing iron versus same supplements without iron or no treatment/placebo (no iron or placebo), Outcome 24 Congenital anomalies: SUBGROUP ANALYSIS by dose of iron.
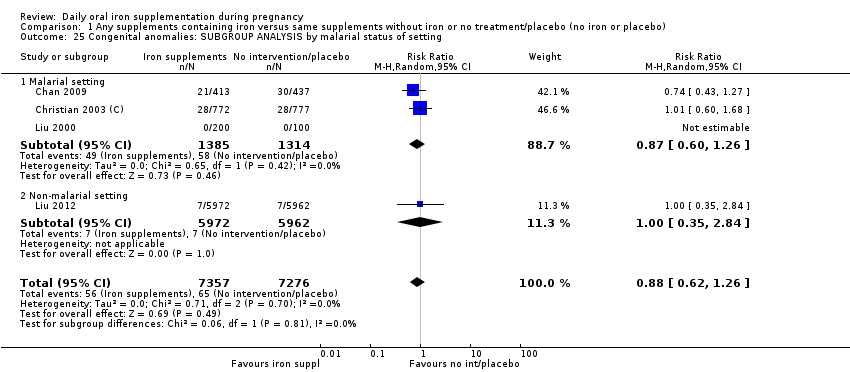
Comparison 1 Any supplements containing iron versus same supplements without iron or no treatment/placebo (no iron or placebo), Outcome 25 Congenital anomalies: SUBGROUP ANALYSIS by malarial status of setting.
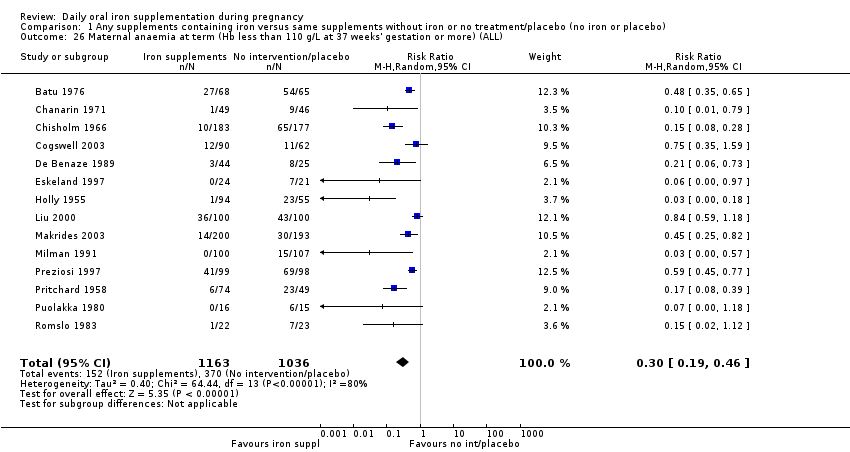
Comparison 1 Any supplements containing iron versus same supplements without iron or no treatment/placebo (no iron or placebo), Outcome 26 Maternal anaemia at term (Hb less than 110 g/L at 37 weeks' gestation or more) (ALL).

Comparison 1 Any supplements containing iron versus same supplements without iron or no treatment/placebo (no iron or placebo), Outcome 27 Maternal anaemia at term (Hb less than 110 g/L at 37 weeks' gestation or more): SUBGROUP ANALYSIS by gestational age at the start of supplementation):.

Comparison 1 Any supplements containing iron versus same supplements without iron or no treatment/placebo (no iron or placebo), Outcome 28 Maternal anaemia at term (Hb less than 110 g/L at 37 weeks' gestation or more): SUBGROUP ANALYSIS by anaemia status at the start of supplementation).

Comparison 1 Any supplements containing iron versus same supplements without iron or no treatment/placebo (no iron or placebo), Outcome 29 Maternal anaemia at term (Hb less than 110 g/L at 37 weeks' gestation or more): SUBGROUP ANALYSIS by dose of iron).

Comparison 1 Any supplements containing iron versus same supplements without iron or no treatment/placebo (no iron or placebo), Outcome 30 Maternal anaemia at term (Hb less than 110 g/L at 37 weeks' gestation or more): SUBGROUP ANALYSIS by malarial status of setting).
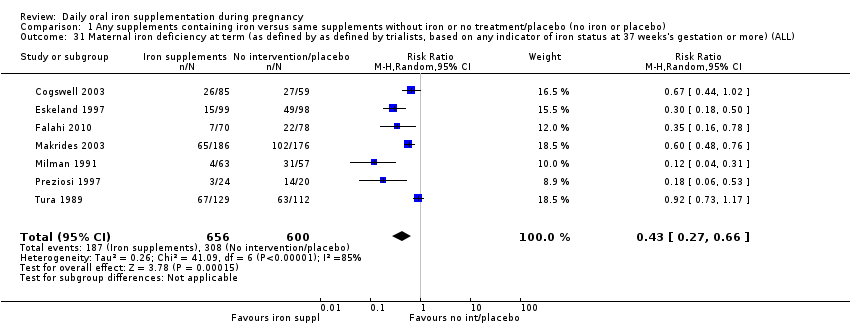
Comparison 1 Any supplements containing iron versus same supplements without iron or no treatment/placebo (no iron or placebo), Outcome 31 Maternal iron deficiency at term (as defined by as defined by trialists, based on any indicator of iron status at 37 weeks's gestation or more) (ALL).

Comparison 1 Any supplements containing iron versus same supplements without iron or no treatment/placebo (no iron or placebo), Outcome 32 Maternal iron deficiency at term (as defined by as defined by trialists, based on any indicator of iron status at 37 weeks' gestation or more): SUBGROUP ANALYSIS by gestational age at the start of supplementation.
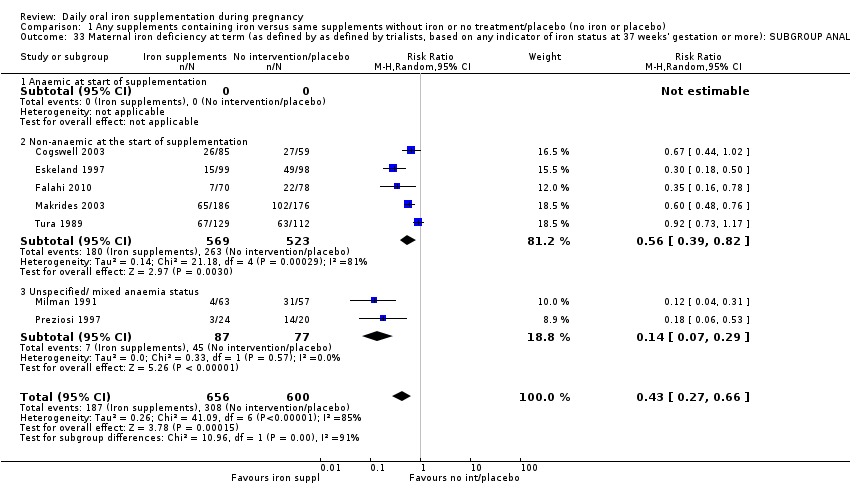
Comparison 1 Any supplements containing iron versus same supplements without iron or no treatment/placebo (no iron or placebo), Outcome 33 Maternal iron deficiency at term (as defined by as defined by trialists, based on any indicator of iron status at 37 weeks' gestation or more): SUBGROUP ANALYSIS by anaemia status at the start of supplementation.

Comparison 1 Any supplements containing iron versus same supplements without iron or no treatment/placebo (no iron or placebo), Outcome 34 Maternal iron deficiency at term (as defined by as defined by trialists, based on any indicator of iron status at 37 weeks' gestation or more): SUBGROUP ANALYSIS by dose of iron.
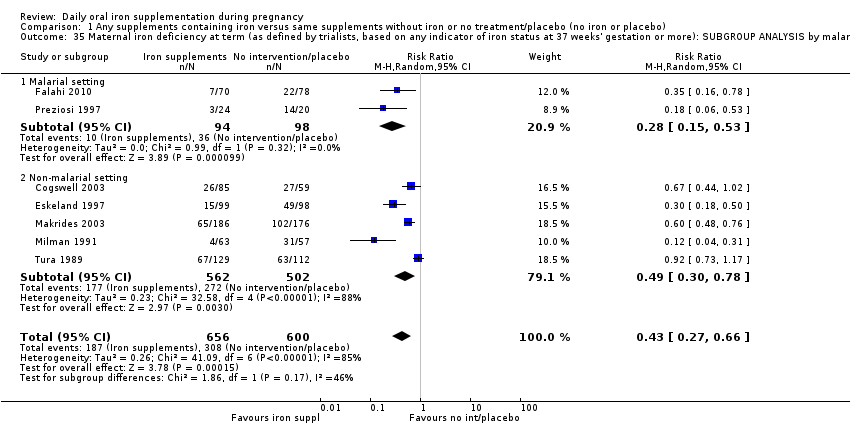
Comparison 1 Any supplements containing iron versus same supplements without iron or no treatment/placebo (no iron or placebo), Outcome 35 Maternal iron deficiency at term (as defined by trialists, based on any indicator of iron status at 37 weeks' gestation or more): SUBGROUP ANALYSIS by malarial status of setting.

Comparison 1 Any supplements containing iron versus same supplements without iron or no treatment/placebo (no iron or placebo), Outcome 36 Maternal iron‐deficiency anaemia at term (Hb less than 110 g/L and at least one additional laboratory indicators at 37 weeks' gestation or more) (ALL).
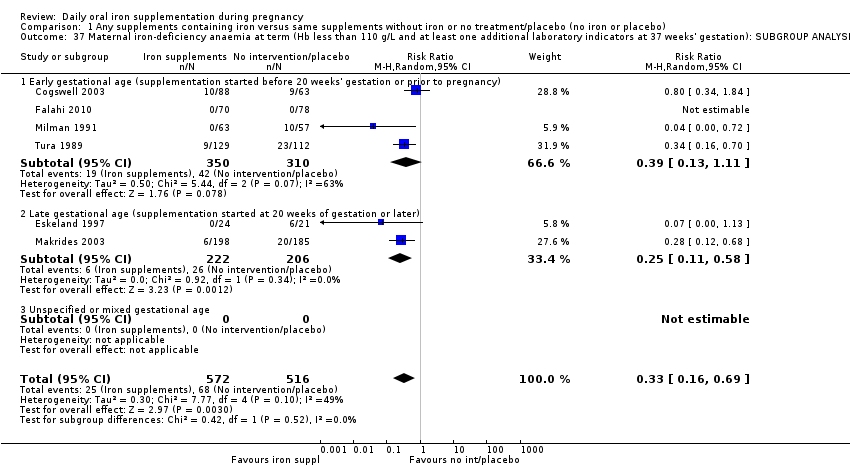
Comparison 1 Any supplements containing iron versus same supplements without iron or no treatment/placebo (no iron or placebo), Outcome 37 Maternal iron‐deficiency anaemia at term (Hb less than 110 g/L and at least one additional laboratory indicators at 37 weeks' gestation): SUBGROUP ANALYSIS by gestational age at the start of supplementation.

Comparison 1 Any supplements containing iron versus same supplements without iron or no treatment/placebo (no iron or placebo), Outcome 38 Maternal iron‐deficiency anaemia at term (Hb less than 110 g/L and at least one additional laboratory indicators at 37 weeks' gestation or more): SUBGROUP ANALYSIS by anaemia status at the start of supplementation.

Comparison 1 Any supplements containing iron versus same supplements without iron or no treatment/placebo (no iron or placebo), Outcome 39 Maternal iron‐deficiency anaemia at term (Hb less than 110 g/L and at least one additional laboratory indicators at 37 weeks' gestation or more): SUBGROUP ANALYSIS by dose of iron.

Comparison 1 Any supplements containing iron versus same supplements without iron or no treatment/placebo (no iron or placebo), Outcome 40 Maternal iron‐deficiency anaemia at term (Hb less than 110 g/L and at least one additional laboratory indicators at 37 weeks' gestation or more): SUBGROUP ANALYSIS by malarial status of setting.
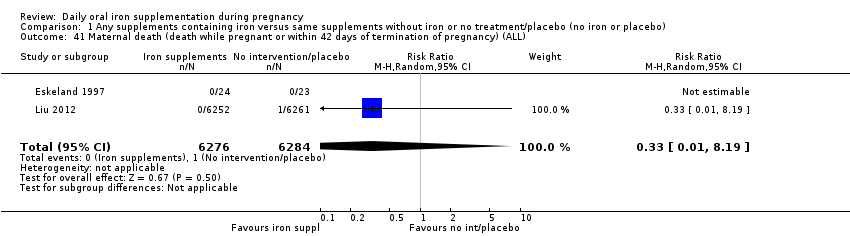
Comparison 1 Any supplements containing iron versus same supplements without iron or no treatment/placebo (no iron or placebo), Outcome 41 Maternal death (death while pregnant or within 42 days of termination of pregnancy) (ALL).

Comparison 1 Any supplements containing iron versus same supplements without iron or no treatment/placebo (no iron or placebo), Outcome 42 Side effects (any reported throughout the intervention period) (ALL).
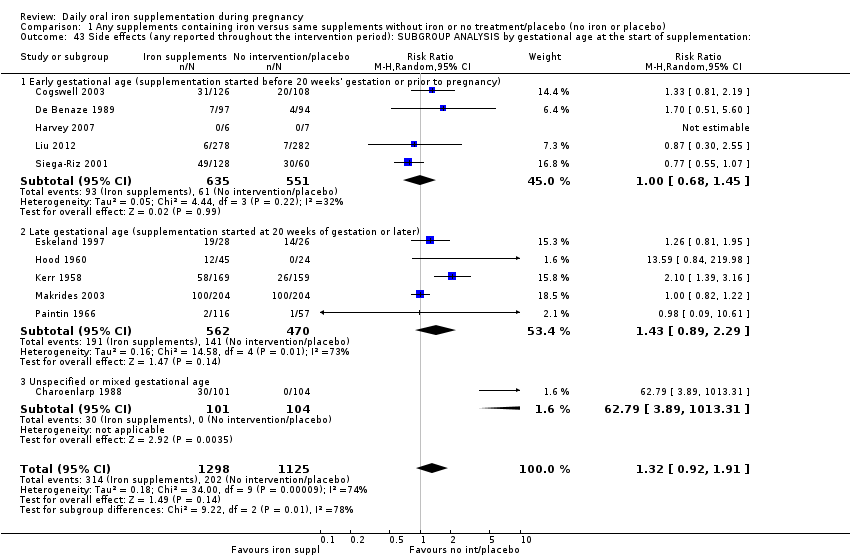
Comparison 1 Any supplements containing iron versus same supplements without iron or no treatment/placebo (no iron or placebo), Outcome 43 Side effects (any reported throughout the intervention period): SUBGROUP ANALYSIS by gestational age at the start of supplementation:.

Comparison 1 Any supplements containing iron versus same supplements without iron or no treatment/placebo (no iron or placebo), Outcome 44 Side effects (any reported throughout the intervention period): SUBGROUP ANALYSIS by anaemia status at the start of supplementation.
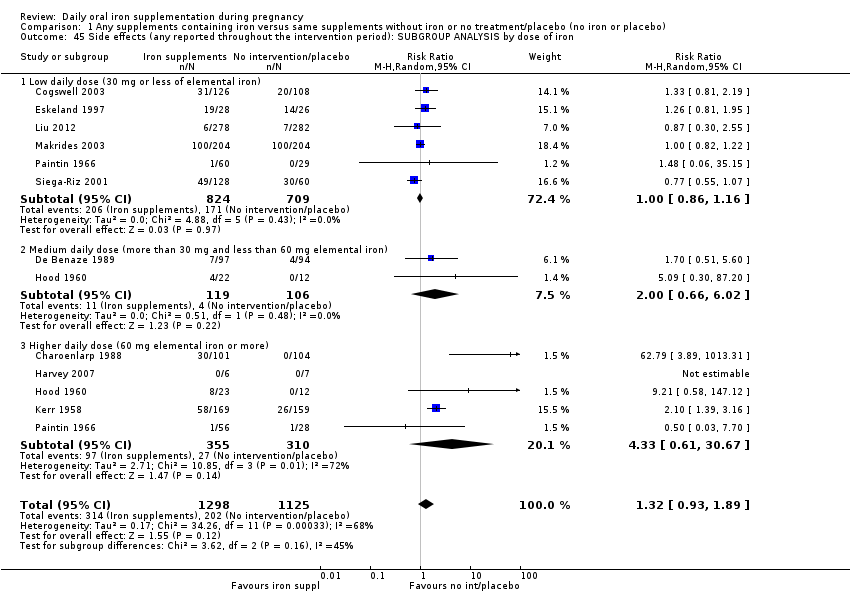
Comparison 1 Any supplements containing iron versus same supplements without iron or no treatment/placebo (no iron or placebo), Outcome 45 Side effects (any reported throughout the intervention period): SUBGROUP ANALYSIS by dose of iron.

Comparison 1 Any supplements containing iron versus same supplements without iron or no treatment/placebo (no iron or placebo), Outcome 46 Side effects (any reported throughout the intervention period): SUBGROUP ANALYSIS by malarial status of setting.

Comparison 1 Any supplements containing iron versus same supplements without iron or no treatment/placebo (no iron or placebo), Outcome 47 Maternal severe anaemia at any time during second and third trimester (Hb less than 70 g/L) (ALL).
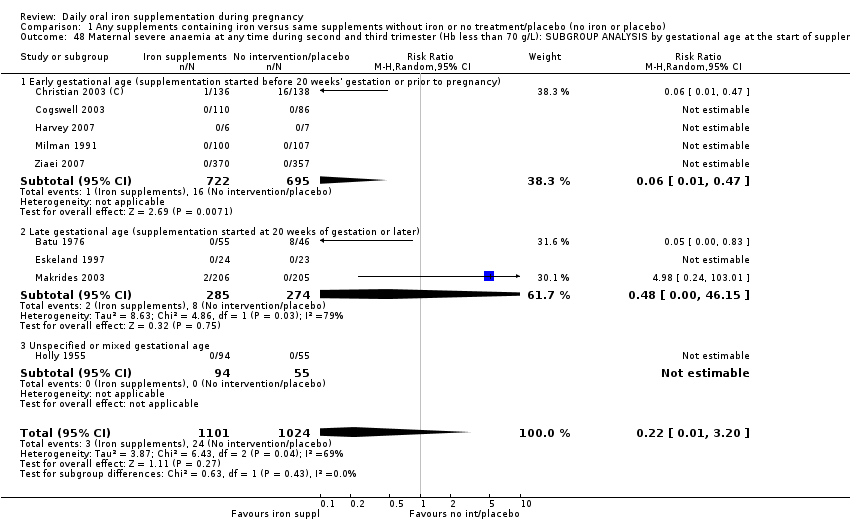
Comparison 1 Any supplements containing iron versus same supplements without iron or no treatment/placebo (no iron or placebo), Outcome 48 Maternal severe anaemia at any time during second and third trimester (Hb less than 70 g/L): SUBGROUP ANALYSIS by gestational age at the start of supplementation.

Comparison 1 Any supplements containing iron versus same supplements without iron or no treatment/placebo (no iron or placebo), Outcome 49 Maternal severe anaemia at any time during second and third trimester (Hb less than 70 g/L): SUBGROUP ANALYSIS by anaemia status at the start of supplementation.
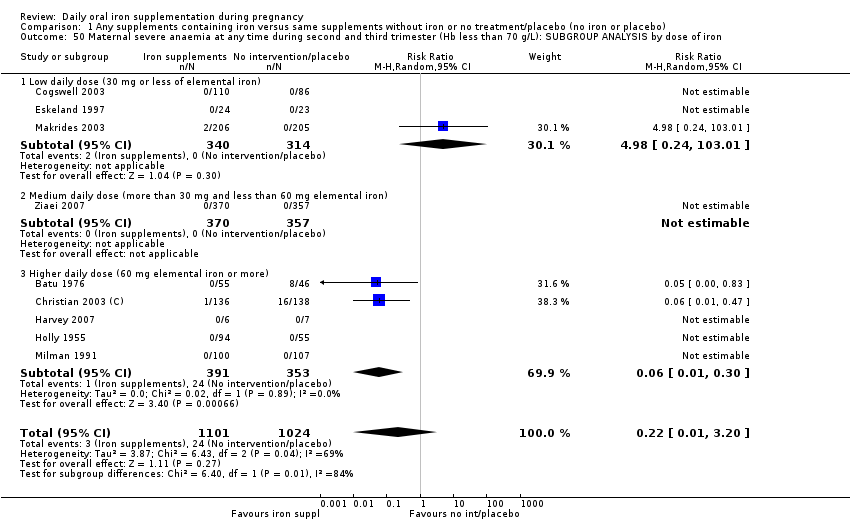
Comparison 1 Any supplements containing iron versus same supplements without iron or no treatment/placebo (no iron or placebo), Outcome 50 Maternal severe anaemia at any time during second and third trimester (Hb less than 70 g/L): SUBGROUP ANALYSIS by dose of iron.

Comparison 1 Any supplements containing iron versus same supplements without iron or no treatment/placebo (no iron or placebo), Outcome 51 Maternal severe anaemia at any time during second and third trimester (Hb less than 70 g/L): SUBGROUP ANALYSIS by malarial status of setting.
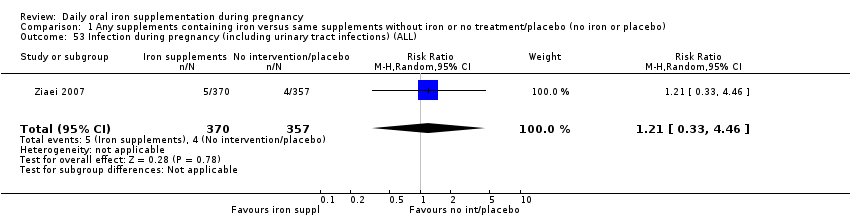
Comparison 1 Any supplements containing iron versus same supplements without iron or no treatment/placebo (no iron or placebo), Outcome 53 Infection during pregnancy (including urinary tract infections) (ALL).
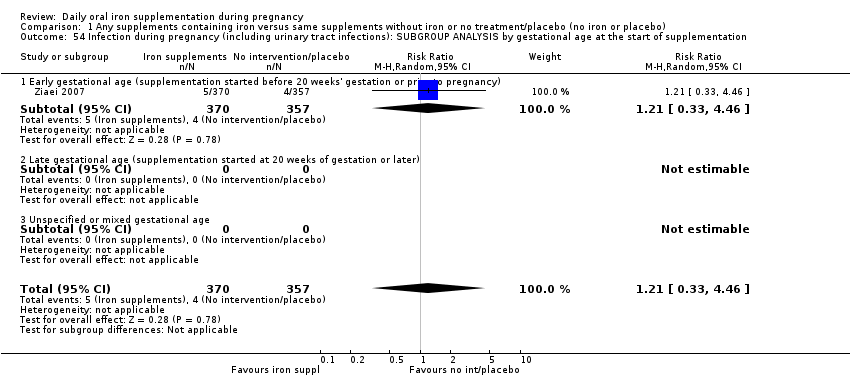
Comparison 1 Any supplements containing iron versus same supplements without iron or no treatment/placebo (no iron or placebo), Outcome 54 Infection during pregnancy (including urinary tract infections): SUBGROUP ANALYSIS by gestational age at the start of supplementation.

Comparison 1 Any supplements containing iron versus same supplements without iron or no treatment/placebo (no iron or placebo), Outcome 55 Infection during pregnancy (including urinary tract infections): SUBGROUP ANALYSIS by anaemia status at the start of supplementation.

Comparison 1 Any supplements containing iron versus same supplements without iron or no treatment/placebo (no iron or placebo), Outcome 56 Infection during pregnancy (including urinary tract infections): SUBGROUP ANALYSIS by dose of iron.

Comparison 1 Any supplements containing iron versus same supplements without iron or no treatment/placebo (no iron or placebo), Outcome 57 Infection during pregnancy (including urinary tract infections): SUBGROUP ANALYSIS by malarial status of setting.

Comparison 1 Any supplements containing iron versus same supplements without iron or no treatment/placebo (no iron or placebo), Outcome 58 Very low birthweight (less than 1500 g) (ALL).
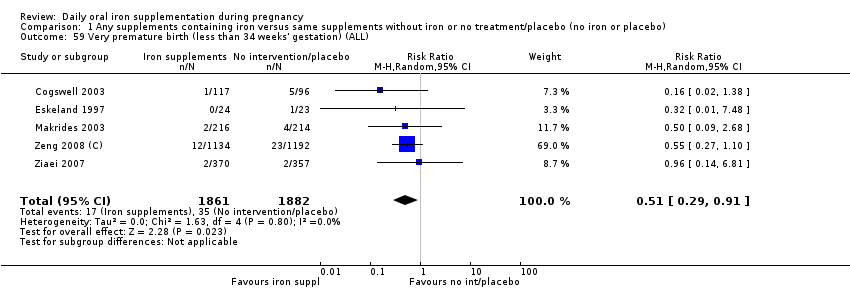
Comparison 1 Any supplements containing iron versus same supplements without iron or no treatment/placebo (no iron or placebo), Outcome 59 Very premature birth (less than 34 weeks' gestation) (ALL).

Comparison 1 Any supplements containing iron versus same supplements without iron or no treatment/placebo (no iron or placebo), Outcome 60 Infant Hb concentration within the first 6 months (in g/L counting the last reported measure after birth within this period) (ALL).

Comparison 1 Any supplements containing iron versus same supplements without iron or no treatment/placebo (no iron or placebo), Outcome 61 Infant serum ferritin concentration within first 6 months (in μg/L counting the last reported measure after birth within this period) (ALL).

Comparison 1 Any supplements containing iron versus same supplements without iron or no treatment/placebo (no iron or placebo), Outcome 62 Admission to special care unit (ALL).

Comparison 1 Any supplements containing iron versus same supplements without iron or no treatment/placebo (no iron or placebo), Outcome 63 Maternal anaemia at or near term (Hb less than 110 g/L at 34 weeks' gestation or more) (ALL).

Comparison 1 Any supplements containing iron versus same supplements without iron or no treatment/placebo (no iron or placebo), Outcome 64 Maternal iron deficiency at or near term (as defined by as defined by trialists, based on any indicator of iron status at 34 weeks's gestation or more)) (ALL).
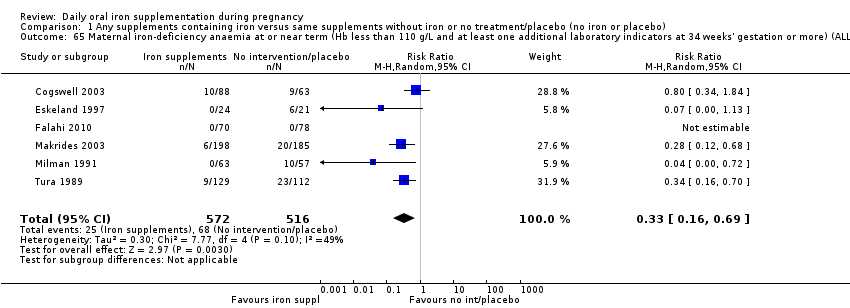
Comparison 1 Any supplements containing iron versus same supplements without iron or no treatment/placebo (no iron or placebo), Outcome 65 Maternal iron‐deficiency anaemia at or near term (Hb less than 110 g/L and at least one additional laboratory indicators at 34 weeks' gestation or more) (ALL).
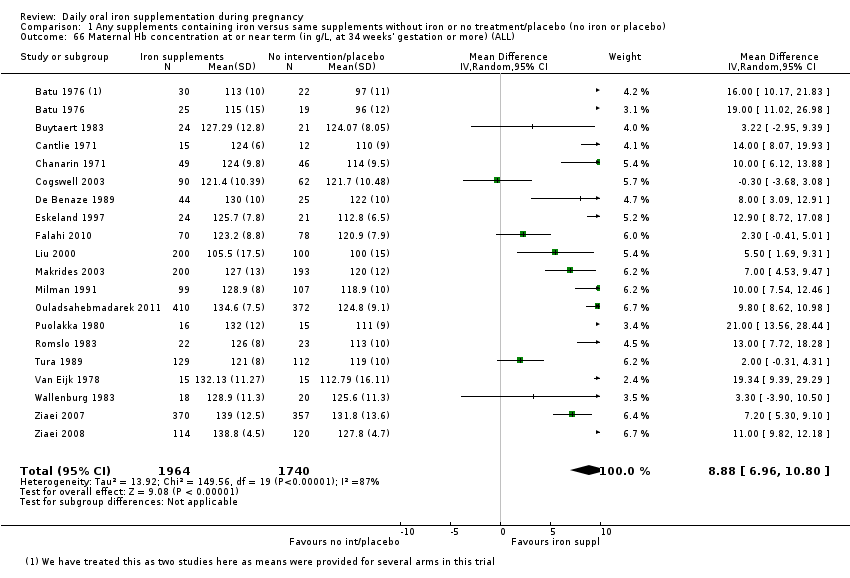
Comparison 1 Any supplements containing iron versus same supplements without iron or no treatment/placebo (no iron or placebo), Outcome 66 Maternal Hb concentration at or near term (in g/L, at 34 weeks' gestation or more) (ALL).
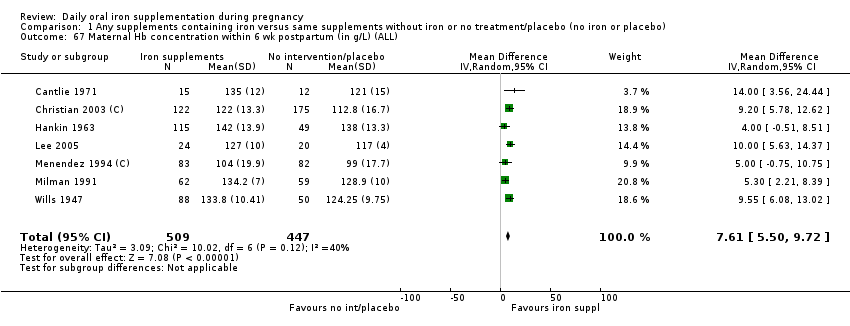
Comparison 1 Any supplements containing iron versus same supplements without iron or no treatment/placebo (no iron or placebo), Outcome 67 Maternal Hb concentration within 6 wk postpartum (in g/L) (ALL).

Comparison 1 Any supplements containing iron versus same supplements without iron or no treatment/placebo (no iron or placebo), Outcome 68 Maternal high haemoglobin concentrations during second or third trimester (Hb more than 130 g/L) (ALL).
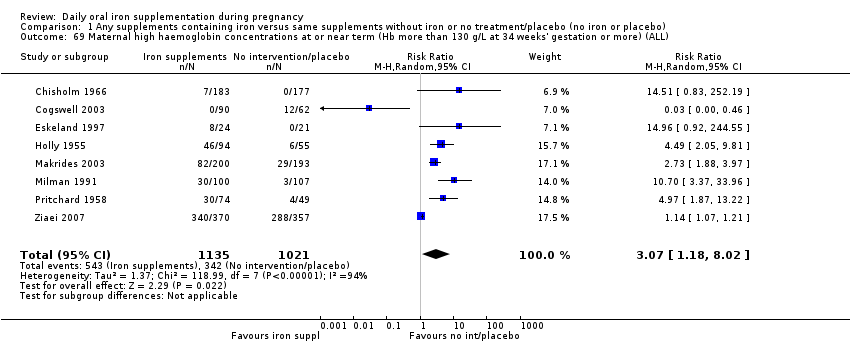
Comparison 1 Any supplements containing iron versus same supplements without iron or no treatment/placebo (no iron or placebo), Outcome 69 Maternal high haemoglobin concentrations at or near term (Hb more than 130 g/L at 34 weeks' gestation or more) (ALL).

Comparison 1 Any supplements containing iron versus same supplements without iron or no treatment/placebo (no iron or placebo), Outcome 70 Maternal severe anaemia at or near term (Hb less than 70 g/L at 34 weeks' gestation or more) (ALL).

Comparison 1 Any supplements containing iron versus same supplements without iron or no treatment/placebo (no iron or placebo), Outcome 71 Severe anaemia at postpartum (Hb less than 80 g/L) (ALL).

Comparison 1 Any supplements containing iron versus same supplements without iron or no treatment/placebo (no iron or placebo), Outcome 72 Moderate anaemia at postpartum (Hb more than 80 g/L and less than 110 g/L) (ALL).

Comparison 1 Any supplements containing iron versus same supplements without iron or no treatment/placebo (no iron or placebo), Outcome 73 Puerperal infection (ALL).

Comparison 1 Any supplements containing iron versus same supplements without iron or no treatment/placebo (no iron or placebo), Outcome 74 Antepartum haemorrhage (ALL).
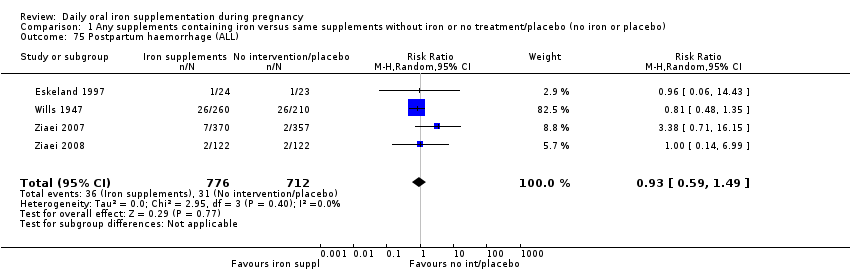
Comparison 1 Any supplements containing iron versus same supplements without iron or no treatment/placebo (no iron or placebo), Outcome 75 Postpartum haemorrhage (ALL).
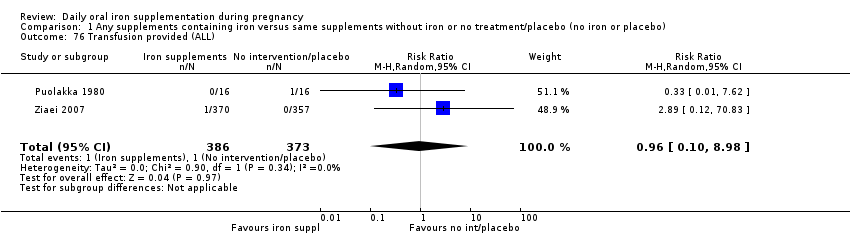
Comparison 1 Any supplements containing iron versus same supplements without iron or no treatment/placebo (no iron or placebo), Outcome 76 Transfusion provided (ALL).

Comparison 1 Any supplements containing iron versus same supplements without iron or no treatment/placebo (no iron or placebo), Outcome 77 Diarrhoea (ALL).

Comparison 1 Any supplements containing iron versus same supplements without iron or no treatment/placebo (no iron or placebo), Outcome 78 Constipation (ALL).

Comparison 1 Any supplements containing iron versus same supplements without iron or no treatment/placebo (no iron or placebo), Outcome 79 Nausea (ALL).

Comparison 1 Any supplements containing iron versus same supplements without iron or no treatment/placebo (no iron or placebo), Outcome 80 Heartburn (ALL).
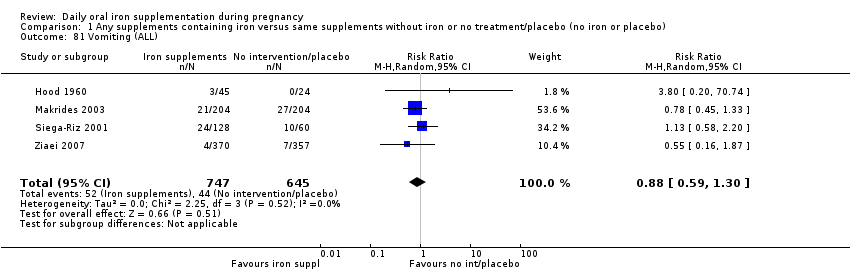
Comparison 1 Any supplements containing iron versus same supplements without iron or no treatment/placebo (no iron or placebo), Outcome 81 Vomiting (ALL).

Comparison 1 Any supplements containing iron versus same supplements without iron or no treatment/placebo (no iron or placebo), Outcome 82 Maternal wellbeing/satisfaction (ALL).
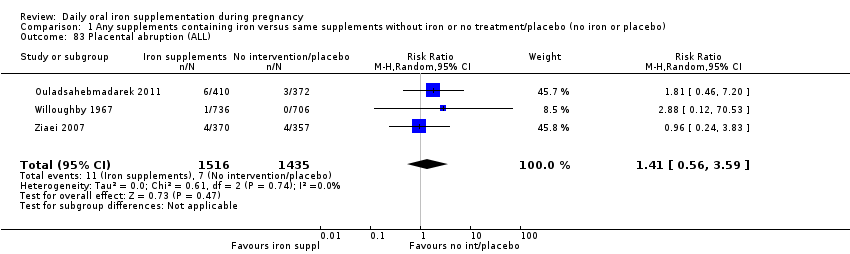
Comparison 1 Any supplements containing iron versus same supplements without iron or no treatment/placebo (no iron or placebo), Outcome 83 Placental abruption (ALL).

Comparison 1 Any supplements containing iron versus same supplements without iron or no treatment/placebo (no iron or placebo), Outcome 84 Premature rupture of membranes (ALL).

Comparison 1 Any supplements containing iron versus same supplements without iron or no treatment/placebo (no iron or placebo), Outcome 85 Pre‐eclampsia (ALL).
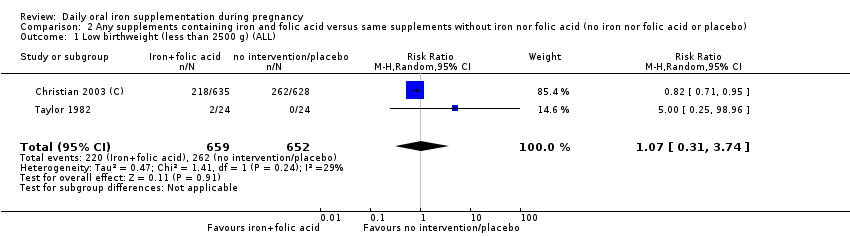
Comparison 2 Any supplements containing iron and folic acid versus same supplements without iron nor folic acid (no iron nor folic acid or placebo), Outcome 1 Low birthweight (less than 2500 g) (ALL).

Comparison 2 Any supplements containing iron and folic acid versus same supplements without iron nor folic acid (no iron nor folic acid or placebo), Outcome 2 Neonatal death (within 28 days after delivery) (ALL).
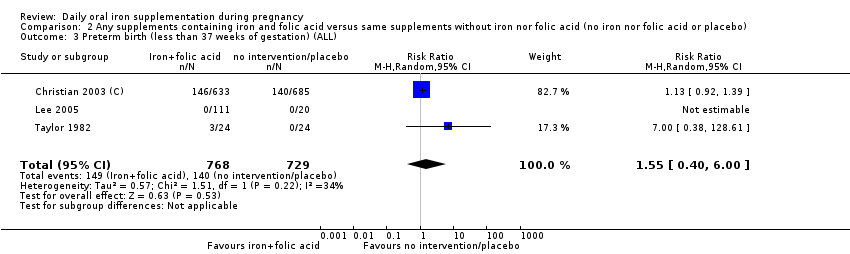
Comparison 2 Any supplements containing iron and folic acid versus same supplements without iron nor folic acid (no iron nor folic acid or placebo), Outcome 3 Preterm birth (less than 37 weeks of gestation) (ALL).

Comparison 2 Any supplements containing iron and folic acid versus same supplements without iron nor folic acid (no iron nor folic acid or placebo), Outcome 4 Preterm birth (less than 37 weeks of gestation): SUBGROUP ANALYSIS by gestation at the start of supplementation.

Comparison 2 Any supplements containing iron and folic acid versus same supplements without iron nor folic acid (no iron nor folic acid or placebo), Outcome 5 Preterm birth (less than 37 weeks of gestation): SUBGROUP ANALYSIS by anaemia status at the start of supplementation.

Comparison 2 Any supplements containing iron and folic acid versus same supplements without iron nor folic acid (no iron nor folic acid or placebo), Outcome 6 Preterm birth (less than 37 weeks of gestation): SUBGROUP ANALYSIS by dose of iron.

Comparison 2 Any supplements containing iron and folic acid versus same supplements without iron nor folic acid (no iron nor folic acid or placebo), Outcome 7 Preterm birth (less than 37 weeks of gestation): SUBGROUP ANALYSIS by malarial status of settings.
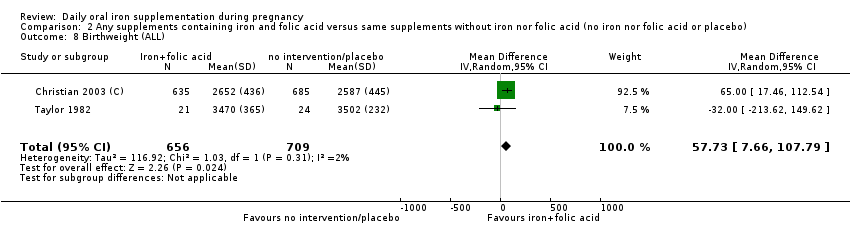
Comparison 2 Any supplements containing iron and folic acid versus same supplements without iron nor folic acid (no iron nor folic acid or placebo), Outcome 8 Birthweight (ALL).
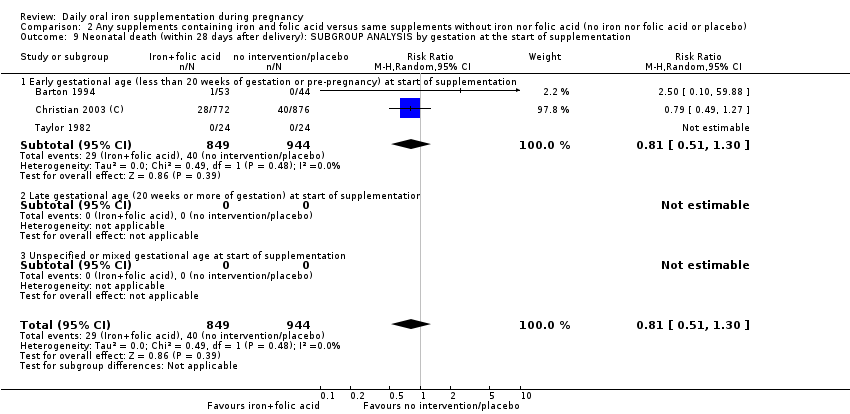
Comparison 2 Any supplements containing iron and folic acid versus same supplements without iron nor folic acid (no iron nor folic acid or placebo), Outcome 9 Neonatal death (within 28 days after delivery): SUBGROUP ANALYSIS by gestation at the start of supplementation.

Comparison 2 Any supplements containing iron and folic acid versus same supplements without iron nor folic acid (no iron nor folic acid or placebo), Outcome 10 Neonatal death (within 28 days after delivery): SUBGROUP ANALYSIS by anaemia status at the start of supplementation.

Comparison 2 Any supplements containing iron and folic acid versus same supplements without iron nor folic acid (no iron nor folic acid or placebo), Outcome 11 Neonatal death (within 28 days after delivery): SUBGROUP ANALYSIS by dose of iron.
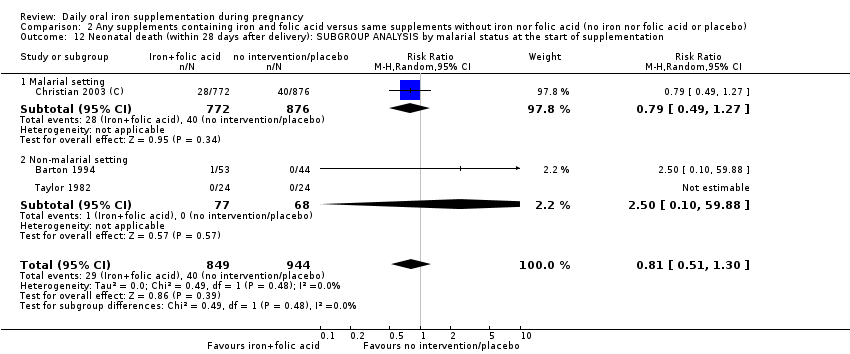
Comparison 2 Any supplements containing iron and folic acid versus same supplements without iron nor folic acid (no iron nor folic acid or placebo), Outcome 12 Neonatal death (within 28 days after delivery): SUBGROUP ANALYSIS by malarial status at the start of supplementation.
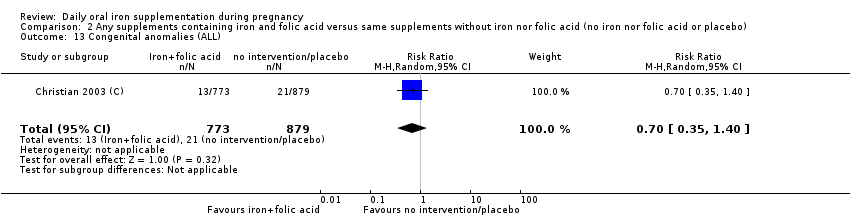
Comparison 2 Any supplements containing iron and folic acid versus same supplements without iron nor folic acid (no iron nor folic acid or placebo), Outcome 13 Congenital anomalies (ALL).

Comparison 2 Any supplements containing iron and folic acid versus same supplements without iron nor folic acid (no iron nor folic acid or placebo), Outcome 14 Maternal anaemia at term (Hb less than 110 g/L at 37 weeks' gestation or more) (ALL).
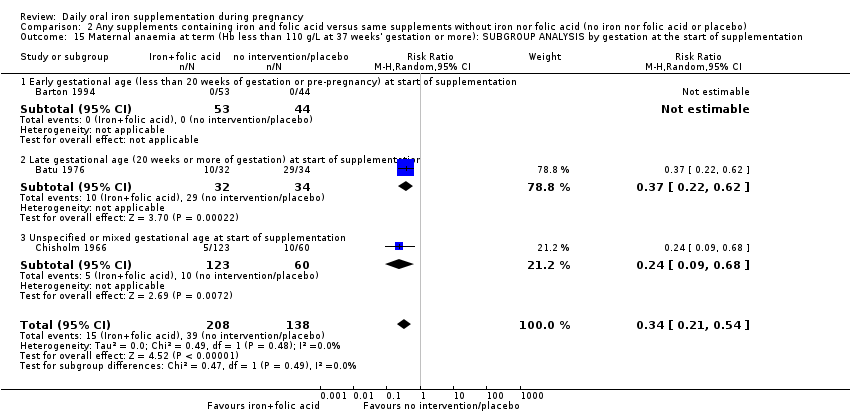
Comparison 2 Any supplements containing iron and folic acid versus same supplements without iron nor folic acid (no iron nor folic acid or placebo), Outcome 15 Maternal anaemia at term (Hb less than 110 g/L at 37 weeks' gestation or more): SUBGROUP ANALYSIS by gestation at the start of supplementation.

Comparison 2 Any supplements containing iron and folic acid versus same supplements without iron nor folic acid (no iron nor folic acid or placebo), Outcome 16 Maternal anaemia at term (Hb less than 110 g/L at 37 weeks' gestation or more): SUBGROUP ANALYSIS by anaemia status at the start of supplementation.
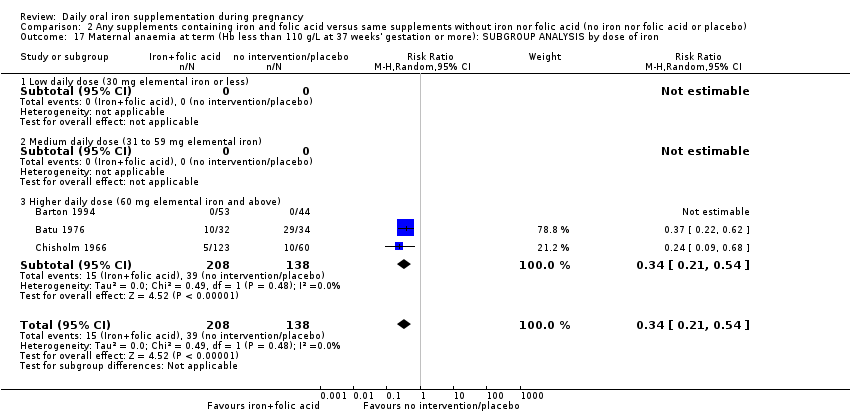
Comparison 2 Any supplements containing iron and folic acid versus same supplements without iron nor folic acid (no iron nor folic acid or placebo), Outcome 17 Maternal anaemia at term (Hb less than 110 g/L at 37 weeks' gestation or more): SUBGROUP ANALYSIS by dose of iron.

Comparison 2 Any supplements containing iron and folic acid versus same supplements without iron nor folic acid (no iron nor folic acid or placebo), Outcome 18 Maternal anaemia at term (Hb less than 110 g/L at 37 weeks' gestation or more): SUBGROUP ANALYSIS by malarial status of setting.
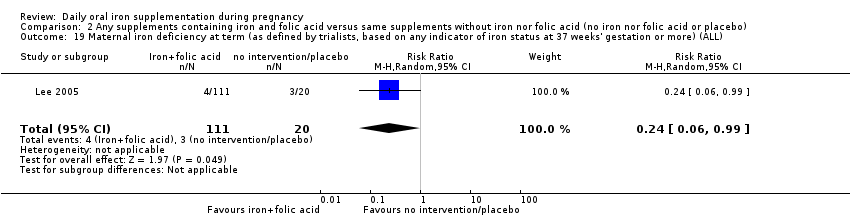
Comparison 2 Any supplements containing iron and folic acid versus same supplements without iron nor folic acid (no iron nor folic acid or placebo), Outcome 19 Maternal iron deficiency at term (as defined by trialists, based on any indicator of iron status at 37 weeks' gestation or more) (ALL).

Comparison 2 Any supplements containing iron and folic acid versus same supplements without iron nor folic acid (no iron nor folic acid or placebo), Outcome 20 Maternal iron‐deficiency anaemia at term (Hb less than 110 g/L and at least one additional laboratory indicators at 37 weeks' gestation or more) (ALL).

Comparison 2 Any supplements containing iron and folic acid versus same supplements without iron nor folic acid (no iron nor folic acid or placebo), Outcome 21 Maternal death (death while pregnant or within 42 days of termination of pregnancy) (ALL).
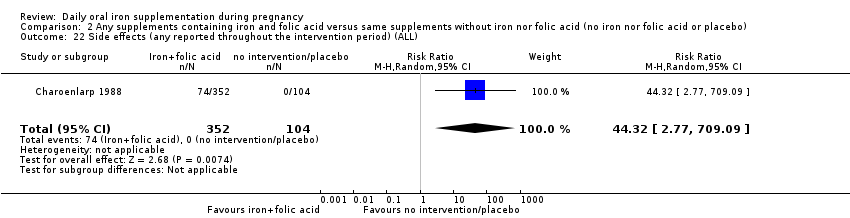
Comparison 2 Any supplements containing iron and folic acid versus same supplements without iron nor folic acid (no iron nor folic acid or placebo), Outcome 22 Side effects (any reported throughout the intervention period) (ALL).

Comparison 2 Any supplements containing iron and folic acid versus same supplements without iron nor folic acid (no iron nor folic acid or placebo), Outcome 23 Maternal severe anaemia at any time during second and third trimester (Hb less than 70 g/L) (ALL).

Comparison 2 Any supplements containing iron and folic acid versus same supplements without iron nor folic acid (no iron nor folic acid or placebo), Outcome 24 Maternal severe anaemia at any time during second and third trimester (Hb less than 70 g/L): SUBGROUP ANALYSIS by gestation at the start of supplementation.

Comparison 2 Any supplements containing iron and folic acid versus same supplements without iron nor folic acid (no iron nor folic acid or placebo), Outcome 25 Maternal severe anaemia at any time during second and third trimester (Hb less than 70 g/L): SUBGROUP ANALYSIS by anaemia status at the start of supplementation.

Comparison 2 Any supplements containing iron and folic acid versus same supplements without iron nor folic acid (no iron nor folic acid or placebo), Outcome 26 Maternal severe anaemia at any time during second and third trimester (Hb less than 70 g/L): SUBGROUP ANALYSIS by dose of iron.

Comparison 2 Any supplements containing iron and folic acid versus same supplements without iron nor folic acid (no iron nor folic acid or placebo), Outcome 27 Maternal severe anaemia at any time during second and third trimester (Hb less than 70 g/L): SUBGROUP ANALYSIS by malarial status of setting.
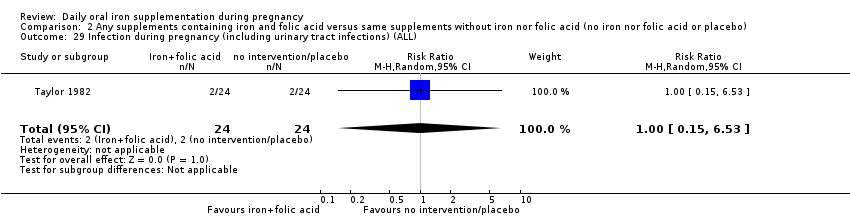
Comparison 2 Any supplements containing iron and folic acid versus same supplements without iron nor folic acid (no iron nor folic acid or placebo), Outcome 29 Infection during pregnancy (including urinary tract infections) (ALL).
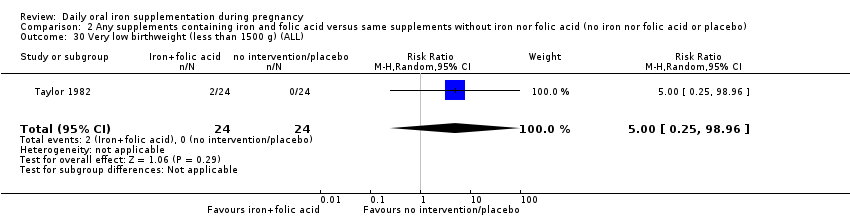
Comparison 2 Any supplements containing iron and folic acid versus same supplements without iron nor folic acid (no iron nor folic acid or placebo), Outcome 30 Very low birthweight (less than 1500 g) (ALL).
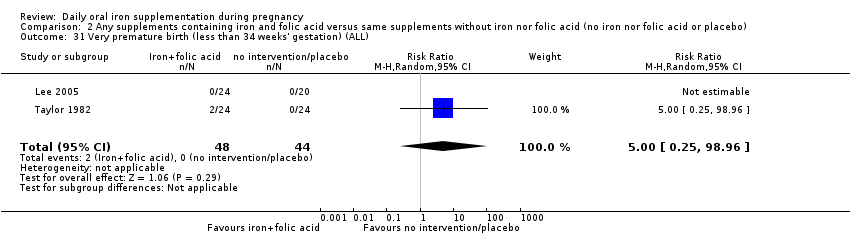
Comparison 2 Any supplements containing iron and folic acid versus same supplements without iron nor folic acid (no iron nor folic acid or placebo), Outcome 31 Very premature birth (less than 34 weeks' gestation) (ALL).

Comparison 2 Any supplements containing iron and folic acid versus same supplements without iron nor folic acid (no iron nor folic acid or placebo), Outcome 32 Admission to special care unit (ALL).

Comparison 2 Any supplements containing iron and folic acid versus same supplements without iron nor folic acid (no iron nor folic acid or placebo), Outcome 33 Maternal anaemia at or near term (Hb less than 110 g/L at 34 weeks' gestation or more) (ALL).

Comparison 2 Any supplements containing iron and folic acid versus same supplements without iron nor folic acid (no iron nor folic acid or placebo), Outcome 34 Maternal iron deficiency at or near term (as defined by trialists, based on any indicator of iron status at 34 weeks' gestation or more) (ALL).

Comparison 2 Any supplements containing iron and folic acid versus same supplements without iron nor folic acid (no iron nor folic acid or placebo), Outcome 35 Maternal iron‐deficiency anaemia at or near term (Hb less than 110 g/L and at least one additional laboratory indicators at 34 weeks' gestation or more) (ALL).

Comparison 2 Any supplements containing iron and folic acid versus same supplements without iron nor folic acid (no iron nor folic acid or placebo), Outcome 36 Maternal Hb concentration at or near term (in g/L, at 34 weeks' gestation or more) (ALL).

Comparison 2 Any supplements containing iron and folic acid versus same supplements without iron nor folic acid (no iron nor folic acid or placebo), Outcome 37 Maternal Hb concentration within 6 wk postpartum (in g/L) (ALL).
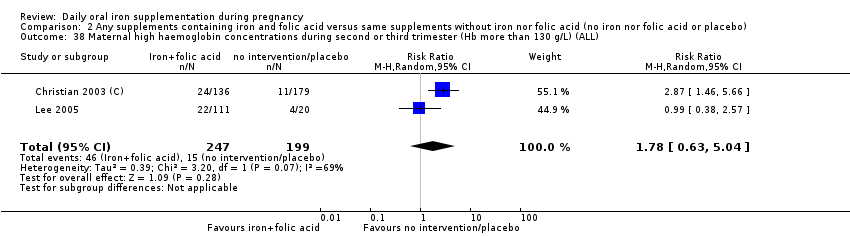
Comparison 2 Any supplements containing iron and folic acid versus same supplements without iron nor folic acid (no iron nor folic acid or placebo), Outcome 38 Maternal high haemoglobin concentrations during second or third trimester (Hb more than 130 g/L) (ALL).

Comparison 2 Any supplements containing iron and folic acid versus same supplements without iron nor folic acid (no iron nor folic acid or placebo), Outcome 39 Maternal high haemoglobin concentrations at or near term (Hb more than 130 g/L at 34 weeks' gestation or more) (ALL).

Comparison 2 Any supplements containing iron and folic acid versus same supplements without iron nor folic acid (no iron nor folic acid or placebo), Outcome 40 Moderate anaemia at postpartum (Hb more than 80 g/L and less than 110 g/L) (ALL).
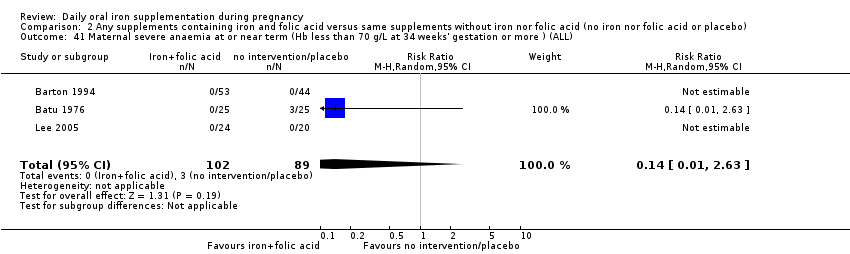
Comparison 2 Any supplements containing iron and folic acid versus same supplements without iron nor folic acid (no iron nor folic acid or placebo), Outcome 41 Maternal severe anaemia at or near term (Hb less than 70 g/L at 34 weeks' gestation or more ) (ALL).

Comparison 2 Any supplements containing iron and folic acid versus same supplements without iron nor folic acid (no iron nor folic acid or placebo), Outcome 42 Severe anaemia at postpartum (Hb less than 80 g/L) (ALL).

Comparison 2 Any supplements containing iron and folic acid versus same supplements without iron nor folic acid (no iron nor folic acid or placebo), Outcome 43 Puerperal infection (ALL).

Comparison 2 Any supplements containing iron and folic acid versus same supplements without iron nor folic acid (no iron nor folic acid or placebo), Outcome 44 Antepartum haemorrhage (ALL).

Comparison 2 Any supplements containing iron and folic acid versus same supplements without iron nor folic acid (no iron nor folic acid or placebo), Outcome 46 Placental abruption (ALL).
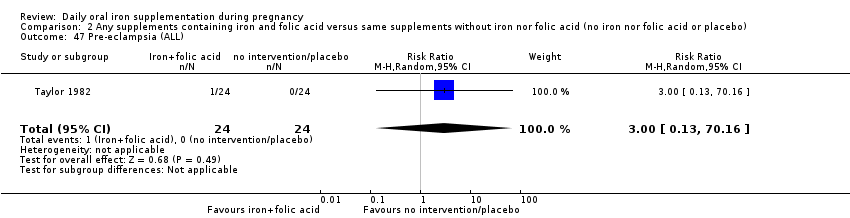
Comparison 2 Any supplements containing iron and folic acid versus same supplements without iron nor folic acid (no iron nor folic acid or placebo), Outcome 47 Pre‐eclampsia (ALL).

Comparison 3 Supplementation with iron alone versus no treatment/placebo, Outcome 1 Low birthweight (less than 2500 g) (ALL).
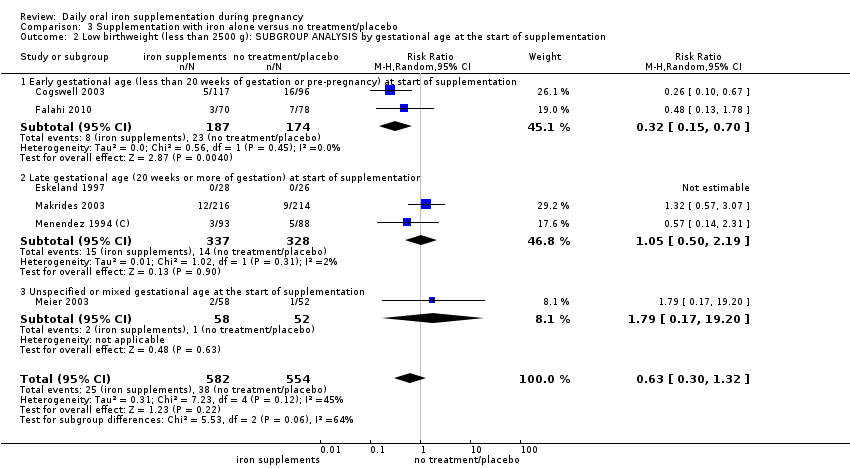
Comparison 3 Supplementation with iron alone versus no treatment/placebo, Outcome 2 Low birthweight (less than 2500 g): SUBGROUP ANALYSIS by gestational age at the start of supplementation.

Comparison 3 Supplementation with iron alone versus no treatment/placebo, Outcome 3 Low birthweight (less than 2500 g): SUBGROUP ANALYSIS by anaemia status at the start of supplementation.

Comparison 3 Supplementation with iron alone versus no treatment/placebo, Outcome 4 Low birthweight (less than 2500 g): SUBGROUP ANALYSIS by dose of iron.

Comparison 3 Supplementation with iron alone versus no treatment/placebo, Outcome 5 Low birthweight (less than 2500 g): SUBGROUP ANALYSIS by malarial status of setting.
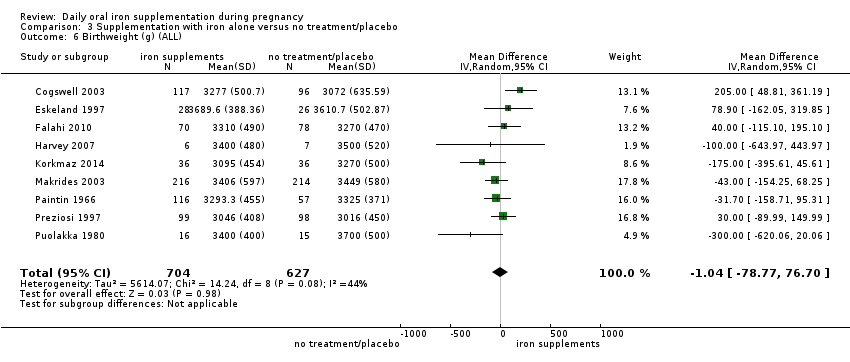
Comparison 3 Supplementation with iron alone versus no treatment/placebo, Outcome 6 Birthweight (g) (ALL).

Comparison 3 Supplementation with iron alone versus no treatment/placebo, Outcome 7 Birthweight (g): SUBGROUP ANALYSIS by gestational age at the start of supplementation.
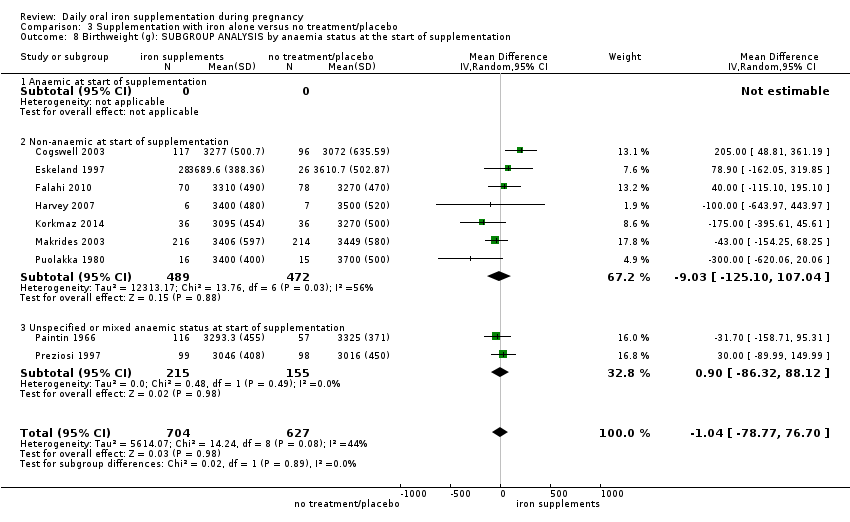
Comparison 3 Supplementation with iron alone versus no treatment/placebo, Outcome 8 Birthweight (g): SUBGROUP ANALYSIS by anaemia status at the start of supplementation.

Comparison 3 Supplementation with iron alone versus no treatment/placebo, Outcome 9 Birthweight (g): SUBGROUP ANALYSIS by dose of iron.

Comparison 3 Supplementation with iron alone versus no treatment/placebo, Outcome 10 Birthweight (g): SUBGROUP ANALYSIS by malarial status of setting.
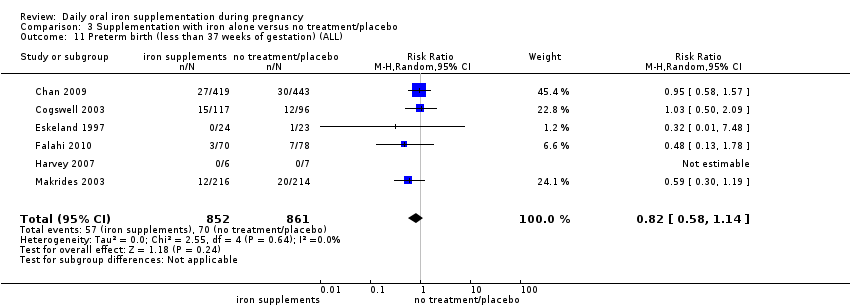
Comparison 3 Supplementation with iron alone versus no treatment/placebo, Outcome 11 Preterm birth (less than 37 weeks of gestation) (ALL).
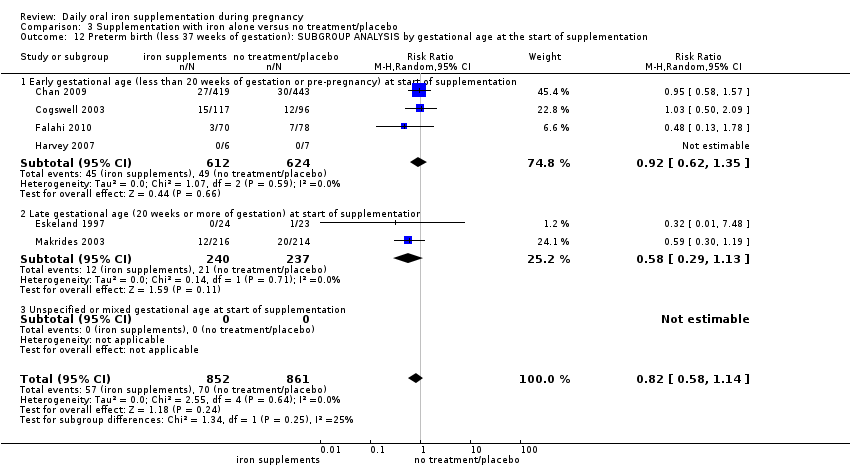
Comparison 3 Supplementation with iron alone versus no treatment/placebo, Outcome 12 Preterm birth (less 37 weeks of gestation): SUBGROUP ANALYSIS by gestational age at the start of supplementation.

Comparison 3 Supplementation with iron alone versus no treatment/placebo, Outcome 13 Preterm birth (less 37 weeks of gestation): SUBGROUP ANALYSIS by anaemia status at the start of supplementation.

Comparison 3 Supplementation with iron alone versus no treatment/placebo, Outcome 14 Preterm birth (less 37 weeks of gestation): SUBGROUP ANALYSIS by dose of iron.
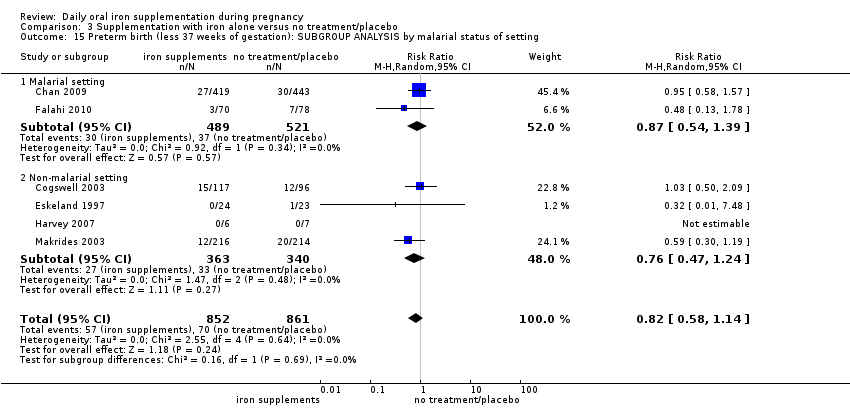
Comparison 3 Supplementation with iron alone versus no treatment/placebo, Outcome 15 Preterm birth (less 37 weeks of gestation): SUBGROUP ANALYSIS by malarial status of setting.

Comparison 3 Supplementation with iron alone versus no treatment/placebo, Outcome 17 Congenital anomalies (ALL).
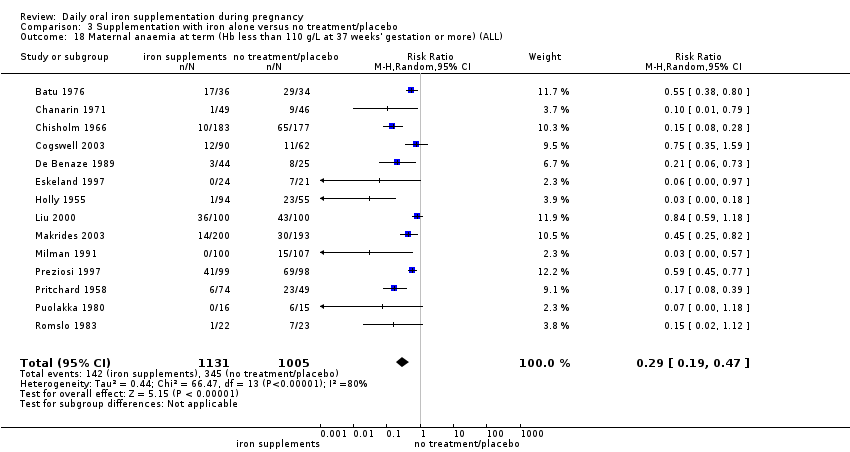
Comparison 3 Supplementation with iron alone versus no treatment/placebo, Outcome 18 Maternal anaemia at term (Hb less than 110 g/L at 37 weeks' gestation or more) (ALL).

Comparison 3 Supplementation with iron alone versus no treatment/placebo, Outcome 19 Maternal anaemia at term (Hb less than 110 g/L at 37 weeks' gestation or more): SUBGROUP ANALYSIS by gestational age at the start of supplementation.

Comparison 3 Supplementation with iron alone versus no treatment/placebo, Outcome 20 Maternal anaemia at term (Hb less than 110 g/L at 37 weeks gestation or more): SUBGROUP ANALYSIS by anaemia status at the start of supplementation.

Comparison 3 Supplementation with iron alone versus no treatment/placebo, Outcome 21 Maternal anaemia at term (Hb less than 110 g/L at 37 weeks' gestation or more): SUBGROUP ANALYSIS by dose of iron.
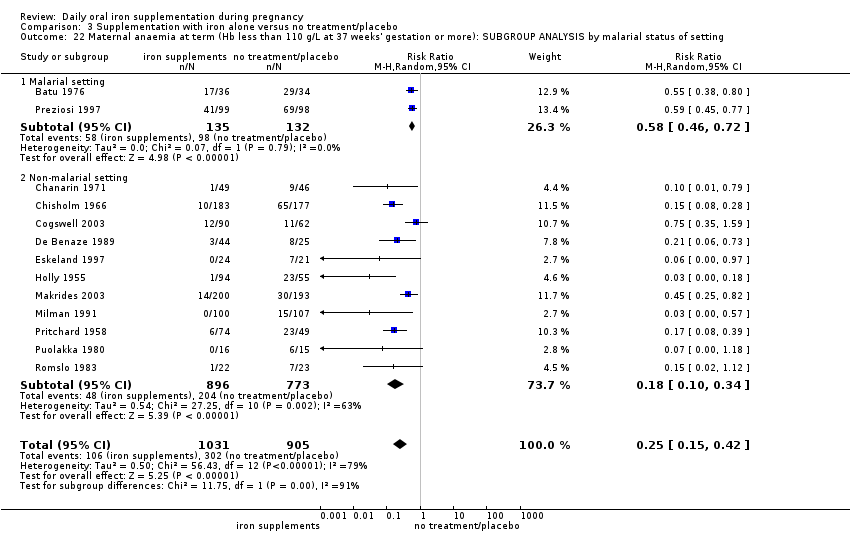
Comparison 3 Supplementation with iron alone versus no treatment/placebo, Outcome 22 Maternal anaemia at term (Hb less than 110 g/L at 37 weeks' gestation or more): SUBGROUP ANALYSIS by malarial status of setting.

Comparison 3 Supplementation with iron alone versus no treatment/placebo, Outcome 23 Maternal iron deficiency at term (as defined by trialists, based on any indicator of iron status at 37 weeks' gestation or more) (ALL).
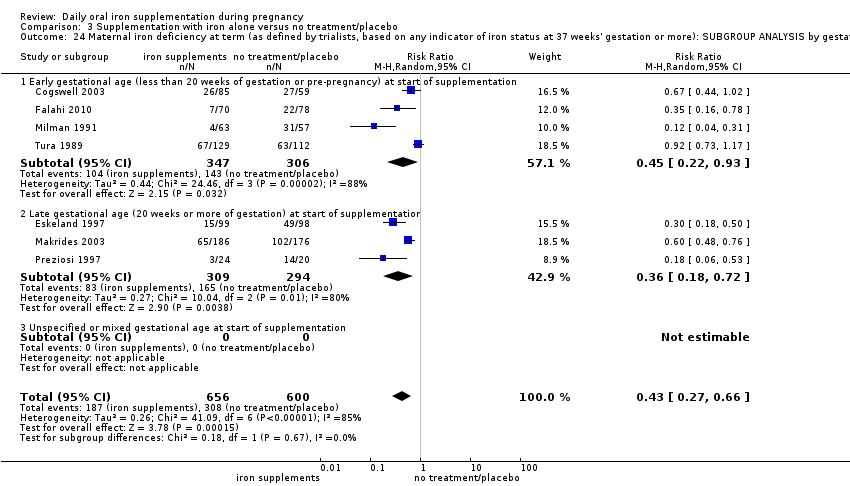
Comparison 3 Supplementation with iron alone versus no treatment/placebo, Outcome 24 Maternal iron deficiency at term (as defined by trialists, based on any indicator of iron status at 37 weeks' gestation or more): SUBGROUP ANALYSIS by gestational age at the start of supplementation.

Comparison 3 Supplementation with iron alone versus no treatment/placebo, Outcome 25 Maternal iron deficiency at term (as defined by trialists, based on any indicator of iron status at 37 weeks' gestation or more): SUBGROUP ANALYSIS by anaemia status at the start of supplementation.

Comparison 3 Supplementation with iron alone versus no treatment/placebo, Outcome 26 Maternal iron deficiency at term (as defined by trialists, based on any indicator of iron status at 37 weeks' gestation or more): SUBGROUP ANALYSIS by dose of iron.
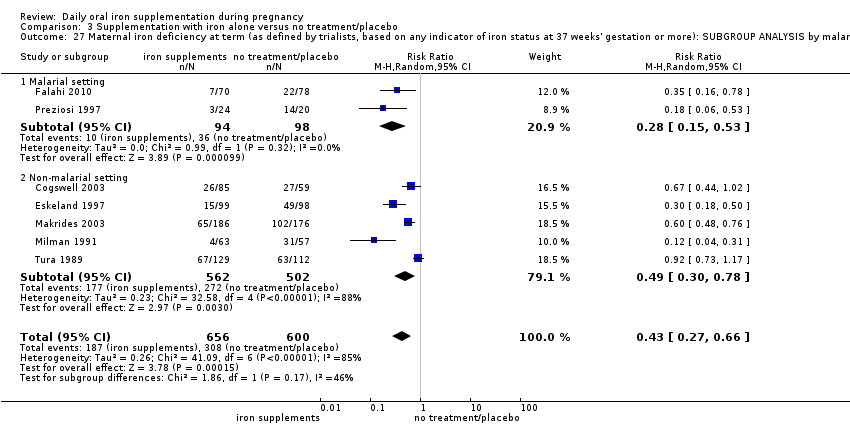
Comparison 3 Supplementation with iron alone versus no treatment/placebo, Outcome 27 Maternal iron deficiency at term (as defined by trialists, based on any indicator of iron status at 37 weeks' gestation or more): SUBGROUP ANALYSIS by malarial status of setting.
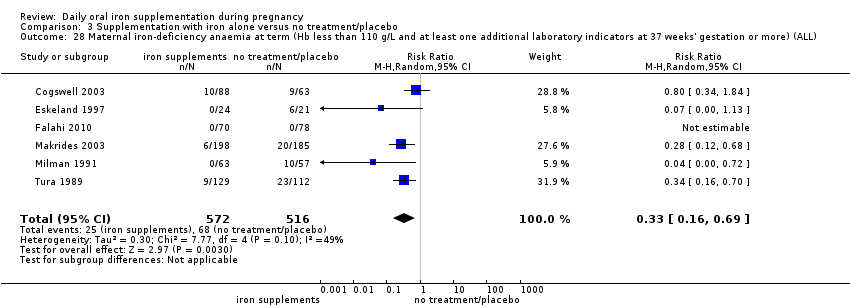
Comparison 3 Supplementation with iron alone versus no treatment/placebo, Outcome 28 Maternal iron‐deficiency anaemia at term (Hb less than 110 g/L and at least one additional laboratory indicators at 37 weeks' gestation or more) (ALL).

Comparison 3 Supplementation with iron alone versus no treatment/placebo, Outcome 29 Maternal iron‐deficiency anaemia at term (Hb less than 110 g/L and at least one additional laboratory indicators at 37 weeks' gestation or more): SUBGROUP ANALYSIS by gestational age at the start of supplementation.

Comparison 3 Supplementation with iron alone versus no treatment/placebo, Outcome 30 Maternal iron‐deficiency anaemia at term (Hb less than 110 g/L and at least one additional laboratory indicators at 37 weeks' gestation or more): SUBGROUP ANALYSIS by anaemia status at the start of supplementation.

Comparison 3 Supplementation with iron alone versus no treatment/placebo, Outcome 31 Maternal iron‐deficiency anaemia at term (Hb less than 110 g/L and at least one additional laboratory indicators at 37 weeks' gestation or more): SUBGROUP ANALYSIS by dose of iron.

Comparison 3 Supplementation with iron alone versus no treatment/placebo, Outcome 32 Maternal iron‐deficiency anaemia at term (Hb less than 110 g/L and at least one additional laboratory indicators at 37 weeks' gestation or more): SUBGROUP ANALYSIS by malarial status of setting.

Comparison 3 Supplementation with iron alone versus no treatment/placebo, Outcome 33 Maternal death (death while pregnant or within 42 days of termination of pregnancy) (ALL).

Comparison 3 Supplementation with iron alone versus no treatment/placebo, Outcome 34 Side effects (any reported throughout the intervention period) (ALL).

Comparison 3 Supplementation with iron alone versus no treatment/placebo, Outcome 35 Side effects (any reported throughout the intervention period): SUBGROUP ANALYSIS by gestational age at the start of supplementation.

Comparison 3 Supplementation with iron alone versus no treatment/placebo, Outcome 36 Side effects (any reported throughout the intervention period): SUBGROUP ANALYSIS by anaemia status at the start of supplementation.

Comparison 3 Supplementation with iron alone versus no treatment/placebo, Outcome 37 Side effects (any reported throughout the intervention period): SUBGROUP ANALYSIS by dose of iron.
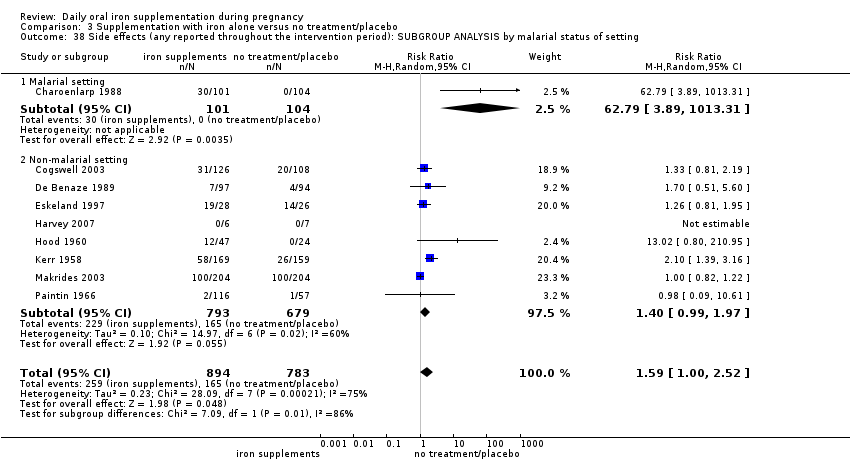
Comparison 3 Supplementation with iron alone versus no treatment/placebo, Outcome 38 Side effects (any reported throughout the intervention period): SUBGROUP ANALYSIS by malarial status of setting.
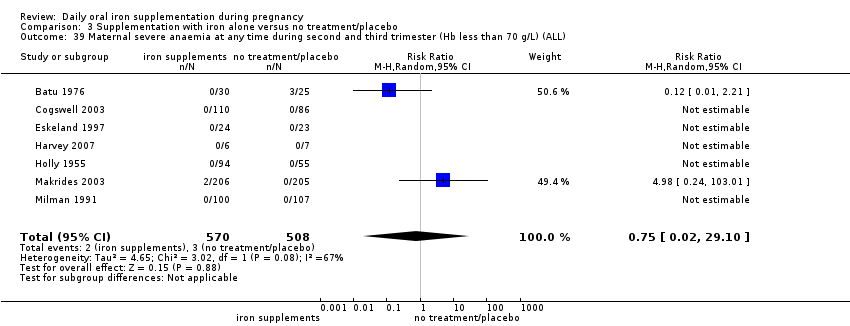
Comparison 3 Supplementation with iron alone versus no treatment/placebo, Outcome 39 Maternal severe anaemia at any time during second and third trimester (Hb less than 70 g/L) (ALL).
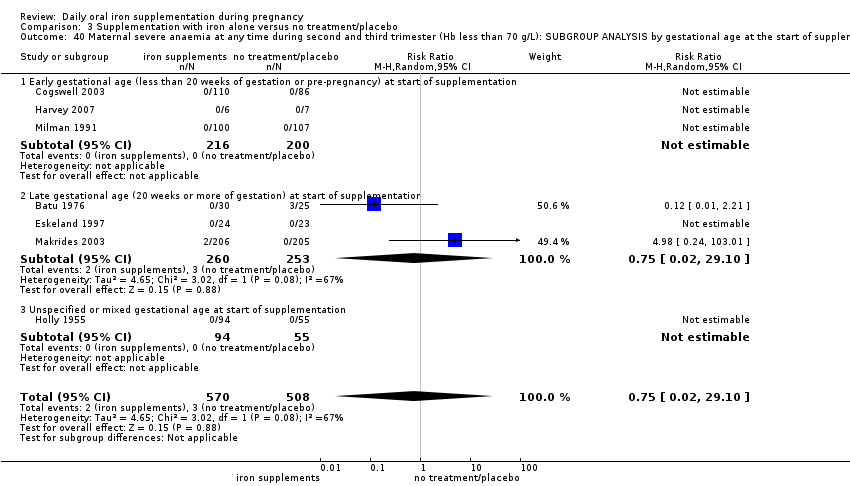
Comparison 3 Supplementation with iron alone versus no treatment/placebo, Outcome 40 Maternal severe anaemia at any time during second and third trimester (Hb less than 70 g/L): SUBGROUP ANALYSIS by gestational age at the start of supplementation.
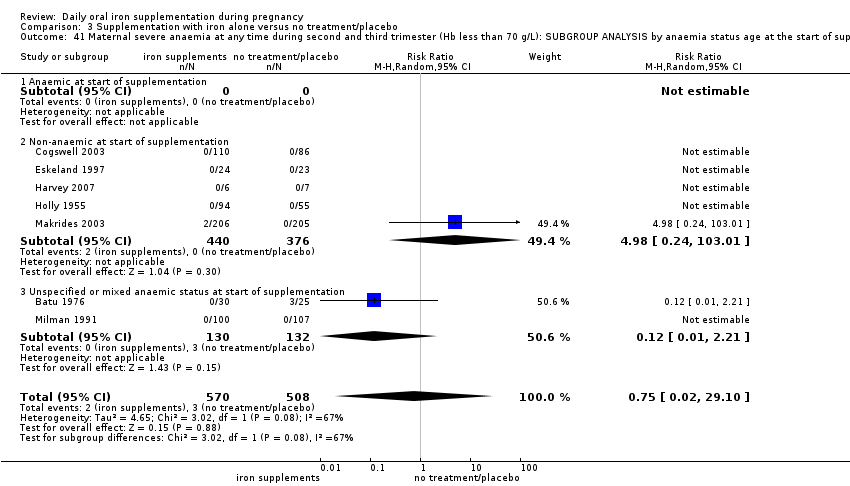
Comparison 3 Supplementation with iron alone versus no treatment/placebo, Outcome 41 Maternal severe anaemia at any time during second and third trimester (Hb less than 70 g/L): SUBGROUP ANALYSIS by anaemia status age at the start of supplementation.
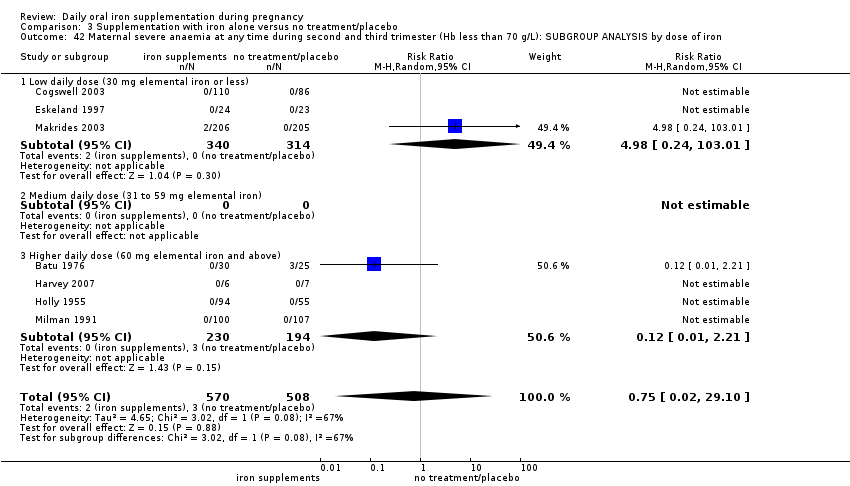
Comparison 3 Supplementation with iron alone versus no treatment/placebo, Outcome 42 Maternal severe anaemia at any time during second and third trimester (Hb less than 70 g/L): SUBGROUP ANALYSIS by dose of iron.

Comparison 3 Supplementation with iron alone versus no treatment/placebo, Outcome 43 Maternal severe anaemia at any time during second and third trimester (Hb less than 70 g/L): SUBGROUP ANALYSIS by malarial status of setting.

Comparison 3 Supplementation with iron alone versus no treatment/placebo, Outcome 46 Very low birthweight (less than 1500 g) (ALL).
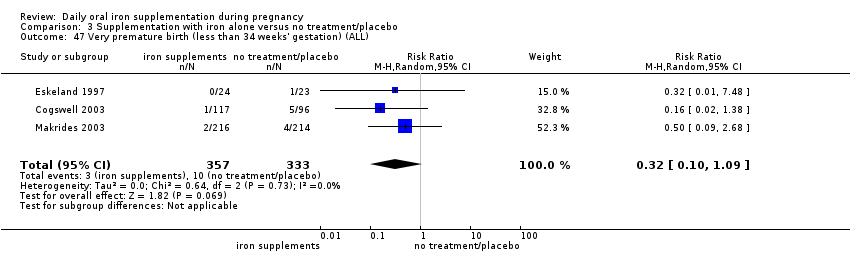
Comparison 3 Supplementation with iron alone versus no treatment/placebo, Outcome 47 Very premature birth (less than 34 weeks' gestation) (ALL).
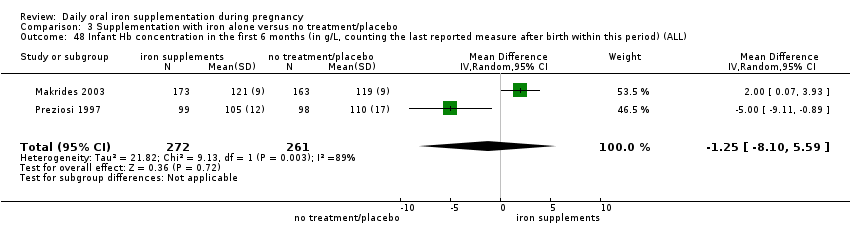
Comparison 3 Supplementation with iron alone versus no treatment/placebo, Outcome 48 Infant Hb concentration in the first 6 months (in g/L, counting the last reported measure after birth within this period) (ALL).

Comparison 3 Supplementation with iron alone versus no treatment/placebo, Outcome 49 Infant serum ferritin concentration in the first 6 months (in μg/L, counting the last reported measure after birth within this period) (ALL).

Comparison 3 Supplementation with iron alone versus no treatment/placebo, Outcome 50 Admission to special care unit (ALL).
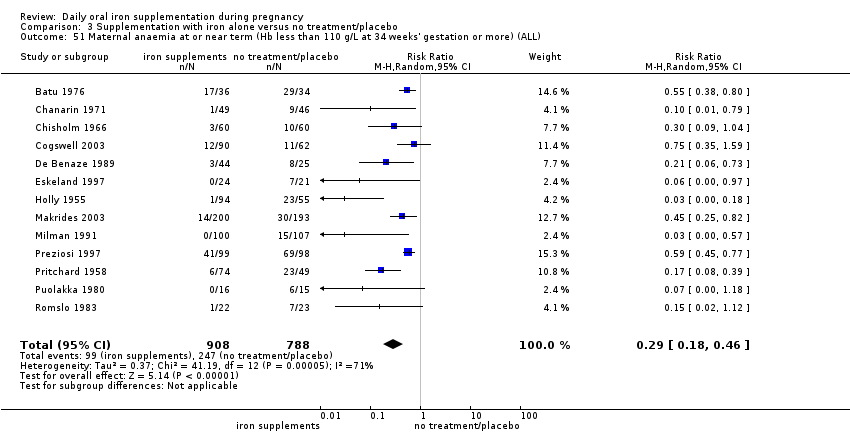
Comparison 3 Supplementation with iron alone versus no treatment/placebo, Outcome 51 Maternal anaemia at or near term (Hb less than 110 g/L at 34 weeks' gestation or more) (ALL).
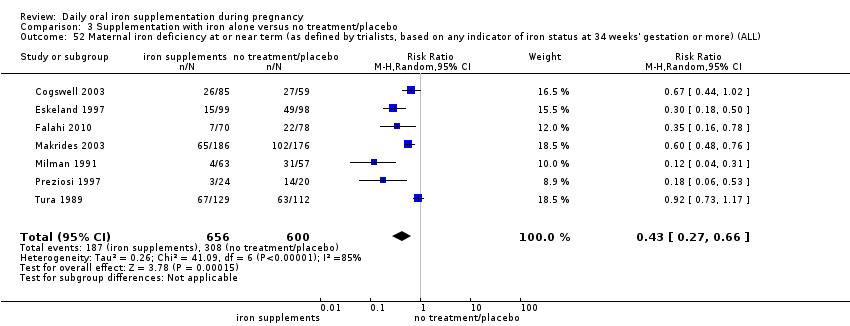
Comparison 3 Supplementation with iron alone versus no treatment/placebo, Outcome 52 Maternal iron deficiency at or near term (as defined by trialists, based on any indicator of iron status at 34 weeks' gestation or more) (ALL).
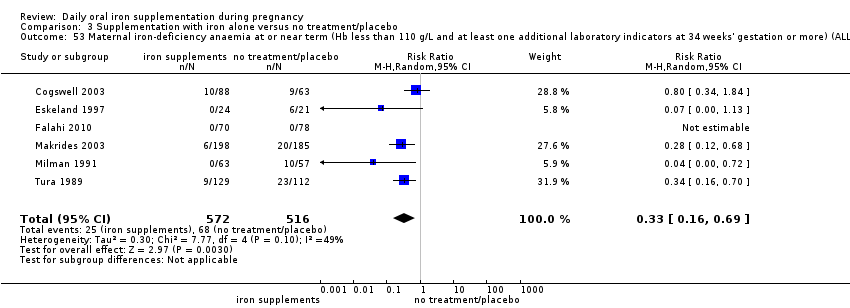
Comparison 3 Supplementation with iron alone versus no treatment/placebo, Outcome 53 Maternal iron‐deficiency anaemia at or near term (Hb less than 110 g/L and at least one additional laboratory indicators at 34 weeks' gestation or more) (ALL).
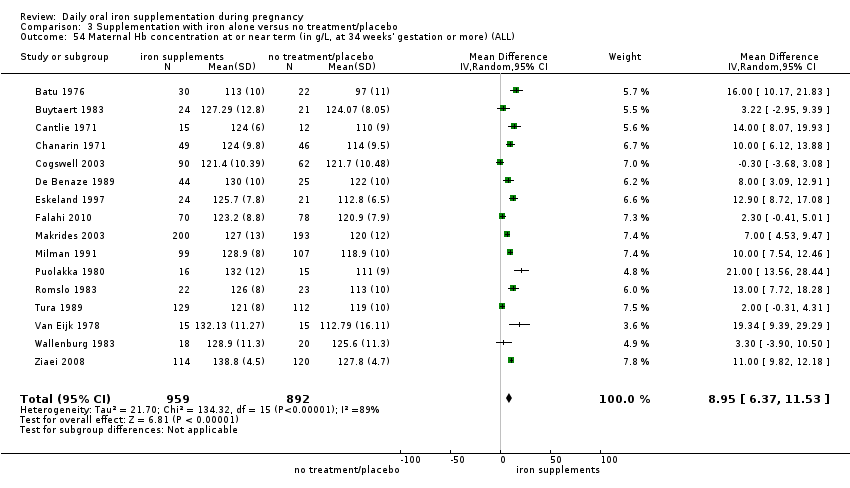
Comparison 3 Supplementation with iron alone versus no treatment/placebo, Outcome 54 Maternal Hb concentration at or near term (in g/L, at 34 weeks' gestation or more) (ALL).
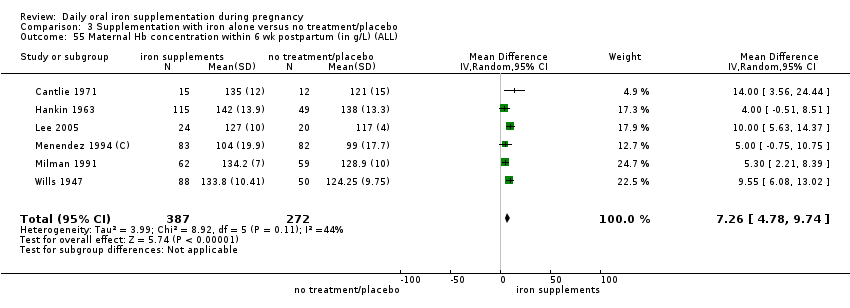
Comparison 3 Supplementation with iron alone versus no treatment/placebo, Outcome 55 Maternal Hb concentration within 6 wk postpartum (in g/L) (ALL).

Comparison 3 Supplementation with iron alone versus no treatment/placebo, Outcome 56 Maternal high haemoglobin concentrations during second or third trimester (Hb more than 130 g/L) (ALL).
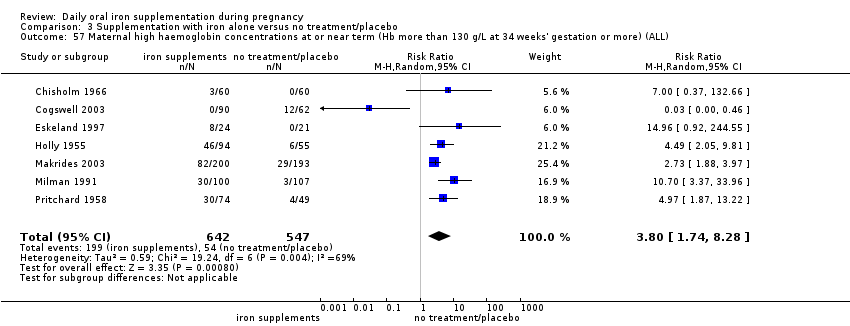
Comparison 3 Supplementation with iron alone versus no treatment/placebo, Outcome 57 Maternal high haemoglobin concentrations at or near term (Hb more than 130 g/L at 34 weeks' gestation or more) (ALL).

Comparison 3 Supplementation with iron alone versus no treatment/placebo, Outcome 58 Moderate anaemia at postpartum (Hb more than 80 g/L and less than 110 g/L) (ALL).

Comparison 3 Supplementation with iron alone versus no treatment/placebo, Outcome 59 Maternal severe anaemia at or near term (Hb less than 70 g/L at 34 weeks' gestation or more) (ALL).

Comparison 3 Supplementation with iron alone versus no treatment/placebo, Outcome 60 Severe anaemia at postpartum (Hb less than 80 g/L) (ALL).

Comparison 3 Supplementation with iron alone versus no treatment/placebo, Outcome 61 Puerperal infection (ALL).
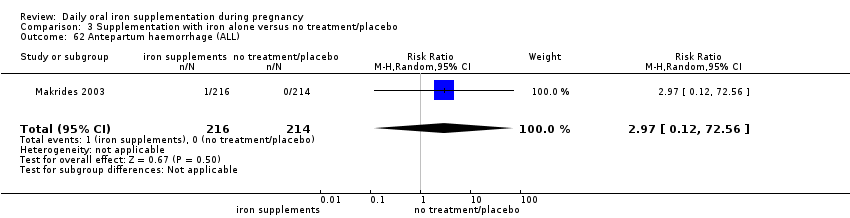
Comparison 3 Supplementation with iron alone versus no treatment/placebo, Outcome 62 Antepartum haemorrhage (ALL).

Comparison 3 Supplementation with iron alone versus no treatment/placebo, Outcome 63 Postpartum haemorrhage (ALL).
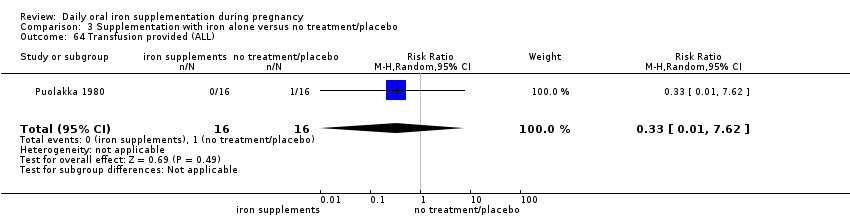
Comparison 3 Supplementation with iron alone versus no treatment/placebo, Outcome 64 Transfusion provided (ALL).

Comparison 3 Supplementation with iron alone versus no treatment/placebo, Outcome 65 Diarrhoea (ALL).
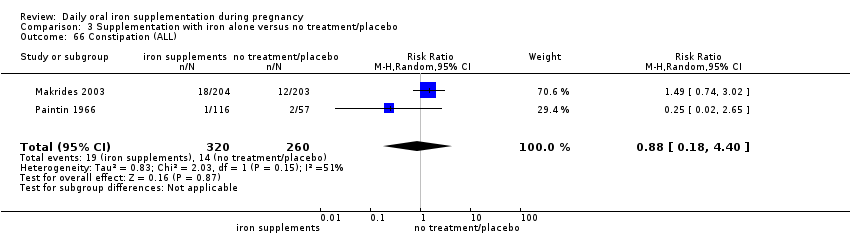
Comparison 3 Supplementation with iron alone versus no treatment/placebo, Outcome 66 Constipation (ALL).

Comparison 3 Supplementation with iron alone versus no treatment/placebo, Outcome 67 Nausea (ALL).

Comparison 3 Supplementation with iron alone versus no treatment/placebo, Outcome 68 Heartburn (ALL).

Comparison 3 Supplementation with iron alone versus no treatment/placebo, Outcome 69 Vomiting (ALL).
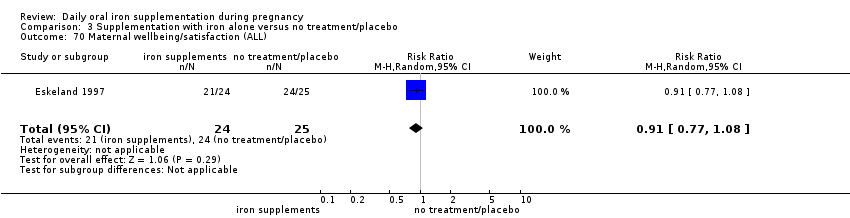
Comparison 3 Supplementation with iron alone versus no treatment/placebo, Outcome 70 Maternal wellbeing/satisfaction (ALL).

Comparison 3 Supplementation with iron alone versus no treatment/placebo, Outcome 71 Placental abruption (ALL).

Comparison 3 Supplementation with iron alone versus no treatment/placebo, Outcome 72 Premature rupture of membranes (ALL).

Comparison 3 Supplementation with iron alone versus no treatment/placebo, Outcome 73 Pre‐eclampsia (ALL).
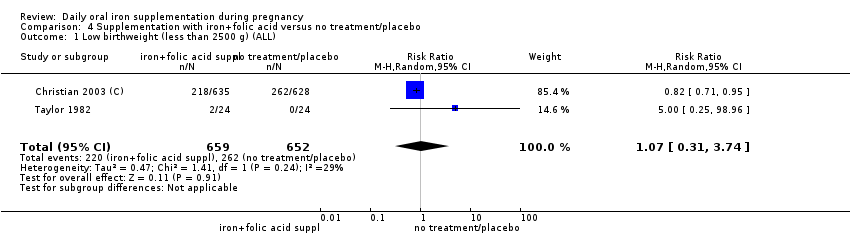
Comparison 4 Supplementation with iron+folic acid versus no treatment/placebo, Outcome 1 Low birthweight (less than 2500 g) (ALL).

Comparison 4 Supplementation with iron+folic acid versus no treatment/placebo, Outcome 2 Birthweight (ALL).
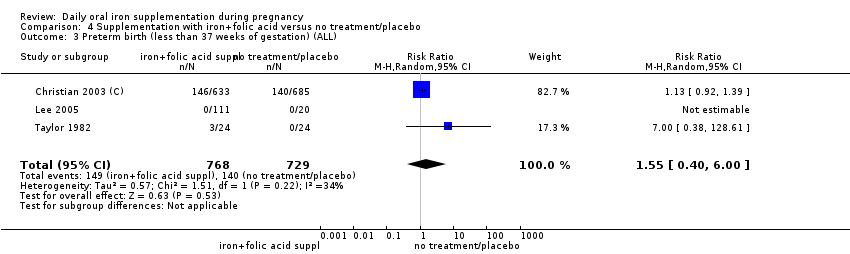
Comparison 4 Supplementation with iron+folic acid versus no treatment/placebo, Outcome 3 Preterm birth (less than 37 weeks of gestation) (ALL).
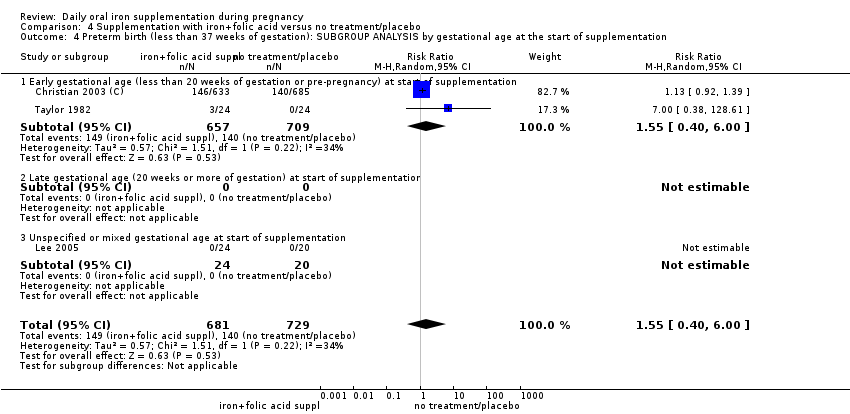
Comparison 4 Supplementation with iron+folic acid versus no treatment/placebo, Outcome 4 Preterm birth (less than 37 weeks of gestation): SUBGROUP ANALYSIS by gestational age at the start of supplementation.

Comparison 4 Supplementation with iron+folic acid versus no treatment/placebo, Outcome 5 Preterm birth (less than 37 weeks of gestation): SUBGROUP ANALYSIS by anaemia status at the start of supplementation.

Comparison 4 Supplementation with iron+folic acid versus no treatment/placebo, Outcome 6 Preterm birth (less than 37 weeks of gestation): SUBGROUP ANALYSIS by dose of iron.
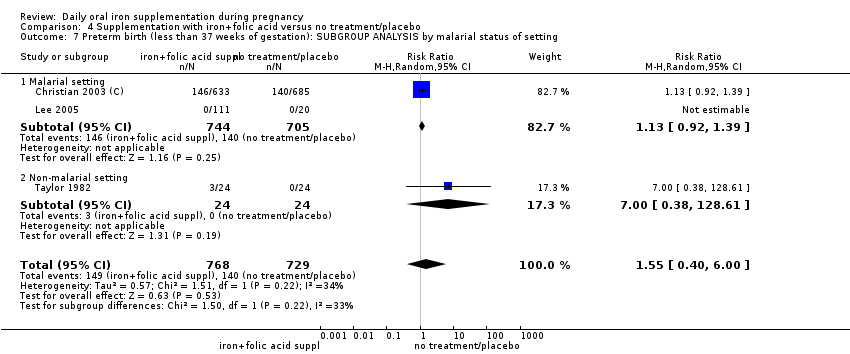
Comparison 4 Supplementation with iron+folic acid versus no treatment/placebo, Outcome 7 Preterm birth (less than 37 weeks of gestation): SUBGROUP ANALYSIS by malarial status of setting.

Comparison 4 Supplementation with iron+folic acid versus no treatment/placebo, Outcome 8 Neonatal death (within 28 days after delivery) (ALL).

Comparison 4 Supplementation with iron+folic acid versus no treatment/placebo, Outcome 9 Neonatal death (within 28 days after delivery): SUBGROUP ANALYSIS by gestational age at start of supplementation.

Comparison 4 Supplementation with iron+folic acid versus no treatment/placebo, Outcome 10 Neonatal death (within 28 days after delivery): SUBGROUP ANALYSIS by anaemia status at start of supplementation.

Comparison 4 Supplementation with iron+folic acid versus no treatment/placebo, Outcome 11 Neonatal death (within 28 days after delivery): SUBGROUP ANALYSIS by dose of iron.

Comparison 4 Supplementation with iron+folic acid versus no treatment/placebo, Outcome 12 Neonatal death (within 28 days after delivery): SUBGROUP ANALYSIS by malarial status of setting.

Comparison 4 Supplementation with iron+folic acid versus no treatment/placebo, Outcome 13 Congenital anomalies (ALL).
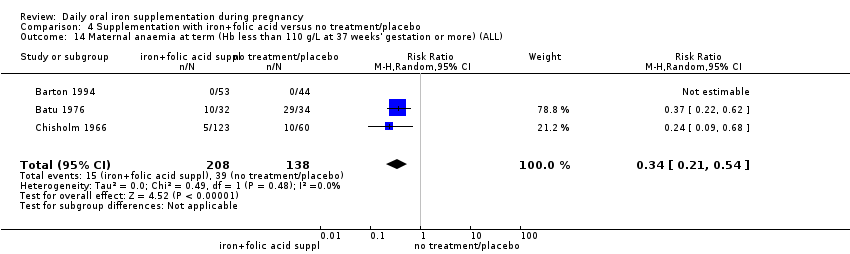
Comparison 4 Supplementation with iron+folic acid versus no treatment/placebo, Outcome 14 Maternal anaemia at term (Hb less than 110 g/L at 37 weeks' gestation or more) (ALL).
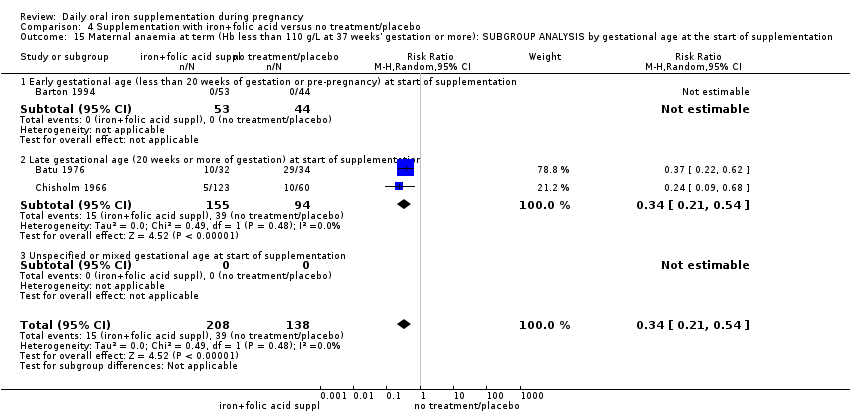
Comparison 4 Supplementation with iron+folic acid versus no treatment/placebo, Outcome 15 Maternal anaemia at term (Hb less than 110 g/L at 37 weeks' gestation or more): SUBGROUP ANALYSIS by gestational age at the start of supplementation.
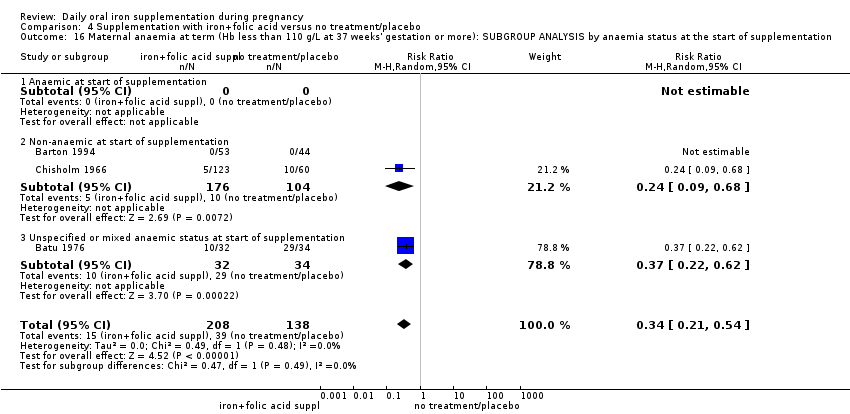
Comparison 4 Supplementation with iron+folic acid versus no treatment/placebo, Outcome 16 Maternal anaemia at term (Hb less than 110 g/L at 37 weeks' gestation or more): SUBGROUP ANALYSIS by anaemia status at the start of supplementation.

Comparison 4 Supplementation with iron+folic acid versus no treatment/placebo, Outcome 17 Maternal anaemia at term (Hb less than 110 g/Lat 37 weeks' gestation or more): SUBGROUP ANALYSIS by dose of iron.
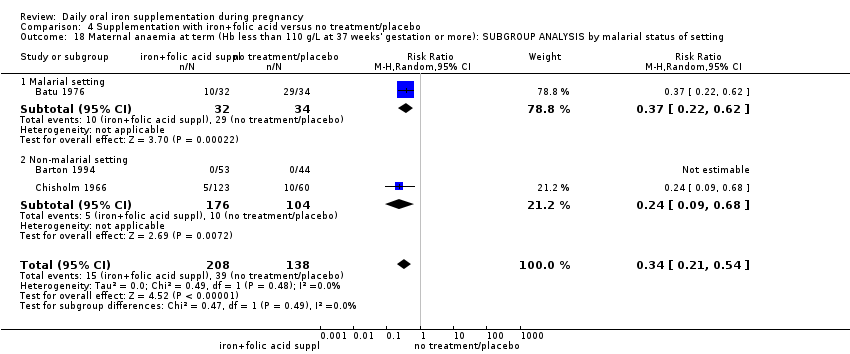
Comparison 4 Supplementation with iron+folic acid versus no treatment/placebo, Outcome 18 Maternal anaemia at term (Hb less than 110 g/L at 37 weeks' gestation or more): SUBGROUP ANALYSIS by malarial status of setting.
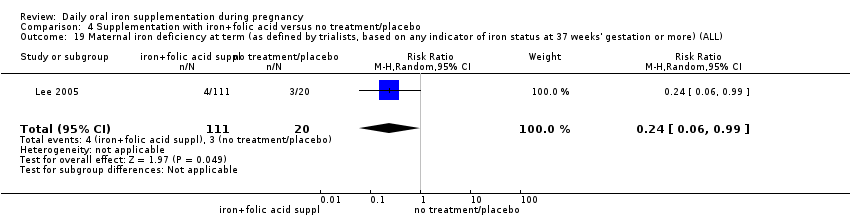
Comparison 4 Supplementation with iron+folic acid versus no treatment/placebo, Outcome 19 Maternal iron deficiency at term (as defined by trialists, based on any indicator of iron status at 37 weeks' gestation or more) (ALL).

Comparison 4 Supplementation with iron+folic acid versus no treatment/placebo, Outcome 20 Maternal iron‐deficiency anaemia at term (Hb less than 110 g/L and at least one additional laboratory indicators at 37 weeks' gestation or more) (ALL).
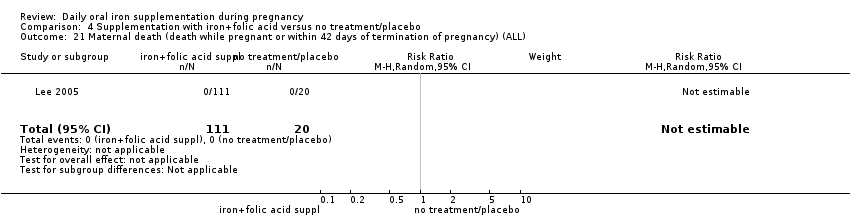
Comparison 4 Supplementation with iron+folic acid versus no treatment/placebo, Outcome 21 Maternal death (death while pregnant or within 42 days of termination of pregnancy) (ALL).

Comparison 4 Supplementation with iron+folic acid versus no treatment/placebo, Outcome 22 Side effects (any reported throughout the intervention period) (ALL).

Comparison 4 Supplementation with iron+folic acid versus no treatment/placebo, Outcome 23 Maternal severe anaemia at any time during second and third trimester (Hb less than 70 g/L) (ALL).
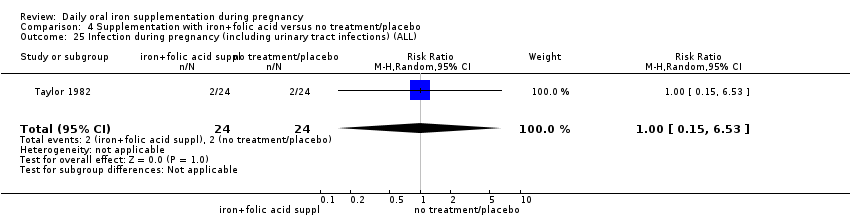
Comparison 4 Supplementation with iron+folic acid versus no treatment/placebo, Outcome 25 Infection during pregnancy (including urinary tract infections) (ALL).

Comparison 4 Supplementation with iron+folic acid versus no treatment/placebo, Outcome 26 Very low birthweight (less than 1500 g) (ALL).
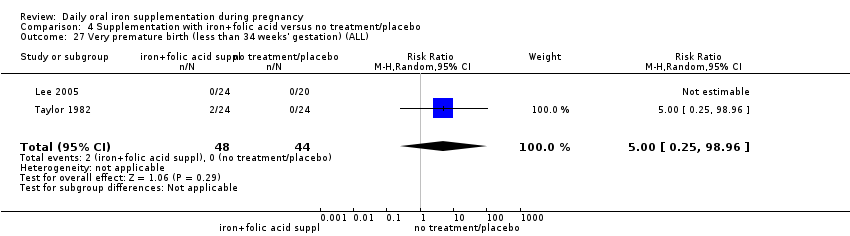
Comparison 4 Supplementation with iron+folic acid versus no treatment/placebo, Outcome 27 Very premature birth (less than 34 weeks' gestation) (ALL).
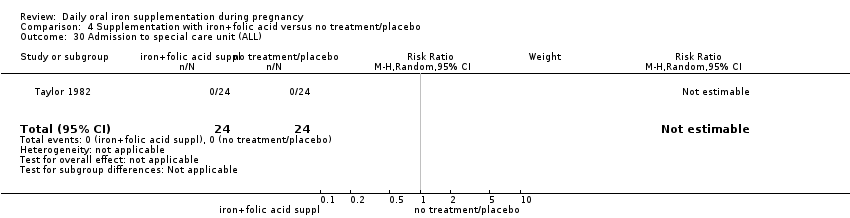
Comparison 4 Supplementation with iron+folic acid versus no treatment/placebo, Outcome 30 Admission to special care unit (ALL).
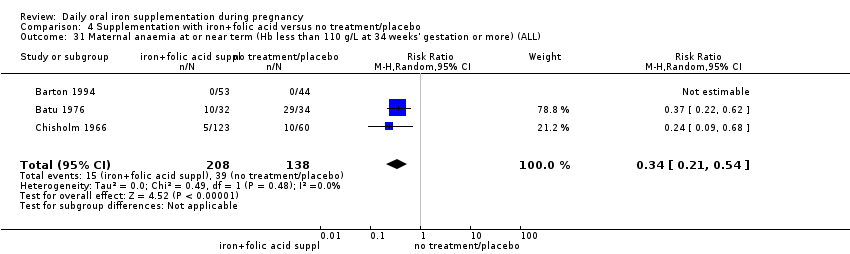
Comparison 4 Supplementation with iron+folic acid versus no treatment/placebo, Outcome 31 Maternal anaemia at or near term (Hb less than 110 g/L at 34 weeks' gestation or more) (ALL).

Comparison 4 Supplementation with iron+folic acid versus no treatment/placebo, Outcome 32 Maternal iron deficiency at or near term (as defined by trialists, based on any indicator of iron status at 34 weeks' gestation or more) (ALL).

Comparison 4 Supplementation with iron+folic acid versus no treatment/placebo, Outcome 33 Maternal iron‐deficiency anaemia at or near term (Hb less than 110 g/L and at least one additional laboratory indicators at 34 weeks' gestation or more) (ALL).

Comparison 4 Supplementation with iron+folic acid versus no treatment/placebo, Outcome 34 Maternal Hb concentration at term or near term (in g/L, at 34 weeks' gestation or more) (ALL).
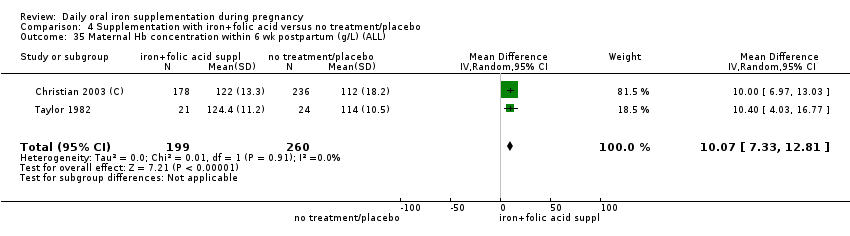
Comparison 4 Supplementation with iron+folic acid versus no treatment/placebo, Outcome 35 Maternal Hb concentration within 6 wk postpartum (g/L) (ALL).

Comparison 4 Supplementation with iron+folic acid versus no treatment/placebo, Outcome 36 Maternal high haemoglobin concentrations during second or third trimester (Hb more than 130 g/L) (ALL).

Comparison 4 Supplementation with iron+folic acid versus no treatment/placebo, Outcome 37 Maternal high haemoglobin concentrations at or near term (Hb more than 130 g/L at 34 weeks' gestation or more) (ALL).

Comparison 4 Supplementation with iron+folic acid versus no treatment/placebo, Outcome 38 Moderate anaemia at postpartum (Hb more than 80 g/L and less than 110 g/L) (ALL).
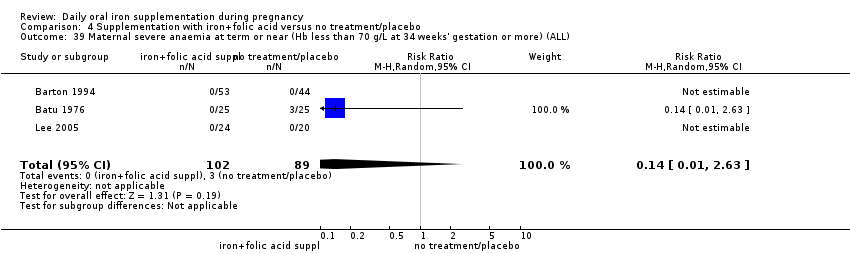
Comparison 4 Supplementation with iron+folic acid versus no treatment/placebo, Outcome 39 Maternal severe anaemia at term or near (Hb less than 70 g/L at 34 weeks' gestation or more) (ALL).
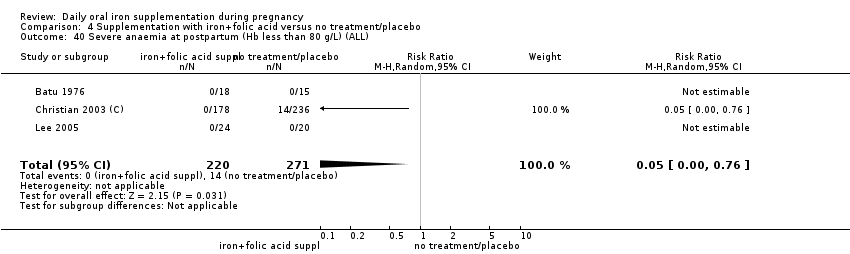
Comparison 4 Supplementation with iron+folic acid versus no treatment/placebo, Outcome 40 Severe anaemia at postpartum (Hb less than 80 g/L) (ALL).

Comparison 4 Supplementation with iron+folic acid versus no treatment/placebo, Outcome 41 Puerperal infection (ALL).

Comparison 4 Supplementation with iron+folic acid versus no treatment/placebo, Outcome 42 Antepartum haemorrhage (ALL).

Comparison 4 Supplementation with iron+folic acid versus no treatment/placebo, Outcome 44 Placental abruption (ALL).

Comparison 4 Supplementation with iron+folic acid versus no treatment/placebo, Outcome 45 Pre‐eclampsia (ALL).
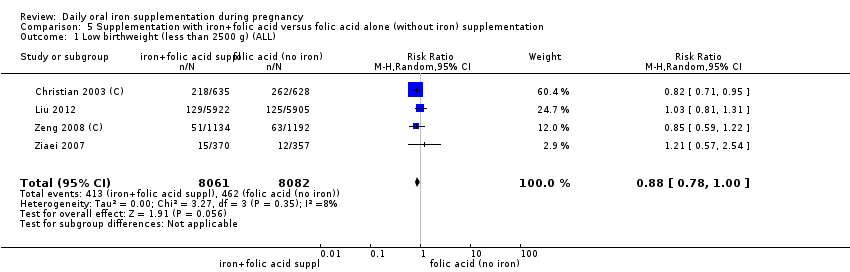
Comparison 5 Supplementation with iron+folic acid versus folic acid alone (without iron) supplementation, Outcome 1 Low birthweight (less than 2500 g) (ALL).
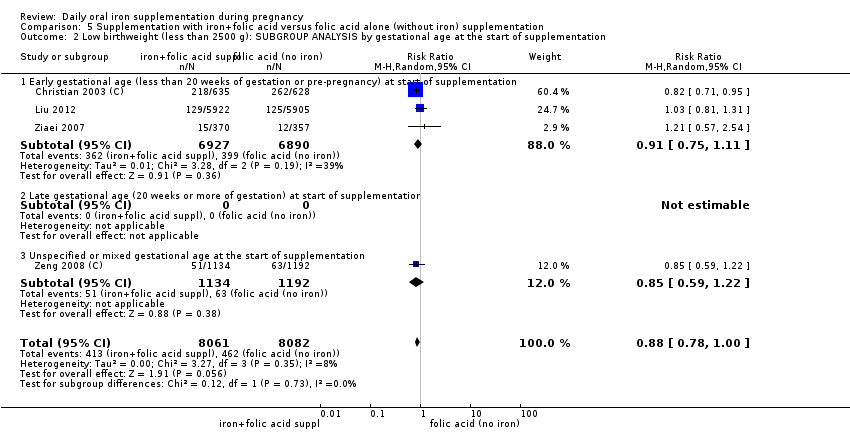
Comparison 5 Supplementation with iron+folic acid versus folic acid alone (without iron) supplementation, Outcome 2 Low birthweight (less than 2500 g): SUBGROUP ANALYSIS by gestational age at the start of supplementation.
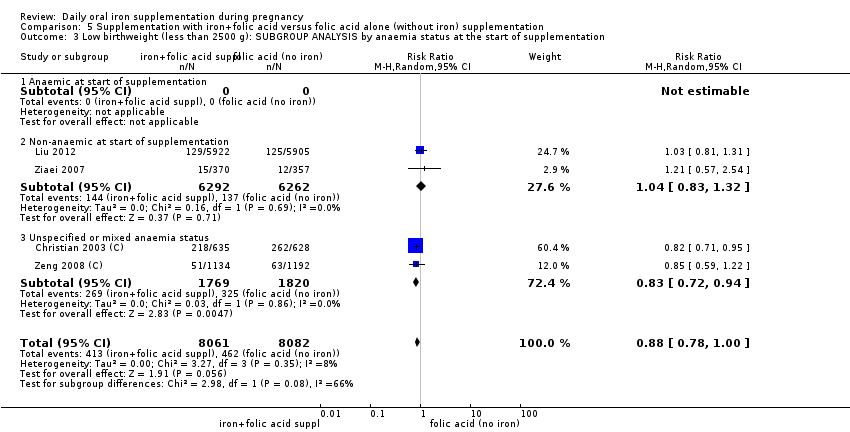
Comparison 5 Supplementation with iron+folic acid versus folic acid alone (without iron) supplementation, Outcome 3 Low birthweight (less than 2500 g): SUBGROUP ANALYSIS by anaemia status at the start of supplementation.

Comparison 5 Supplementation with iron+folic acid versus folic acid alone (without iron) supplementation, Outcome 4 Low birthweight (less than 2500 g): SUBGROUP ANALYSIS by dose of iron.

Comparison 5 Supplementation with iron+folic acid versus folic acid alone (without iron) supplementation, Outcome 5 Low birthweight (less than 2500 g): SUBGROUP ANALYSIS by malarial status of setting.

Comparison 5 Supplementation with iron+folic acid versus folic acid alone (without iron) supplementation, Outcome 6 Birthweight (g) (ALL).
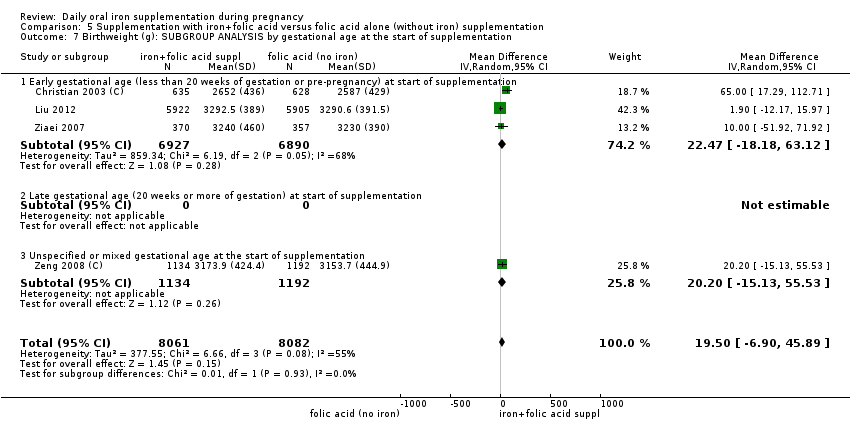
Comparison 5 Supplementation with iron+folic acid versus folic acid alone (without iron) supplementation, Outcome 7 Birthweight (g): SUBGROUP ANALYSIS by gestational age at the start of supplementation.

Comparison 5 Supplementation with iron+folic acid versus folic acid alone (without iron) supplementation, Outcome 8 Birthweight (g): SUBGROUP ANALYSIS by anaemia status at the start of supplementation.
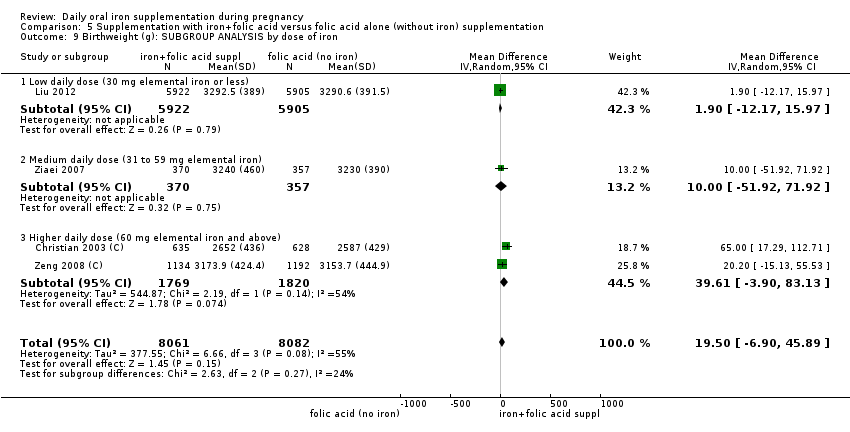
Comparison 5 Supplementation with iron+folic acid versus folic acid alone (without iron) supplementation, Outcome 9 Birthweight (g): SUBGROUP ANALYSIS by dose of iron.
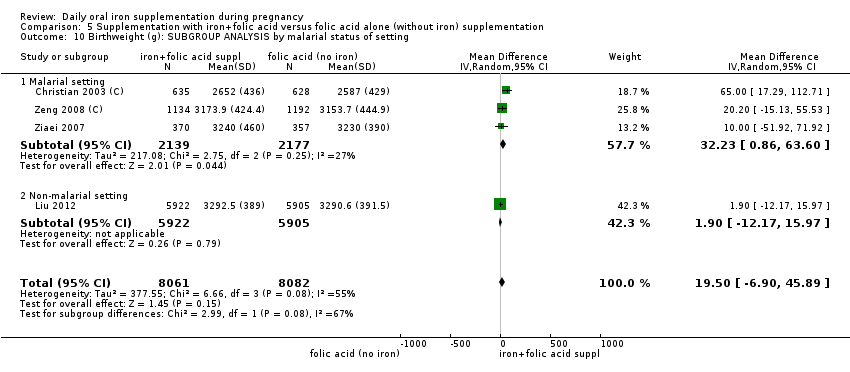
Comparison 5 Supplementation with iron+folic acid versus folic acid alone (without iron) supplementation, Outcome 10 Birthweight (g): SUBGROUP ANALYSIS by malarial status of setting.
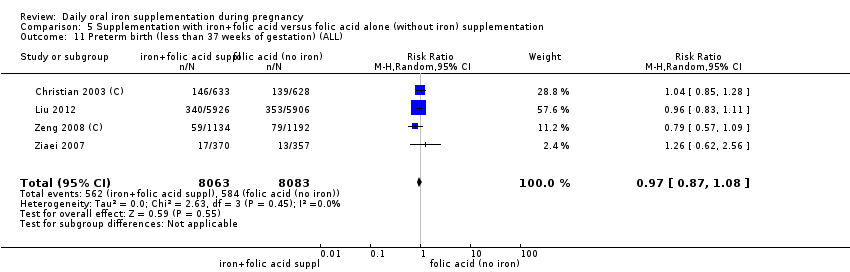
Comparison 5 Supplementation with iron+folic acid versus folic acid alone (without iron) supplementation, Outcome 11 Preterm birth (less than 37 weeks of gestation) (ALL).

Comparison 5 Supplementation with iron+folic acid versus folic acid alone (without iron) supplementation, Outcome 12 Preterm birth (less 37 weeks of gestation): SUBGROUP ANALYSIS by gestational age at the start of supplementation.

Comparison 5 Supplementation with iron+folic acid versus folic acid alone (without iron) supplementation, Outcome 13 Preterm birth (less 37 weeks of gestation): SUBGROUP ANALYSIS by anaemia status at the start of supplementation.
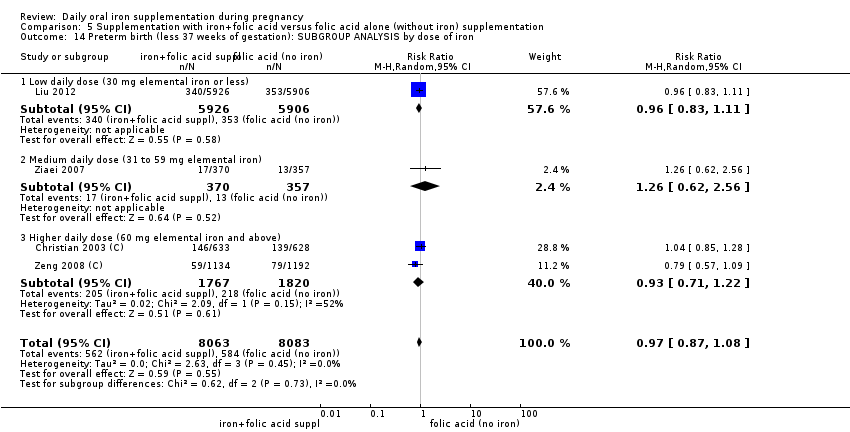
Comparison 5 Supplementation with iron+folic acid versus folic acid alone (without iron) supplementation, Outcome 14 Preterm birth (less 37 weeks of gestation): SUBGROUP ANALYSIS by dose of iron.
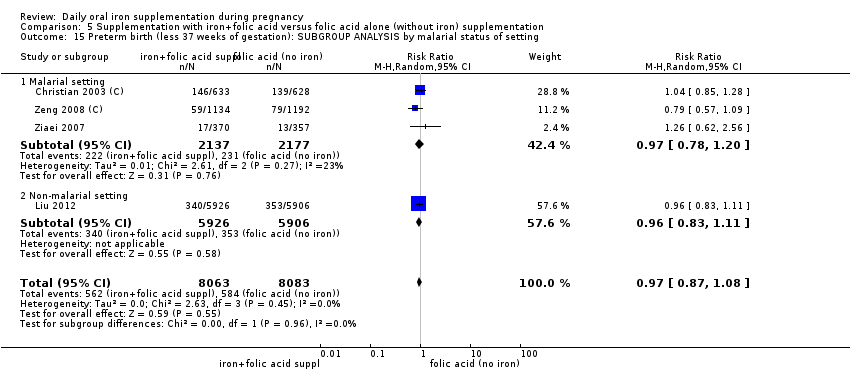
Comparison 5 Supplementation with iron+folic acid versus folic acid alone (without iron) supplementation, Outcome 15 Preterm birth (less 37 weeks of gestation): SUBGROUP ANALYSIS by malarial status of setting.
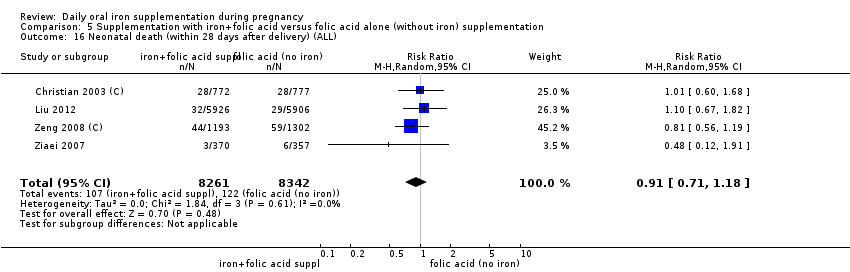
Comparison 5 Supplementation with iron+folic acid versus folic acid alone (without iron) supplementation, Outcome 16 Neonatal death (within 28 days after delivery) (ALL).

Comparison 5 Supplementation with iron+folic acid versus folic acid alone (without iron) supplementation, Outcome 17 Neonatal death (within 28 days after delivery): SUBGROUP ANALYSIS by gestational age at the start of supplementation.

Comparison 5 Supplementation with iron+folic acid versus folic acid alone (without iron) supplementation, Outcome 18 Neonatal death (within 28 days after delivery) : SUBGROUP ANALYSIS by anaemia status at the start of supplementation.
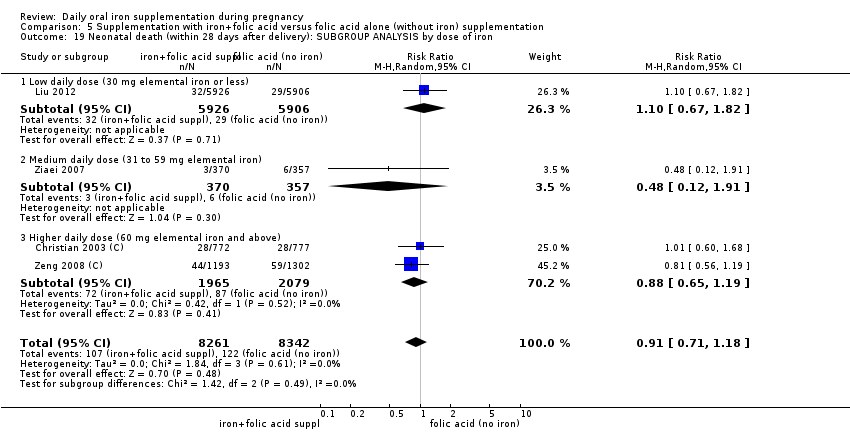
Comparison 5 Supplementation with iron+folic acid versus folic acid alone (without iron) supplementation, Outcome 19 Neonatal death (within 28 days after delivery): SUBGROUP ANALYSIS by dose of iron.

Comparison 5 Supplementation with iron+folic acid versus folic acid alone (without iron) supplementation, Outcome 20 Neonatal death (within 28 days after delivery): SUBGROUP ANALYSIS by malarial status of setting.

Comparison 5 Supplementation with iron+folic acid versus folic acid alone (without iron) supplementation, Outcome 21 Congenital anomalies (ALL).

Comparison 5 Supplementation with iron+folic acid versus folic acid alone (without iron) supplementation, Outcome 22 Maternal anaemia at term (Hb less than 110 g/L at 37 weeks' gestation or more) (ALL).

Comparison 5 Supplementation with iron+folic acid versus folic acid alone (without iron) supplementation, Outcome 23 Maternal anaemia at term (Hb less than 110 g/L at 37 weeks' gestation or more): SUBGROUP ANALYSIS by gestational age at the start of supplementation.

Comparison 5 Supplementation with iron+folic acid versus folic acid alone (without iron) supplementation, Outcome 24 Maternal anaemia at term (Hb less than 110 g/L at 37 weeks' gestation or more): SUBGROUP ANALYSIS by anaemia status at the start of supplementation.
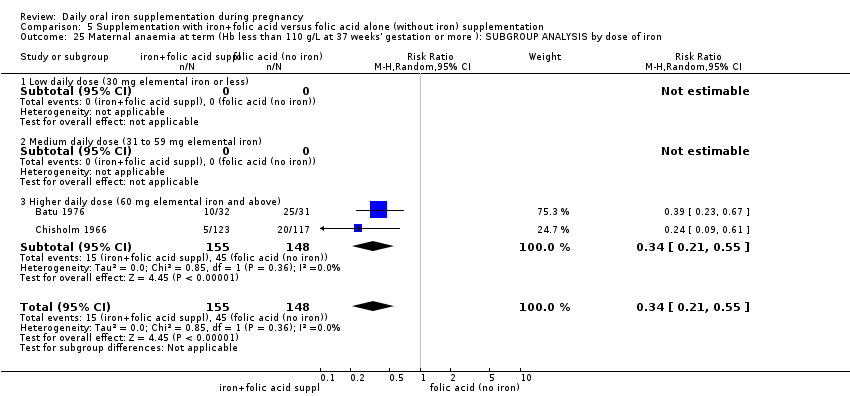
Comparison 5 Supplementation with iron+folic acid versus folic acid alone (without iron) supplementation, Outcome 25 Maternal anaemia at term (Hb less than 110 g/L at 37 weeks' gestation or more ): SUBGROUP ANALYSIS by dose of iron.
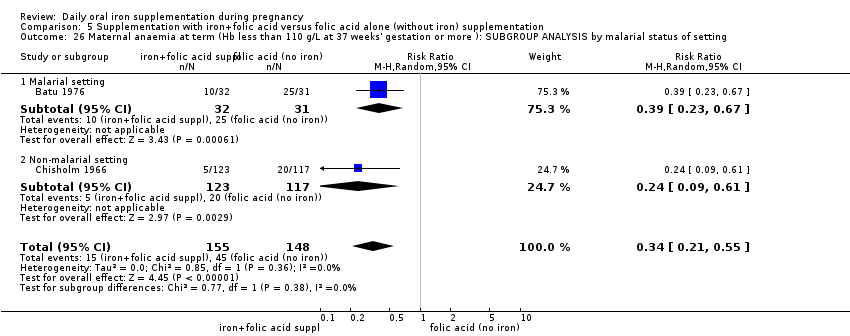
Comparison 5 Supplementation with iron+folic acid versus folic acid alone (without iron) supplementation, Outcome 26 Maternal anaemia at term (Hb less than 110 g/L at 37 weeks' gestation or more ): SUBGROUP ANALYSIS by malarial status of setting.

Comparison 5 Supplementation with iron+folic acid versus folic acid alone (without iron) supplementation, Outcome 28 Maternal iron‐deficiency anaemia at term (Hb less than 110 g/L and at least one additional laboratory indicators at 37 weeks' gestation or more) (ALL).

Comparison 5 Supplementation with iron+folic acid versus folic acid alone (without iron) supplementation, Outcome 30 Side effects (any reported throughout the intervention period) (ALL).

Comparison 5 Supplementation with iron+folic acid versus folic acid alone (without iron) supplementation, Outcome 31 Maternal severe anaemia at any time during second and third trimester (Hb less than 70 g/L) (ALL).
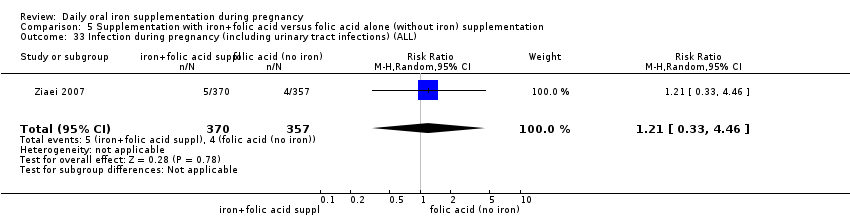
Comparison 5 Supplementation with iron+folic acid versus folic acid alone (without iron) supplementation, Outcome 33 Infection during pregnancy (including urinary tract infections) (ALL).

Comparison 5 Supplementation with iron+folic acid versus folic acid alone (without iron) supplementation, Outcome 34 Very low birthweight (less than 1500 g) (ALL).
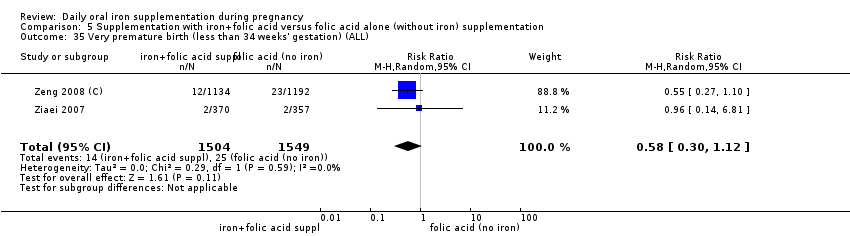
Comparison 5 Supplementation with iron+folic acid versus folic acid alone (without iron) supplementation, Outcome 35 Very premature birth (less than 34 weeks' gestation) (ALL).
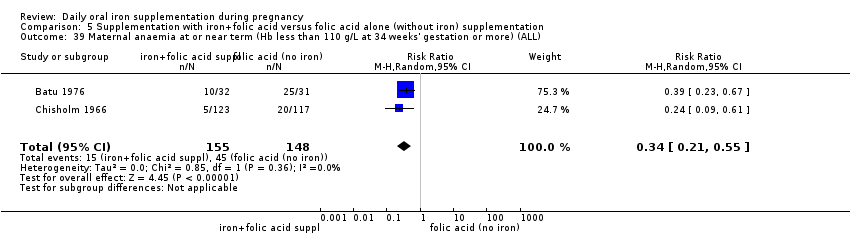
Comparison 5 Supplementation with iron+folic acid versus folic acid alone (without iron) supplementation, Outcome 39 Maternal anaemia at or near term (Hb less than 110 g/L at 34 weeks' gestation or more) (ALL).

Comparison 5 Supplementation with iron+folic acid versus folic acid alone (without iron) supplementation, Outcome 41 Maternal iron‐deficiency anaemia at or near term (Hb less than 110 g/L and at least one additional laboratory indicators at 34 weeks' gestation or more) (ALL).

Comparison 5 Supplementation with iron+folic acid versus folic acid alone (without iron) supplementation, Outcome 42 Maternal Hb concentration at or near term (in g/L at 34 weeks' gestation or more) (ALL).

Comparison 5 Supplementation with iron+folic acid versus folic acid alone (without iron) supplementation, Outcome 43 Maternal Hb concentration within 6 wk postpartum (in g/L) (ALL).

Comparison 5 Supplementation with iron+folic acid versus folic acid alone (without iron) supplementation, Outcome 44 Maternal high haemoglobin concentrations during second or third trimester (Hb more than 130 g/L) (ALL).

Comparison 5 Supplementation with iron+folic acid versus folic acid alone (without iron) supplementation, Outcome 45 Maternal high haemoglobin concentrations at or near term (Hb more than 130 g/L at 34 weeks' gestation or more) (ALL).
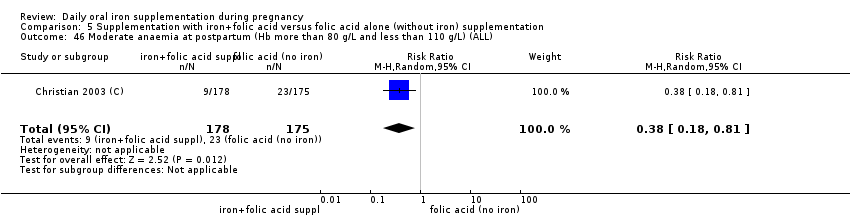
Comparison 5 Supplementation with iron+folic acid versus folic acid alone (without iron) supplementation, Outcome 46 Moderate anaemia at postpartum (Hb more than 80 g/L and less than 110 g/L) (ALL).

Comparison 5 Supplementation with iron+folic acid versus folic acid alone (without iron) supplementation, Outcome 47 Maternal severe anaemia at or near term (Hb less than 70 g/L at 34 weeks' gestation or more) (ALL).

Comparison 5 Supplementation with iron+folic acid versus folic acid alone (without iron) supplementation, Outcome 48 Severe anaemia at postpartum (Hb less than 80 g/L) (ALL).
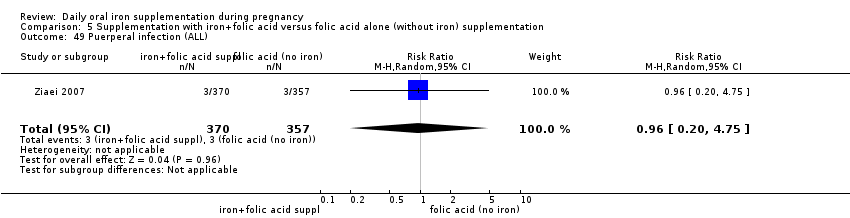
Comparison 5 Supplementation with iron+folic acid versus folic acid alone (without iron) supplementation, Outcome 49 Puerperal infection (ALL).

Comparison 5 Supplementation with iron+folic acid versus folic acid alone (without iron) supplementation, Outcome 50 Antepartum haemorrhage (ALL).
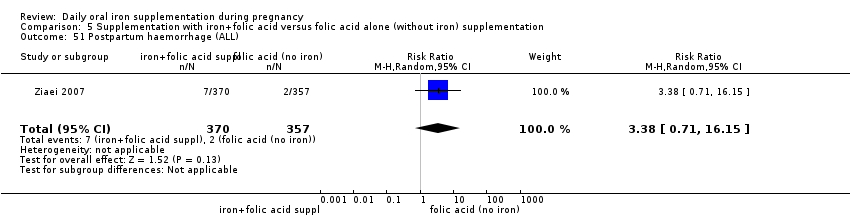
Comparison 5 Supplementation with iron+folic acid versus folic acid alone (without iron) supplementation, Outcome 51 Postpartum haemorrhage (ALL).
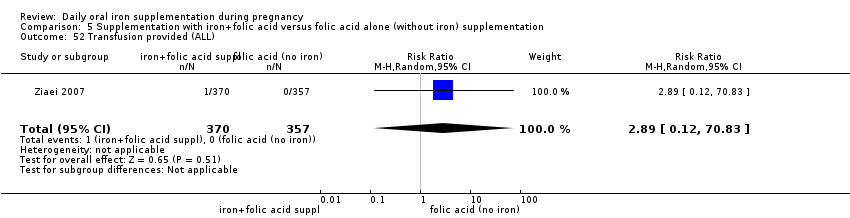
Comparison 5 Supplementation with iron+folic acid versus folic acid alone (without iron) supplementation, Outcome 52 Transfusion provided (ALL).
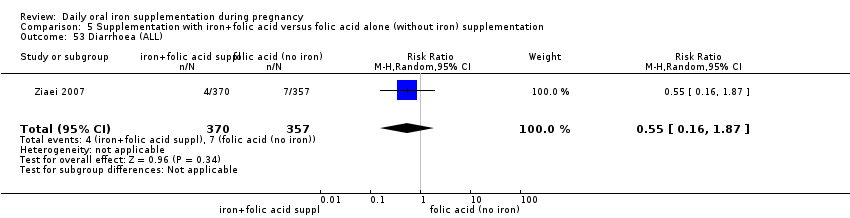
Comparison 5 Supplementation with iron+folic acid versus folic acid alone (without iron) supplementation, Outcome 53 Diarrhoea (ALL).

Comparison 5 Supplementation with iron+folic acid versus folic acid alone (without iron) supplementation, Outcome 54 Constipation (ALL).

Comparison 5 Supplementation with iron+folic acid versus folic acid alone (without iron) supplementation, Outcome 55 Nausea (ALL).

Comparison 5 Supplementation with iron+folic acid versus folic acid alone (without iron) supplementation, Outcome 56 Heartburn (ALL).
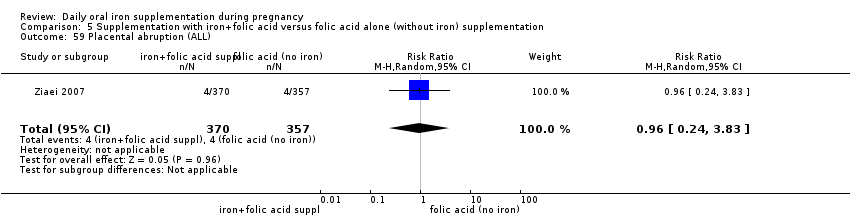
Comparison 5 Supplementation with iron+folic acid versus folic acid alone (without iron) supplementation, Outcome 59 Placental abruption (ALL).
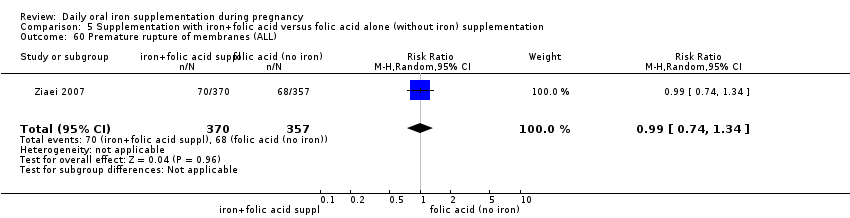
Comparison 5 Supplementation with iron+folic acid versus folic acid alone (without iron) supplementation, Outcome 60 Premature rupture of membranes (ALL).
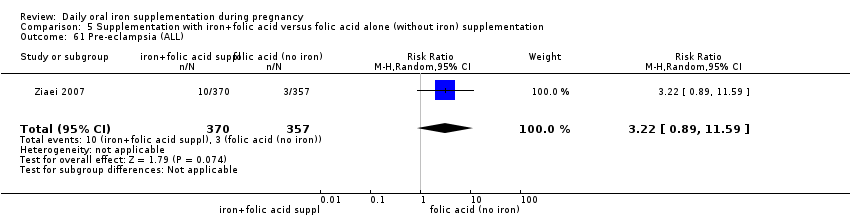
Comparison 5 Supplementation with iron+folic acid versus folic acid alone (without iron) supplementation, Outcome 61 Pre‐eclampsia (ALL).

Comparison 6 Supplementation with iron+other vitamins and minerals supplementation versus same other vitamins and minerals (without iron) supplementation, Outcome 1 Low birthweight (less than 2500 g) (ALL).

Comparison 6 Supplementation with iron+other vitamins and minerals supplementation versus same other vitamins and minerals (without iron) supplementation, Outcome 2 Birthweight (g) (ALL).
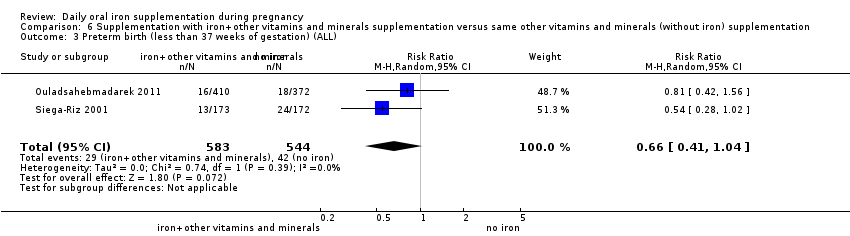
Comparison 6 Supplementation with iron+other vitamins and minerals supplementation versus same other vitamins and minerals (without iron) supplementation, Outcome 3 Preterm birth (less than 37 weeks of gestation) (ALL).

Comparison 6 Supplementation with iron+other vitamins and minerals supplementation versus same other vitamins and minerals (without iron) supplementation, Outcome 10 Side effects (any reported throughout the intervention period) (ALL).

Comparison 6 Supplementation with iron+other vitamins and minerals supplementation versus same other vitamins and minerals (without iron) supplementation, Outcome 22 Maternal Hb concentration at or near term (in g/L at 34 weeks' gestation or more) (ALL).
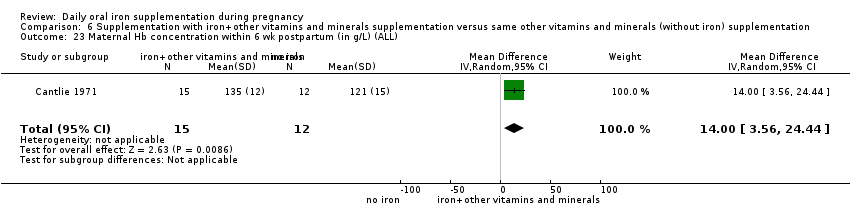
Comparison 6 Supplementation with iron+other vitamins and minerals supplementation versus same other vitamins and minerals (without iron) supplementation, Outcome 23 Maternal Hb concentration within 6 wk postpartum (in g/L) (ALL).
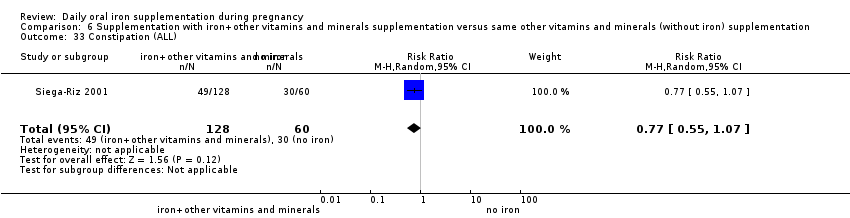
Comparison 6 Supplementation with iron+other vitamins and minerals supplementation versus same other vitamins and minerals (without iron) supplementation, Outcome 33 Constipation (ALL).
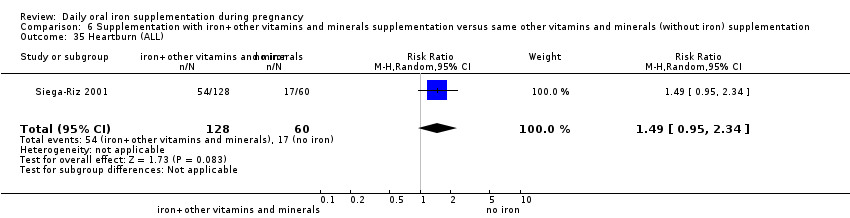
Comparison 6 Supplementation with iron+other vitamins and minerals supplementation versus same other vitamins and minerals (without iron) supplementation, Outcome 35 Heartburn (ALL).
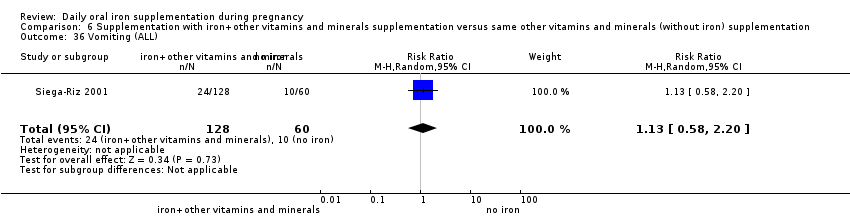
Comparison 6 Supplementation with iron+other vitamins and minerals supplementation versus same other vitamins and minerals (without iron) supplementation, Outcome 36 Vomiting (ALL).

Comparison 6 Supplementation with iron+other vitamins and minerals supplementation versus same other vitamins and minerals (without iron) supplementation, Outcome 37 Diarrhoea (ALL).

Comparison 6 Supplementation with iron+other vitamins and minerals supplementation versus same other vitamins and minerals (without iron) supplementation, Outcome 39 Placental abruption (ALL).

Comparison 6 Supplementation with iron+other vitamins and minerals supplementation versus same other vitamins and minerals (without iron) supplementation, Outcome 40 Premature rupture of membranes (ALL).
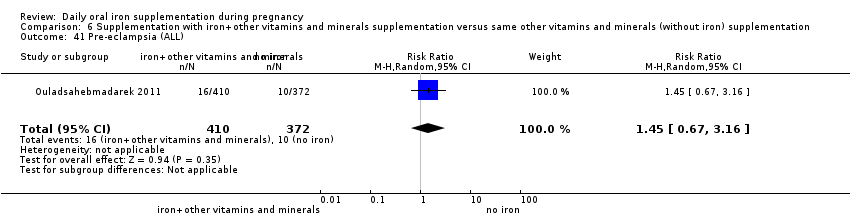
Comparison 6 Supplementation with iron+other vitamins and minerals supplementation versus same other vitamins and minerals (without iron) supplementation, Outcome 41 Pre‐eclampsia (ALL).
| (Infant outcomes) Any supplements containing iron compared with same supplements without iron or no treatment/placebo (no iron or placebo) | ||||
| Patient or population: Pregnant women of any gestational age and parity Setting: Hospital or community‐based antenatal clinics | ||||
| Outcomes | Relative effect | No of Participants | Quality of the evidence | Comments |
| Low birthweight (less than 2500 g) (ALL) | RR 0.84 | 17,613 | ⊕⊕⊝⊝ | |
| Birthweight (g) (ALL) | The mean birthweight (g) (ALL) in the intervention group was 23.75 higher (3.02 lower to 50.51 higher) | 18,590 | ⊕⊕⊕⊝ | |
| Preterm birth (less than 37 weeks of gestation) (ALL) | RR 0.93 | 19,286 | ⊕⊕⊕⊝ | |
| Neonatal death (within 28 days after delivery) (ALL) | RR 0.91 | 16,603 | ⊕⊕⊝⊝ | |
| Congenital anomalies (ALL) | RR 0.88 | 14,636 | ⊕⊕⊝⊝ | |
| CI: Confidence interval; RR: risk ratio | ||||
| GRADE Working Group grades of evidence | ||||
| 1Several studies contributing data had design limitations 2Wide 95% CI crossing the line of no effect | ||||
| (Maternal outcomes) Any supplements containing iron compared with same supplements without iron or no treatment/placebo (no iron or placebo) | ||||
| Patient or population: Pregnant women of any gestational age and parity | ||||
| Outcomes | Relative effect | No of Participants | Quality of the evidence | Comments |
| Maternal anaemia at term (Hb less than 110 g/L at 37 weeks' gestation or more) (ALL) | RR 0.30 | 2199 | ⊕⊕⊝⊝ | |
| Maternal iron deficiency at term (as defined by as defined by trialists, based on any indicator of iron status at 37 weeks's gestation or more) (ALL) | RR 0.43 | 1256 | ⊕⊕⊝⊝ | |
| Maternal death (death while pregnant or within 42 days of termination of pregnancy) (ALL) | RR 0.33 | 12,560 | ⊕⊝⊝⊝ | |
| Side effects (any reported throughout the intervention period) (ALL) | RR 1.29 | 2423 | ⊕⊝⊝⊝ | |
| Maternal severe anaemia at any time during second and third trimester (Hb less than 70 g/L) (ALL) | RR 0.22 | 2125 | ⊕⊝⊝⊝ | |
| Infection during pregnancy (including urinary tract infections) (ALL) | RR 1.21 | 727 | ⊕⊕⊝⊝ | |
| CI: Confidence interval; RR: risk ratio | ||||
| GRADE Working Group grades of evidence | ||||
| 1Several studies contributing data had design limitations and one had serious design limitations 2High heterogeneity I² > 80% 3Several studies contributing data had design limitations 4One of the studies contributing data had design limitations 5Wide 95% CI crossing the line of no effect. Low event rate 6Wide 95% CI crossing the line of no effect 7High heterogeneity I² = 69% | ||||
| Any supplements containing iron and folic acid compared with same supplements without iron nor folic acid (no iron nor folic acid or placebo) | ||||
| Patient or population: Pregnant women of any gestational age and parity | ||||
| Outcomes | Relative effect | No of Participants | Quality of the evidence | Comments |
| Low birthweight (less than 2500 g) (ALL) | RR 1.07 | 1311 | ⊕⊕⊝⊝ | |
| Birthweight (ALL) | The mean birthweight (ALL) in the intervention group was 57.73 higher (7.66 higher to 107.79 higher) | 1365 | ⊕⊕⊕⊝ | |
| Preterm birth (less than 37 weeks of gestation) (ALL) | RR 1.55 | 1497 | ⊕⊕⊝⊝ | |
| Neonatal death (within 28 days after delivery) (ALL) | RR 0.81 | 1793 | ⊕⊕⊝⊝ | |
| Congenital anomalies (ALL) | RR 0.70 | 1652 | ⊕⊕⊝⊝ | |
| CI: Confidence interval; RR: risk ratio | ||||
| GRADE Working Group grades of evidence | ||||
| 1Both studies contributing data had design limitations 2Wide 95% CI crossing the line of no effect 3All studies contributing data had design limitations 4Study contributing data had design limitations | ||||
| (Maternal outcomes) Any supplements containing iron and folic acid compared with same supplements without iron nor folic acid (no iron nor folic acid or placebo) | ||||
| Patient or population: Pregnant women of any gestational age and parity | ||||
| Outcomes | Relative effect | No of Participants | Quality of the evidence | Comments |
| Maternal anaemia at term (Hb less than 110 g/L at 37 weeks' gestation or more) (ALL) | RR 0.34 | 346 | ⊕⊕⊕⊝ | |
| Maternal iron deficiency at term (as defined by trialists, based on any indicator of iron status at 37 weeks' gestation or more) (ALL) | RR 0.24 | 131 | ⊕⊕⊝⊝ | |
| Maternal death (death while pregnant or within 42 days of termination of pregnancy) (ALL) | not estimable | 131 | ⊕⊕⊝⊝ | |
| Side effects (any reported throughout the intervention period) (ALL) | RR 44.32 | 456 | ⊕⊕⊕⊝ | |
| Maternal severe anaemia at any time during second and third trimester (Hb less than 70 g/L) (ALL) | RR 0.12 | 506 | ⊕⊝⊝⊝ | |
| Infection during pregnancy (including urinary tract infections) (ALL) | RR 1.00 | 48 | ⊕⊝⊝⊝ | |
| CI: Confidence interval; RR: risk ratio | ||||
| GRADE Working Group grades of evidence | ||||
| 1Studies contributing data had design limitations 2Study contributing data had design limitations 3Estimate based on small sample size 4Small sample size and no events 5Wide 95% CI crossing the line of no effect and low event rate 6Wide 95% CI crossing the line of no effect, small sample size and low event rate | ||||
| Outcome or subgroup title | No. of studies | No. of participants | Statistical method | Effect size |
| 1 Low birthweight (less than 2500 g) (ALL) Show forest plot | 11 | 17613 | Risk Ratio (M‐H, Random, 95% CI) | 0.84 [0.69, 1.03] |
| 2 Low birthweight (less than 2500 g): SUBGROUP ANALYSIS by gestational age at the start of supplementation Show forest plot | 11 | 17613 | Risk Ratio (M‐H, Random, 95% CI) | 0.84 [0.69, 1.03] |
| 2.1 Early gestational age (supplementation started before 20 weeks' gestation or prior to pregnancy) | 6 | 14512 | Risk Ratio (M‐H, Random, 95% CI) | 0.79 [0.59, 1.05] |
| 2.2 Late gestational age (supplementation started at 20 weeks of gestation or later) | 3 | 665 | Risk Ratio (M‐H, Random, 95% CI) | 1.05 [0.50, 2.19] |
| 2.3 Unspecified or mixed gestational age at the start of supplementation | 2 | 2436 | Risk Ratio (M‐H, Random, 95% CI) | 0.87 [0.61, 1.24] |
| 3 Low birthweight (less than 2500 g): SUBGROUP ANALYSIS by anaemia status at the start of supplementation Show forest plot | 11 | 17613 | Risk Ratio (M‐H, Random, 95% CI) | 0.84 [0.69, 1.03] |
| 3.1 Anaemic at start of supplementation | 0 | 0 | Risk Ratio (M‐H, Random, 95% CI) | 0.0 [0.0, 0.0] |
| 3.2 Non‐anaemic at the start of supplementation | 8 | 13843 | Risk Ratio (M‐H, Random, 95% CI) | 0.79 [0.51, 1.22] |
| 3.3 Unspecified or mixed anaemia status | 3 | 3770 | Risk Ratio (M‐H, Random, 95% CI) | 0.82 [0.72, 0.94] |
| 4 Low birthweight (less than 2500 g): SUBGROUP ANALYSIS by dose of iron Show forest plot | 11 | 17613 | Risk Ratio (M‐H, Random, 95% CI) | 0.84 [0.69, 1.03] |
| 4.1 Low daily dose of iron (30 mg or less of elemental iron) | 5 | 12858 | Risk Ratio (M‐H, Random, 95% CI) | 0.70 [0.38, 1.32] |
| 4.2 Medium daily dose of iron (more than 30 mg and less than 60 mg elemental iron) | 1 | 727 | Risk Ratio (M‐H, Random, 95% CI) | 1.21 [0.57, 2.54] |
| 4.3 Higher daily dose of iron (60 mg elemental iron or more) | 5 | 4028 | Risk Ratio (M‐H, Random, 95% CI) | 0.82 [0.72, 0.94] |
| 5 Low birthweight (less than 2500 g): SUBGROUP ANALYSIS by malarial status of setting Show forest plot | 11 | 17613 | Risk Ratio (M‐H, Random, 95% CI) | 0.84 [0.69, 1.03] |
| 5.1 Malarial setting | 5 | 4645 | Risk Ratio (M‐H, Random, 95% CI) | 0.83 [0.73, 0.94] |
| 5.2 Non‐malarial setting | 6 | 12968 | Risk Ratio (M‐H, Random, 95% CI) | 0.74 [0.42, 1.33] |
| 6 Birthweight (g) (ALL) Show forest plot | 15 | 18590 | Mean Difference (IV, Random, 95% CI) | 23.75 [‐3.02, 50.51] |
| 7 Birthweight (g): SUBGROUP ANALYSIS by gestational age at the start of supplementation Show forest plot | 15 | 18590 | Mean Difference (IV, Random, 95% CI) | 23.75 [‐3.02, 50.51] |
| 7.1 Early gestational age (supplementation started before 20 weeks' gestation or prior to pregnancy) | 11 | 15583 | Mean Difference (IV, Random, 95% CI) | 28.55 [‐9.85, 66.95] |
| 7.2 Late gestational age (supplementation started at 20 weeks of gestation or later) | 3 | 681 | Mean Difference (IV, Random, 95% CI) | ‐0.19 [‐77.46, 77.08] |
| 7.3 Unspecified or mixed gestational age at the start of supplementation | 1 | 2326 | Mean Difference (IV, Random, 95% CI) | 20.20 [‐15.13, 55.53] |
| 8 Birthweight (g): SUBGROUP ANALYSIS by anaemia status at the start of supplementation Show forest plot | 15 | 18590 | Mean Difference (IV, Random, 95% CI) | 23.75 [‐3.02, 50.51] |
| 8.1 Anaemic at start of supplementation | 0 | 0 | Mean Difference (IV, Random, 95% CI) | 0.0 [0.0, 0.0] |
| 8.2 Non‐anaemic at the start of supplementation | 11 | 14631 | Mean Difference (IV, Random, 95% CI) | 20.24 [‐20.13, 60.61] |
| 8.3 Unspecified or mixed anaemia status | 4 | 3959 | Mean Difference (IV, Random, 95% CI) | 33.02 [3.65, 62.38] |
| 9 Birthweight (g): SUBGROUP ANALYSIS by dose of iron Show forest plot | 15 | 18590 | Mean Difference (IV, Random, 95% CI) | 23.49 [‐2.55, 49.52] |
| 9.1 Low daily dose (30 mg or less of elemental iron) | 7 | 13729 | Mean Difference (IV, Random, 95% CI) | 33.94 [‐13.42, 81.29] |
| 9.2 Medium daily dose (more than 30 mg and less than 60 mg elemental iron) | 1 | 727 | Mean Difference (IV, Random, 95% CI) | 10.0 [‐51.92, 71.92] |
| 9.3 Higher daily dose (60 mg elemental iron or more) | 8 | 4134 | Mean Difference (IV, Random, 95% CI) | 19.18 [‐26.63, 64.99] |
| 10 Birthweight (g): SUBGROUP ANALYSIS by malarial status of setting Show forest plot | 15 | 18590 | Mean Difference (IV, Random, 95% CI) | 23.75 [‐3.02, 50.51] |
| 10.1 Malarial setting | 6 | 5443 | Mean Difference (IV, Random, 95% CI) | 33.48 [10.58, 56.37] |
| 10.2 Non‐malarial setting | 9 | 13147 | Mean Difference (IV, Random, 95% CI) | 8.06 [‐57.13, 73.25] |
| 11 Preterm birth (less than 37 weeks of gestation) (ALL) Show forest plot | 13 | 19286 | Risk Ratio (M‐H, Random, 95% CI) | 0.93 [0.84, 1.03] |
| 12 Preterm birth (less than 37 weeks of gestation): SUBGROUP ANALYSIS by gestational age at the start of supplementation Show forest plot | 13 | 19286 | Risk Ratio (M‐H, Random, 95% CI) | 0.93 [0.84, 1.03] |
| 12.1 Early gestational age (supplementation started before 20 weeks' gestation or prior to pregnancy) | 10 | 16483 | Risk Ratio (M‐H, Random, 95% CI) | 0.96 [0.86, 1.07] |
| 12.2 Late gestational age (supplementation started at 20 weeks of gestation or later) | 2 | 477 | Risk Ratio (M‐H, Random, 95% CI) | 0.58 [0.29, 1.13] |
| 12.3 Unspecified or mixed`gestational age at the start of supplementation | 1 | 2326 | Risk Ratio (M‐H, Random, 95% CI) | 0.79 [0.57, 1.09] |
| 13 Preterm birth (less than 37 weeks of gestation): SUBGROUP ANALYSIS by anaemia status at the start of supplementation Show forest plot | 13 | 19286 | Risk Ratio (M‐H, Random, 95% CI) | 0.93 [0.84, 1.03] |
| 13.1 Anaemic at start of supplementation | 0 | 0 | Risk Ratio (M‐H, Random, 95% CI) | 0.0 [0.0, 0.0] |
| 13.2 Non‐anaemic at the start of supplementation | 10 | 14837 | Risk Ratio (M‐H, Random, 95% CI) | 0.92 [0.81, 1.04] |
| 13.3 Unspecified/ mixed anaemia status | 3 | 4449 | Risk Ratio (M‐H, Random, 95% CI) | 0.96 [0.81, 1.14] |
| 14 Preterm birth (less than 37 weeks of gestation): SUBGROUP ANALYSIS by dose of iron Show forest plot | 13 | 19286 | Risk Ratio (M‐H, Random, 95% CI) | 0.93 [0.84, 1.03] |
| 14.1 Low daily dose (30 mg or less of elemental iron) | 6 | 13649 | Risk Ratio (M‐H, Random, 95% CI) | 0.89 [0.76, 1.05] |
| 14.2 Medium daily dose (more than 30 mg and less than 60 mg elemental iron) | 1 | 727 | Risk Ratio (M‐H, Random, 95% CI) | 1.26 [0.62, 2.56] |
| 14.3 Higher daily dose (60 mg elemental iron or more) | 6 | 4910 | Risk Ratio (M‐H, Random, 95% CI) | 0.95 [0.81, 1.12] |
| 15 Preterm birth (less 37 weeks of gestation): SUBGROUP ANALYSIS by malarial status of setting Show forest plot | 13 | 19286 | Risk Ratio (M‐H, Random, 95% CI) | 0.93 [0.84, 1.03] |
| 15.1 Malarial setting | 7 | 6406 | Risk Ratio (M‐H, Random, 95% CI) | 0.95 [0.82, 1.11] |
| 15.2 Non‐malarial setting | 6 | 12880 | Risk Ratio (M‐H, Random, 95% CI) | 0.84 [0.65, 1.09] |
| 16 Neonatal death (within 28 days after delivery) (ALL) Show forest plot | 4 | 16603 | Risk Ratio (M‐H, Random, 95% CI) | 0.91 [0.71, 1.18] |
| 17 Neonatal death (within 28 days after delivery): SUBGROUP ANALYSIS by gestational age at the start of supplementation Show forest plot | 4 | 16603 | Risk Ratio (M‐H, Random, 95% CI) | 0.91 [0.71, 1.18] |
| 17.1 Early gestational age (supplementation started before 20 weeks' gestation or prior to pregnancy) | 3 | 14108 | Risk Ratio (M‐H, Random, 95% CI) | 1.00 [0.71, 1.42] |
| 17.2 Late gestational age (supplementation started at 20 weeks of gestation or later) | 0 | 0 | Risk Ratio (M‐H, Random, 95% CI) | 0.0 [0.0, 0.0] |
| 17.3 Unspecified or mixed gestational age at the start of supplementation | 1 | 2495 | Risk Ratio (M‐H, Random, 95% CI) | 0.81 [0.56, 1.19] |
| 18 Neonatal death (within 28 days after delivery): SUBGROUP ANALYSIS by anaemia status at the start of supplementation Show forest plot | 4 | 16603 | Risk Ratio (M‐H, Random, 95% CI) | 0.91 [0.71, 1.18] |
| 18.1 Anaemic at start of supplementation | 0 | 0 | Risk Ratio (M‐H, Random, 95% CI) | 0.0 [0.0, 0.0] |
| 18.2 Non‐anaemic at the start of supplementation | 2 | 12559 | Risk Ratio (M‐H, Random, 95% CI) | 0.94 [0.51, 1.77] |
| 18.3 Unspecified or mixed anaemia status | 2 | 4044 | Risk Ratio (M‐H, Random, 95% CI) | 0.88 [0.65, 1.19] |
| 19 Neonatal death (within 28 days after delivery): SUBGROUP ANALYSIS by dose of iron Show forest plot | 4 | 16603 | Risk Ratio (M‐H, Random, 95% CI) | 0.91 [0.71, 1.18] |
| 19.1 Low daily dose (30 mg or less of elemental iron) | 1 | 11832 | Risk Ratio (M‐H, Random, 95% CI) | 1.10 [0.67, 1.82] |
| 19.2 Medium daily dose (more than 30 mg and less than 60 mg elemental iron) | 1 | 727 | Risk Ratio (M‐H, Random, 95% CI) | 0.48 [0.12, 1.91] |
| 19.3 Higher daily dose (60 mg elemental iron or more) | 2 | 4044 | Risk Ratio (M‐H, Random, 95% CI) | 0.88 [0.65, 1.19] |
| 20 Neonatal death (within 28 days after delivery): SUBGROUP ANALYSIS by malarial status of setting Show forest plot | 4 | 16603 | Risk Ratio (M‐H, Random, 95% CI) | 0.91 [0.71, 1.18] |
| 20.1 Malarial setting | 3 | 4771 | Risk Ratio (M‐H, Random, 95% CI) | 0.85 [0.63, 1.15] |
| 20.2 Non‐malarial setting | 1 | 11832 | Risk Ratio (M‐H, Random, 95% CI) | 1.10 [0.67, 1.82] |
| 21 Congenital anomalies (ALL) Show forest plot | 4 | 14636 | Risk Ratio (M‐H, Random, 95% CI) | 0.88 [0.58, 1.33] |
| 22 Congenital anomalies: SUBGROUP ANALYSIS by gestational age at the start of supplementation) Show forest plot | 4 | 14636 | Risk Ratio (M‐H, Random, 95% CI) | 0.88 [0.58, 1.33] |
| 22.1 Early gestational age (supplementation started before 20 weeks' gestation or prior to pregnancy) | 4 | 14636 | Risk Ratio (M‐H, Random, 95% CI) | 0.88 [0.58, 1.33] |
| 22.2 Late gestational age (supplementation started at 20 weeks of gestation or later) | 0 | 0 | Risk Ratio (M‐H, Random, 95% CI) | 0.0 [0.0, 0.0] |
| 22.3 Unspecified or mixed gestational age at the start of supplementation | 0 | 0 | Risk Ratio (M‐H, Random, 95% CI) | 0.0 [0.0, 0.0] |
| 23 Congenital anomalies: SUBGROUP ANALYSIS by anaemia status at the start of supplementation Show forest plot | 4 | 14636 | Risk Ratio (M‐H, Random, 95% CI) | 0.88 [0.58, 1.33] |
| 23.1 Anaemic at start of supplementation | 0 | 0 | Risk Ratio (M‐H, Random, 95% CI) | 0.0 [0.0, 0.0] |
| 23.2 Non‐anaemic at the start of supplementation | 2 | 12234 | Risk Ratio (M‐H, Random, 95% CI) | 1.00 [0.35, 2.84] |
| 23.3 Unspecified or mixed anaemia status | 2 | 2402 | Risk Ratio (M‐H, Random, 95% CI) | 0.86 [0.55, 1.35] |
| 24 Congenital anomalies: SUBGROUP ANALYSIS by dose of iron Show forest plot | 4 | 14636 | Risk Ratio (M‐H, Random, 95% CI) | 0.88 [0.58, 1.33] |
| 24.1 Low daily dose (30 mg or less of elemental iron) | 1 | 11934 | Risk Ratio (M‐H, Random, 95% CI) | 1.00 [0.35, 2.84] |
| 24.2 Medium daily dose (more than 30 mg and less than 60 mg elemental iron) | 0 | 0 | Risk Ratio (M‐H, Random, 95% CI) | 0.0 [0.0, 0.0] |
| 24.3 Higher daily dose (60 mg elemental iron or more) | 3 | 2702 | Risk Ratio (M‐H, Random, 95% CI) | 0.86 [0.55, 1.35] |
| 25 Congenital anomalies: SUBGROUP ANALYSIS by malarial status of setting Show forest plot | 4 | 14633 | Risk Ratio (M‐H, Random, 95% CI) | 0.88 [0.62, 1.26] |
| 25.1 Malarial setting | 3 | 2699 | Risk Ratio (M‐H, Random, 95% CI) | 0.87 [0.60, 1.26] |
| 25.2 Non‐malarial setting | 1 | 11934 | Risk Ratio (M‐H, Random, 95% CI) | 1.00 [0.35, 2.84] |
| 26 Maternal anaemia at term (Hb less than 110 g/L at 37 weeks' gestation or more) (ALL) Show forest plot | 14 | 2199 | Risk Ratio (M‐H, Random, 95% CI) | 0.30 [0.19, 0.46] |
| 27 Maternal anaemia at term (Hb less than 110 g/L at 37 weeks' gestation or more): SUBGROUP ANALYSIS by gestational age at the start of supplementation): Show forest plot | 14 | 2199 | Risk Ratio (M‐H, Random, 95% CI) | 0.30 [0.19, 0.46] |
| 27.1 Early gestational age (supplementation started before 20 weeks' gestation or prior to pregnancy) | 7 | 749 | Risk Ratio (M‐H, Random, 95% CI) | 0.28 [0.12, 0.70] |
| 27.2 Late gestational age (supplementation started at 20 weeks of gestation or later) | 5 | 1178 | Risk Ratio (M‐H, Random, 95% CI) | 0.36 [0.22, 0.61] |
| 27.3 Unspecified or mixed gestational age | 2 | 272 | Risk Ratio (M‐H, Random, 95% CI) | 0.08 [0.01, 0.59] |
| 28 Maternal anaemia at term (Hb less than 110 g/L at 37 weeks' gestation or more): SUBGROUP ANALYSIS by anaemia status at the start of supplementation) Show forest plot | 14 | 2199 | Risk Ratio (M‐H, Random, 95% CI) | 0.30 [0.19, 0.46] |
| 28.1 Anaemic at start of supplementation | 0 | 0 | Risk Ratio (M‐H, Random, 95% CI) | 0.0 [0.0, 0.0] |
| 28.2 Non‐anaemic at the start of supplementation | 8 | 1295 | Risk Ratio (M‐H, Random, 95% CI) | 0.32 [0.16, 0.64] |
| 28.3 Unspecified or mixed anaemia status | 6 | 904 | Risk Ratio (M‐H, Random, 95% CI) | 0.24 [0.12, 0.49] |
| 29 Maternal anaemia at term (Hb less than 110 g/L at 37 weeks' gestation or more): SUBGROUP ANALYSIS by dose of iron) Show forest plot | 14 | 2199 | Risk Ratio (M‐H, Random, 95% CI) | 0.30 [0.19, 0.46] |
| 29.1 Low daily dose (30 mg or less of elemental iron) | 3 | 590 | Risk Ratio (M‐H, Random, 95% CI) | 0.49 [0.24, 1.03] |
| 29.2 Medium daily dose (more than 30 mg and less than 60 mg elemental iron) | 1 | 69 | Risk Ratio (M‐H, Random, 95% CI) | 0.21 [0.06, 0.73] |
| 29.3 Higher daily dose (60 mg elemental iron or more) | 10 | 1540 | Risk Ratio (M‐H, Random, 95% CI) | 0.25 [0.14, 0.45] |
| 30 Maternal anaemia at term (Hb less than 110 g/L at 37 weeks' gestation or more): SUBGROUP ANALYSIS by malarial status of setting) Show forest plot | 14 | 2199 | Risk Ratio (M‐H, Random, 95% CI) | 0.30 [0.19, 0.46] |
| 30.1 Malarial setting | 3 | 530 | Risk Ratio (M‐H, Random, 95% CI) | 0.61 [0.45, 0.82] |
| 30.2 Non‐malarial setting | 11 | 1669 | Risk Ratio (M‐H, Random, 95% CI) | 0.18 [0.10, 0.34] |
| 31 Maternal iron deficiency at term (as defined by as defined by trialists, based on any indicator of iron status at 37 weeks's gestation or more) (ALL) Show forest plot | 7 | 1256 | Risk Ratio (M‐H, Random, 95% CI) | 0.43 [0.27, 0.66] |
| 32 Maternal iron deficiency at term (as defined by as defined by trialists, based on any indicator of iron status at 37 weeks' gestation or more): SUBGROUP ANALYSIS by gestational age at the start of supplementation Show forest plot | 7 | 1256 | Risk Ratio (M‐H, Random, 95% CI) | 0.43 [0.27, 0.66] |
| 32.1 Early gestational age (supplementation started before 20 weeks' gestation or prior to pregnancy) | 4 | 653 | Risk Ratio (M‐H, Random, 95% CI) | 0.45 [0.22, 0.93] |
| 32.2 Late gestational age (supplementation started at 20 weeks of gestation or later) | 3 | 603 | Risk Ratio (M‐H, Random, 95% CI) | 0.36 [0.18, 0.72] |
| 32.3 Unspecified or mixed gestational age | 0 | 0 | Risk Ratio (M‐H, Random, 95% CI) | 0.0 [0.0, 0.0] |
| 33 Maternal iron deficiency at term (as defined by as defined by trialists, based on any indicator of iron status at 37 weeks' gestation or more): SUBGROUP ANALYSIS by anaemia status at the start of supplementation Show forest plot | 7 | 1256 | Risk Ratio (M‐H, Random, 95% CI) | 0.43 [0.27, 0.66] |
| 33.1 Anaemic at start of supplementation | 0 | 0 | Risk Ratio (M‐H, Random, 95% CI) | 0.0 [0.0, 0.0] |
| 33.2 Non‐anaemic at the start of supplementation | 5 | 1092 | Risk Ratio (M‐H, Random, 95% CI) | 0.56 [0.39, 0.82] |
| 33.3 Unspecified/ mixed anaemia status | 2 | 164 | Risk Ratio (M‐H, Random, 95% CI) | 0.14 [0.07, 0.29] |
| 34 Maternal iron deficiency at term (as defined by as defined by trialists, based on any indicator of iron status at 37 weeks' gestation or more): SUBGROUP ANALYSIS by dose of iron Show forest plot | 7 | 1256 | Risk Ratio (M‐H, Random, 95% CI) | 0.43 [0.27, 0.66] |
| 34.1 Low daily dose (30 mg or less of elemental iron) | 3 | 703 | Risk Ratio (M‐H, Random, 95% CI) | 0.52 [0.34, 0.78] |
| 34.2 Medium daily dose (more than 30 mg and less than 60 mg elemental iron) | 1 | 241 | Risk Ratio (M‐H, Random, 95% CI) | 0.92 [0.73, 1.17] |
| 34.3 Higher daily dose (60 mg elemental iron or more) | 3 | 312 | Risk Ratio (M‐H, Random, 95% CI) | 0.21 [0.10, 0.41] |
| 35 Maternal iron deficiency at term (as defined by trialists, based on any indicator of iron status at 37 weeks' gestation or more): SUBGROUP ANALYSIS by malarial status of setting Show forest plot | 7 | 1256 | Risk Ratio (M‐H, Random, 95% CI) | 0.43 [0.27, 0.66] |
| 35.1 Malarial setting | 2 | 192 | Risk Ratio (M‐H, Random, 95% CI) | 0.28 [0.15, 0.53] |
| 35.2 Non‐malarial setting | 5 | 1064 | Risk Ratio (M‐H, Random, 95% CI) | 0.49 [0.30, 0.78] |
| 36 Maternal iron‐deficiency anaemia at term (Hb less than 110 g/L and at least one additional laboratory indicators at 37 weeks' gestation or more) (ALL) Show forest plot | 6 | 1088 | Risk Ratio (M‐H, Random, 95% CI) | 0.33 [0.16, 0.69] |
| 37 Maternal iron‐deficiency anaemia at term (Hb less than 110 g/L and at least one additional laboratory indicators at 37 weeks' gestation): SUBGROUP ANALYSIS by gestational age at the start of supplementation Show forest plot | 6 | 1088 | Risk Ratio (M‐H, Random, 95% CI) | 0.33 [0.16, 0.69] |
| 37.1 Early gestational age (supplementation started before 20 weeks' gestation or prior to pregnancy) | 4 | 660 | Risk Ratio (M‐H, Random, 95% CI) | 0.39 [0.13, 1.11] |
| 37.2 Late gestational age (supplementation started at 20 weeks of gestation or later) | 2 | 428 | Risk Ratio (M‐H, Random, 95% CI) | 0.25 [0.11, 0.58] |
| 37.3 Unspecified or mixed gestational age | 0 | 0 | Risk Ratio (M‐H, Random, 95% CI) | 0.0 [0.0, 0.0] |
| 38 Maternal iron‐deficiency anaemia at term (Hb less than 110 g/L and at least one additional laboratory indicators at 37 weeks' gestation or more): SUBGROUP ANALYSIS by anaemia status at the start of supplementation Show forest plot | 6 | 1088 | Risk Ratio (M‐H, Random, 95% CI) | 0.33 [0.16, 0.69] |
| 38.1 Anaemic at start of supplementation | 0 | 0 | Risk Ratio (M‐H, Random, 95% CI) | 0.0 [0.0, 0.0] |
| 38.2 Non‐anaemic at the start of supplementation | 5 | 968 | Risk Ratio (M‐H, Random, 95% CI) | 0.39 [0.20, 0.74] |
| 38.3 Unspecified or mixed anaemia status | 1 | 120 | Risk Ratio (M‐H, Random, 95% CI) | 0.04 [0.00, 0.72] |
| 39 Maternal iron‐deficiency anaemia at term (Hb less than 110 g/L and at least one additional laboratory indicators at 37 weeks' gestation or more): SUBGROUP ANALYSIS by dose of iron Show forest plot | 6 | 1088 | Risk Ratio (M‐H, Random, 95% CI) | 0.33 [0.16, 0.69] |
| 39.1 Low daily dose (30 mg or less of elemental iron) | 3 | 579 | Risk Ratio (M‐H, Random, 95% CI) | 0.38 [0.13, 1.11] |
| 39.2 Medium daily dose (more than 30 mg and less than 60 mg elemental iron) | 1 | 241 | Risk Ratio (M‐H, Random, 95% CI) | 0.34 [0.16, 0.70] |
| 39.3 Higher daily dose (60 mg elemental iron or more) | 2 | 268 | Risk Ratio (M‐H, Random, 95% CI) | 0.04 [0.00, 0.72] |
| 40 Maternal iron‐deficiency anaemia at term (Hb less than 110 g/L and at least one additional laboratory indicators at 37 weeks' gestation or more): SUBGROUP ANALYSIS by malarial status of setting Show forest plot | 6 | 1088 | Risk Ratio (M‐H, Random, 95% CI) | 0.33 [0.16, 0.69] |
| 40.1 Malarial setting | 1 | 148 | Risk Ratio (M‐H, Random, 95% CI) | 0.0 [0.0, 0.0] |
| 40.2 Non‐malarial setting | 5 | 940 | Risk Ratio (M‐H, Random, 95% CI) | 0.33 [0.16, 0.69] |
| 41 Maternal death (death while pregnant or within 42 days of termination of pregnancy) (ALL) Show forest plot | 2 | 12560 | Risk Ratio (M‐H, Random, 95% CI) | 0.33 [0.01, 8.19] |
| 42 Side effects (any reported throughout the intervention period) (ALL) Show forest plot | 11 | 2423 | Risk Ratio (M‐H, Random, 95% CI) | 1.29 [0.83, 2.02] |
| 43 Side effects (any reported throughout the intervention period): SUBGROUP ANALYSIS by gestational age at the start of supplementation: Show forest plot | 11 | 2423 | Risk Ratio (M‐H, Random, 95% CI) | 1.32 [0.92, 1.91] |
| 43.1 Early gestational age (supplementation started before 20 weeks' gestation or prior to pregnancy) | 5 | 1186 | Risk Ratio (M‐H, Random, 95% CI) | 1.00 [0.68, 1.45] |
| 43.2 Late gestational age (supplementation started at 20 weeks of gestation or later) | 5 | 1032 | Risk Ratio (M‐H, Random, 95% CI) | 1.43 [0.89, 2.29] |
| 43.3 Unspecified or mixed gestational age | 1 | 205 | Risk Ratio (M‐H, Random, 95% CI) | 62.79 [3.89, 1013.31] |
| 44 Side effects (any reported throughout the intervention period): SUBGROUP ANALYSIS by anaemia status at the start of supplementation Show forest plot | 11 | 2423 | Risk Ratio (M‐H, Random, 95% CI) | 1.32 [0.92, 1.91] |
| 44.1 Anaemic at start of supplementation | 0 | 0 | Risk Ratio (M‐H, Random, 95% CI) | 0.0 [0.0, 0.0] |
| 44.2 Non‐anaemic at the start of supplementation | 7 | 1648 | Risk Ratio (M‐H, Random, 95% CI) | 1.01 [0.85, 1.20] |
| 44.3 Unspecified or mixed anaemia status | 4 | 775 | Risk Ratio (M‐H, Random, 95% CI) | 5.16 [0.78, 34.29] |
| 45 Side effects (any reported throughout the intervention period): SUBGROUP ANALYSIS by dose of iron Show forest plot | 11 | 2423 | Risk Ratio (M‐H, Random, 95% CI) | 1.32 [0.93, 1.89] |
| 45.1 Low daily dose (30 mg or less of elemental iron) | 6 | 1533 | Risk Ratio (M‐H, Random, 95% CI) | 1.00 [0.86, 1.16] |
| 45.2 Medium daily dose (more than 30 mg and less than 60 mg elemental iron) | 2 | 225 | Risk Ratio (M‐H, Random, 95% CI) | 2.00 [0.66, 6.02] |
| 45.3 Higher daily dose (60 mg elemental iron or more) | 5 | 665 | Risk Ratio (M‐H, Random, 95% CI) | 4.33 [0.61, 30.67] |
| 46 Side effects (any reported throughout the intervention period): SUBGROUP ANALYSIS by malarial status of setting Show forest plot | 11 | 2423 | Risk Ratio (M‐H, Random, 95% CI) | 1.32 [0.92, 1.91] |
| 46.1 Malarial setting | 1 | 205 | Risk Ratio (M‐H, Random, 95% CI) | 62.79 [3.89, 1013.31] |
| 46.2 Non‐malarial setting | 10 | 2218 | Risk Ratio (M‐H, Random, 95% CI) | 1.22 [0.91, 1.63] |
| 47 Maternal severe anaemia at any time during second and third trimester (Hb less than 70 g/L) (ALL) Show forest plot | 9 | 2125 | Risk Ratio (M‐H, Random, 95% CI) | 0.22 [0.01, 3.20] |
| 48 Maternal severe anaemia at any time during second and third trimester (Hb less than 70 g/L): SUBGROUP ANALYSIS by gestational age at the start of supplementation Show forest plot | 9 | 2125 | Risk Ratio (M‐H, Random, 95% CI) | 0.22 [0.01, 3.20] |
| 48.1 Early gestational age (supplementation started before 20 weeks' gestation or prior to pregnancy) | 5 | 1417 | Risk Ratio (M‐H, Random, 95% CI) | 0.06 [0.01, 0.47] |
| 48.2 Late gestational age (supplementation started at 20 weeks of gestation or later) | 3 | 559 | Risk Ratio (M‐H, Random, 95% CI) | 0.48 [0.00, 46.15] |
| 48.3 Unspecified or mixed gestational age | 1 | 149 | Risk Ratio (M‐H, Random, 95% CI) | 0.0 [0.0, 0.0] |
| 49 Maternal severe anaemia at any time during second and third trimester (Hb less than 70 g/L): SUBGROUP ANALYSIS by anaemia status at the start of supplementation Show forest plot | 9 | 2125 | Risk Ratio (M‐H, Random, 95% CI) | 0.22 [0.01, 3.20] |
| 49.1 Anaemic at start of supplementation | 0 | 0 | Risk Ratio (M‐H, Random, 95% CI) | 0.0 [0.0, 0.0] |
| 49.2 Non‐anaemic at the start of supplementation | 5 | 1394 | Risk Ratio (M‐H, Random, 95% CI) | 4.98 [0.24, 103.01] |
| 49.3 Unspecified or mixed anaemia status | 4 | 731 | Risk Ratio (M‐H, Random, 95% CI) | 0.06 [0.01, 0.30] |
| 50 Maternal severe anaemia at any time during second and third trimester (Hb less than 70 g/L): SUBGROUP ANALYSIS by dose of iron Show forest plot | 9 | 2125 | Risk Ratio (M‐H, Random, 95% CI) | 0.22 [0.01, 3.20] |
| 50.1 Low daily dose (30 mg or less of elemental iron) | 3 | 654 | Risk Ratio (M‐H, Random, 95% CI) | 4.98 [0.24, 103.01] |
| 50.2 Medium daily dose (more than 30 mg and less than 60 mg elemental iron) | 1 | 727 | Risk Ratio (M‐H, Random, 95% CI) | 0.0 [0.0, 0.0] |
| 50.3 Higher daily dose (60 mg elemental iron or more) | 5 | 744 | Risk Ratio (M‐H, Random, 95% CI) | 0.06 [0.01, 0.30] |
| 51 Maternal severe anaemia at any time during second and third trimester (Hb less than 70 g/L): SUBGROUP ANALYSIS by malarial status of setting Show forest plot | 9 | 2125 | Risk Ratio (M‐H, Random, 95% CI) | 0.22 [0.01, 3.20] |
| 51.1 Malarial setting | 3 | 1102 | Risk Ratio (M‐H, Random, 95% CI) | 0.06 [0.01, 0.30] |
| 51.2 Non‐malarial setting | 6 | 1023 | Risk Ratio (M‐H, Random, 95% CI) | 4.98 [0.24, 103.01] |
| 52 Maternal clinical malaria | 0 | 0 | Risk Ratio (M‐H, Random, 95% CI) | 0.0 [0.0, 0.0] |
| 53 Infection during pregnancy (including urinary tract infections) (ALL) Show forest plot | 1 | 727 | Risk Ratio (M‐H, Random, 95% CI) | 1.21 [0.33, 4.46] |
| 54 Infection during pregnancy (including urinary tract infections): SUBGROUP ANALYSIS by gestational age at the start of supplementation Show forest plot | 1 | 727 | Risk Ratio (M‐H, Random, 95% CI) | 1.21 [0.33, 4.46] |
| 54.1 Early gestational age (supplementation started before 20 weeks' gestation or prior to pregnancy) | 1 | 727 | Risk Ratio (M‐H, Random, 95% CI) | 1.21 [0.33, 4.46] |
| 54.2 Late gestational age (supplementation started at 20 weeks of gestation or later) | 0 | 0 | Risk Ratio (M‐H, Random, 95% CI) | 0.0 [0.0, 0.0] |
| 54.3 Unspecified or mixed gestational age | 0 | 0 | Risk Ratio (M‐H, Random, 95% CI) | 0.0 [0.0, 0.0] |
| 55 Infection during pregnancy (including urinary tract infections): SUBGROUP ANALYSIS by anaemia status at the start of supplementation Show forest plot | 1 | 727 | Risk Ratio (M‐H, Random, 95% CI) | 1.21 [0.33, 4.46] |
| 55.1 Anaemic at start of supplementation | 0 | 0 | Risk Ratio (M‐H, Random, 95% CI) | 0.0 [0.0, 0.0] |
| 55.2 Non‐anaemic at the start of supplementation | 1 | 727 | Risk Ratio (M‐H, Random, 95% CI) | 1.21 [0.33, 4.46] |
| 55.3 Unspecified or mixed anaemia status | 0 | 0 | Risk Ratio (M‐H, Random, 95% CI) | 0.0 [0.0, 0.0] |
| 56 Infection during pregnancy (including urinary tract infections): SUBGROUP ANALYSIS by dose of iron Show forest plot | 1 | 727 | Risk Ratio (M‐H, Random, 95% CI) | 1.21 [0.33, 4.46] |
| 56.1 Low daily dose (30 mg or less of elemental iron) | 0 | 0 | Risk Ratio (M‐H, Random, 95% CI) | 0.0 [0.0, 0.0] |
| 56.2 Medium daily dose (more than 30 mg and less than 60 mg elemental iron) | 1 | 727 | Risk Ratio (M‐H, Random, 95% CI) | 1.21 [0.33, 4.46] |
| 56.3 Higher daily dose (60 mg elemental iron or more) | 0 | 0 | Risk Ratio (M‐H, Random, 95% CI) | 0.0 [0.0, 0.0] |
| 57 Infection during pregnancy (including urinary tract infections): SUBGROUP ANALYSIS by malarial status of setting Show forest plot | 1 | 727 | Risk Ratio (M‐H, Random, 95% CI) | 1.21 [0.33, 4.46] |
| 57.1 Malarial setting | 1 | 727 | Risk Ratio (M‐H, Random, 95% CI) | 1.21 [0.33, 4.46] |
| 57.2 Non‐malarial setting | 0 | 0 | Risk Ratio (M‐H, Random, 95% CI) | 0.0 [0.0, 0.0] |
| 58 Very low birthweight (less than 1500 g) (ALL) Show forest plot | 5 | 2687 | Risk Ratio (M‐H, Random, 95% CI) | 0.73 [0.31, 1.74] |
| 59 Very premature birth (less than 34 weeks' gestation) (ALL) Show forest plot | 5 | 3743 | Risk Ratio (M‐H, Random, 95% CI) | 0.51 [0.29, 0.91] |
| 60 Infant Hb concentration within the first 6 months (in g/L counting the last reported measure after birth within this period) (ALL) Show forest plot | 2 | 533 | Mean Difference (IV, Random, 95% CI) | ‐1.25 [‐8.10, 5.59] |
| 61 Infant serum ferritin concentration within first 6 months (in μg/L counting the last reported measure after birth within this period) (ALL) Show forest plot | 1 | 197 | Mean Difference (IV, Random, 95% CI) | 11.0 [4.37, 17.63] |
| 62 Admission to special care unit (ALL) Show forest plot | 1 | 111 | Risk Ratio (M‐H, Random, 95% CI) | 0.0 [0.0, 0.0] |
| 63 Maternal anaemia at or near term (Hb less than 110 g/L at 34 weeks' gestation or more) (ALL) Show forest plot | 14 | 2199 | Risk Ratio (M‐H, Random, 95% CI) | 0.30 [0.19, 0.46] |
| 64 Maternal iron deficiency at or near term (as defined by as defined by trialists, based on any indicator of iron status at 34 weeks's gestation or more)) (ALL) Show forest plot | 7 | 1256 | Risk Ratio (M‐H, Random, 95% CI) | 0.43 [0.27, 0.66] |
| 65 Maternal iron‐deficiency anaemia at or near term (Hb less than 110 g/L and at least one additional laboratory indicators at 34 weeks' gestation or more) (ALL) Show forest plot | 6 | 1088 | Risk Ratio (M‐H, Random, 95% CI) | 0.33 [0.16, 0.69] |
| 66 Maternal Hb concentration at or near term (in g/L, at 34 weeks' gestation or more) (ALL) Show forest plot | 19 | 3704 | Mean Difference (IV, Random, 95% CI) | 8.88 [6.96, 10.80] |
| 67 Maternal Hb concentration within 6 wk postpartum (in g/L) (ALL) Show forest plot | 7 | 956 | Mean Difference (IV, Random, 95% CI) | 7.61 [5.50, 9.72] |
| 68 Maternal high haemoglobin concentrations during second or third trimester (Hb more than 130 g/L) (ALL) Show forest plot | 9 | 2188 | Risk Ratio (M‐H, Random, 95% CI) | 2.37 [1.34, 4.21] |
| 69 Maternal high haemoglobin concentrations at or near term (Hb more than 130 g/L at 34 weeks' gestation or more) (ALL) Show forest plot | 8 | 2156 | Risk Ratio (M‐H, Random, 95% CI) | 3.07 [1.18, 8.02] |
| 70 Maternal severe anaemia at or near term (Hb less than 70 g/L at 34 weeks' gestation or more) (ALL) Show forest plot | 8 | 1819 | Risk Ratio (M‐H, Random, 95% CI) | 0.47 [0.01, 44.11] |
| 71 Severe anaemia at postpartum (Hb less than 80 g/L) (ALL) Show forest plot | 8 | 1339 | Risk Ratio (M‐H, Random, 95% CI) | 0.04 [0.01, 0.28] |
| 72 Moderate anaemia at postpartum (Hb more than 80 g/L and less than 110 g/L) (ALL) Show forest plot | 3 | 766 | Risk Ratio (M‐H, Random, 95% CI) | 0.55 [0.12, 2.51] |
| 73 Puerperal infection (ALL) Show forest plot | 4 | 4374 | Risk Ratio (M‐H, Random, 95% CI) | 0.68 [0.50, 0.92] |
| 74 Antepartum haemorrhage (ALL) Show forest plot | 2 | 1157 | Risk Ratio (M‐H, Random, 95% CI) | 1.48 [0.51, 4.31] |
| 75 Postpartum haemorrhage (ALL) Show forest plot | 4 | 1488 | Risk Ratio (M‐H, Random, 95% CI) | 0.93 [0.59, 1.49] |
| 76 Transfusion provided (ALL) Show forest plot | 2 | 759 | Risk Ratio (M‐H, Random, 95% CI) | 0.96 [0.10, 8.98] |
| 77 Diarrhoea (ALL) Show forest plot | 3 | 1088 | Risk Ratio (M‐H, Random, 95% CI) | 0.55 [0.32, 0.93] |
| 78 Constipation (ALL) Show forest plot | 4 | 1495 | Risk Ratio (M‐H, Random, 95% CI) | 0.95 [0.62, 1.43] |
| 79 Nausea (ALL) Show forest plot | 4 | 1377 | Risk Ratio (M‐H, Random, 95% CI) | 1.21 [0.72, 2.03] |
| 80 Heartburn (ALL) Show forest plot | 3 | 1323 | Risk Ratio (M‐H, Random, 95% CI) | 1.19 [0.86, 1.66] |
| 81 Vomiting (ALL) Show forest plot | 4 | 1392 | Risk Ratio (M‐H, Random, 95% CI) | 0.88 [0.59, 1.30] |
| 82 Maternal wellbeing/satisfaction (ALL) Show forest plot | 1 | 49 | Risk Ratio (M‐H, Random, 95% CI) | 0.91 [0.77, 1.08] |
| 83 Placental abruption (ALL) Show forest plot | 3 | 2951 | Risk Ratio (M‐H, Random, 95% CI) | 1.41 [0.56, 3.59] |
| 84 Premature rupture of membranes (ALL) Show forest plot | 3 | 1581 | Risk Ratio (M‐H, Random, 95% CI) | 0.93 [0.72, 1.22] |
| 85 Pre‐eclampsia (ALL) Show forest plot | 4 | 1704 | Risk Ratio (M‐H, Random, 95% CI) | 1.63 [0.87, 3.07] |
| Outcome or subgroup title | No. of studies | No. of participants | Statistical method | Effect size |
| 1 Low birthweight (less than 2500 g) (ALL) Show forest plot | 2 | 1311 | Risk Ratio (M‐H, Random, 95% CI) | 1.07 [0.31, 3.74] |
| 2 Neonatal death (within 28 days after delivery) (ALL) Show forest plot | 3 | 1793 | Risk Ratio (M‐H, Random, 95% CI) | 0.81 [0.51, 1.30] |
| 3 Preterm birth (less than 37 weeks of gestation) (ALL) Show forest plot | 3 | 1497 | Risk Ratio (M‐H, Random, 95% CI) | 1.55 [0.40, 6.00] |
| 4 Preterm birth (less than 37 weeks of gestation): SUBGROUP ANALYSIS by gestation at the start of supplementation Show forest plot | 3 | Risk Ratio (M‐H, Random, 95% CI) | Subtotals only | |
| 4.1 Early gestational age (less than 20 weeks of gestation or pre‐pregnancy) at start of supplementation | 2 | 1366 | Risk Ratio (M‐H, Random, 95% CI) | 1.55 [0.40, 6.00] |
| 4.2 Late gestational age (supplementation started at 20 weeks of gestation or later) | 0 | 0 | Risk Ratio (M‐H, Random, 95% CI) | 0.0 [0.0, 0.0] |
| 4.3 Unspecified or mixed gestational age at start of supplementation | 1 | 44 | Risk Ratio (M‐H, Random, 95% CI) | 0.0 [0.0, 0.0] |
| 5 Preterm birth (less than 37 weeks of gestation): SUBGROUP ANALYSIS by anaemia status at the start of supplementation Show forest plot | 3 | Risk Ratio (M‐H, Random, 95% CI) | Subtotals only | |
| 5.1 Anaemic at start of supplementation | 0 | 0 | Risk Ratio (M‐H, Random, 95% CI) | 0.0 [0.0, 0.0] |
| 5.2 Non‐anaemic at the start of supplementation | 0 | 0 | Risk Ratio (M‐H, Random, 95% CI) | 0.0 [0.0, 0.0] |
| 5.3 Unspecified or mixed anaemic status at start of supplementation | 3 | 1497 | Risk Ratio (M‐H, Random, 95% CI) | 1.55 [0.40, 6.00] |
| 6 Preterm birth (less than 37 weeks of gestation): SUBGROUP ANALYSIS by dose of iron Show forest plot | 3 | 1497 | Risk Ratio (M‐H, Random, 95% CI) | 1.55 [0.40, 6.00] |
| 6.1 Low daily dose (30 mg elemental iron or less) | 1 | 131 | Risk Ratio (M‐H, Random, 95% CI) | 0.0 [0.0, 0.0] |
| 6.2 Medium daily dose (31 to 59 mg elemental iron) | 0 | 0 | Risk Ratio (M‐H, Random, 95% CI) | 0.0 [0.0, 0.0] |
| 6.3 Higher daily dose (60 mg elemental iron and above) | 2 | 1366 | Risk Ratio (M‐H, Random, 95% CI) | 1.55 [0.40, 6.00] |
| 7 Preterm birth (less than 37 weeks of gestation): SUBGROUP ANALYSIS by malarial status of settings Show forest plot | 3 | 1497 | Risk Ratio (M‐H, Random, 95% CI) | 1.55 [0.40, 6.00] |
| 7.1 Malarial setting | 2 | 1449 | Risk Ratio (M‐H, Random, 95% CI) | 1.13 [0.92, 1.39] |
| 7.2 Non‐malarial setting | 1 | 48 | Risk Ratio (M‐H, Random, 95% CI) | 7.00 [0.38, 128.61] |
| 8 Birthweight (ALL) Show forest plot | 2 | 1365 | Mean Difference (IV, Random, 95% CI) | 57.73 [7.66, 107.79] |
| 9 Neonatal death (within 28 days after delivery): SUBGROUP ANALYSIS by gestation at the start of supplementation Show forest plot | 3 | 1793 | Risk Ratio (M‐H, Random, 95% CI) | 0.81 [0.51, 1.30] |
| 9.1 Early gestational age (less than 20 weeks of gestation or pre‐pregnancy) at start of supplementation | 3 | 1793 | Risk Ratio (M‐H, Random, 95% CI) | 0.81 [0.51, 1.30] |
| 9.2 Late gestational age (20 weeks or more of gestation) at start of supplementation | 0 | 0 | Risk Ratio (M‐H, Random, 95% CI) | 0.0 [0.0, 0.0] |
| 9.3 Unspecified or mixed gestational age at start of supplementation | 0 | 0 | Risk Ratio (M‐H, Random, 95% CI) | 0.0 [0.0, 0.0] |
| 10 Neonatal death (within 28 days after delivery): SUBGROUP ANALYSIS by anaemia status at the start of supplementation Show forest plot | 3 | 1793 | Risk Ratio (M‐H, Random, 95% CI) | 0.81 [0.51, 1.30] |
| 10.1 Anaemic at start of supplementation | 0 | 0 | Risk Ratio (M‐H, Random, 95% CI) | 0.0 [0.0, 0.0] |
| 10.2 Non‐anaemic at start of supplementation | 1 | 97 | Risk Ratio (M‐H, Random, 95% CI) | 2.5 [0.10, 59.88] |
| 10.3 Unspecified or mixed anaemic status at start of supplementation | 2 | 1696 | Risk Ratio (M‐H, Random, 95% CI) | 0.79 [0.49, 1.27] |
| 11 Neonatal death (within 28 days after delivery): SUBGROUP ANALYSIS by dose of iron Show forest plot | 3 | 1793 | Risk Ratio (M‐H, Random, 95% CI) | 0.81 [0.51, 1.30] |
| 11.1 Low daily dose (30 mg elemental iron or less) | 0 | 0 | Risk Ratio (M‐H, Random, 95% CI) | 0.0 [0.0, 0.0] |
| 11.2 Medium daily dose (31 to 59 mg elemental iron) | 0 | 0 | Risk Ratio (M‐H, Random, 95% CI) | 0.0 [0.0, 0.0] |
| 11.3 Higher daily dose (60 mg elemental iron and above) | 3 | 1793 | Risk Ratio (M‐H, Random, 95% CI) | 0.81 [0.51, 1.30] |
| 12 Neonatal death (within 28 days after delivery): SUBGROUP ANALYSIS by malarial status at the start of supplementation Show forest plot | 3 | 1793 | Risk Ratio (M‐H, Random, 95% CI) | 0.81 [0.51, 1.30] |
| 12.1 Malarial setting | 1 | 1648 | Risk Ratio (M‐H, Random, 95% CI) | 0.79 [0.49, 1.27] |
| 12.2 Non‐malarial setting | 2 | 145 | Risk Ratio (M‐H, Random, 95% CI) | 2.5 [0.10, 59.88] |
| 13 Congenital anomalies (ALL) Show forest plot | 1 | 1652 | Risk Ratio (M‐H, Random, 95% CI) | 0.70 [0.35, 1.40] |
| 14 Maternal anaemia at term (Hb less than 110 g/L at 37 weeks' gestation or more) (ALL) Show forest plot | 3 | 346 | Risk Ratio (M‐H, Random, 95% CI) | 0.34 [0.21, 0.54] |
| 15 Maternal anaemia at term (Hb less than 110 g/L at 37 weeks' gestation or more): SUBGROUP ANALYSIS by gestation at the start of supplementation Show forest plot | 3 | 346 | Risk Ratio (M‐H, Random, 95% CI) | 0.34 [0.21, 0.54] |
| 15.1 Early gestational age (less than 20 weeks of gestation or pre‐pregnancy) at start of supplementation | 1 | 97 | Risk Ratio (M‐H, Random, 95% CI) | 0.0 [0.0, 0.0] |
| 15.2 Late gestational age (20 weeks or more of gestation) at start of supplementation | 1 | 66 | Risk Ratio (M‐H, Random, 95% CI) | 0.37 [0.22, 0.62] |
| 15.3 Unspecified or mixed gestational age at start of supplementation | 1 | 183 | Risk Ratio (M‐H, Random, 95% CI) | 0.24 [0.09, 0.68] |
| 16 Maternal anaemia at term (Hb less than 110 g/L at 37 weeks' gestation or more): SUBGROUP ANALYSIS by anaemia status at the start of supplementation Show forest plot | 3 | 346 | Risk Ratio (M‐H, Random, 95% CI) | 0.34 [0.21, 0.54] |
| 16.1 Anaemic at start of supplementation | 0 | 0 | Risk Ratio (M‐H, Random, 95% CI) | 0.0 [0.0, 0.0] |
| 16.2 Non‐anaemic at start of supplementation | 2 | 280 | Risk Ratio (M‐H, Random, 95% CI) | 0.24 [0.09, 0.68] |
| 16.3 Unspecified or mixed anaemic status at start of supplementation | 1 | 66 | Risk Ratio (M‐H, Random, 95% CI) | 0.37 [0.22, 0.62] |
| 17 Maternal anaemia at term (Hb less than 110 g/L at 37 weeks' gestation or more): SUBGROUP ANALYSIS by dose of iron Show forest plot | 3 | 346 | Risk Ratio (M‐H, Random, 95% CI) | 0.34 [0.21, 0.54] |
| 17.1 Low daily dose (30 mg elemental iron or less) | 0 | 0 | Risk Ratio (M‐H, Random, 95% CI) | 0.0 [0.0, 0.0] |
| 17.2 Medium daily dose (31 to 59 mg elemental iron) | 0 | 0 | Risk Ratio (M‐H, Random, 95% CI) | 0.0 [0.0, 0.0] |
| 17.3 Higher daily dose (60 mg elemental iron and above) | 3 | 346 | Risk Ratio (M‐H, Random, 95% CI) | 0.34 [0.21, 0.54] |
| 18 Maternal anaemia at term (Hb less than 110 g/L at 37 weeks' gestation or more): SUBGROUP ANALYSIS by malarial status of setting Show forest plot | 3 | 346 | Risk Ratio (M‐H, Random, 95% CI) | 0.34 [0.21, 0.54] |
| 18.1 Malarial setting | 1 | 66 | Risk Ratio (M‐H, Random, 95% CI) | 0.37 [0.22, 0.62] |
| 18.2 Non‐malarial setting | 2 | 280 | Risk Ratio (M‐H, Random, 95% CI) | 0.24 [0.09, 0.68] |
| 19 Maternal iron deficiency at term (as defined by trialists, based on any indicator of iron status at 37 weeks' gestation or more) (ALL) Show forest plot | 1 | 131 | Risk Ratio (M‐H, Random, 95% CI) | 0.24 [0.06, 0.99] |
| 20 Maternal iron‐deficiency anaemia at term (Hb less than 110 g/L and at least one additional laboratory indicators at 37 weeks' gestation or more) (ALL) Show forest plot | 1 | 131 | Risk Ratio (M‐H, Random, 95% CI) | 0.43 [0.17, 1.09] |
| 21 Maternal death (death while pregnant or within 42 days of termination of pregnancy) (ALL) Show forest plot | 1 | 131 | Risk Ratio (M‐H, Random, 95% CI) | 0.0 [0.0, 0.0] |
| 22 Side effects (any reported throughout the intervention period) (ALL) Show forest plot | 1 | 456 | Risk Ratio (M‐H, Random, 95% CI) | 44.32 [2.77, 709.09] |
| 23 Maternal severe anaemia at any time during second and third trimester (Hb less than 70 g/L) (ALL) Show forest plot | 4 | 506 | Risk Ratio (M‐H, Random, 95% CI) | 0.12 [0.02, 0.63] |
| 24 Maternal severe anaemia at any time during second and third trimester (Hb less than 70 g/L): SUBGROUP ANALYSIS by gestation at the start of supplementation Show forest plot | 4 | 506 | Risk Ratio (M‐H, Random, 95% CI) | 0.12 [0.02, 0.63] |
| 24.1 Early gestational age (less than 20 weeks of gestation or pre‐pregnancy) at start of supplementation | 3 | 456 | Risk Ratio (M‐H, Random, 95% CI) | 0.11 [0.01, 0.83] |
| 24.2 Late gestational age (20 weeks or more of gestation) at start of supplementation | 1 | 50 | Risk Ratio (M‐H, Random, 95% CI) | 0.14 [0.01, 2.63] |
| 24.3 Unspecified or mixed gestational age at start of supplementation | 0 | 0 | Risk Ratio (M‐H, Random, 95% CI) | 0.0 [0.0, 0.0] |
| 25 Maternal severe anaemia at any time during second and third trimester (Hb less than 70 g/L): SUBGROUP ANALYSIS by anaemia status at the start of supplementation Show forest plot | 4 | 506 | Risk Ratio (M‐H, Random, 95% CI) | 0.12 [0.02, 0.63] |
| 25.1 Anaemic at start of supplementation | 0 | 0 | Risk Ratio (M‐H, Random, 95% CI) | 0.0 [0.0, 0.0] |
| 25.2 Non‐anaemic at start of supplementation | 1 | 97 | Risk Ratio (M‐H, Random, 95% CI) | 0.0 [0.0, 0.0] |
| 25.3 Unspecified or mixed anaemic status at start of supplementation | 3 | 409 | Risk Ratio (M‐H, Random, 95% CI) | 0.12 [0.02, 0.63] |
| 26 Maternal severe anaemia at any time during second and third trimester (Hb less than 70 g/L): SUBGROUP ANALYSIS by dose of iron Show forest plot | 4 | 506 | Risk Ratio (M‐H, Random, 95% CI) | 0.12 [0.02, 0.63] |
| 26.1 Low daily dose (30 mg elemental iron or less) | 1 | 44 | Risk Ratio (M‐H, Random, 95% CI) | 0.0 [0.0, 0.0] |
| 26.2 Medium daily dose (31 to 59 mg elemental iron) | 0 | 0 | Risk Ratio (M‐H, Random, 95% CI) | 0.0 [0.0, 0.0] |
| 26.3 Higher daily dose (60 mg elemental iron and above) | 3 | 462 | Risk Ratio (M‐H, Random, 95% CI) | 0.12 [0.02, 0.63] |
| 27 Maternal severe anaemia at any time during second and third trimester (Hb less than 70 g/L): SUBGROUP ANALYSIS by malarial status of setting Show forest plot | 4 | 506 | Risk Ratio (M‐H, Random, 95% CI) | 0.12 [0.02, 0.63] |
| 27.1 Malarial setting | 3 | 409 | Risk Ratio (M‐H, Random, 95% CI) | 0.12 [0.02, 0.63] |
| 27.2 Non‐malarial setting | 1 | 97 | Risk Ratio (M‐H, Random, 95% CI) | 0.0 [0.0, 0.0] |
| 28 Maternal clinical malaria | 0 | 0 | Risk Ratio (M‐H, Random, 95% CI) | 0.0 [0.0, 0.0] |
| 29 Infection during pregnancy (including urinary tract infections) (ALL) Show forest plot | 1 | 48 | Risk Ratio (M‐H, Random, 95% CI) | 1.0 [0.15, 6.53] |
| 30 Very low birthweight (less than 1500 g) (ALL) Show forest plot | 1 | 48 | Risk Ratio (M‐H, Random, 95% CI) | 5.0 [0.25, 98.96] |
| 31 Very premature birth (less than 34 weeks' gestation) (ALL) Show forest plot | 2 | 92 | Risk Ratio (M‐H, Random, 95% CI) | 5.0 [0.25, 98.96] |
| 32 Admission to special care unit (ALL) Show forest plot | 1 | 48 | Risk Ratio (M‐H, Random, 95% CI) | 0.0 [0.0, 0.0] |
| 33 Maternal anaemia at or near term (Hb less than 110 g/L at 34 weeks' gestation or more) (ALL) Show forest plot | 3 | 346 | Risk Ratio (M‐H, Random, 95% CI) | 0.34 [0.21, 0.54] |
| 34 Maternal iron deficiency at or near term (as defined by trialists, based on any indicator of iron status at 34 weeks' gestation or more) (ALL) Show forest plot | 1 | 131 | Risk Ratio (M‐H, Random, 95% CI) | 0.24 [0.06, 0.99] |
| 35 Maternal iron‐deficiency anaemia at or near term (Hb less than 110 g/L and at least one additional laboratory indicators at 34 weeks' gestation or more) (ALL) Show forest plot | 1 | 131 | Risk Ratio (M‐H, Random, 95% CI) | 0.43 [0.17, 1.09] |
| 36 Maternal Hb concentration at or near term (in g/L, at 34 weeks' gestation or more) (ALL) Show forest plot | 3 | 140 | Mean Difference (IV, Random, 95% CI) | 16.13 [12.74, 19.52] |
| 37 Maternal Hb concentration within 6 wk postpartum (in g/L) (ALL) Show forest plot | 2 | 459 | Mean Difference (IV, Random, 95% CI) | 10.07 [7.33, 12.81] |
| 38 Maternal high haemoglobin concentrations during second or third trimester (Hb more than 130 g/L) (ALL) Show forest plot | 2 | 446 | Risk Ratio (M‐H, Random, 95% CI) | 1.78 [0.63, 5.04] |
| 39 Maternal high haemoglobin concentrations at or near term (Hb more than 130 g/L at 34 weeks' gestation or more) (ALL) Show forest plot | 2 | 314 | Risk Ratio (M‐H, Random, 95% CI) | 4.37 [0.58, 32.71] |
| 40 Moderate anaemia at postpartum (Hb more than 80 g/L and less than 110 g/L) (ALL) Show forest plot | 3 | 491 | Risk Ratio (M‐H, Random, 95% CI) | 0.33 [0.17, 0.65] |
| 41 Maternal severe anaemia at or near term (Hb less than 70 g/L at 34 weeks' gestation or more ) (ALL) Show forest plot | 3 | 191 | Risk Ratio (M‐H, Random, 95% CI) | 0.14 [0.01, 2.63] |
| 42 Severe anaemia at postpartum (Hb less than 80 g/L) (ALL) Show forest plot | 3 | 491 | Risk Ratio (M‐H, Random, 95% CI) | 0.05 [0.00, 0.76] |
| 43 Puerperal infection (ALL) Show forest plot | 1 | 2863 | Risk Ratio (M‐H, Random, 95% CI) | 0.55 [0.13, 2.28] |
| 44 Antepartum haemorrhage (ALL) Show forest plot | 2 | 145 | Risk Ratio (M‐H, Random, 95% CI) | 1.25 [0.22, 7.12] |
| 45 Postpartum haemorrhage (ALL) | 0 | 0 | Risk Ratio (M‐H, Random, 95% CI) | 0.0 [0.0, 0.0] |
| 46 Placental abruption (ALL) Show forest plot | 1 | 2863 | Risk Ratio (M‐H, Random, 95% CI) | 8.19 [0.49, 138.16] |
| 47 Pre‐eclampsia (ALL) Show forest plot | 1 | 48 | Risk Ratio (M‐H, Random, 95% CI) | 3.0 [0.13, 70.16] |
| Outcome or subgroup title | No. of studies | No. of participants | Statistical method | Effect size |
| 1 Low birthweight (less than 2500 g) (ALL) Show forest plot | 6 | 1136 | Risk Ratio (M‐H, Random, 95% CI) | 0.63 [0.30, 1.32] |
| 2 Low birthweight (less than 2500 g): SUBGROUP ANALYSIS by gestational age at the start of supplementation Show forest plot | 6 | 1136 | Risk Ratio (M‐H, Random, 95% CI) | 0.63 [0.30, 1.32] |
| 2.1 Early gestational age (less than 20 weeks of gestation or pre‐pregnancy) at start of supplementation | 2 | 361 | Risk Ratio (M‐H, Random, 95% CI) | 0.32 [0.15, 0.70] |
| 2.2 Late gestational age (20 weeks or more of gestation) at start of supplementation | 3 | 665 | Risk Ratio (M‐H, Random, 95% CI) | 1.05 [0.50, 2.19] |
| 2.3 Unspecified or mixed gestational age at the start of supplementation | 1 | 110 | Risk Ratio (M‐H, Random, 95% CI) | 1.79 [0.17, 19.20] |
| 3 Low birthweight (less than 2500 g): SUBGROUP ANALYSIS by anaemia status at the start of supplementation Show forest plot | 6 | 1136 | Risk Ratio (M‐H, Random, 95% CI) | 0.63 [0.30, 1.32] |
| 3.1 Anaemic at start of supplementation | 0 | 0 | Risk Ratio (M‐H, Random, 95% CI) | 0.0 [0.0, 0.0] |
| 3.2 Non‐anaemic at start of supplementation | 5 | 955 | Risk Ratio (M‐H, Random, 95% CI) | 0.65 [0.25, 1.66] |
| 3.3 Unspecified or mixed anaemic status at start of supplementation | 1 | 181 | Risk Ratio (M‐H, Random, 95% CI) | 0.57 [0.14, 2.31] |
| 4 Low birthweight (less than 2500 g): SUBGROUP ANALYSIS by dose of iron Show forest plot | 6 | 1136 | Risk Ratio (M‐H, Random, 95% CI) | 0.63 [0.30, 1.32] |
| 4.1 Low daily dose (30 mg elemental iron or less) | 3 | 697 | Risk Ratio (M‐H, Random, 95% CI) | 0.59 [0.12, 2.96] |
| 4.2 Medium daily dose (31 to 59 mg elemental iron) | 0 | 0 | Risk Ratio (M‐H, Random, 95% CI) | 0.0 [0.0, 0.0] |
| 4.3 Higher daily dose (60 mg elemental iron and above) | 3 | 439 | Risk Ratio (M‐H, Random, 95% CI) | 0.62 [0.25, 1.50] |
| 5 Low birthweight (less than 2500 g): SUBGROUP ANALYSIS by malarial status of setting Show forest plot | 6 | 1136 | Risk Ratio (M‐H, Random, 95% CI) | 0.63 [0.30, 1.32] |
| 5.1 Malarial setting | 2 | 329 | Risk Ratio (M‐H, Random, 95% CI) | 0.52 [0.20, 1.35] |
| 5.2 Non‐malarial setting | 4 | 807 | Risk Ratio (M‐H, Random, 95% CI) | 0.73 [0.20, 2.70] |
| 6 Birthweight (g) (ALL) Show forest plot | 9 | 1331 | Mean Difference (IV, Random, 95% CI) | ‐1.04 [‐78.77, 76.70] |
| 7 Birthweight (g): SUBGROUP ANALYSIS by gestational age at the start of supplementation Show forest plot | 9 | 1331 | Mean Difference (IV, Random, 95% CI) | ‐1.04 [‐78.77, 76.70] |
| 7.1 Early gestational age (less than 20 weeks of gestation or pre‐pregnancy) at start of supplementation | 5 | 477 | Mean Difference (IV, Random, 95% CI) | ‐31.62 [‐214.93, 151.70] |
| 7.2 Late gestational age (20 weeks or more of gestation) at start of supplementation | 4 | 854 | Mean Difference (IV, Random, 95% CI) | ‐8.70 [‐74.71, 57.31] |
| 7.3 Unspecified or mixed gestational age at the start of supplementation | 0 | 0 | Mean Difference (IV, Random, 95% CI) | 0.0 [0.0, 0.0] |
| 8 Birthweight (g): SUBGROUP ANALYSIS by anaemia status at the start of supplementation Show forest plot | 9 | 1331 | Mean Difference (IV, Random, 95% CI) | ‐1.04 [‐78.77, 76.70] |
| 8.1 Anaemic at start of supplementation | 0 | 0 | Mean Difference (IV, Random, 95% CI) | 0.0 [0.0, 0.0] |
| 8.2 Non‐anaemic at start of supplementation | 7 | 961 | Mean Difference (IV, Random, 95% CI) | ‐9.03 [‐125.10, 107.04] |
| 8.3 Unspecified or mixed anaemic status at start of supplementation | 2 | 370 | Mean Difference (IV, Random, 95% CI) | 0.90 [‐86.32, 88.12] |
| 9 Birthweight (g): SUBGROUP ANALYSIS by dose of iron Show forest plot | 9 | 1331 | Mean Difference (IV, Random, 95% CI) | ‐1.70 [‐72.00, 70.60] |
| 9.1 Low daily dose (30 mg elemental iron or less) | 4 | 785 | Mean Difference (IV, Random, 95% CI) | 46.83 [‐76.57, 170.22] |
| 9.2 Medium daily dose (31 to 59 mg elemental iron) | 0 | 0 | Mean Difference (IV, Random, 95% CI) | 0.0 [0.0, 0.0] |
| 9.3 Higher daily dose (60 mg elemental iron and above) | 6 | 546 | Mean Difference (IV, Random, 95% CI) | ‐36.28 [‐126.66, 54.10] |
| 10 Birthweight (g): SUBGROUP ANALYSIS by malarial status of setting Show forest plot | 9 | 1331 | Mean Difference (IV, Random, 95% CI) | ‐1.04 [‐78.77, 76.70] |
| 10.1 Malarial setting | 2 | 345 | Mean Difference (IV, Random, 95% CI) | 33.74 [‐61.16, 128.65] |
| 10.2 Non‐malarial setting | 7 | 986 | Mean Difference (IV, Random, 95% CI) | ‐21.75 [‐132.94, 89.44] |
| 11 Preterm birth (less than 37 weeks of gestation) (ALL) Show forest plot | 6 | 1713 | Risk Ratio (M‐H, Random, 95% CI) | 0.82 [0.58, 1.14] |
| 12 Preterm birth (less 37 weeks of gestation): SUBGROUP ANALYSIS by gestational age at the start of supplementation Show forest plot | 6 | 1713 | Risk Ratio (M‐H, Random, 95% CI) | 0.82 [0.58, 1.14] |
| 12.1 Early gestational age (less than 20 weeks of gestation or pre‐pregnancy) at start of supplementation | 4 | 1236 | Risk Ratio (M‐H, Random, 95% CI) | 0.92 [0.62, 1.35] |
| 12.2 Late gestational age (20 weeks or more of gestation) at start of supplementation | 2 | 477 | Risk Ratio (M‐H, Random, 95% CI) | 0.58 [0.29, 1.13] |
| 12.3 Unspecified or mixed gestational age at start of supplementation | 0 | 0 | Risk Ratio (M‐H, Random, 95% CI) | 0.0 [0.0, 0.0] |
| 13 Preterm birth (less 37 weeks of gestation): SUBGROUP ANALYSIS by anaemia status at the start of supplementation Show forest plot | 6 | 1713 | Risk Ratio (M‐H, Random, 95% CI) | 0.82 [0.58, 1.14] |
| 13.1 Anaemic at start of supplementation | 0 | 0 | Risk Ratio (M‐H, Random, 95% CI) | 0.0 [0.0, 0.0] |
| 13.2 Non‐anaemic at start of supplementation | 5 | 851 | Risk Ratio (M‐H, Random, 95% CI) | 0.72 [0.45, 1.13] |
| 13.3 Unspecified or mixed anaemic status at start of supplementation | 1 | 862 | Risk Ratio (M‐H, Random, 95% CI) | 0.95 [0.58, 1.57] |
| 14 Preterm birth (less 37 weeks of gestation): SUBGROUP ANALYSIS by dose of iron Show forest plot | 6 | 1713 | Risk Ratio (M‐H, Random, 95% CI) | 0.82 [0.58, 1.14] |
| 14.1 Low daily dose (30 mg elemental iron or less) | 3 | 690 | Risk Ratio (M‐H, Random, 95% CI) | 0.76 [0.47, 1.24] |
| 14.2 Medium daily dose (31 to 59 mg elemental iron) | 0 | 0 | Risk Ratio (M‐H, Random, 95% CI) | 0.0 [0.0, 0.0] |
| 14.3 Higher daily dose (60 mg elemental iron and above) | 3 | 1023 | Risk Ratio (M‐H, Random, 95% CI) | 0.87 [0.54, 1.39] |
| 15 Preterm birth (less 37 weeks of gestation): SUBGROUP ANALYSIS by malarial status of setting Show forest plot | 6 | 1713 | Risk Ratio (M‐H, Random, 95% CI) | 0.82 [0.58, 1.14] |
| 15.1 Malarial setting | 2 | 1010 | Risk Ratio (M‐H, Random, 95% CI) | 0.87 [0.54, 1.39] |
| 15.2 Non‐malarial setting | 4 | 703 | Risk Ratio (M‐H, Random, 95% CI) | 0.76 [0.47, 1.24] |
| 16 Neonatal death (within 28 days after delivery) (ALL) | 0 | 0 | Risk Ratio (M‐H, Random, 95% CI) | 0.0 [0.0, 0.0] |
| 17 Congenital anomalies (ALL) Show forest plot | 2 | 2402 | Risk Ratio (M‐H, Random, 95% CI) | 0.86 [0.55, 1.35] |
| 18 Maternal anaemia at term (Hb less than 110 g/L at 37 weeks' gestation or more) (ALL) Show forest plot | 14 | 2136 | Risk Ratio (M‐H, Random, 95% CI) | 0.29 [0.19, 0.47] |
| 19 Maternal anaemia at term (Hb less than 110 g/L at 37 weeks' gestation or more): SUBGROUP ANALYSIS by gestational age at the start of supplementation Show forest plot | 13 | 1999 | Risk Ratio (M‐H, Random, 95% CI) | 0.25 [0.16, 0.41] |
| 19.1 Early gestational age (less than 20 weeks of gestation or pre‐pregnancy) at start of supplementation | 6 | 549 | Risk Ratio (M‐H, Random, 95% CI) | 0.18 [0.06, 0.57] |
| 19.2 Late gestational age (20 weeks or more of gestation) at start of supplementation | 6 | 1301 | Risk Ratio (M‐H, Random, 95% CI) | 0.32 [0.20, 0.53] |
| 19.3 Unspecified or mixed gestational age at start of supplementation | 1 | 149 | Risk Ratio (M‐H, Random, 95% CI) | 0.03 [0.00, 0.18] |
| 20 Maternal anaemia at term (Hb less than 110 g/L at 37 weeks gestation or more): SUBGROUP ANALYSIS by anaemia status at the start of supplementation Show forest plot | 13 | 1936 | Risk Ratio (M‐H, Random, 95% CI) | 0.25 [0.15, 0.42] |
| 20.1 Anaemic at start of supplementation | 0 | 0 | Risk Ratio (M‐H, Random, 95% CI) | 0.0 [0.0, 0.0] |
| 20.2 Non‐anaemic at start of supplementation | 8 | 1244 | Risk Ratio (M‐H, Random, 95% CI) | 0.20 [0.10, 0.44] |
| 20.3 Unspecified or mixed anaemic status at start of supplementation | 5 | 692 | Risk Ratio (M‐H, Random, 95% CI) | 0.34 [0.18, 0.64] |
| 21 Maternal anaemia at term (Hb less than 110 g/L at 37 weeks' gestation or more): SUBGROUP ANALYSIS by dose of iron Show forest plot | 13 | 1999 | Risk Ratio (M‐H, Random, 95% CI) | 0.25 [0.16, 0.41] |
| 21.1 Low daily dose (30 mg elemental iron or less) | 3 | 590 | Risk Ratio (M‐H, Random, 95% CI) | 0.49 [0.24, 1.03] |
| 21.2 Medium daily dose (31 to 59 mg elemental iron) | 1 | 69 | Risk Ratio (M‐H, Random, 95% CI) | 0.21 [0.06, 0.73] |
| 21.3 Higher daily dose (60 mg elemental iron and above) | 9 | 1340 | Risk Ratio (M‐H, Random, 95% CI) | 0.19 [0.10, 0.38] |
| 22 Maternal anaemia at term (Hb less than 110 g/L at 37 weeks' gestation or more): SUBGROUP ANALYSIS by malarial status of setting Show forest plot | 13 | 1936 | Risk Ratio (M‐H, Random, 95% CI) | 0.25 [0.15, 0.42] |
| 22.1 Malarial setting | 2 | 267 | Risk Ratio (M‐H, Random, 95% CI) | 0.58 [0.46, 0.72] |
| 22.2 Non‐malarial setting | 11 | 1669 | Risk Ratio (M‐H, Random, 95% CI) | 0.18 [0.10, 0.34] |
| 23 Maternal iron deficiency at term (as defined by trialists, based on any indicator of iron status at 37 weeks' gestation or more) (ALL) Show forest plot | 7 | 1256 | Risk Ratio (M‐H, Random, 95% CI) | 0.43 [0.27, 0.66] |
| 24 Maternal iron deficiency at term (as defined by trialists, based on any indicator of iron status at 37 weeks' gestation or more): SUBGROUP ANALYSIS by gestational age at the start of supplementation Show forest plot | 7 | 1256 | Risk Ratio (M‐H, Random, 95% CI) | 0.43 [0.27, 0.66] |
| 24.1 Early gestational age (less than 20 weeks of gestation or pre‐pregnancy) at start of supplementation | 4 | 653 | Risk Ratio (M‐H, Random, 95% CI) | 0.45 [0.22, 0.93] |
| 24.2 Late gestational age (20 weeks or more of gestation) at start of supplementation | 3 | 603 | Risk Ratio (M‐H, Random, 95% CI) | 0.36 [0.18, 0.72] |
| 24.3 Unspecified or mixed gestational age at start of supplementation | 0 | 0 | Risk Ratio (M‐H, Random, 95% CI) | 0.0 [0.0, 0.0] |
| 25 Maternal iron deficiency at term (as defined by trialists, based on any indicator of iron status at 37 weeks' gestation or more): SUBGROUP ANALYSIS by anaemia status at the start of supplementation Show forest plot | 7 | 1256 | Risk Ratio (M‐H, Random, 95% CI) | 0.43 [0.27, 0.66] |
| 25.1 Anaemic at start of supplementation | 0 | 0 | Risk Ratio (M‐H, Random, 95% CI) | 0.0 [0.0, 0.0] |
| 25.2 Non‐anaemic at start of supplementation | 5 | 1092 | Risk Ratio (M‐H, Random, 95% CI) | 0.56 [0.39, 0.82] |
| 25.3 Unspecified or mixed anaemic status at start of supplementation | 2 | 164 | Risk Ratio (M‐H, Random, 95% CI) | 0.14 [0.07, 0.29] |
| 26 Maternal iron deficiency at term (as defined by trialists, based on any indicator of iron status at 37 weeks' gestation or more): SUBGROUP ANALYSIS by dose of iron Show forest plot | 7 | 1256 | Risk Ratio (M‐H, Random, 95% CI) | 0.43 [0.27, 0.66] |
| 26.1 Low daily dose (30 mg elemental iron or less) | 3 | 703 | Risk Ratio (M‐H, Random, 95% CI) | 0.52 [0.34, 0.78] |
| 26.2 Medium daily dose (31 to 59 mg elemental iron) | 1 | 241 | Risk Ratio (M‐H, Random, 95% CI) | 0.92 [0.73, 1.17] |
| 26.3 Higher daily dose (60 mg elemental iron and above) | 3 | 312 | Risk Ratio (M‐H, Random, 95% CI) | 0.21 [0.10, 0.41] |
| 27 Maternal iron deficiency at term (as defined by trialists, based on any indicator of iron status at 37 weeks' gestation or more): SUBGROUP ANALYSIS by malarial status of setting Show forest plot | 7 | 1256 | Risk Ratio (M‐H, Random, 95% CI) | 0.43 [0.27, 0.66] |
| 27.1 Malarial setting | 2 | 192 | Risk Ratio (M‐H, Random, 95% CI) | 0.28 [0.15, 0.53] |
| 27.2 Non‐malarial setting | 5 | 1064 | Risk Ratio (M‐H, Random, 95% CI) | 0.49 [0.30, 0.78] |
| 28 Maternal iron‐deficiency anaemia at term (Hb less than 110 g/L and at least one additional laboratory indicators at 37 weeks' gestation or more) (ALL) Show forest plot | 6 | 1088 | Risk Ratio (M‐H, Random, 95% CI) | 0.33 [0.16, 0.69] |
| 29 Maternal iron‐deficiency anaemia at term (Hb less than 110 g/L and at least one additional laboratory indicators at 37 weeks' gestation or more): SUBGROUP ANALYSIS by gestational age at the start of supplementation Show forest plot | 6 | 1088 | Risk Ratio (M‐H, Random, 95% CI) | 0.33 [0.16, 0.69] |
| 29.1 Early gestational age (less than 20 weeks of gestation or pre‐pregnancy) at start of supplementation | 4 | 660 | Risk Ratio (M‐H, Random, 95% CI) | 0.39 [0.13, 1.11] |
| 29.2 Late gestational age (20 weeks or more of gestation) at start of supplementation | 2 | 428 | Risk Ratio (M‐H, Random, 95% CI) | 0.25 [0.11, 0.58] |
| 29.3 Unspecified or mixed gestational age at start of supplementation | 0 | 0 | Risk Ratio (M‐H, Random, 95% CI) | 0.0 [0.0, 0.0] |
| 30 Maternal iron‐deficiency anaemia at term (Hb less than 110 g/L and at least one additional laboratory indicators at 37 weeks' gestation or more): SUBGROUP ANALYSIS by anaemia status at the start of supplementation Show forest plot | 6 | 1088 | Risk Ratio (M‐H, Random, 95% CI) | 0.33 [0.16, 0.69] |
| 30.1 Anaemic at start of supplementation | 0 | 0 | Risk Ratio (M‐H, Random, 95% CI) | 0.0 [0.0, 0.0] |
| 30.2 Non‐anaemic at start of supplementation | 5 | 968 | Risk Ratio (M‐H, Random, 95% CI) | 0.39 [0.20, 0.74] |
| 30.3 Unspecified or mixed anaemic status at start of supplementation | 1 | 120 | Risk Ratio (M‐H, Random, 95% CI) | 0.04 [0.00, 0.72] |
| 31 Maternal iron‐deficiency anaemia at term (Hb less than 110 g/L and at least one additional laboratory indicators at 37 weeks' gestation or more): SUBGROUP ANALYSIS by dose of iron Show forest plot | 6 | 1088 | Risk Ratio (M‐H, Random, 95% CI) | 0.33 [0.16, 0.69] |
| 31.1 Daily low dose (60 mg elemental iron or less) | 3 | 579 | Risk Ratio (M‐H, Random, 95% CI) | 0.38 [0.13, 1.11] |
| 31.2 Medium dose (31 to 59 mg elemental iron) | 1 | 241 | Risk Ratio (M‐H, Random, 95% CI) | 0.34 [0.16, 0.70] |
| 31.3 High dose (60 mg elemental iron and above) | 2 | 268 | Risk Ratio (M‐H, Random, 95% CI) | 0.04 [0.00, 0.72] |
| 32 Maternal iron‐deficiency anaemia at term (Hb less than 110 g/L and at least one additional laboratory indicators at 37 weeks' gestation or more): SUBGROUP ANALYSIS by malarial status of setting Show forest plot | 6 | 1088 | Risk Ratio (M‐H, Random, 95% CI) | 0.33 [0.16, 0.69] |
| 32.1 Malarial setting | 1 | 148 | Risk Ratio (M‐H, Random, 95% CI) | 0.0 [0.0, 0.0] |
| 32.2 Non‐malarial setting | 5 | 940 | Risk Ratio (M‐H, Random, 95% CI) | 0.33 [0.16, 0.69] |
| 33 Maternal death (death while pregnant or within 42 days of termination of pregnancy) (ALL) Show forest plot | 1 | 47 | Risk Ratio (M‐H, Random, 95% CI) | 0.0 [0.0, 0.0] |
| 34 Side effects (any reported throughout the intervention period) (ALL) Show forest plot | 9 | 1677 | Risk Ratio (M‐H, Random, 95% CI) | 1.59 [1.00, 2.52] |
| 35 Side effects (any reported throughout the intervention period): SUBGROUP ANALYSIS by gestational age at the start of supplementation Show forest plot | 9 | 1677 | Risk Ratio (M‐H, Random, 95% CI) | 1.59 [1.00, 2.52] |
| 35.1 Early gestational age (less than 20 weeks of gestation or pre‐pregnancy) at start of supplementation | 3 | 438 | Risk Ratio (M‐H, Random, 95% CI) | 1.38 [0.87, 2.19] |
| 35.2 Late gestational age (20 weeks or more of gestation) at start of supplementation | 5 | 1034 | Risk Ratio (M‐H, Random, 95% CI) | 1.42 [0.89, 2.28] |
| 35.3 Unspecified or mixed gestational age at start of supplementation | 1 | 205 | Risk Ratio (M‐H, Random, 95% CI) | 62.79 [3.89, 1013.31] |
| 36 Side effects (any reported throughout the intervention period): SUBGROUP ANALYSIS by anaemia status at the start of supplementation Show forest plot | 9 | 1677 | Risk Ratio (M‐H, Random, 95% CI) | 1.59 [1.00, 2.52] |
| 36.1 Anaemic at start of supplementation | 0 | 0 | Risk Ratio (M‐H, Random, 95% CI) | 0.0 [0.0, 0.0] |
| 36.2 Non‐anaemic at start of supplementation | 5 | 900 | Risk Ratio (M‐H, Random, 95% CI) | 1.08 [0.91, 1.28] |
| 36.3 Unspecified or mixed anaemic status at start of supplementation | 4 | 777 | Risk Ratio (M‐H, Random, 95% CI) | 5.11 [0.78, 33.60] |
| 37 Side effects (any reported throughout the intervention period): SUBGROUP ANALYSIS by dose of iron Show forest plot | 9 | 1677 | Risk Ratio (M‐H, Random, 95% CI) | 1.58 [1.02, 2.43] |
| 37.1 Low daily dose (30 mg elemental iron or less) | 4 | 785 | Risk Ratio (M‐H, Random, 95% CI) | 1.07 [0.90, 1.26] |
| 37.2 Medium daily dose (31 to 59 mg elemental iron) | 2 | 225 | Risk Ratio (M‐H, Random, 95% CI) | 2.00 [0.66, 6.02] |
| 37.3 Higher daily dose (60 mg elemental iron and above) | 5 | 667 | Risk Ratio (M‐H, Random, 95% CI) | 5.53 [0.81, 37.89] |
| 38 Side effects (any reported throughout the intervention period): SUBGROUP ANALYSIS by malarial status of setting Show forest plot | 9 | 1677 | Risk Ratio (M‐H, Random, 95% CI) | 1.59 [1.00, 2.52] |
| 38.1 Malarial setting | 1 | 205 | Risk Ratio (M‐H, Random, 95% CI) | 62.79 [3.89, 1013.31] |
| 38.2 Non‐malarial setting | 8 | 1472 | Risk Ratio (M‐H, Random, 95% CI) | 1.40 [0.99, 1.97] |
| 39 Maternal severe anaemia at any time during second and third trimester (Hb less than 70 g/L) (ALL) Show forest plot | 7 | 1078 | Risk Ratio (M‐H, Random, 95% CI) | 0.75 [0.02, 29.10] |
| 40 Maternal severe anaemia at any time during second and third trimester (Hb less than 70 g/L): SUBGROUP ANALYSIS by gestational age at the start of supplementation Show forest plot | 7 | 1078 | Risk Ratio (M‐H, Random, 95% CI) | 0.75 [0.02, 29.10] |
| 40.1 Early gestational age (less than 20 weeks of gestation or pre‐pregnancy) at start of supplementation | 3 | 416 | Risk Ratio (M‐H, Random, 95% CI) | 0.0 [0.0, 0.0] |
| 40.2 Late gestational age (20 weeks or more of gestation) at start of supplementation | 3 | 513 | Risk Ratio (M‐H, Random, 95% CI) | 0.75 [0.02, 29.10] |
| 40.3 Unspecified or mixed gestational age at start of supplementation | 1 | 149 | Risk Ratio (M‐H, Random, 95% CI) | 0.0 [0.0, 0.0] |
| 41 Maternal severe anaemia at any time during second and third trimester (Hb less than 70 g/L): SUBGROUP ANALYSIS by anaemia status age at the start of supplementation Show forest plot | 7 | 1078 | Risk Ratio (M‐H, Random, 95% CI) | 0.75 [0.02, 29.10] |
| 41.1 Anaemic at start of supplementation | 0 | 0 | Risk Ratio (M‐H, Random, 95% CI) | 0.0 [0.0, 0.0] |
| 41.2 Non‐anaemic at start of supplementation | 5 | 816 | Risk Ratio (M‐H, Random, 95% CI) | 4.98 [0.24, 103.01] |
| 41.3 Unspecified or mixed anaemic status at start of supplementation | 2 | 262 | Risk Ratio (M‐H, Random, 95% CI) | 0.12 [0.01, 2.21] |
| 42 Maternal severe anaemia at any time during second and third trimester (Hb less than 70 g/L): SUBGROUP ANALYSIS by dose of iron Show forest plot | 7 | 1078 | Risk Ratio (M‐H, Random, 95% CI) | 0.75 [0.02, 29.10] |
| 42.1 Low daily dose (30 mg elemental iron or less) | 3 | 654 | Risk Ratio (M‐H, Random, 95% CI) | 4.98 [0.24, 103.01] |
| 42.2 Medium daily dose (31 to 59 mg elemental iron) | 0 | 0 | Risk Ratio (M‐H, Random, 95% CI) | 0.0 [0.0, 0.0] |
| 42.3 Higher daily dose (60 mg elemental iron and above) | 4 | 424 | Risk Ratio (M‐H, Random, 95% CI) | 0.12 [0.01, 2.21] |
| 43 Maternal severe anaemia at any time during second and third trimester (Hb less than 70 g/L): SUBGROUP ANALYSIS by malarial status of setting Show forest plot | 7 | 1078 | Risk Ratio (M‐H, Random, 95% CI) | 0.75 [0.02, 29.10] |
| 43.1 Malarial setting | 1 | 55 | Risk Ratio (M‐H, Random, 95% CI) | 0.12 [0.01, 2.21] |
| 43.2 Non‐malarial setting | 6 | 1023 | Risk Ratio (M‐H, Random, 95% CI) | 4.98 [0.24, 103.01] |
| 44 Maternal clinical malaria | 0 | 0 | Risk Ratio (M‐H, Random, 95% CI) | 0.0 [0.0, 0.0] |
| 45 Infection during pregnancy (including urinary tract infections) (ALL) | 0 | 0 | Risk Ratio (M‐H, Random, 95% CI) | 0.0 [0.0, 0.0] |
| 46 Very low birthweight (less than 1500 g) (ALL) Show forest plot | 3 | 697 | Risk Ratio (M‐H, Random, 95% CI) | 0.55 [0.03, 9.07] |
| 47 Very premature birth (less than 34 weeks' gestation) (ALL) Show forest plot | 3 | 690 | Risk Ratio (M‐H, Random, 95% CI) | 0.32 [0.10, 1.09] |
| 48 Infant Hb concentration in the first 6 months (in g/L, counting the last reported measure after birth within this period) (ALL) Show forest plot | 2 | 533 | Mean Difference (IV, Random, 95% CI) | ‐1.25 [‐8.10, 5.59] |
| 49 Infant serum ferritin concentration in the first 6 months (in μg/L, counting the last reported measure after birth within this period) (ALL) Show forest plot | 1 | 197 | Mean Difference (IV, Random, 95% CI) | 11.0 [4.37, 17.63] |
| 50 Admission to special care unit (ALL) Show forest plot | 1 | 111 | Risk Ratio (M‐H, Random, 95% CI) | 0.0 [0.0, 0.0] |
| 51 Maternal anaemia at or near term (Hb less than 110 g/L at 34 weeks' gestation or more) (ALL) Show forest plot | 13 | 1696 | Risk Ratio (M‐H, Random, 95% CI) | 0.29 [0.18, 0.46] |
| 52 Maternal iron deficiency at or near term (as defined by trialists, based on any indicator of iron status at 34 weeks' gestation or more) (ALL) Show forest plot | 7 | 1256 | Risk Ratio (M‐H, Random, 95% CI) | 0.43 [0.27, 0.66] |
| 53 Maternal iron‐deficiency anaemia at or near term (Hb less than 110 g/L and at least one additional laboratory indicators at 34 weeks' gestation or more) (ALL) Show forest plot | 6 | 1088 | Risk Ratio (M‐H, Random, 95% CI) | 0.33 [0.16, 0.69] |
| 54 Maternal Hb concentration at or near term (in g/L, at 34 weeks' gestation or more) (ALL) Show forest plot | 16 | 1851 | Mean Difference (IV, Random, 95% CI) | 8.95 [6.37, 11.53] |
| 55 Maternal Hb concentration within 6 wk postpartum (in g/L) (ALL) Show forest plot | 6 | 659 | Mean Difference (IV, Random, 95% CI) | 7.26 [4.78, 9.74] |
| 56 Maternal high haemoglobin concentrations during second or third trimester (Hb more than 130 g/L) (ALL) Show forest plot | 7 | 1146 | Risk Ratio (M‐H, Random, 95% CI) | 1.90 [1.07, 3.35] |
| 57 Maternal high haemoglobin concentrations at or near term (Hb more than 130 g/L at 34 weeks' gestation or more) (ALL) Show forest plot | 7 | 1189 | Risk Ratio (M‐H, Random, 95% CI) | 3.80 [1.74, 8.28] |
| 58 Moderate anaemia at postpartum (Hb more than 80 g/L and less than 110 g/L) (ALL) Show forest plot | 3 | 453 | Risk Ratio (M‐H, Random, 95% CI) | 0.46 [0.02, 13.91] |
| 59 Maternal severe anaemia at or near term (Hb less than 70 g/L at 34 weeks' gestation or more) (ALL) Show forest plot | 7 | 1046 | Risk Ratio (M‐H, Random, 95% CI) | 0.74 [0.02, 27.81] |
| 60 Severe anaemia at postpartum (Hb less than 80 g/L) (ALL) Show forest plot | 7 | 953 | Risk Ratio (M‐H, Random, 95% CI) | 0.02 [0.00, 0.33] |
| 61 Puerperal infection (ALL) Show forest plot | 2 | 2292 | Risk Ratio (M‐H, Random, 95% CI) | 0.65 [0.41, 1.03] |
| 62 Antepartum haemorrhage (ALL) Show forest plot | 1 | 430 | Risk Ratio (M‐H, Random, 95% CI) | 2.97 [0.12, 72.56] |
| 63 Postpartum haemorrhage (ALL) Show forest plot | 3 | 761 | Risk Ratio (M‐H, Random, 95% CI) | 0.82 [0.51, 1.34] |
| 64 Transfusion provided (ALL) Show forest plot | 1 | 32 | Risk Ratio (M‐H, Random, 95% CI) | 0.33 [0.01, 7.62] |
| 65 Diarrhoea (ALL) Show forest plot | 1 | 173 | Risk Ratio (M‐H, Random, 95% CI) | 0.98 [0.09, 10.61] |
| 66 Constipation (ALL) Show forest plot | 2 | 580 | Risk Ratio (M‐H, Random, 95% CI) | 0.88 [0.18, 4.40] |
| 67 Nausea (ALL) Show forest plot | 3 | 650 | Risk Ratio (M‐H, Random, 95% CI) | 2.38 [0.49, 11.52] |
| 68 Heartburn (ALL) Show forest plot | 1 | 408 | Risk Ratio (M‐H, Random, 95% CI) | 1.0 [0.82, 1.22] |
| 69 Vomiting (ALL) Show forest plot | 2 | 477 | Risk Ratio (M‐H, Random, 95% CI) | 0.88 [0.38, 2.07] |
| 70 Maternal wellbeing/satisfaction (ALL) Show forest plot | 1 | 49 | Risk Ratio (M‐H, Random, 95% CI) | 0.91 [0.77, 1.08] |
| 71 Placental abruption (ALL) Show forest plot | 1 | 1442 | Risk Ratio (M‐H, Random, 95% CI) | 2.88 [0.12, 70.53] |
| 72 Premature rupture of membranes (ALL) Show forest plot | 1 | 72 | Risk Ratio (M‐H, Random, 95% CI) | 0.2 [0.01, 4.03] |
| 73 Pre‐eclampsia (ALL) Show forest plot | 1 | 47 | Risk Ratio (M‐H, Random, 95% CI) | 0.96 [0.06, 14.43] |
| Outcome or subgroup title | No. of studies | No. of participants | Statistical method | Effect size |
| 1 Low birthweight (less than 2500 g) (ALL) Show forest plot | 2 | 1311 | Risk Ratio (M‐H, Random, 95% CI) | 1.07 [0.31, 3.74] |
| 2 Birthweight (ALL) Show forest plot | 2 | 1365 | Mean Difference (IV, Random, 95% CI) | 57.73 [7.66, 107.79] |
| 3 Preterm birth (less than 37 weeks of gestation) (ALL) Show forest plot | 3 | 1497 | Risk Ratio (M‐H, Random, 95% CI) | 1.55 [0.40, 6.00] |
| 4 Preterm birth (less than 37 weeks of gestation): SUBGROUP ANALYSIS by gestational age at the start of supplementation Show forest plot | 3 | 1410 | Risk Ratio (M‐H, Random, 95% CI) | 1.55 [0.40, 6.00] |
| 4.1 Early gestational age (less than 20 weeks of gestation or pre‐pregnancy) at start of supplementation | 2 | 1366 | Risk Ratio (M‐H, Random, 95% CI) | 1.55 [0.40, 6.00] |
| 4.2 Late gestational age (20 weeks or more of gestation) at start of supplementation | 0 | 0 | Risk Ratio (M‐H, Random, 95% CI) | 0.0 [0.0, 0.0] |
| 4.3 Unspecified or mixed gestational age at start of supplementation | 1 | 44 | Risk Ratio (M‐H, Random, 95% CI) | 0.0 [0.0, 0.0] |
| 5 Preterm birth (less than 37 weeks of gestation): SUBGROUP ANALYSIS by anaemia status at the start of supplementation Show forest plot | 3 | 1497 | Risk Ratio (M‐H, Random, 95% CI) | 1.55 [0.40, 6.00] |
| 5.1 Anaemic at start of supplementation | 0 | 0 | Risk Ratio (M‐H, Random, 95% CI) | 0.0 [0.0, 0.0] |
| 5.2 Non‐anaemic at start of supplementation | 0 | 0 | Risk Ratio (M‐H, Random, 95% CI) | 0.0 [0.0, 0.0] |
| 5.3 Unspecified or mixed anaemic status at start of supplementation | 3 | 1497 | Risk Ratio (M‐H, Random, 95% CI) | 1.55 [0.40, 6.00] |
| 6 Preterm birth (less than 37 weeks of gestation): SUBGROUP ANALYSIS by dose of iron Show forest plot | 3 | 1497 | Risk Ratio (M‐H, Random, 95% CI) | 1.55 [0.40, 6.00] |
| 6.1 Low daily dose (30 mg elemental iron or less) | 1 | 131 | Risk Ratio (M‐H, Random, 95% CI) | 0.0 [0.0, 0.0] |
| 6.2 Medium daily dose (31 to 59 mg elemental iron) | 0 | 0 | Risk Ratio (M‐H, Random, 95% CI) | 0.0 [0.0, 0.0] |
| 6.3 Higher daily dose (60 mg elemental iron and above) | 2 | 1366 | Risk Ratio (M‐H, Random, 95% CI) | 1.55 [0.40, 6.00] |
| 7 Preterm birth (less than 37 weeks of gestation): SUBGROUP ANALYSIS by malarial status of setting Show forest plot | 3 | 1497 | Risk Ratio (M‐H, Random, 95% CI) | 1.55 [0.40, 6.00] |
| 7.1 Malarial setting | 2 | 1449 | Risk Ratio (M‐H, Random, 95% CI) | 1.13 [0.92, 1.39] |
| 7.2 Non‐malarial setting | 1 | 48 | Risk Ratio (M‐H, Random, 95% CI) | 7.00 [0.38, 128.61] |
| 8 Neonatal death (within 28 days after delivery) (ALL) Show forest plot | 3 | 1793 | Risk Ratio (M‐H, Random, 95% CI) | 0.81 [0.51, 1.30] |
| 9 Neonatal death (within 28 days after delivery): SUBGROUP ANALYSIS by gestational age at start of supplementation Show forest plot | 3 | 1793 | Risk Ratio (M‐H, Random, 95% CI) | 0.81 [0.51, 1.30] |
| 9.1 Early gestational age (less than 20 weeks of gestation or pre‐pregnancy) at start of supplementation | 3 | 1793 | Risk Ratio (M‐H, Random, 95% CI) | 0.81 [0.51, 1.30] |
| 9.2 Late gestational age (20 weeks or more of gestation) at start of supplementation | 0 | 0 | Risk Ratio (M‐H, Random, 95% CI) | 0.0 [0.0, 0.0] |
| 9.3 Unspecified or mixed gestational age at start of supplementation | 0 | 0 | Risk Ratio (M‐H, Random, 95% CI) | 0.0 [0.0, 0.0] |
| 10 Neonatal death (within 28 days after delivery): SUBGROUP ANALYSIS by anaemia status at start of supplementation Show forest plot | 3 | 1793 | Risk Ratio (M‐H, Random, 95% CI) | 0.81 [0.51, 1.30] |
| 10.1 Anaemic at start of supplementation | 0 | 0 | Risk Ratio (M‐H, Random, 95% CI) | 0.0 [0.0, 0.0] |
| 10.2 Non‐anaemic at start of supplementation | 1 | 97 | Risk Ratio (M‐H, Random, 95% CI) | 2.5 [0.10, 59.88] |
| 10.3 Unspecified or mixed anaemic status at start of supplementation | 2 | 1696 | Risk Ratio (M‐H, Random, 95% CI) | 0.79 [0.49, 1.27] |
| 11 Neonatal death (within 28 days after delivery): SUBGROUP ANALYSIS by dose of iron Show forest plot | 3 | 1793 | Risk Ratio (M‐H, Random, 95% CI) | 0.81 [0.51, 1.30] |
| 11.1 Low daily dose (30 mg elemental iron or less) | 0 | 0 | Risk Ratio (M‐H, Random, 95% CI) | 0.0 [0.0, 0.0] |
| 11.2 Medium daily dose (31 to 59 mg elemental iron) | 0 | 0 | Risk Ratio (M‐H, Random, 95% CI) | 0.0 [0.0, 0.0] |
| 11.3 Higher daily dose (60 mg elemental iron and above) | 3 | 1793 | Risk Ratio (M‐H, Random, 95% CI) | 0.81 [0.51, 1.30] |
| 12 Neonatal death (within 28 days after delivery): SUBGROUP ANALYSIS by malarial status of setting Show forest plot | 3 | 1793 | Risk Ratio (M‐H, Random, 95% CI) | 0.81 [0.51, 1.30] |
| 12.1 Malarial setting | 1 | 1648 | Risk Ratio (M‐H, Random, 95% CI) | 0.79 [0.49, 1.27] |
| 12.2 Non‐malarial setting | 2 | 145 | Risk Ratio (M‐H, Random, 95% CI) | 2.5 [0.10, 59.88] |
| 13 Congenital anomalies (ALL) Show forest plot | 1 | 1652 | Risk Ratio (M‐H, Random, 95% CI) | 0.70 [0.35, 1.40] |
| 14 Maternal anaemia at term (Hb less than 110 g/L at 37 weeks' gestation or more) (ALL) Show forest plot | 3 | 346 | Risk Ratio (M‐H, Random, 95% CI) | 0.34 [0.21, 0.54] |
| 15 Maternal anaemia at term (Hb less than 110 g/L at 37 weeks' gestation or more): SUBGROUP ANALYSIS by gestational age at the start of supplementation Show forest plot | 3 | 346 | Risk Ratio (M‐H, Random, 95% CI) | 0.34 [0.21, 0.54] |
| 15.1 Early gestational age (less than 20 weeks of gestation or pre‐pregnancy) at start of supplementation | 1 | 97 | Risk Ratio (M‐H, Random, 95% CI) | 0.0 [0.0, 0.0] |
| 15.2 Late gestational age (20 weeks or more of gestation) at start of supplementation | 2 | 249 | Risk Ratio (M‐H, Random, 95% CI) | 0.34 [0.21, 0.54] |
| 15.3 Unspecified or mixed gestational age at start of supplementation | 0 | 0 | Risk Ratio (M‐H, Random, 95% CI) | 0.0 [0.0, 0.0] |
| 16 Maternal anaemia at term (Hb less than 110 g/L at 37 weeks' gestation or more): SUBGROUP ANALYSIS by anaemia status at the start of supplementation Show forest plot | 3 | 346 | Risk Ratio (M‐H, Random, 95% CI) | 0.34 [0.21, 0.54] |
| 16.1 Anaemic at start of supplementation | 0 | 0 | Risk Ratio (M‐H, Random, 95% CI) | 0.0 [0.0, 0.0] |
| 16.2 Non‐anaemic at start of supplementation | 2 | 280 | Risk Ratio (M‐H, Random, 95% CI) | 0.24 [0.09, 0.68] |
| 16.3 Unspecified or mixed anaemic status at start of supplementation | 1 | 66 | Risk Ratio (M‐H, Random, 95% CI) | 0.37 [0.22, 0.62] |
| 17 Maternal anaemia at term (Hb less than 110 g/Lat 37 weeks' gestation or more): SUBGROUP ANALYSIS by dose of iron Show forest plot | 3 | 346 | Risk Ratio (M‐H, Random, 95% CI) | 0.34 [0.21, 0.54] |
| 17.1 Low daily dose (30 mg elemental iron or less) | 0 | 0 | Risk Ratio (M‐H, Random, 95% CI) | 0.0 [0.0, 0.0] |
| 17.2 Medium daily dose (31 to 59 mg elemental iron) | 0 | 0 | Risk Ratio (M‐H, Random, 95% CI) | 0.0 [0.0, 0.0] |
| 17.3 Higher daily dose (60 mg elemental iron and above) | 3 | 346 | Risk Ratio (M‐H, Random, 95% CI) | 0.34 [0.21, 0.54] |
| 18 Maternal anaemia at term (Hb less than 110 g/L at 37 weeks' gestation or more): SUBGROUP ANALYSIS by malarial status of setting Show forest plot | 3 | 346 | Risk Ratio (M‐H, Random, 95% CI) | 0.34 [0.21, 0.54] |
| 18.1 Malarial setting | 1 | 66 | Risk Ratio (M‐H, Random, 95% CI) | 0.37 [0.22, 0.62] |
| 18.2 Non‐malarial setting | 2 | 280 | Risk Ratio (M‐H, Random, 95% CI) | 0.24 [0.09, 0.68] |
| 19 Maternal iron deficiency at term (as defined by trialists, based on any indicator of iron status at 37 weeks' gestation or more) (ALL) Show forest plot | 1 | 131 | Risk Ratio (M‐H, Random, 95% CI) | 0.24 [0.06, 0.99] |
| 20 Maternal iron‐deficiency anaemia at term (Hb less than 110 g/L and at least one additional laboratory indicators at 37 weeks' gestation or more) (ALL) Show forest plot | 1 | 131 | Risk Ratio (M‐H, Random, 95% CI) | 0.43 [0.17, 1.09] |
| 21 Maternal death (death while pregnant or within 42 days of termination of pregnancy) (ALL) Show forest plot | 1 | 131 | Risk Ratio (M‐H, Random, 95% CI) | 0.0 [0.0, 0.0] |
| 22 Side effects (any reported throughout the intervention period) (ALL) Show forest plot | 1 | 456 | Risk Ratio (M‐H, Random, 95% CI) | 44.32 [2.77, 709.09] |
| 23 Maternal severe anaemia at any time during second and third trimester (Hb less than 70 g/L) (ALL) Show forest plot | 4 | 506 | Risk Ratio (M‐H, Random, 95% CI) | 0.12 [0.02, 0.63] |
| 24 Maternal clinical malaria | 0 | 0 | Risk Ratio (M‐H, Random, 95% CI) | 0.0 [0.0, 0.0] |
| 25 Infection during pregnancy (including urinary tract infections) (ALL) Show forest plot | 1 | 48 | Risk Ratio (M‐H, Random, 95% CI) | 1.0 [0.15, 6.53] |
| 26 Very low birthweight (less than 1500 g) (ALL) Show forest plot | 1 | 48 | Risk Ratio (M‐H, Random, 95% CI) | 5.0 [0.25, 98.96] |
| 27 Very premature birth (less than 34 weeks' gestation) (ALL) Show forest plot | 2 | 92 | Risk Ratio (M‐H, Random, 95% CI) | 5.0 [0.25, 98.96] |
| 28 Infant Hb concentration in the first 6 months (in g/L, counting the last reported measure after birth within this period) (ALL) | 0 | 0 | Mean Difference (IV, Random, 95% CI) | 0.0 [0.0, 0.0] |
| 29 Infant serum ferritin concentration in the first 6 months (in μg/L, counting the last reported measure after birth within this period) (ALL) | 0 | 0 | Mean Difference (IV, Random, 95% CI) | 0.0 [0.0, 0.0] |
| 30 Admission to special care unit (ALL) Show forest plot | 1 | 48 | Risk Ratio (M‐H, Random, 95% CI) | 0.0 [0.0, 0.0] |
| 31 Maternal anaemia at or near term (Hb less than 110 g/L at 34 weeks' gestation or more) (ALL) Show forest plot | 3 | 346 | Risk Ratio (M‐H, Random, 95% CI) | 0.34 [0.21, 0.54] |
| 32 Maternal iron deficiency at or near term (as defined by trialists, based on any indicator of iron status at 34 weeks' gestation or more) (ALL) Show forest plot | 1 | 131 | Risk Ratio (M‐H, Random, 95% CI) | 0.24 [0.06, 0.99] |
| 33 Maternal iron‐deficiency anaemia at or near term (Hb less than 110 g/L and at least one additional laboratory indicators at 34 weeks' gestation or more) (ALL) Show forest plot | 1 | 131 | Risk Ratio (M‐H, Random, 95% CI) | 0.43 [0.17, 1.09] |
| 34 Maternal Hb concentration at term or near term (in g/L, at 34 weeks' gestation or more) (ALL) Show forest plot | 3 | 140 | Mean Difference (IV, Random, 95% CI) | 16.13 [12.74, 19.52] |
| 35 Maternal Hb concentration within 6 wk postpartum (g/L) (ALL) Show forest plot | 2 | 459 | Mean Difference (IV, Random, 95% CI) | 10.07 [7.33, 12.81] |
| 36 Maternal high haemoglobin concentrations during second or third trimester (Hb more than 130 g/L) (ALL) Show forest plot | 2 | 446 | Risk Ratio (M‐H, Random, 95% CI) | 1.78 [0.63, 5.04] |
| 37 Maternal high haemoglobin concentrations at or near term (Hb more than 130 g/L at 34 weeks' gestation or more) (ALL) Show forest plot | 2 | 314 | Risk Ratio (M‐H, Random, 95% CI) | 4.37 [0.58, 32.71] |
| 38 Moderate anaemia at postpartum (Hb more than 80 g/L and less than 110 g/L) (ALL) Show forest plot | 2 | 458 | Risk Ratio (M‐H, Random, 95% CI) | 0.34 [0.17, 0.69] |
| 39 Maternal severe anaemia at term or near (Hb less than 70 g/L at 34 weeks' gestation or more) (ALL) Show forest plot | 3 | 191 | Risk Ratio (M‐H, Random, 95% CI) | 0.14 [0.01, 2.63] |
| 40 Severe anaemia at postpartum (Hb less than 80 g/L) (ALL) Show forest plot | 3 | 491 | Risk Ratio (M‐H, Random, 95% CI) | 0.05 [0.00, 0.76] |
| 41 Puerperal infection (ALL) Show forest plot | 1 | 2863 | Risk Ratio (M‐H, Random, 95% CI) | 0.55 [0.13, 2.28] |
| 42 Antepartum haemorrhage (ALL) Show forest plot | 2 | 145 | Risk Ratio (M‐H, Random, 95% CI) | 1.25 [0.22, 7.12] |
| 43 Postpartum haemorrhage (ALL) | 0 | 0 | Risk Ratio (M‐H, Random, 95% CI) | 0.0 [0.0, 0.0] |
| 44 Placental abruption (ALL) Show forest plot | 1 | 2863 | Risk Ratio (M‐H, Random, 95% CI) | 8.19 [0.49, 138.16] |
| 45 Pre‐eclampsia (ALL) Show forest plot | 1 | 48 | Risk Ratio (M‐H, Random, 95% CI) | 3.0 [0.13, 70.16] |
| Outcome or subgroup title | No. of studies | No. of participants | Statistical method | Effect size |
| 1 Low birthweight (less than 2500 g) (ALL) Show forest plot | 4 | 16143 | Risk Ratio (M‐H, Random, 95% CI) | 0.88 [0.78, 1.00] |
| 2 Low birthweight (less than 2500 g): SUBGROUP ANALYSIS by gestational age at the start of supplementation Show forest plot | 4 | 16143 | Risk Ratio (M‐H, Random, 95% CI) | 0.88 [0.78, 1.00] |
| 2.1 Early gestational age (less than 20 weeks of gestation or pre‐pregnancy) at start of supplementation | 3 | 13817 | Risk Ratio (M‐H, Random, 95% CI) | 0.91 [0.75, 1.11] |
| 2.2 Late gestational age (20 weeks or more of gestation) at start of supplementation | 0 | 0 | Risk Ratio (M‐H, Random, 95% CI) | 0.0 [0.0, 0.0] |
| 2.3 Unspecified or mixed gestational age at the start of supplementation | 1 | 2326 | Risk Ratio (M‐H, Random, 95% CI) | 0.85 [0.59, 1.22] |
| 3 Low birthweight (less than 2500 g): SUBGROUP ANALYSIS by anaemia status at the start of supplementation Show forest plot | 4 | 16143 | Risk Ratio (M‐H, Random, 95% CI) | 0.88 [0.78, 1.00] |
| 3.1 Anaemic at start of supplementation | 0 | 0 | Risk Ratio (M‐H, Random, 95% CI) | 0.0 [0.0, 0.0] |
| 3.2 Non‐anaemic at start of supplementation | 2 | 12554 | Risk Ratio (M‐H, Random, 95% CI) | 1.04 [0.83, 1.32] |
| 3.3 Unspecified or mixed anaemia status | 2 | 3589 | Risk Ratio (M‐H, Random, 95% CI) | 0.83 [0.72, 0.94] |
| 4 Low birthweight (less than 2500 g): SUBGROUP ANALYSIS by dose of iron Show forest plot | 4 | 16143 | Risk Ratio (M‐H, Random, 95% CI) | 0.88 [0.78, 1.00] |
| 4.1 Low daily dose (30 mg elemental iron or less) | 1 | 11827 | Risk Ratio (M‐H, Random, 95% CI) | 1.03 [0.81, 1.31] |
| 4.2 Medium daily dose (31 to 59 mg elemental iron) | 1 | 727 | Risk Ratio (M‐H, Random, 95% CI) | 1.21 [0.57, 2.54] |
| 4.3 Higher daily dose (60 mg elemental iron and above) | 2 | 3589 | Risk Ratio (M‐H, Random, 95% CI) | 0.83 [0.72, 0.94] |
| 5 Low birthweight (less than 2500 g): SUBGROUP ANALYSIS by malarial status of setting Show forest plot | 4 | 16143 | Risk Ratio (M‐H, Random, 95% CI) | 0.88 [0.78, 1.00] |
| 5.1 Malarial setting | 3 | 4316 | Risk Ratio (M‐H, Random, 95% CI) | 0.84 [0.73, 0.95] |
| 5.2 Non‐malarial setting | 1 | 11827 | Risk Ratio (M‐H, Random, 95% CI) | 1.03 [0.81, 1.31] |
| 6 Birthweight (g) (ALL) Show forest plot | 4 | 16143 | Mean Difference (IV, Random, 95% CI) | 19.50 [‐6.90, 45.89] |
| 7 Birthweight (g): SUBGROUP ANALYSIS by gestational age at the start of supplementation Show forest plot | 4 | 16143 | Mean Difference (IV, Random, 95% CI) | 19.50 [‐6.90, 45.89] |
| 7.1 Early gestational age (less than 20 weeks of gestation or pre‐pregnancy) at start of supplementation | 3 | 13817 | Mean Difference (IV, Random, 95% CI) | 22.47 [‐18.18, 63.12] |
| 7.2 Late gestational age (20 weeks or more of gestation) at start of supplementation | 0 | 0 | Mean Difference (IV, Random, 95% CI) | 0.0 [0.0, 0.0] |
| 7.3 Unspecified or mixed gestational age at the start of supplementation | 1 | 2326 | Mean Difference (IV, Random, 95% CI) | 20.20 [‐15.13, 55.53] |
| 8 Birthweight (g): SUBGROUP ANALYSIS by anaemia status at the start of supplementation Show forest plot | 4 | 16143 | Mean Difference (IV, Random, 95% CI) | 19.50 [‐6.90, 45.89] |
| 8.1 Anaemic at start of supplementation | 0 | 0 | Mean Difference (IV, Random, 95% CI) | 0.0 [0.0, 0.0] |
| 8.2 Non‐anaemic at start of supplementation | 2 | 12554 | Mean Difference (IV, Random, 95% CI) | 2.30 [‐11.42, 16.01] |
| 8.3 Unspecified or mixed anaemic status at start of supplementation | 2 | 3589 | Mean Difference (IV, Random, 95% CI) | 39.61 [‐3.90, 83.13] |
| 9 Birthweight (g): SUBGROUP ANALYSIS by dose of iron Show forest plot | 4 | 16143 | Mean Difference (IV, Random, 95% CI) | 19.50 [‐6.90, 45.89] |
| 9.1 Low daily dose (30 mg elemental iron or less) | 1 | 11827 | Mean Difference (IV, Random, 95% CI) | 1.90 [‐12.17, 15.97] |
| 9.2 Medium daily dose (31 to 59 mg elemental iron) | 1 | 727 | Mean Difference (IV, Random, 95% CI) | 10.0 [‐51.92, 71.92] |
| 9.3 Higher daily dose (60 mg elemental iron and above) | 2 | 3589 | Mean Difference (IV, Random, 95% CI) | 39.61 [‐3.90, 83.13] |
| 10 Birthweight (g): SUBGROUP ANALYSIS by malarial status of setting Show forest plot | 4 | 16143 | Mean Difference (IV, Random, 95% CI) | 19.50 [‐6.90, 45.89] |
| 10.1 Malarial setting | 3 | 4316 | Mean Difference (IV, Random, 95% CI) | 32.23 [0.86, 63.60] |
| 10.2 Non‐malarial setting | 1 | 11827 | Mean Difference (IV, Random, 95% CI) | 1.90 [‐12.17, 15.97] |
| 11 Preterm birth (less than 37 weeks of gestation) (ALL) Show forest plot | 4 | 16146 | Risk Ratio (M‐H, Random, 95% CI) | 0.97 [0.87, 1.08] |
| 12 Preterm birth (less 37 weeks of gestation): SUBGROUP ANALYSIS by gestational age at the start of supplementation Show forest plot | 4 | 16146 | Risk Ratio (M‐H, Random, 95% CI) | 0.97 [0.87, 1.08] |
| 12.1 Early gestational age (less than 20 weeks of gestation or pre‐pregnancy) at start of supplementation | 3 | 13820 | Risk Ratio (M‐H, Random, 95% CI) | 0.99 [0.88, 1.12] |
| 12.2 Late gestational age (20 weeks or more of gestation) at start of supplementation | 0 | 0 | Risk Ratio (M‐H, Random, 95% CI) | 0.0 [0.0, 0.0] |
| 12.3 Unspecified or mixed gestational age at the start of supplementation | 1 | 2326 | Risk Ratio (M‐H, Random, 95% CI) | 0.79 [0.57, 1.09] |
| 13 Preterm birth (less 37 weeks of gestation): SUBGROUP ANALYSIS by anaemia status at the start of supplementation Show forest plot | 4 | 16146 | Risk Ratio (M‐H, Random, 95% CI) | 0.97 [0.87, 1.08] |
| 13.1 Anaemic at start of supplementation | 0 | 0 | Risk Ratio (M‐H, Random, 95% CI) | 0.0 [0.0, 0.0] |
| 13.2 Non‐anaemic at start of supplementation | 2 | 12559 | Risk Ratio (M‐H, Random, 95% CI) | 0.97 [0.84, 1.12] |
| 13.3 Unspecified or mixed anaemic status at start of supplementation | 2 | 3587 | Risk Ratio (M‐H, Random, 95% CI) | 0.93 [0.71, 1.22] |
| 14 Preterm birth (less 37 weeks of gestation): SUBGROUP ANALYSIS by dose of iron Show forest plot | 4 | 16146 | Risk Ratio (M‐H, Random, 95% CI) | 0.97 [0.87, 1.08] |
| 14.1 Low daily dose (30 mg elemental iron or less) | 1 | 11832 | Risk Ratio (M‐H, Random, 95% CI) | 0.96 [0.83, 1.11] |
| 14.2 Medium daily dose (31 to 59 mg elemental iron) | 1 | 727 | Risk Ratio (M‐H, Random, 95% CI) | 1.26 [0.62, 2.56] |
| 14.3 Higher daily dose (60 mg elemental iron and above) | 2 | 3587 | Risk Ratio (M‐H, Random, 95% CI) | 0.93 [0.71, 1.22] |
| 15 Preterm birth (less 37 weeks of gestation): SUBGROUP ANALYSIS by malarial status of setting Show forest plot | 4 | 16146 | Risk Ratio (M‐H, Random, 95% CI) | 0.97 [0.87, 1.08] |
| 15.1 Malarial setting | 3 | 4314 | Risk Ratio (M‐H, Random, 95% CI) | 0.97 [0.78, 1.20] |
| 15.2 Non‐malarial setting | 1 | 11832 | Risk Ratio (M‐H, Random, 95% CI) | 0.96 [0.83, 1.11] |
| 16 Neonatal death (within 28 days after delivery) (ALL) Show forest plot | 4 | 16603 | Risk Ratio (M‐H, Random, 95% CI) | 0.91 [0.71, 1.18] |
| 17 Neonatal death (within 28 days after delivery): SUBGROUP ANALYSIS by gestational age at the start of supplementation Show forest plot | 4 | 16603 | Risk Ratio (M‐H, Random, 95% CI) | 0.91 [0.71, 1.18] |
| 17.1 Early gestational age (less than 20 weeks of gestation or pre‐pregnancy) at start of supplementation | 3 | 14108 | Risk Ratio (M‐H, Random, 95% CI) | 1.00 [0.71, 1.42] |
| 17.2 Late gestational age (20 weeks or more of gestation) at start of supplementation | 0 | 0 | Risk Ratio (M‐H, Random, 95% CI) | 0.0 [0.0, 0.0] |
| 17.3 Unspecified or mixed gestational age at the start of supplementation | 1 | 2495 | Risk Ratio (M‐H, Random, 95% CI) | 0.81 [0.56, 1.19] |
| 18 Neonatal death (within 28 days after delivery) : SUBGROUP ANALYSIS by anaemia status at the start of supplementation Show forest plot | 4 | 16603 | Risk Ratio (M‐H, Random, 95% CI) | 0.91 [0.71, 1.18] |
| 18.1 Anaemic at start of supplementation | 0 | 0 | Risk Ratio (M‐H, Random, 95% CI) | 0.0 [0.0, 0.0] |
| 18.2 Non‐anaemic at start of supplementation | 2 | 12559 | Risk Ratio (M‐H, Random, 95% CI) | 0.94 [0.51, 1.77] |
| 18.3 Unspecified or mixed anaemic status at start of supplementation | 2 | 4044 | Risk Ratio (M‐H, Random, 95% CI) | 0.88 [0.65, 1.19] |
| 19 Neonatal death (within 28 days after delivery): SUBGROUP ANALYSIS by dose of iron Show forest plot | 4 | 16603 | Risk Ratio (M‐H, Random, 95% CI) | 0.91 [0.71, 1.18] |
| 19.1 Low daily dose (30 mg elemental iron or less) | 1 | 11832 | Risk Ratio (M‐H, Random, 95% CI) | 1.10 [0.67, 1.82] |
| 19.2 Medium daily dose (31 to 59 mg elemental iron) | 1 | 727 | Risk Ratio (M‐H, Random, 95% CI) | 0.48 [0.12, 1.91] |
| 19.3 Higher daily dose (60 mg elemental iron and above) | 2 | 4044 | Risk Ratio (M‐H, Random, 95% CI) | 0.88 [0.65, 1.19] |
| 20 Neonatal death (within 28 days after delivery): SUBGROUP ANALYSIS by malarial status of setting Show forest plot | 4 | 16603 | Risk Ratio (M‐H, Random, 95% CI) | 0.91 [0.71, 1.18] |
| 20.1 Malarial setting | 3 | 4771 | Risk Ratio (M‐H, Random, 95% CI) | 0.85 [0.63, 1.15] |
| 20.2 Non‐malarial setting | 1 | 11832 | Risk Ratio (M‐H, Random, 95% CI) | 1.10 [0.67, 1.82] |
| 21 Congenital anomalies (ALL) Show forest plot | 2 | 13586 | Risk Ratio (M‐H, Random, 95% CI) | 0.78 [0.44, 1.39] |
| 22 Maternal anaemia at term (Hb less than 110 g/L at 37 weeks' gestation or more) (ALL) Show forest plot | 2 | 303 | Risk Ratio (M‐H, Random, 95% CI) | 0.34 [0.21, 0.55] |
| 23 Maternal anaemia at term (Hb less than 110 g/L at 37 weeks' gestation or more): SUBGROUP ANALYSIS by gestational age at the start of supplementation Show forest plot | 2 | 303 | Risk Ratio (M‐H, Random, 95% CI) | 0.34 [0.21, 0.55] |
| 23.1 Early gestational age (less than 20 weeks of gestation or pre‐pregnancy) at start of supplementation | 0 | 0 | Risk Ratio (M‐H, Random, 95% CI) | 0.0 [0.0, 0.0] |
| 23.2 Late gestational age (20 weeks or more of gestation) at start of supplementation | 2 | 303 | Risk Ratio (M‐H, Random, 95% CI) | 0.34 [0.21, 0.55] |
| 23.3 Unspecified or mixed gestational age at start of supplementation | 0 | 0 | Risk Ratio (M‐H, Random, 95% CI) | 0.0 [0.0, 0.0] |
| 24 Maternal anaemia at term (Hb less than 110 g/L at 37 weeks' gestation or more): SUBGROUP ANALYSIS by anaemia status at the start of supplementation Show forest plot | 2 | 303 | Risk Ratio (M‐H, Random, 95% CI) | 0.34 [0.21, 0.55] |
| 24.1 Anaemic at start of supplementation | 0 | 0 | Risk Ratio (M‐H, Random, 95% CI) | 0.0 [0.0, 0.0] |
| 24.2 Non‐anaemic at start of supplementation | 1 | 240 | Risk Ratio (M‐H, Random, 95% CI) | 0.24 [0.09, 0.61] |
| 24.3 Unspecified or mixed anaemic status at start of supplementation | 1 | 63 | Risk Ratio (M‐H, Random, 95% CI) | 0.39 [0.23, 0.67] |
| 25 Maternal anaemia at term (Hb less than 110 g/L at 37 weeks' gestation or more ): SUBGROUP ANALYSIS by dose of iron Show forest plot | 2 | 303 | Risk Ratio (M‐H, Random, 95% CI) | 0.34 [0.21, 0.55] |
| 25.1 Low daily dose (30 mg elemental iron or less) | 0 | 0 | Risk Ratio (M‐H, Random, 95% CI) | 0.0 [0.0, 0.0] |
| 25.2 Medium daily dose (31 to 59 mg elemental iron) | 0 | 0 | Risk Ratio (M‐H, Random, 95% CI) | 0.0 [0.0, 0.0] |
| 25.3 Higher daily dose (60 mg elemental iron and above) | 2 | 303 | Risk Ratio (M‐H, Random, 95% CI) | 0.34 [0.21, 0.55] |
| 26 Maternal anaemia at term (Hb less than 110 g/L at 37 weeks' gestation or more ): SUBGROUP ANALYSIS by malarial status of setting Show forest plot | 2 | 303 | Risk Ratio (M‐H, Random, 95% CI) | 0.34 [0.21, 0.55] |
| 26.1 Malarial setting | 1 | 63 | Risk Ratio (M‐H, Random, 95% CI) | 0.39 [0.23, 0.67] |
| 26.2 Non‐malarial setting | 1 | 240 | Risk Ratio (M‐H, Random, 95% CI) | 0.24 [0.09, 0.61] |
| 27 Maternal iron deficiency at term (as defined by trialists, based on any indicator of iron status at 37 weeks' gestation or more) (ALL) | 0 | 0 | Risk Ratio (M‐H, Random, 95% CI) | 0.0 [0.0, 0.0] |
| 28 Maternal iron‐deficiency anaemia at term (Hb less than 110 g/L and at least one additional laboratory indicators at 37 weeks' gestation or more) (ALL) Show forest plot | 1 | 727 | Risk Ratio (M‐H, Random, 95% CI) | 0.0 [0.0, 0.0] |
| 29 Maternal death (death while pregnant or within 42 days of termination of pregnancy) (ALL) | 0 | 0 | Risk Ratio (M‐H, Random, 95% CI) | 0.0 [0.0, 0.0] |
| 30 Side effects (any reported throughout the intervention period) (ALL) Show forest plot | 1 | 727 | Risk Ratio (M‐H, Random, 95% CI) | 1.10 [0.55, 2.23] |
| 31 Maternal severe anaemia at any time during second and third trimester (Hb less than 70 g/L) (ALL) Show forest plot | 3 | 1047 | Risk Ratio (M‐H, Random, 95% CI) | 0.06 [0.01, 0.47] |
| 32 Maternal clinical malaria | 0 | 0 | Risk Ratio (M‐H, Random, 95% CI) | 0.0 [0.0, 0.0] |
| 33 Infection during pregnancy (including urinary tract infections) (ALL) Show forest plot | 1 | 727 | Risk Ratio (M‐H, Random, 95% CI) | 1.21 [0.33, 4.46] |
| 34 Very low birthweight (less than 1500 g) (ALL) Show forest plot | 2 | 1990 | Risk Ratio (M‐H, Random, 95% CI) | 0.76 [0.28, 2.01] |
| 35 Very premature birth (less than 34 weeks' gestation) (ALL) Show forest plot | 2 | 3053 | Risk Ratio (M‐H, Random, 95% CI) | 0.58 [0.30, 1.12] |
| 36 Infant Hb concentration in the first 6 months (in g/L, counting the last reported measure after birth within this period) (ALL) | 0 | 0 | Mean Difference (IV, Random, 95% CI) | 0.0 [0.0, 0.0] |
| 37 Infant serum ferritin concentration in the first 6 months (in μg/L, counting the last reported measure after birth within this period) (ALL) | 0 | 0 | Mean Difference (IV, Random, 95% CI) | 0.0 [0.0, 0.0] |
| 38 Admission to special care unit (ALL) | 0 | 0 | Risk Ratio (M‐H, Random, 95% CI) | 0.0 [0.0, 0.0] |
| 39 Maternal anaemia at or near term (Hb less than 110 g/L at 34 weeks' gestation or more) (ALL) Show forest plot | 2 | 303 | Risk Ratio (M‐H, Random, 95% CI) | 0.34 [0.21, 0.55] |
| 40 Maternal iron deficiency at or near term (as defined by trialists, based on any indicator of iron status at 34 weeks' gestation or more) (ALL) | 0 | 0 | Risk Ratio (M‐H, Random, 95% CI) | 0.0 [0.0, 0.0] |
| 41 Maternal iron‐deficiency anaemia at or near term (Hb less than 110 g/L and at least one additional laboratory indicators at 34 weeks' gestation or more) (ALL) Show forest plot | 1 | 727 | Risk Ratio (M‐H, Random, 95% CI) | 0.0 [0.0, 0.0] |
| 42 Maternal Hb concentration at or near term (in g/L at 34 weeks' gestation or more) (ALL) Show forest plot | 2 | 771 | Mean Difference (IV, Random, 95% CI) | 12.44 [0.95, 23.93] |
| 43 Maternal Hb concentration within 6 wk postpartum (in g/L) (ALL) Show forest plot | 1 | 297 | Mean Difference (IV, Random, 95% CI) | 9.20 [5.78, 12.62] |
| 44 Maternal high haemoglobin concentrations during second or third trimester (Hb more than 130 g/L) (ALL) Show forest plot | 2 | 1042 | Risk Ratio (M‐H, Random, 95% CI) | 4.33 [2.26, 8.30] |
| 45 Maternal high haemoglobin concentrations at or near term (Hb more than 130 g/L at 34 weeks' gestation or more) (ALL) Show forest plot | 2 | 967 | Risk Ratio (M‐H, Random, 95% CI) | 1.87 [0.32, 10.84] |
| 46 Moderate anaemia at postpartum (Hb more than 80 g/L and less than 110 g/L) (ALL) Show forest plot | 1 | 353 | Risk Ratio (M‐H, Random, 95% CI) | 0.38 [0.18, 0.81] |
| 47 Maternal severe anaemia at or near term (Hb less than 70 g/L at 34 weeks' gestation or more) (ALL) Show forest plot | 2 | 773 | Risk Ratio (M‐H, Random, 95% CI) | 0.0 [0.0, 0.0] |
| 48 Severe anaemia at postpartum (Hb less than 80 g/L) (ALL) Show forest plot | 2 | 386 | Risk Ratio (M‐H, Random, 95% CI) | 0.08 [0.00, 1.33] |
| 49 Puerperal infection (ALL) Show forest plot | 1 | 727 | Risk Ratio (M‐H, Random, 95% CI) | 0.96 [0.20, 4.75] |
| 50 Antepartum haemorrhage (ALL) Show forest plot | 1 | 727 | Risk Ratio (M‐H, Random, 95% CI) | 1.35 [0.43, 4.22] |
| 51 Postpartum haemorrhage (ALL) Show forest plot | 1 | 727 | Risk Ratio (M‐H, Random, 95% CI) | 3.38 [0.71, 16.15] |
| 52 Transfusion provided (ALL) Show forest plot | 1 | 727 | Risk Ratio (M‐H, Random, 95% CI) | 2.89 [0.12, 70.83] |
| 53 Diarrhoea (ALL) Show forest plot | 1 | 727 | Risk Ratio (M‐H, Random, 95% CI) | 0.55 [0.16, 1.87] |
| 54 Constipation (ALL) Show forest plot | 1 | 727 | Risk Ratio (M‐H, Random, 95% CI) | 1.10 [0.55, 2.23] |
| 55 Nausea (ALL) Show forest plot | 1 | 727 | Risk Ratio (M‐H, Random, 95% CI) | 0.96 [0.47, 1.99] |
| 56 Heartburn (ALL) Show forest plot | 1 | 727 | Risk Ratio (M‐H, Random, 95% CI) | 1.65 [0.66, 4.15] |
| 57 Vomiting (ALL) | 0 | 0 | Risk Ratio (M‐H, Random, 95% CI) | 0.0 [0.0, 0.0] |
| 58 Maternal wellbeing/satisfaction (ALL) | 0 | 0 | Risk Ratio (M‐H, Random, 95% CI) | 0.0 [0.0, 0.0] |
| 59 Placental abruption (ALL) Show forest plot | 1 | 727 | Risk Ratio (M‐H, Random, 95% CI) | 0.96 [0.24, 3.83] |
| 60 Premature rupture of membranes (ALL) Show forest plot | 1 | 727 | Risk Ratio (M‐H, Random, 95% CI) | 0.99 [0.74, 1.34] |
| 61 Pre‐eclampsia (ALL) Show forest plot | 1 | 727 | Risk Ratio (M‐H, Random, 95% CI) | 3.22 [0.89, 11.59] |
| 62 Mental development index in infants at 3 months | 0 | 0 | Mean Difference (IV, Random, 95% CI) | 0.0 [0.0, 0.0] |
| 63 Mental development index in infants at 6 months | 0 | 0 | Mean Difference (IV, Random, 95% CI) | 0.0 [0.0, 0.0] |
| 64 Mental development index in infants at 12 months | 0 | 0 | Mean Difference (IV, Random, 95% CI) | 0.0 [0.0, 0.0] |
| 65 Mental development index in infants at 18 months | 0 | 0 | Mean Difference (IV, Random, 95% CI) | 0.0 [0.0, 0.0] |
| 66 Mental development index in infants at 24 months | 0 | 0 | Mean Difference (IV, Random, 95% CI) | 0.0 [0.0, 0.0] |
| 67 Mental development index in infants at 18 months | 0 | 0 | Mean Difference (IV, Random, 95% CI) | 0.0 [0.0, 0.0] |
| 68 Psychomotor development index in infants at 3 months | 0 | 0 | Mean Difference (IV, Random, 95% CI) | 0.0 [0.0, 0.0] |
| 69 Psychomotor development index in infants at 6 months | 0 | 0 | Mean Difference (IV, Random, 95% CI) | 0.0 [0.0, 0.0] |
| 70 Psychomotor development index in infants at 12 months | 0 | 0 | Mean Difference (IV, Random, 95% CI) | 0.0 [0.0, 0.0] |
| 71 Psychomotor development index in infants at 24 months | 0 | 0 | Mean Difference (IV, Random, 95% CI) | 0.0 [0.0, 0.0] |
| Outcome or subgroup title | No. of studies | No. of participants | Statistical method | Effect size |
| 1 Low birthweight (less than 2500 g) (ALL) Show forest plot | 1 | 334 | Risk Ratio (M‐H, Random, 95% CI) | 0.51 [0.22, 1.15] |
| 2 Birthweight (g) (ALL) Show forest plot | 2 | 1116 | Mean Difference (IV, Random, 95% CI) | 55.70 [3.42, 107.97] |
| 3 Preterm birth (less than 37 weeks of gestation) (ALL) Show forest plot | 2 | 1127 | Risk Ratio (M‐H, Random, 95% CI) | 0.66 [0.41, 1.04] |
| 4 Neonatal death (within 28 days after delivery) (ALL) | 0 | 0 | Risk Ratio (M‐H, Random, 95% CI) | 0.0 [0.0, 0.0] |
| 5 Congenital anomalies (ALL) | 0 | 0 | Risk Ratio (M‐H, Random, 95% CI) | 0.0 [0.0, 0.0] |
| 6 Maternal anaemia at term (Hb less than 110 g/L at 37 weeks' gestation or more) (ALL) | 0 | 0 | Risk Ratio (M‐H, Random, 95% CI) | 0.0 [0.0, 0.0] |
| 7 Maternal iron deficiency at term (as defined by trialists, based on any indicator of iron status at 37 weeks' gestation or more)(ALL) | 0 | 0 | Risk Ratio (M‐H, Random, 95% CI) | 0.0 [0.0, 0.0] |
| 8 Maternal iron‐deficiency anaemia at term (Hb less than 110 g/L and at least one additional laboratory indicators at 37 weeks' gestation or more) (ALL) | 0 | 0 | Risk Ratio (M‐H, Random, 95% CI) | 0.0 [0.0, 0.0] |
| 9 Maternal death (death while pregnant or within 42 days of termination of pregnancy) (ALL) | 0 | 0 | Risk Ratio (M‐H, Random, 95% CI) | 0.0 [0.0, 0.0] |
| 10 Side effects (any reported throughout the intervention period) (ALL) Show forest plot | 1 | 188 | Risk Ratio (M‐H, Random, 95% CI) | 0.77 [0.55, 1.07] |
| 11 Maternal severe anaemia at any time during second and third trimester (Hb less than 70 g/L) (ALL) | 0 | 0 | Risk Ratio (M‐H, Random, 95% CI) | 0.0 [0.0, 0.0] |
| 12 Maternal clinical malaria | 0 | 0 | Risk Ratio (M‐H, Random, 95% CI) | 0.0 [0.0, 0.0] |
| 13 Infection during pregnancy (including urinary tract infections) (ALL) | 0 | 0 | Risk Ratio (M‐H, Random, 95% CI) | 0.0 [0.0, 0.0] |
| 14 Very low birthweight (less than 1500 g) (ALL) | 0 | 0 | Risk Ratio (M‐H, Random, 95% CI) | 0.0 [0.0, 0.0] |
| 15 Very premature birth (less than 34 weeks' gestation) (ALL) | 0 | 0 | Risk Ratio (M‐H, Random, 95% CI) | 0.0 [0.0, 0.0] |
| 16 Infant Hb concentration in the first 6 months (in g/L, counting the last reported measure after birth within this period) (ALL) | 0 | 0 | Mean Difference (IV, Random, 95% CI) | 0.0 [0.0, 0.0] |
| 17 Infant serum ferritin concentration in the first 6 months (in μg/L, counting the last reported measure after birth within this period) (ALL) | 0 | 0 | Mean Difference (IV, Random, 95% CI) | 0.0 [0.0, 0.0] |
| 18 Admission to special care unit (ALL) | 0 | 0 | Risk Ratio (M‐H, Random, 95% CI) | 0.0 [0.0, 0.0] |
| 19 Maternal anaemia at or near term (Hb less than 110 g/L at 34 weeks' gestation or more) (ALL) | 0 | 0 | Risk Ratio (M‐H, Random, 95% CI) | 0.0 [0.0, 0.0] |
| 20 Maternal iron deficiency at or near term (as defined by trialists, based on any indicator of iron status at 34 weeks' gestation or more)(ALL) | 0 | 0 | Risk Ratio (M‐H, Random, 95% CI) | 0.0 [0.0, 0.0] |
| 21 Maternal iron‐deficiency anaemia at or near term (Hb less than 110 g/L and at least one additional laboratory indicators at 34 weeks' gestation or more) (ALL) | 0 | 0 | Risk Ratio (M‐H, Random, 95% CI) | 0.0 [0.0, 0.0] |
| 22 Maternal Hb concentration at or near term (in g/L at 34 weeks' gestation or more) (ALL) Show forest plot | 2 | 809 | Mean Difference (IV, Random, 95% CI) | 10.85 [7.29, 14.42] |
| 23 Maternal Hb concentration within 6 wk postpartum (in g/L) (ALL) Show forest plot | 1 | 27 | Mean Difference (IV, Random, 95% CI) | 14.0 [3.56, 24.44] |
| 24 Maternal high haemoglobin concentrations during second or third trimester (Hb more than 130 g/L) (ALL) | 0 | 0 | Risk Ratio (M‐H, Random, 95% CI) | 0.0 [0.0, 0.0] |
| 25 Maternal high haemoglobin concentrations at or near term (Hb more than 130 g/L at 34 weeks' gestation or more) (ALL) | 0 | 0 | Risk Ratio (M‐H, Random, 95% CI) | 0.0 [0.0, 0.0] |
| 26 Moderate anaemia at postpartum (Hb more than 80 g/L and less than 110 g/L) (ALL) | 0 | 0 | Risk Ratio (M‐H, Random, 95% CI) | 0.0 [0.0, 0.0] |
| 27 Maternal severe anaemia at or near term (Hb less than 70 g/L at 34 weeks' gestation or more) (ALL) | 0 | 0 | Risk Ratio (M‐H, Random, 95% CI) | 0.0 [0.0, 0.0] |
| 28 Severe anaemia at postpartum (Hb less than 80 g/L) (ALL) | 0 | 0 | Risk Ratio (M‐H, Random, 95% CI) | 0.0 [0.0, 0.0] |
| 29 Puerperal infection (ALL) | 0 | 0 | Risk Ratio (M‐H, Random, 95% CI) | 0.0 [0.0, 0.0] |
| 30 Antepartum haemorrhage (ALL) | 0 | 0 | Risk Ratio (M‐H, Random, 95% CI) | 0.0 [0.0, 0.0] |
| 31 Postpartum haemorrhage (ALL) | 0 | 0 | Risk Ratio (M‐H, Random, 95% CI) | 0.0 [0.0, 0.0] |
| 32 Transfusion provided (ALL) | 0 | 0 | Risk Ratio (M‐H, Random, 95% CI) | 0.0 [0.0, 0.0] |
| 33 Constipation (ALL) Show forest plot | 1 | 188 | Risk Ratio (M‐H, Random, 95% CI) | 0.77 [0.55, 1.07] |
| 34 Nausea (ALL) | 0 | 0 | Risk Ratio (M‐H, Random, 95% CI) | 0.0 [0.0, 0.0] |
| 35 Heartburn (ALL) Show forest plot | 1 | 188 | Risk Ratio (M‐H, Random, 95% CI) | 1.49 [0.95, 2.34] |
| 36 Vomiting (ALL) Show forest plot | 1 | 188 | Risk Ratio (M‐H, Random, 95% CI) | 1.13 [0.58, 2.20] |
| 37 Diarrhoea (ALL) Show forest plot | 1 | 188 | Risk Ratio (M‐H, Random, 95% CI) | 0.53 [0.29, 0.96] |
| 38 Maternal wellbeing/satisfaction (ALL) | 0 | 0 | Risk Ratio (M‐H, Random, 95% CI) | 0.0 [0.0, 0.0] |
| 39 Placental abruption (ALL) Show forest plot | 1 | 782 | Risk Ratio (M‐H, Random, 95% CI) | 1.81 [0.46, 7.20] |
| 40 Premature rupture of membranes (ALL) Show forest plot | 1 | 782 | Risk Ratio (M‐H, Random, 95% CI) | 0.79 [0.44, 1.41] |
| 41 Pre‐eclampsia (ALL) Show forest plot | 1 | 782 | Risk Ratio (M‐H, Random, 95% CI) | 1.45 [0.67, 3.16] |