Daily oral iron supplementation during pregnancy
Information
- DOI:
- https://doi.org/10.1002/14651858.CD004736.pub5Copy DOI

- Database:
-
- Cochrane Database of Systematic Reviews
- Version published:
-
- 22 July 2015see what's new
- Type:
-
- Intervention
- Stage:
-
- Review
- Cochrane Editorial Group:
-
Cochrane Pregnancy and Childbirth Group
- Copyright:
-
- Copyright © 2015 The Cochrane Collaboration. Published by John Wiley & Sons, Ltd.
Article metrics
Altmetric:
Cited by:
Authors
Contributions of authors
Juan Pablo Peña‐Rosas wrote the initial protocol and first two versions of the review. Juan Pablo Peña‐Rosas abstracted the trial data and carried out the analysis. For this update Maria Nieves Garcia‐Casal and Therese Dowswell extracted the data from additional trials in the search, Luz Maria De‐Regil and Therese Dowswell produced the GRADE evidence profiles for the critical outcomes. Therese Dowswell wrote the description of the updated results and all authors contributed to the final preparation of this version.
Sources of support
Internal sources
-
Evidence and Programme Guidance Unit, Department of Nutrition for Health and Development, World Health Organization, Switzerland.
Juan Pablo Peña‐Rosas is a full time staff of the World Health Organization.
-
University of Liverpool, UK.
External sources
-
Evidence and Programme Guidance Unit, Department of Nutrition for Health and Development, World Health Organization, Switzerland.
Dr Maria Nieves Garcia‐Casal worked as a full‐time consultant for WHO during the preparation of this work.
-
NIHR NHS Cochrane Collaboration Programme, UK.
(TD 2012 update) was supported by the NIHR NHS Cochrane Collaboration Programme grant scheme award for NHS‐prioritised centrally‐managed, pregnancy and childbirth systematic reviews: CPGS 10/4001/02
-
The Bill & Melinda Gates Foundation, USA.
The World Health Organization gratefully acknowledges the financial contribution of The Bill &Melinda Gates Foundation towards the development of systematic reviews of the evidence on the effects of nutrition interventions.
Declarations of interest
We certify that we have no affiliations with or involvement in any organisation or entity with a direct financial interest in the subject matter of the review (e.g. employment, consultancy, stock ownership, honoraria, expert testimony).
Juan Pablo Peña‐Rosas was author of an excluded study on iron and folic acid intermittent supplementation.
Luz Maria De‐Regil is full‐time staff member of the Micronutrient Initiative, an International Organization that delivers vitamin interventions to children, women of reproductive age and pregnant women, including iron and folic acid supplementation in eight countries in Africa and South East Asia.
Disclaimer: Juan Pablo Peña‐Rosas is currently a staff member of the World Health Organization. Maria Nieves Garcia‐Casal is a Consultant working for the World Health Organization. The authors alone are responsible for the views expressed in this publication and they do not necessarily represent the decisions, policy or views of the World Health Organization.
Therese Dowswell's institution (the University of Liverpool) has received an NIHR Cochrane Programme Grant and Therese is currently employed on this project. As part of her role, Therese helps volunteer review teams prepare Cochrane reviews. This review is not part of that portfolio of reviews. In the last 36 months Therese has received funding from the WHO to work on other Cochrane reviews. The Funders have no influence on the content or conclusions of the reviews Therese works on.
Acknowledgements
We would like to thank the trial authors who have contributed additional data for this review; and Richard Riley and Simon Gates who provided statistical advice. In addition, we would like to thank the staff at the editorial office of the Cochrane Pregnancy and Childbirth Group in Liverpool for their support in the preparation of this review and, in particular, Professor Zarko Alfirevic.
We would like to thank Fernando Viteri for his contribution to co‐writing the initial protocol and first two versions of the review, for providing technical support and guidance on earlier versions, and for commenting on the current update (2015).
The World Health Organization (WHO) and Juan Pablo Peña‐Rosas, Luz Maria De‐Regil, Maria N Garcia‐Casal, and Therese Dowswell retain copyright and all other rights in their respective contributions to the manuscript of this updated review as submitted for publication.
This project was supported by the National Institute for Health Research, via Cochrane Infrastructure funding to Cochrane Pregnancy and Childbirth. The views and opinions expressed therein are those of the authors and do not necessarily reflect those of the Systematic Reviews Programme, NIHR, NHS or the Department of Health.
Version history
| Published | Title | Stage | Authors | Version |
| 2015 Jul 22 | Daily oral iron supplementation during pregnancy | Review | Juan Pablo Peña‐Rosas, Luz Maria De‐Regil, Maria N Garcia‐Casal, Therese Dowswell | |
| 2012 Dec 12 | Daily oral iron supplementation during pregnancy | Review | Juan Pablo Peña‐Rosas, Luz Maria De‐Regil, Therese Dowswell, Fernando E Viteri | |
| 2009 Oct 07 | Effects and safety of preventive oral iron or iron+folic acid supplementation for women during pregnancy | Review | Juan Pablo Peña‐Rosas, Fernando E Viteri | |
| 2009 Jul 08 | Effects of routine oral iron supplementation with or without folic acid for women during pregnancy | Review | Juan Pablo Peña‐Rosas, Fernando E Viteri | |
| 2004 Apr 19 | Oral iron supplementation with or without folic acid for women during pregnancy | Protocol | Juan P Pena‐Rosas, Fernando Viteri, Kassam Mahomed | |
Differences between protocol and review
This review updates Peña‐Rosas 2012. It includes two new trials and excluded one previously included study as it does not meet the inclusion criteria of this review.
Peña‐Rosas 2012 in turn updated part of Peña‐Rosas 2009 to only evaluate the effects of oral daily iron supplementation regimens. In the Peña‐Rosas 2012 update, we included 60 trials; 40 of these studies were included in the previous version of the review; but 10 had been excluded because they did not report outcomes of interest or the data reported were not extractable. In the Peña‐Rosas 2012 version, we included trials that complied with the eligibility criteria, even if there were no data extractable or did not report the outcomes of interest.
In a previous version of this review, daily and intermittent provision of iron supplements were included. This review, however, only focuses on daily iron supplementation. The effects of intermittent iron supplementation are addressed in a separate review (Peña‐Rosas 2012a).
Outcomes
-
Only pre‐specified primary and secondary outcomes are reported. The non pre‐specified outcomes that were included in previous versions were removed from this updated version and the overall number of haematological outcomes was reduced for clarity.
-
We have added a description of the lay health worker setting for each trial. We have included a timeframe for haematological variables: at or near term (34 weeks or more gestational age) in addition to at term (37 weeks or more of gestational age).
-
We have added the outcome 'congenital anomalies' instead of birth defects as this name reflects adequately a condition existing at birth and often before birth, which involves defects in or damage to a developing fetus.
-
A new search was conducted (2 July 2012) and the comparisons were changed to evaluate the effects of daily tablets containing iron (alone or with any other micronutrients) versus no iron; iron alone; iron and folic acid; as well as the additional effects of iron alone or iron and folic acid when given in addition to other micronutrients in pregnancy.
Methods
This review uses the latest Cochrane methodological guidance (Higgins 2011), particularly on:
-
the use of formal tests for subgroup analyses using random‐effects models;
-
the adjustment of cluster trials;
-
the inclusion of 'Summary of findings' tables to assess the overall quality of the evidence for primary outcomes.
-
For comparisons 1 and 2 we graded the evidence using the GRADE approach and included summary of findings tables; and so for these comparisons we did not carry out sensitivity analysis based on risk of bias as the grade summary provides a better summary of the overall quality of the evidence.
We included three additional subgroup analysis: by type of iron compound, iron compound release, and malaria setting.
Notes
We have again gone through the inclusion criteria for all the trials identified in the search strategy and those included and excluded in previous versions of this review, now in an updated version after its split into two reviews to assess the effects of daily iron supplementation and intermittent iron supplementation for women during pregnancy as a preventive strategy. The study by Hemminki 1991 evaluates selective (providing iron only if participants become anaemic at any point during the study period) versus routine provision of iron supplements (providing iron to all participants independently of their haemoglobin (Hb) or ferritin concentrations). After careful discussions we have decided to exclude this study from this version of the review, as it in fact dealing with treatment of iron‐deficiency anaemia, a topic covered in another review in comparison to preventive provision as here. Participants in the routine group received iron throughout pregnancy regardless of Hb level, starting at the latest in the 17th week of gestation. A dose of 100 mg elemental iron per day was recommended, but this could be tailored according to the midwife's judgment. Participants in the selective group were any pregnant women after the 14th week of gestation showing a hematocrit (HCT) < 0.30 (Hb < 100 g/L) in two consecutive visits. If the Hb was still less than 100 g/L and/or mean cellular volume (MCV) was less than 82, and a low ferritin was found, 50 mg iron twice a day as ferrous sulphate was recommended. The length of the treatment was to be two months or until the HCT was >10.32 or higher (Hb 110 g/L) or higher). By request of the midwives, the treatment schedule was relaxed later during the trial: iron therapy was begun if the mother's HCT was 0.31 or below after the 33rd week. The participants received different doses of iron and also different iron compounds as decided by the health cadre workers following prenatal care. This study cannot be analysed as the same intervention as the studies randomised to receive or not receive the iron supplement or a placebo or no supplementation. We have thus agreed to exclude this study from the review and describe well the reasons for exclusion in the Characteristics of excluded studies.
Keywords
MeSH
Medical Subject Headings (MeSH) Keywords
- Anemia, Iron-Deficiency [*prevention & control];
- Dietary Supplements [*adverse effects];
- Folic Acid [*administration & dosage];
- Infant, Low Birth Weight;
- Iron [*administration & dosage];
- Iron, Dietary [administration & dosage];
- Pregnancy Complications, Hematologic [*prevention & control];
- Pregnancy Outcome;
- Prenatal Care [methods];
- Randomized Controlled Trials as Topic;
Medical Subject Headings Check Words
Female; Humans; Infant, Newborn; Pregnancy;
PICOs


'Risk of bias' graph: review authors' judgements about each risk of bias item presented as percentages across all included studies.

'Risk of bias' summary: review authors' judgements about each risk of bias item for each included study.
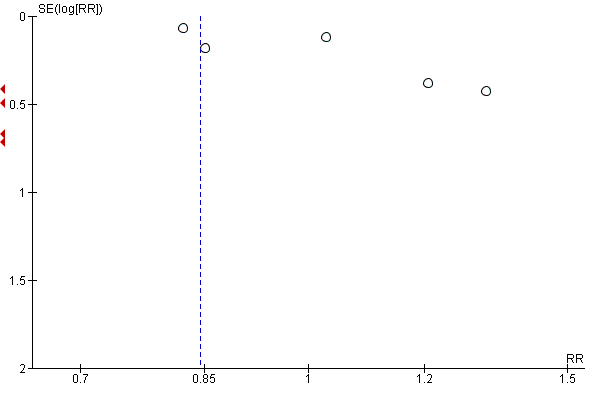
Funnel plot of comparison: 1 Any supplements containing iron versus same supplements without iron or no treatment/placebo (no iron or placebo), outcome: 1.1 Low birthweight (less than 2500 g) (ALL).

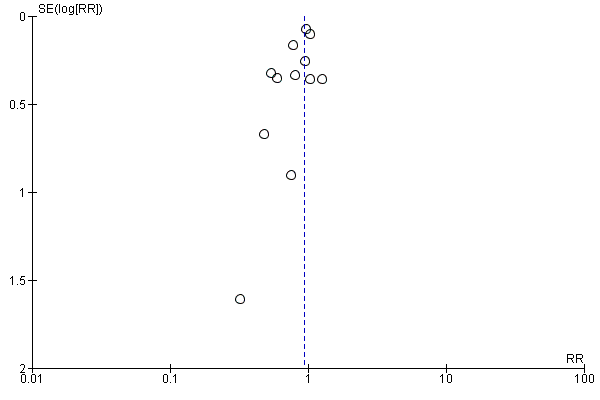
Funnel plot of comparison: 1 Any supplements containing iron versus same supplements without iron or no treatment/placebo (no iron or placebo), outcome: 1.6 Birthweight (g) (ALL).
Funnel plot of comparison: 1 Any supplements containing iron versus same supplements without iron or no treatment/placebo (no iron or placebo), outcome: 1.11 Preterm birth (less than 37 weeks of gestation) (ALL).

Comparison 1 Any supplements containing iron versus same supplements without iron or no treatment/placebo (no iron or placebo), Outcome 1 Low birthweight (less than 2500 g) (ALL).

Comparison 1 Any supplements containing iron versus same supplements without iron or no treatment/placebo (no iron or placebo), Outcome 2 Low birthweight (less than 2500 g): SUBGROUP ANALYSIS by gestational age at the start of supplementation.

Comparison 1 Any supplements containing iron versus same supplements without iron or no treatment/placebo (no iron or placebo), Outcome 3 Low birthweight (less than 2500 g): SUBGROUP ANALYSIS by anaemia status at the start of supplementation.

Comparison 1 Any supplements containing iron versus same supplements without iron or no treatment/placebo (no iron or placebo), Outcome 4 Low birthweight (less than 2500 g): SUBGROUP ANALYSIS by dose of iron.

Comparison 1 Any supplements containing iron versus same supplements without iron or no treatment/placebo (no iron or placebo), Outcome 5 Low birthweight (less than 2500 g): SUBGROUP ANALYSIS by malarial status of setting.

Comparison 1 Any supplements containing iron versus same supplements without iron or no treatment/placebo (no iron or placebo), Outcome 6 Birthweight (g) (ALL).

Comparison 1 Any supplements containing iron versus same supplements without iron or no treatment/placebo (no iron or placebo), Outcome 7 Birthweight (g): SUBGROUP ANALYSIS by gestational age at the start of supplementation.

Comparison 1 Any supplements containing iron versus same supplements without iron or no treatment/placebo (no iron or placebo), Outcome 8 Birthweight (g): SUBGROUP ANALYSIS by anaemia status at the start of supplementation.

Comparison 1 Any supplements containing iron versus same supplements without iron or no treatment/placebo (no iron or placebo), Outcome 9 Birthweight (g): SUBGROUP ANALYSIS by dose of iron.

Comparison 1 Any supplements containing iron versus same supplements without iron or no treatment/placebo (no iron or placebo), Outcome 10 Birthweight (g): SUBGROUP ANALYSIS by malarial status of setting.

Comparison 1 Any supplements containing iron versus same supplements without iron or no treatment/placebo (no iron or placebo), Outcome 11 Preterm birth (less than 37 weeks of gestation) (ALL).

Comparison 1 Any supplements containing iron versus same supplements without iron or no treatment/placebo (no iron or placebo), Outcome 12 Preterm birth (less than 37 weeks of gestation): SUBGROUP ANALYSIS by gestational age at the start of supplementation.

Comparison 1 Any supplements containing iron versus same supplements without iron or no treatment/placebo (no iron or placebo), Outcome 13 Preterm birth (less than 37 weeks of gestation): SUBGROUP ANALYSIS by anaemia status at the start of supplementation.

Comparison 1 Any supplements containing iron versus same supplements without iron or no treatment/placebo (no iron or placebo), Outcome 14 Preterm birth (less than 37 weeks of gestation): SUBGROUP ANALYSIS by dose of iron.

Comparison 1 Any supplements containing iron versus same supplements without iron or no treatment/placebo (no iron or placebo), Outcome 15 Preterm birth (less 37 weeks of gestation): SUBGROUP ANALYSIS by malarial status of setting.

Comparison 1 Any supplements containing iron versus same supplements without iron or no treatment/placebo (no iron or placebo), Outcome 16 Neonatal death (within 28 days after delivery) (ALL).

Comparison 1 Any supplements containing iron versus same supplements without iron or no treatment/placebo (no iron or placebo), Outcome 17 Neonatal death (within 28 days after delivery): SUBGROUP ANALYSIS by gestational age at the start of supplementation.

Comparison 1 Any supplements containing iron versus same supplements without iron or no treatment/placebo (no iron or placebo), Outcome 18 Neonatal death (within 28 days after delivery): SUBGROUP ANALYSIS by anaemia status at the start of supplementation.

Comparison 1 Any supplements containing iron versus same supplements without iron or no treatment/placebo (no iron or placebo), Outcome 19 Neonatal death (within 28 days after delivery): SUBGROUP ANALYSIS by dose of iron.

Comparison 1 Any supplements containing iron versus same supplements without iron or no treatment/placebo (no iron or placebo), Outcome 20 Neonatal death (within 28 days after delivery): SUBGROUP ANALYSIS by malarial status of setting.

Comparison 1 Any supplements containing iron versus same supplements without iron or no treatment/placebo (no iron or placebo), Outcome 21 Congenital anomalies (ALL).

Comparison 1 Any supplements containing iron versus same supplements without iron or no treatment/placebo (no iron or placebo), Outcome 22 Congenital anomalies: SUBGROUP ANALYSIS by gestational age at the start of supplementation).

Comparison 1 Any supplements containing iron versus same supplements without iron or no treatment/placebo (no iron or placebo), Outcome 23 Congenital anomalies: SUBGROUP ANALYSIS by anaemia status at the start of supplementation.

Comparison 1 Any supplements containing iron versus same supplements without iron or no treatment/placebo (no iron or placebo), Outcome 24 Congenital anomalies: SUBGROUP ANALYSIS by dose of iron.

Comparison 1 Any supplements containing iron versus same supplements without iron or no treatment/placebo (no iron or placebo), Outcome 25 Congenital anomalies: SUBGROUP ANALYSIS by malarial status of setting.

Comparison 1 Any supplements containing iron versus same supplements without iron or no treatment/placebo (no iron or placebo), Outcome 26 Maternal anaemia at term (Hb less than 110 g/L at 37 weeks' gestation or more) (ALL).

Comparison 1 Any supplements containing iron versus same supplements without iron or no treatment/placebo (no iron or placebo), Outcome 27 Maternal anaemia at term (Hb less than 110 g/L at 37 weeks' gestation or more): SUBGROUP ANALYSIS by gestational age at the start of supplementation):.

Comparison 1 Any supplements containing iron versus same supplements without iron or no treatment/placebo (no iron or placebo), Outcome 28 Maternal anaemia at term (Hb less than 110 g/L at 37 weeks' gestation or more): SUBGROUP ANALYSIS by anaemia status at the start of supplementation).

Comparison 1 Any supplements containing iron versus same supplements without iron or no treatment/placebo (no iron or placebo), Outcome 29 Maternal anaemia at term (Hb less than 110 g/L at 37 weeks' gestation or more): SUBGROUP ANALYSIS by dose of iron).

Comparison 1 Any supplements containing iron versus same supplements without iron or no treatment/placebo (no iron or placebo), Outcome 30 Maternal anaemia at term (Hb less than 110 g/L at 37 weeks' gestation or more): SUBGROUP ANALYSIS by malarial status of setting).

Comparison 1 Any supplements containing iron versus same supplements without iron or no treatment/placebo (no iron or placebo), Outcome 31 Maternal iron deficiency at term (as defined by as defined by trialists, based on any indicator of iron status at 37 weeks's gestation or more) (ALL).

Comparison 1 Any supplements containing iron versus same supplements without iron or no treatment/placebo (no iron or placebo), Outcome 32 Maternal iron deficiency at term (as defined by as defined by trialists, based on any indicator of iron status at 37 weeks' gestation or more): SUBGROUP ANALYSIS by gestational age at the start of supplementation.

Comparison 1 Any supplements containing iron versus same supplements without iron or no treatment/placebo (no iron or placebo), Outcome 33 Maternal iron deficiency at term (as defined by as defined by trialists, based on any indicator of iron status at 37 weeks' gestation or more): SUBGROUP ANALYSIS by anaemia status at the start of supplementation.

Comparison 1 Any supplements containing iron versus same supplements without iron or no treatment/placebo (no iron or placebo), Outcome 34 Maternal iron deficiency at term (as defined by as defined by trialists, based on any indicator of iron status at 37 weeks' gestation or more): SUBGROUP ANALYSIS by dose of iron.

Comparison 1 Any supplements containing iron versus same supplements without iron or no treatment/placebo (no iron or placebo), Outcome 35 Maternal iron deficiency at term (as defined by trialists, based on any indicator of iron status at 37 weeks' gestation or more): SUBGROUP ANALYSIS by malarial status of setting.

Comparison 1 Any supplements containing iron versus same supplements without iron or no treatment/placebo (no iron or placebo), Outcome 36 Maternal iron‐deficiency anaemia at term (Hb less than 110 g/L and at least one additional laboratory indicators at 37 weeks' gestation or more) (ALL).

Comparison 1 Any supplements containing iron versus same supplements without iron or no treatment/placebo (no iron or placebo), Outcome 37 Maternal iron‐deficiency anaemia at term (Hb less than 110 g/L and at least one additional laboratory indicators at 37 weeks' gestation): SUBGROUP ANALYSIS by gestational age at the start of supplementation.

Comparison 1 Any supplements containing iron versus same supplements without iron or no treatment/placebo (no iron or placebo), Outcome 38 Maternal iron‐deficiency anaemia at term (Hb less than 110 g/L and at least one additional laboratory indicators at 37 weeks' gestation or more): SUBGROUP ANALYSIS by anaemia status at the start of supplementation.

Comparison 1 Any supplements containing iron versus same supplements without iron or no treatment/placebo (no iron or placebo), Outcome 39 Maternal iron‐deficiency anaemia at term (Hb less than 110 g/L and at least one additional laboratory indicators at 37 weeks' gestation or more): SUBGROUP ANALYSIS by dose of iron.

Comparison 1 Any supplements containing iron versus same supplements without iron or no treatment/placebo (no iron or placebo), Outcome 40 Maternal iron‐deficiency anaemia at term (Hb less than 110 g/L and at least one additional laboratory indicators at 37 weeks' gestation or more): SUBGROUP ANALYSIS by malarial status of setting.

Comparison 1 Any supplements containing iron versus same supplements without iron or no treatment/placebo (no iron or placebo), Outcome 41 Maternal death (death while pregnant or within 42 days of termination of pregnancy) (ALL).

Comparison 1 Any supplements containing iron versus same supplements without iron or no treatment/placebo (no iron or placebo), Outcome 42 Side effects (any reported throughout the intervention period) (ALL).

Comparison 1 Any supplements containing iron versus same supplements without iron or no treatment/placebo (no iron or placebo), Outcome 43 Side effects (any reported throughout the intervention period): SUBGROUP ANALYSIS by gestational age at the start of supplementation:.

Comparison 1 Any supplements containing iron versus same supplements without iron or no treatment/placebo (no iron or placebo), Outcome 44 Side effects (any reported throughout the intervention period): SUBGROUP ANALYSIS by anaemia status at the start of supplementation.

Comparison 1 Any supplements containing iron versus same supplements without iron or no treatment/placebo (no iron or placebo), Outcome 45 Side effects (any reported throughout the intervention period): SUBGROUP ANALYSIS by dose of iron.

Comparison 1 Any supplements containing iron versus same supplements without iron or no treatment/placebo (no iron or placebo), Outcome 46 Side effects (any reported throughout the intervention period): SUBGROUP ANALYSIS by malarial status of setting.

Comparison 1 Any supplements containing iron versus same supplements without iron or no treatment/placebo (no iron or placebo), Outcome 47 Maternal severe anaemia at any time during second and third trimester (Hb less than 70 g/L) (ALL).

Comparison 1 Any supplements containing iron versus same supplements without iron or no treatment/placebo (no iron or placebo), Outcome 48 Maternal severe anaemia at any time during second and third trimester (Hb less than 70 g/L): SUBGROUP ANALYSIS by gestational age at the start of supplementation.

Comparison 1 Any supplements containing iron versus same supplements without iron or no treatment/placebo (no iron or placebo), Outcome 49 Maternal severe anaemia at any time during second and third trimester (Hb less than 70 g/L): SUBGROUP ANALYSIS by anaemia status at the start of supplementation.

Comparison 1 Any supplements containing iron versus same supplements without iron or no treatment/placebo (no iron or placebo), Outcome 50 Maternal severe anaemia at any time during second and third trimester (Hb less than 70 g/L): SUBGROUP ANALYSIS by dose of iron.

Comparison 1 Any supplements containing iron versus same supplements without iron or no treatment/placebo (no iron or placebo), Outcome 51 Maternal severe anaemia at any time during second and third trimester (Hb less than 70 g/L): SUBGROUP ANALYSIS by malarial status of setting.

Comparison 1 Any supplements containing iron versus same supplements without iron or no treatment/placebo (no iron or placebo), Outcome 53 Infection during pregnancy (including urinary tract infections) (ALL).

Comparison 1 Any supplements containing iron versus same supplements without iron or no treatment/placebo (no iron or placebo), Outcome 54 Infection during pregnancy (including urinary tract infections): SUBGROUP ANALYSIS by gestational age at the start of supplementation.

Comparison 1 Any supplements containing iron versus same supplements without iron or no treatment/placebo (no iron or placebo), Outcome 55 Infection during pregnancy (including urinary tract infections): SUBGROUP ANALYSIS by anaemia status at the start of supplementation.

Comparison 1 Any supplements containing iron versus same supplements without iron or no treatment/placebo (no iron or placebo), Outcome 56 Infection during pregnancy (including urinary tract infections): SUBGROUP ANALYSIS by dose of iron.

Comparison 1 Any supplements containing iron versus same supplements without iron or no treatment/placebo (no iron or placebo), Outcome 57 Infection during pregnancy (including urinary tract infections): SUBGROUP ANALYSIS by malarial status of setting.

Comparison 1 Any supplements containing iron versus same supplements without iron or no treatment/placebo (no iron or placebo), Outcome 58 Very low birthweight (less than 1500 g) (ALL).

Comparison 1 Any supplements containing iron versus same supplements without iron or no treatment/placebo (no iron or placebo), Outcome 59 Very premature birth (less than 34 weeks' gestation) (ALL).

Comparison 1 Any supplements containing iron versus same supplements without iron or no treatment/placebo (no iron or placebo), Outcome 60 Infant Hb concentration within the first 6 months (in g/L counting the last reported measure after birth within this period) (ALL).

Comparison 1 Any supplements containing iron versus same supplements without iron or no treatment/placebo (no iron or placebo), Outcome 61 Infant serum ferritin concentration within first 6 months (in μg/L counting the last reported measure after birth within this period) (ALL).

Comparison 1 Any supplements containing iron versus same supplements without iron or no treatment/placebo (no iron or placebo), Outcome 62 Admission to special care unit (ALL).

Comparison 1 Any supplements containing iron versus same supplements without iron or no treatment/placebo (no iron or placebo), Outcome 63 Maternal anaemia at or near term (Hb less than 110 g/L at 34 weeks' gestation or more) (ALL).

Comparison 1 Any supplements containing iron versus same supplements without iron or no treatment/placebo (no iron or placebo), Outcome 64 Maternal iron deficiency at or near term (as defined by as defined by trialists, based on any indicator of iron status at 34 weeks's gestation or more)) (ALL).

Comparison 1 Any supplements containing iron versus same supplements without iron or no treatment/placebo (no iron or placebo), Outcome 65 Maternal iron‐deficiency anaemia at or near term (Hb less than 110 g/L and at least one additional laboratory indicators at 34 weeks' gestation or more) (ALL).

Comparison 1 Any supplements containing iron versus same supplements without iron or no treatment/placebo (no iron or placebo), Outcome 66 Maternal Hb concentration at or near term (in g/L, at 34 weeks' gestation or more) (ALL).

Comparison 1 Any supplements containing iron versus same supplements without iron or no treatment/placebo (no iron or placebo), Outcome 67 Maternal Hb concentration within 6 wk postpartum (in g/L) (ALL).

Comparison 1 Any supplements containing iron versus same supplements without iron or no treatment/placebo (no iron or placebo), Outcome 68 Maternal high haemoglobin concentrations during second or third trimester (Hb more than 130 g/L) (ALL).

Comparison 1 Any supplements containing iron versus same supplements without iron or no treatment/placebo (no iron or placebo), Outcome 69 Maternal high haemoglobin concentrations at or near term (Hb more than 130 g/L at 34 weeks' gestation or more) (ALL).

Comparison 1 Any supplements containing iron versus same supplements without iron or no treatment/placebo (no iron or placebo), Outcome 70 Maternal severe anaemia at or near term (Hb less than 70 g/L at 34 weeks' gestation or more) (ALL).

Comparison 1 Any supplements containing iron versus same supplements without iron or no treatment/placebo (no iron or placebo), Outcome 71 Severe anaemia at postpartum (Hb less than 80 g/L) (ALL).

Comparison 1 Any supplements containing iron versus same supplements without iron or no treatment/placebo (no iron or placebo), Outcome 72 Moderate anaemia at postpartum (Hb more than 80 g/L and less than 110 g/L) (ALL).

Comparison 1 Any supplements containing iron versus same supplements without iron or no treatment/placebo (no iron or placebo), Outcome 73 Puerperal infection (ALL).

Comparison 1 Any supplements containing iron versus same supplements without iron or no treatment/placebo (no iron or placebo), Outcome 74 Antepartum haemorrhage (ALL).

Comparison 1 Any supplements containing iron versus same supplements without iron or no treatment/placebo (no iron or placebo), Outcome 75 Postpartum haemorrhage (ALL).

Comparison 1 Any supplements containing iron versus same supplements without iron or no treatment/placebo (no iron or placebo), Outcome 76 Transfusion provided (ALL).

Comparison 1 Any supplements containing iron versus same supplements without iron or no treatment/placebo (no iron or placebo), Outcome 77 Diarrhoea (ALL).

Comparison 1 Any supplements containing iron versus same supplements without iron or no treatment/placebo (no iron or placebo), Outcome 78 Constipation (ALL).

Comparison 1 Any supplements containing iron versus same supplements without iron or no treatment/placebo (no iron or placebo), Outcome 79 Nausea (ALL).

Comparison 1 Any supplements containing iron versus same supplements without iron or no treatment/placebo (no iron or placebo), Outcome 80 Heartburn (ALL).

Comparison 1 Any supplements containing iron versus same supplements without iron or no treatment/placebo (no iron or placebo), Outcome 81 Vomiting (ALL).

Comparison 1 Any supplements containing iron versus same supplements without iron or no treatment/placebo (no iron or placebo), Outcome 82 Maternal wellbeing/satisfaction (ALL).

Comparison 1 Any supplements containing iron versus same supplements without iron or no treatment/placebo (no iron or placebo), Outcome 83 Placental abruption (ALL).

Comparison 1 Any supplements containing iron versus same supplements without iron or no treatment/placebo (no iron or placebo), Outcome 84 Premature rupture of membranes (ALL).

Comparison 1 Any supplements containing iron versus same supplements without iron or no treatment/placebo (no iron or placebo), Outcome 85 Pre‐eclampsia (ALL).

Comparison 2 Any supplements containing iron and folic acid versus same supplements without iron nor folic acid (no iron nor folic acid or placebo), Outcome 1 Low birthweight (less than 2500 g) (ALL).

Comparison 2 Any supplements containing iron and folic acid versus same supplements without iron nor folic acid (no iron nor folic acid or placebo), Outcome 2 Neonatal death (within 28 days after delivery) (ALL).

Comparison 2 Any supplements containing iron and folic acid versus same supplements without iron nor folic acid (no iron nor folic acid or placebo), Outcome 3 Preterm birth (less than 37 weeks of gestation) (ALL).

Comparison 2 Any supplements containing iron and folic acid versus same supplements without iron nor folic acid (no iron nor folic acid or placebo), Outcome 4 Preterm birth (less than 37 weeks of gestation): SUBGROUP ANALYSIS by gestation at the start of supplementation.

Comparison 2 Any supplements containing iron and folic acid versus same supplements without iron nor folic acid (no iron nor folic acid or placebo), Outcome 5 Preterm birth (less than 37 weeks of gestation): SUBGROUP ANALYSIS by anaemia status at the start of supplementation.

Comparison 2 Any supplements containing iron and folic acid versus same supplements without iron nor folic acid (no iron nor folic acid or placebo), Outcome 6 Preterm birth (less than 37 weeks of gestation): SUBGROUP ANALYSIS by dose of iron.

Comparison 2 Any supplements containing iron and folic acid versus same supplements without iron nor folic acid (no iron nor folic acid or placebo), Outcome 7 Preterm birth (less than 37 weeks of gestation): SUBGROUP ANALYSIS by malarial status of settings.

Comparison 2 Any supplements containing iron and folic acid versus same supplements without iron nor folic acid (no iron nor folic acid or placebo), Outcome 8 Birthweight (ALL).

Comparison 2 Any supplements containing iron and folic acid versus same supplements without iron nor folic acid (no iron nor folic acid or placebo), Outcome 9 Neonatal death (within 28 days after delivery): SUBGROUP ANALYSIS by gestation at the start of supplementation.

Comparison 2 Any supplements containing iron and folic acid versus same supplements without iron nor folic acid (no iron nor folic acid or placebo), Outcome 10 Neonatal death (within 28 days after delivery): SUBGROUP ANALYSIS by anaemia status at the start of supplementation.

Comparison 2 Any supplements containing iron and folic acid versus same supplements without iron nor folic acid (no iron nor folic acid or placebo), Outcome 11 Neonatal death (within 28 days after delivery): SUBGROUP ANALYSIS by dose of iron.

Comparison 2 Any supplements containing iron and folic acid versus same supplements without iron nor folic acid (no iron nor folic acid or placebo), Outcome 12 Neonatal death (within 28 days after delivery): SUBGROUP ANALYSIS by malarial status at the start of supplementation.

Comparison 2 Any supplements containing iron and folic acid versus same supplements without iron nor folic acid (no iron nor folic acid or placebo), Outcome 13 Congenital anomalies (ALL).

Comparison 2 Any supplements containing iron and folic acid versus same supplements without iron nor folic acid (no iron nor folic acid or placebo), Outcome 14 Maternal anaemia at term (Hb less than 110 g/L at 37 weeks' gestation or more) (ALL).

Comparison 2 Any supplements containing iron and folic acid versus same supplements without iron nor folic acid (no iron nor folic acid or placebo), Outcome 15 Maternal anaemia at term (Hb less than 110 g/L at 37 weeks' gestation or more): SUBGROUP ANALYSIS by gestation at the start of supplementation.

Comparison 2 Any supplements containing iron and folic acid versus same supplements without iron nor folic acid (no iron nor folic acid or placebo), Outcome 16 Maternal anaemia at term (Hb less than 110 g/L at 37 weeks' gestation or more): SUBGROUP ANALYSIS by anaemia status at the start of supplementation.

Comparison 2 Any supplements containing iron and folic acid versus same supplements without iron nor folic acid (no iron nor folic acid or placebo), Outcome 17 Maternal anaemia at term (Hb less than 110 g/L at 37 weeks' gestation or more): SUBGROUP ANALYSIS by dose of iron.

Comparison 2 Any supplements containing iron and folic acid versus same supplements without iron nor folic acid (no iron nor folic acid or placebo), Outcome 18 Maternal anaemia at term (Hb less than 110 g/L at 37 weeks' gestation or more): SUBGROUP ANALYSIS by malarial status of setting.

Comparison 2 Any supplements containing iron and folic acid versus same supplements without iron nor folic acid (no iron nor folic acid or placebo), Outcome 19 Maternal iron deficiency at term (as defined by trialists, based on any indicator of iron status at 37 weeks' gestation or more) (ALL).

Comparison 2 Any supplements containing iron and folic acid versus same supplements without iron nor folic acid (no iron nor folic acid or placebo), Outcome 20 Maternal iron‐deficiency anaemia at term (Hb less than 110 g/L and at least one additional laboratory indicators at 37 weeks' gestation or more) (ALL).

Comparison 2 Any supplements containing iron and folic acid versus same supplements without iron nor folic acid (no iron nor folic acid or placebo), Outcome 21 Maternal death (death while pregnant or within 42 days of termination of pregnancy) (ALL).

Comparison 2 Any supplements containing iron and folic acid versus same supplements without iron nor folic acid (no iron nor folic acid or placebo), Outcome 22 Side effects (any reported throughout the intervention period) (ALL).

Comparison 2 Any supplements containing iron and folic acid versus same supplements without iron nor folic acid (no iron nor folic acid or placebo), Outcome 23 Maternal severe anaemia at any time during second and third trimester (Hb less than 70 g/L) (ALL).

Comparison 2 Any supplements containing iron and folic acid versus same supplements without iron nor folic acid (no iron nor folic acid or placebo), Outcome 24 Maternal severe anaemia at any time during second and third trimester (Hb less than 70 g/L): SUBGROUP ANALYSIS by gestation at the start of supplementation.

Comparison 2 Any supplements containing iron and folic acid versus same supplements without iron nor folic acid (no iron nor folic acid or placebo), Outcome 25 Maternal severe anaemia at any time during second and third trimester (Hb less than 70 g/L): SUBGROUP ANALYSIS by anaemia status at the start of supplementation.

Comparison 2 Any supplements containing iron and folic acid versus same supplements without iron nor folic acid (no iron nor folic acid or placebo), Outcome 26 Maternal severe anaemia at any time during second and third trimester (Hb less than 70 g/L): SUBGROUP ANALYSIS by dose of iron.

Comparison 2 Any supplements containing iron and folic acid versus same supplements without iron nor folic acid (no iron nor folic acid or placebo), Outcome 27 Maternal severe anaemia at any time during second and third trimester (Hb less than 70 g/L): SUBGROUP ANALYSIS by malarial status of setting.

Comparison 2 Any supplements containing iron and folic acid versus same supplements without iron nor folic acid (no iron nor folic acid or placebo), Outcome 29 Infection during pregnancy (including urinary tract infections) (ALL).

Comparison 2 Any supplements containing iron and folic acid versus same supplements without iron nor folic acid (no iron nor folic acid or placebo), Outcome 30 Very low birthweight (less than 1500 g) (ALL).

Comparison 2 Any supplements containing iron and folic acid versus same supplements without iron nor folic acid (no iron nor folic acid or placebo), Outcome 31 Very premature birth (less than 34 weeks' gestation) (ALL).

Comparison 2 Any supplements containing iron and folic acid versus same supplements without iron nor folic acid (no iron nor folic acid or placebo), Outcome 32 Admission to special care unit (ALL).

Comparison 2 Any supplements containing iron and folic acid versus same supplements without iron nor folic acid (no iron nor folic acid or placebo), Outcome 33 Maternal anaemia at or near term (Hb less than 110 g/L at 34 weeks' gestation or more) (ALL).

Comparison 2 Any supplements containing iron and folic acid versus same supplements without iron nor folic acid (no iron nor folic acid or placebo), Outcome 34 Maternal iron deficiency at or near term (as defined by trialists, based on any indicator of iron status at 34 weeks' gestation or more) (ALL).

Comparison 2 Any supplements containing iron and folic acid versus same supplements without iron nor folic acid (no iron nor folic acid or placebo), Outcome 35 Maternal iron‐deficiency anaemia at or near term (Hb less than 110 g/L and at least one additional laboratory indicators at 34 weeks' gestation or more) (ALL).

Comparison 2 Any supplements containing iron and folic acid versus same supplements without iron nor folic acid (no iron nor folic acid or placebo), Outcome 36 Maternal Hb concentration at or near term (in g/L, at 34 weeks' gestation or more) (ALL).

Comparison 2 Any supplements containing iron and folic acid versus same supplements without iron nor folic acid (no iron nor folic acid or placebo), Outcome 37 Maternal Hb concentration within 6 wk postpartum (in g/L) (ALL).

Comparison 2 Any supplements containing iron and folic acid versus same supplements without iron nor folic acid (no iron nor folic acid or placebo), Outcome 38 Maternal high haemoglobin concentrations during second or third trimester (Hb more than 130 g/L) (ALL).

Comparison 2 Any supplements containing iron and folic acid versus same supplements without iron nor folic acid (no iron nor folic acid or placebo), Outcome 39 Maternal high haemoglobin concentrations at or near term (Hb more than 130 g/L at 34 weeks' gestation or more) (ALL).

Comparison 2 Any supplements containing iron and folic acid versus same supplements without iron nor folic acid (no iron nor folic acid or placebo), Outcome 40 Moderate anaemia at postpartum (Hb more than 80 g/L and less than 110 g/L) (ALL).

Comparison 2 Any supplements containing iron and folic acid versus same supplements without iron nor folic acid (no iron nor folic acid or placebo), Outcome 41 Maternal severe anaemia at or near term (Hb less than 70 g/L at 34 weeks' gestation or more ) (ALL).

Comparison 2 Any supplements containing iron and folic acid versus same supplements without iron nor folic acid (no iron nor folic acid or placebo), Outcome 42 Severe anaemia at postpartum (Hb less than 80 g/L) (ALL).

Comparison 2 Any supplements containing iron and folic acid versus same supplements without iron nor folic acid (no iron nor folic acid or placebo), Outcome 43 Puerperal infection (ALL).

Comparison 2 Any supplements containing iron and folic acid versus same supplements without iron nor folic acid (no iron nor folic acid or placebo), Outcome 44 Antepartum haemorrhage (ALL).

Comparison 2 Any supplements containing iron and folic acid versus same supplements without iron nor folic acid (no iron nor folic acid or placebo), Outcome 46 Placental abruption (ALL).

Comparison 2 Any supplements containing iron and folic acid versus same supplements without iron nor folic acid (no iron nor folic acid or placebo), Outcome 47 Pre‐eclampsia (ALL).

Comparison 3 Supplementation with iron alone versus no treatment/placebo, Outcome 1 Low birthweight (less than 2500 g) (ALL).

Comparison 3 Supplementation with iron alone versus no treatment/placebo, Outcome 2 Low birthweight (less than 2500 g): SUBGROUP ANALYSIS by gestational age at the start of supplementation.

Comparison 3 Supplementation with iron alone versus no treatment/placebo, Outcome 3 Low birthweight (less than 2500 g): SUBGROUP ANALYSIS by anaemia status at the start of supplementation.

Comparison 3 Supplementation with iron alone versus no treatment/placebo, Outcome 4 Low birthweight (less than 2500 g): SUBGROUP ANALYSIS by dose of iron.

Comparison 3 Supplementation with iron alone versus no treatment/placebo, Outcome 5 Low birthweight (less than 2500 g): SUBGROUP ANALYSIS by malarial status of setting.

Comparison 3 Supplementation with iron alone versus no treatment/placebo, Outcome 6 Birthweight (g) (ALL).

Comparison 3 Supplementation with iron alone versus no treatment/placebo, Outcome 7 Birthweight (g): SUBGROUP ANALYSIS by gestational age at the start of supplementation.

Comparison 3 Supplementation with iron alone versus no treatment/placebo, Outcome 8 Birthweight (g): SUBGROUP ANALYSIS by anaemia status at the start of supplementation.

Comparison 3 Supplementation with iron alone versus no treatment/placebo, Outcome 9 Birthweight (g): SUBGROUP ANALYSIS by dose of iron.

Comparison 3 Supplementation with iron alone versus no treatment/placebo, Outcome 10 Birthweight (g): SUBGROUP ANALYSIS by malarial status of setting.

Comparison 3 Supplementation with iron alone versus no treatment/placebo, Outcome 11 Preterm birth (less than 37 weeks of gestation) (ALL).

Comparison 3 Supplementation with iron alone versus no treatment/placebo, Outcome 12 Preterm birth (less 37 weeks of gestation): SUBGROUP ANALYSIS by gestational age at the start of supplementation.

Comparison 3 Supplementation with iron alone versus no treatment/placebo, Outcome 13 Preterm birth (less 37 weeks of gestation): SUBGROUP ANALYSIS by anaemia status at the start of supplementation.

Comparison 3 Supplementation with iron alone versus no treatment/placebo, Outcome 14 Preterm birth (less 37 weeks of gestation): SUBGROUP ANALYSIS by dose of iron.

Comparison 3 Supplementation with iron alone versus no treatment/placebo, Outcome 15 Preterm birth (less 37 weeks of gestation): SUBGROUP ANALYSIS by malarial status of setting.

Comparison 3 Supplementation with iron alone versus no treatment/placebo, Outcome 17 Congenital anomalies (ALL).

Comparison 3 Supplementation with iron alone versus no treatment/placebo, Outcome 18 Maternal anaemia at term (Hb less than 110 g/L at 37 weeks' gestation or more) (ALL).

Comparison 3 Supplementation with iron alone versus no treatment/placebo, Outcome 19 Maternal anaemia at term (Hb less than 110 g/L at 37 weeks' gestation or more): SUBGROUP ANALYSIS by gestational age at the start of supplementation.

Comparison 3 Supplementation with iron alone versus no treatment/placebo, Outcome 20 Maternal anaemia at term (Hb less than 110 g/L at 37 weeks gestation or more): SUBGROUP ANALYSIS by anaemia status at the start of supplementation.

Comparison 3 Supplementation with iron alone versus no treatment/placebo, Outcome 21 Maternal anaemia at term (Hb less than 110 g/L at 37 weeks' gestation or more): SUBGROUP ANALYSIS by dose of iron.

Comparison 3 Supplementation with iron alone versus no treatment/placebo, Outcome 22 Maternal anaemia at term (Hb less than 110 g/L at 37 weeks' gestation or more): SUBGROUP ANALYSIS by malarial status of setting.

Comparison 3 Supplementation with iron alone versus no treatment/placebo, Outcome 23 Maternal iron deficiency at term (as defined by trialists, based on any indicator of iron status at 37 weeks' gestation or more) (ALL).

Comparison 3 Supplementation with iron alone versus no treatment/placebo, Outcome 24 Maternal iron deficiency at term (as defined by trialists, based on any indicator of iron status at 37 weeks' gestation or more): SUBGROUP ANALYSIS by gestational age at the start of supplementation.

Comparison 3 Supplementation with iron alone versus no treatment/placebo, Outcome 25 Maternal iron deficiency at term (as defined by trialists, based on any indicator of iron status at 37 weeks' gestation or more): SUBGROUP ANALYSIS by anaemia status at the start of supplementation.

Comparison 3 Supplementation with iron alone versus no treatment/placebo, Outcome 26 Maternal iron deficiency at term (as defined by trialists, based on any indicator of iron status at 37 weeks' gestation or more): SUBGROUP ANALYSIS by dose of iron.

Comparison 3 Supplementation with iron alone versus no treatment/placebo, Outcome 27 Maternal iron deficiency at term (as defined by trialists, based on any indicator of iron status at 37 weeks' gestation or more): SUBGROUP ANALYSIS by malarial status of setting.

Comparison 3 Supplementation with iron alone versus no treatment/placebo, Outcome 28 Maternal iron‐deficiency anaemia at term (Hb less than 110 g/L and at least one additional laboratory indicators at 37 weeks' gestation or more) (ALL).

Comparison 3 Supplementation with iron alone versus no treatment/placebo, Outcome 29 Maternal iron‐deficiency anaemia at term (Hb less than 110 g/L and at least one additional laboratory indicators at 37 weeks' gestation or more): SUBGROUP ANALYSIS by gestational age at the start of supplementation.

Comparison 3 Supplementation with iron alone versus no treatment/placebo, Outcome 30 Maternal iron‐deficiency anaemia at term (Hb less than 110 g/L and at least one additional laboratory indicators at 37 weeks' gestation or more): SUBGROUP ANALYSIS by anaemia status at the start of supplementation.

Comparison 3 Supplementation with iron alone versus no treatment/placebo, Outcome 31 Maternal iron‐deficiency anaemia at term (Hb less than 110 g/L and at least one additional laboratory indicators at 37 weeks' gestation or more): SUBGROUP ANALYSIS by dose of iron.

Comparison 3 Supplementation with iron alone versus no treatment/placebo, Outcome 32 Maternal iron‐deficiency anaemia at term (Hb less than 110 g/L and at least one additional laboratory indicators at 37 weeks' gestation or more): SUBGROUP ANALYSIS by malarial status of setting.

Comparison 3 Supplementation with iron alone versus no treatment/placebo, Outcome 33 Maternal death (death while pregnant or within 42 days of termination of pregnancy) (ALL).

Comparison 3 Supplementation with iron alone versus no treatment/placebo, Outcome 34 Side effects (any reported throughout the intervention period) (ALL).

Comparison 3 Supplementation with iron alone versus no treatment/placebo, Outcome 35 Side effects (any reported throughout the intervention period): SUBGROUP ANALYSIS by gestational age at the start of supplementation.

Comparison 3 Supplementation with iron alone versus no treatment/placebo, Outcome 36 Side effects (any reported throughout the intervention period): SUBGROUP ANALYSIS by anaemia status at the start of supplementation.

Comparison 3 Supplementation with iron alone versus no treatment/placebo, Outcome 37 Side effects (any reported throughout the intervention period): SUBGROUP ANALYSIS by dose of iron.

Comparison 3 Supplementation with iron alone versus no treatment/placebo, Outcome 38 Side effects (any reported throughout the intervention period): SUBGROUP ANALYSIS by malarial status of setting.

Comparison 3 Supplementation with iron alone versus no treatment/placebo, Outcome 39 Maternal severe anaemia at any time during second and third trimester (Hb less than 70 g/L) (ALL).

Comparison 3 Supplementation with iron alone versus no treatment/placebo, Outcome 40 Maternal severe anaemia at any time during second and third trimester (Hb less than 70 g/L): SUBGROUP ANALYSIS by gestational age at the start of supplementation.

Comparison 3 Supplementation with iron alone versus no treatment/placebo, Outcome 41 Maternal severe anaemia at any time during second and third trimester (Hb less than 70 g/L): SUBGROUP ANALYSIS by anaemia status age at the start of supplementation.

Comparison 3 Supplementation with iron alone versus no treatment/placebo, Outcome 42 Maternal severe anaemia at any time during second and third trimester (Hb less than 70 g/L): SUBGROUP ANALYSIS by dose of iron.

Comparison 3 Supplementation with iron alone versus no treatment/placebo, Outcome 43 Maternal severe anaemia at any time during second and third trimester (Hb less than 70 g/L): SUBGROUP ANALYSIS by malarial status of setting.

Comparison 3 Supplementation with iron alone versus no treatment/placebo, Outcome 46 Very low birthweight (less than 1500 g) (ALL).

Comparison 3 Supplementation with iron alone versus no treatment/placebo, Outcome 47 Very premature birth (less than 34 weeks' gestation) (ALL).

Comparison 3 Supplementation with iron alone versus no treatment/placebo, Outcome 48 Infant Hb concentration in the first 6 months (in g/L, counting the last reported measure after birth within this period) (ALL).

Comparison 3 Supplementation with iron alone versus no treatment/placebo, Outcome 49 Infant serum ferritin concentration in the first 6 months (in μg/L, counting the last reported measure after birth within this period) (ALL).

Comparison 3 Supplementation with iron alone versus no treatment/placebo, Outcome 50 Admission to special care unit (ALL).

Comparison 3 Supplementation with iron alone versus no treatment/placebo, Outcome 51 Maternal anaemia at or near term (Hb less than 110 g/L at 34 weeks' gestation or more) (ALL).

Comparison 3 Supplementation with iron alone versus no treatment/placebo, Outcome 52 Maternal iron deficiency at or near term (as defined by trialists, based on any indicator of iron status at 34 weeks' gestation or more) (ALL).

Comparison 3 Supplementation with iron alone versus no treatment/placebo, Outcome 53 Maternal iron‐deficiency anaemia at or near term (Hb less than 110 g/L and at least one additional laboratory indicators at 34 weeks' gestation or more) (ALL).

Comparison 3 Supplementation with iron alone versus no treatment/placebo, Outcome 54 Maternal Hb concentration at or near term (in g/L, at 34 weeks' gestation or more) (ALL).

Comparison 3 Supplementation with iron alone versus no treatment/placebo, Outcome 55 Maternal Hb concentration within 6 wk postpartum (in g/L) (ALL).

Comparison 3 Supplementation with iron alone versus no treatment/placebo, Outcome 56 Maternal high haemoglobin concentrations during second or third trimester (Hb more than 130 g/L) (ALL).

Comparison 3 Supplementation with iron alone versus no treatment/placebo, Outcome 57 Maternal high haemoglobin concentrations at or near term (Hb more than 130 g/L at 34 weeks' gestation or more) (ALL).

Comparison 3 Supplementation with iron alone versus no treatment/placebo, Outcome 58 Moderate anaemia at postpartum (Hb more than 80 g/L and less than 110 g/L) (ALL).

Comparison 3 Supplementation with iron alone versus no treatment/placebo, Outcome 59 Maternal severe anaemia at or near term (Hb less than 70 g/L at 34 weeks' gestation or more) (ALL).

Comparison 3 Supplementation with iron alone versus no treatment/placebo, Outcome 60 Severe anaemia at postpartum (Hb less than 80 g/L) (ALL).

Comparison 3 Supplementation with iron alone versus no treatment/placebo, Outcome 61 Puerperal infection (ALL).

Comparison 3 Supplementation with iron alone versus no treatment/placebo, Outcome 62 Antepartum haemorrhage (ALL).

Comparison 3 Supplementation with iron alone versus no treatment/placebo, Outcome 63 Postpartum haemorrhage (ALL).

Comparison 3 Supplementation with iron alone versus no treatment/placebo, Outcome 64 Transfusion provided (ALL).

Comparison 3 Supplementation with iron alone versus no treatment/placebo, Outcome 65 Diarrhoea (ALL).

Comparison 3 Supplementation with iron alone versus no treatment/placebo, Outcome 66 Constipation (ALL).

Comparison 3 Supplementation with iron alone versus no treatment/placebo, Outcome 67 Nausea (ALL).

Comparison 3 Supplementation with iron alone versus no treatment/placebo, Outcome 68 Heartburn (ALL).

Comparison 3 Supplementation with iron alone versus no treatment/placebo, Outcome 69 Vomiting (ALL).

Comparison 3 Supplementation with iron alone versus no treatment/placebo, Outcome 70 Maternal wellbeing/satisfaction (ALL).

Comparison 3 Supplementation with iron alone versus no treatment/placebo, Outcome 71 Placental abruption (ALL).

Comparison 3 Supplementation with iron alone versus no treatment/placebo, Outcome 72 Premature rupture of membranes (ALL).

Comparison 3 Supplementation with iron alone versus no treatment/placebo, Outcome 73 Pre‐eclampsia (ALL).

Comparison 4 Supplementation with iron+folic acid versus no treatment/placebo, Outcome 1 Low birthweight (less than 2500 g) (ALL).

Comparison 4 Supplementation with iron+folic acid versus no treatment/placebo, Outcome 2 Birthweight (ALL).

Comparison 4 Supplementation with iron+folic acid versus no treatment/placebo, Outcome 3 Preterm birth (less than 37 weeks of gestation) (ALL).

Comparison 4 Supplementation with iron+folic acid versus no treatment/placebo, Outcome 4 Preterm birth (less than 37 weeks of gestation): SUBGROUP ANALYSIS by gestational age at the start of supplementation.

Comparison 4 Supplementation with iron+folic acid versus no treatment/placebo, Outcome 5 Preterm birth (less than 37 weeks of gestation): SUBGROUP ANALYSIS by anaemia status at the start of supplementation.

Comparison 4 Supplementation with iron+folic acid versus no treatment/placebo, Outcome 6 Preterm birth (less than 37 weeks of gestation): SUBGROUP ANALYSIS by dose of iron.

Comparison 4 Supplementation with iron+folic acid versus no treatment/placebo, Outcome 7 Preterm birth (less than 37 weeks of gestation): SUBGROUP ANALYSIS by malarial status of setting.

Comparison 4 Supplementation with iron+folic acid versus no treatment/placebo, Outcome 8 Neonatal death (within 28 days after delivery) (ALL).

Comparison 4 Supplementation with iron+folic acid versus no treatment/placebo, Outcome 9 Neonatal death (within 28 days after delivery): SUBGROUP ANALYSIS by gestational age at start of supplementation.

Comparison 4 Supplementation with iron+folic acid versus no treatment/placebo, Outcome 10 Neonatal death (within 28 days after delivery): SUBGROUP ANALYSIS by anaemia status at start of supplementation.

Comparison 4 Supplementation with iron+folic acid versus no treatment/placebo, Outcome 11 Neonatal death (within 28 days after delivery): SUBGROUP ANALYSIS by dose of iron.

Comparison 4 Supplementation with iron+folic acid versus no treatment/placebo, Outcome 12 Neonatal death (within 28 days after delivery): SUBGROUP ANALYSIS by malarial status of setting.

Comparison 4 Supplementation with iron+folic acid versus no treatment/placebo, Outcome 13 Congenital anomalies (ALL).

Comparison 4 Supplementation with iron+folic acid versus no treatment/placebo, Outcome 14 Maternal anaemia at term (Hb less than 110 g/L at 37 weeks' gestation or more) (ALL).

Comparison 4 Supplementation with iron+folic acid versus no treatment/placebo, Outcome 15 Maternal anaemia at term (Hb less than 110 g/L at 37 weeks' gestation or more): SUBGROUP ANALYSIS by gestational age at the start of supplementation.

Comparison 4 Supplementation with iron+folic acid versus no treatment/placebo, Outcome 16 Maternal anaemia at term (Hb less than 110 g/L at 37 weeks' gestation or more): SUBGROUP ANALYSIS by anaemia status at the start of supplementation.

Comparison 4 Supplementation with iron+folic acid versus no treatment/placebo, Outcome 17 Maternal anaemia at term (Hb less than 110 g/Lat 37 weeks' gestation or more): SUBGROUP ANALYSIS by dose of iron.

Comparison 4 Supplementation with iron+folic acid versus no treatment/placebo, Outcome 18 Maternal anaemia at term (Hb less than 110 g/L at 37 weeks' gestation or more): SUBGROUP ANALYSIS by malarial status of setting.

Comparison 4 Supplementation with iron+folic acid versus no treatment/placebo, Outcome 19 Maternal iron deficiency at term (as defined by trialists, based on any indicator of iron status at 37 weeks' gestation or more) (ALL).

Comparison 4 Supplementation with iron+folic acid versus no treatment/placebo, Outcome 20 Maternal iron‐deficiency anaemia at term (Hb less than 110 g/L and at least one additional laboratory indicators at 37 weeks' gestation or more) (ALL).

Comparison 4 Supplementation with iron+folic acid versus no treatment/placebo, Outcome 21 Maternal death (death while pregnant or within 42 days of termination of pregnancy) (ALL).

Comparison 4 Supplementation with iron+folic acid versus no treatment/placebo, Outcome 22 Side effects (any reported throughout the intervention period) (ALL).

Comparison 4 Supplementation with iron+folic acid versus no treatment/placebo, Outcome 23 Maternal severe anaemia at any time during second and third trimester (Hb less than 70 g/L) (ALL).

Comparison 4 Supplementation with iron+folic acid versus no treatment/placebo, Outcome 25 Infection during pregnancy (including urinary tract infections) (ALL).

Comparison 4 Supplementation with iron+folic acid versus no treatment/placebo, Outcome 26 Very low birthweight (less than 1500 g) (ALL).

Comparison 4 Supplementation with iron+folic acid versus no treatment/placebo, Outcome 27 Very premature birth (less than 34 weeks' gestation) (ALL).

Comparison 4 Supplementation with iron+folic acid versus no treatment/placebo, Outcome 30 Admission to special care unit (ALL).

Comparison 4 Supplementation with iron+folic acid versus no treatment/placebo, Outcome 31 Maternal anaemia at or near term (Hb less than 110 g/L at 34 weeks' gestation or more) (ALL).

Comparison 4 Supplementation with iron+folic acid versus no treatment/placebo, Outcome 32 Maternal iron deficiency at or near term (as defined by trialists, based on any indicator of iron status at 34 weeks' gestation or more) (ALL).

Comparison 4 Supplementation with iron+folic acid versus no treatment/placebo, Outcome 33 Maternal iron‐deficiency anaemia at or near term (Hb less than 110 g/L and at least one additional laboratory indicators at 34 weeks' gestation or more) (ALL).

Comparison 4 Supplementation with iron+folic acid versus no treatment/placebo, Outcome 34 Maternal Hb concentration at term or near term (in g/L, at 34 weeks' gestation or more) (ALL).

Comparison 4 Supplementation with iron+folic acid versus no treatment/placebo, Outcome 35 Maternal Hb concentration within 6 wk postpartum (g/L) (ALL).

Comparison 4 Supplementation with iron+folic acid versus no treatment/placebo, Outcome 36 Maternal high haemoglobin concentrations during second or third trimester (Hb more than 130 g/L) (ALL).

Comparison 4 Supplementation with iron+folic acid versus no treatment/placebo, Outcome 37 Maternal high haemoglobin concentrations at or near term (Hb more than 130 g/L at 34 weeks' gestation or more) (ALL).

Comparison 4 Supplementation with iron+folic acid versus no treatment/placebo, Outcome 38 Moderate anaemia at postpartum (Hb more than 80 g/L and less than 110 g/L) (ALL).

Comparison 4 Supplementation with iron+folic acid versus no treatment/placebo, Outcome 39 Maternal severe anaemia at term or near (Hb less than 70 g/L at 34 weeks' gestation or more) (ALL).

Comparison 4 Supplementation with iron+folic acid versus no treatment/placebo, Outcome 40 Severe anaemia at postpartum (Hb less than 80 g/L) (ALL).

Comparison 4 Supplementation with iron+folic acid versus no treatment/placebo, Outcome 41 Puerperal infection (ALL).

Comparison 4 Supplementation with iron+folic acid versus no treatment/placebo, Outcome 42 Antepartum haemorrhage (ALL).

Comparison 4 Supplementation with iron+folic acid versus no treatment/placebo, Outcome 44 Placental abruption (ALL).

Comparison 4 Supplementation with iron+folic acid versus no treatment/placebo, Outcome 45 Pre‐eclampsia (ALL).

Comparison 5 Supplementation with iron+folic acid versus folic acid alone (without iron) supplementation, Outcome 1 Low birthweight (less than 2500 g) (ALL).

Comparison 5 Supplementation with iron+folic acid versus folic acid alone (without iron) supplementation, Outcome 2 Low birthweight (less than 2500 g): SUBGROUP ANALYSIS by gestational age at the start of supplementation.

Comparison 5 Supplementation with iron+folic acid versus folic acid alone (without iron) supplementation, Outcome 3 Low birthweight (less than 2500 g): SUBGROUP ANALYSIS by anaemia status at the start of supplementation.

Comparison 5 Supplementation with iron+folic acid versus folic acid alone (without iron) supplementation, Outcome 4 Low birthweight (less than 2500 g): SUBGROUP ANALYSIS by dose of iron.

Comparison 5 Supplementation with iron+folic acid versus folic acid alone (without iron) supplementation, Outcome 5 Low birthweight (less than 2500 g): SUBGROUP ANALYSIS by malarial status of setting.

Comparison 5 Supplementation with iron+folic acid versus folic acid alone (without iron) supplementation, Outcome 6 Birthweight (g) (ALL).

Comparison 5 Supplementation with iron+folic acid versus folic acid alone (without iron) supplementation, Outcome 7 Birthweight (g): SUBGROUP ANALYSIS by gestational age at the start of supplementation.

Comparison 5 Supplementation with iron+folic acid versus folic acid alone (without iron) supplementation, Outcome 8 Birthweight (g): SUBGROUP ANALYSIS by anaemia status at the start of supplementation.

Comparison 5 Supplementation with iron+folic acid versus folic acid alone (without iron) supplementation, Outcome 9 Birthweight (g): SUBGROUP ANALYSIS by dose of iron.

Comparison 5 Supplementation with iron+folic acid versus folic acid alone (without iron) supplementation, Outcome 10 Birthweight (g): SUBGROUP ANALYSIS by malarial status of setting.

Comparison 5 Supplementation with iron+folic acid versus folic acid alone (without iron) supplementation, Outcome 11 Preterm birth (less than 37 weeks of gestation) (ALL).

Comparison 5 Supplementation with iron+folic acid versus folic acid alone (without iron) supplementation, Outcome 12 Preterm birth (less 37 weeks of gestation): SUBGROUP ANALYSIS by gestational age at the start of supplementation.

Comparison 5 Supplementation with iron+folic acid versus folic acid alone (without iron) supplementation, Outcome 13 Preterm birth (less 37 weeks of gestation): SUBGROUP ANALYSIS by anaemia status at the start of supplementation.

Comparison 5 Supplementation with iron+folic acid versus folic acid alone (without iron) supplementation, Outcome 14 Preterm birth (less 37 weeks of gestation): SUBGROUP ANALYSIS by dose of iron.

Comparison 5 Supplementation with iron+folic acid versus folic acid alone (without iron) supplementation, Outcome 15 Preterm birth (less 37 weeks of gestation): SUBGROUP ANALYSIS by malarial status of setting.

Comparison 5 Supplementation with iron+folic acid versus folic acid alone (without iron) supplementation, Outcome 16 Neonatal death (within 28 days after delivery) (ALL).

Comparison 5 Supplementation with iron+folic acid versus folic acid alone (without iron) supplementation, Outcome 17 Neonatal death (within 28 days after delivery): SUBGROUP ANALYSIS by gestational age at the start of supplementation.

Comparison 5 Supplementation with iron+folic acid versus folic acid alone (without iron) supplementation, Outcome 18 Neonatal death (within 28 days after delivery) : SUBGROUP ANALYSIS by anaemia status at the start of supplementation.

Comparison 5 Supplementation with iron+folic acid versus folic acid alone (without iron) supplementation, Outcome 19 Neonatal death (within 28 days after delivery): SUBGROUP ANALYSIS by dose of iron.

Comparison 5 Supplementation with iron+folic acid versus folic acid alone (without iron) supplementation, Outcome 20 Neonatal death (within 28 days after delivery): SUBGROUP ANALYSIS by malarial status of setting.

Comparison 5 Supplementation with iron+folic acid versus folic acid alone (without iron) supplementation, Outcome 21 Congenital anomalies (ALL).

Comparison 5 Supplementation with iron+folic acid versus folic acid alone (without iron) supplementation, Outcome 22 Maternal anaemia at term (Hb less than 110 g/L at 37 weeks' gestation or more) (ALL).

Comparison 5 Supplementation with iron+folic acid versus folic acid alone (without iron) supplementation, Outcome 23 Maternal anaemia at term (Hb less than 110 g/L at 37 weeks' gestation or more): SUBGROUP ANALYSIS by gestational age at the start of supplementation.

Comparison 5 Supplementation with iron+folic acid versus folic acid alone (without iron) supplementation, Outcome 24 Maternal anaemia at term (Hb less than 110 g/L at 37 weeks' gestation or more): SUBGROUP ANALYSIS by anaemia status at the start of supplementation.

Comparison 5 Supplementation with iron+folic acid versus folic acid alone (without iron) supplementation, Outcome 25 Maternal anaemia at term (Hb less than 110 g/L at 37 weeks' gestation or more ): SUBGROUP ANALYSIS by dose of iron.

Comparison 5 Supplementation with iron+folic acid versus folic acid alone (without iron) supplementation, Outcome 26 Maternal anaemia at term (Hb less than 110 g/L at 37 weeks' gestation or more ): SUBGROUP ANALYSIS by malarial status of setting.

Comparison 5 Supplementation with iron+folic acid versus folic acid alone (without iron) supplementation, Outcome 28 Maternal iron‐deficiency anaemia at term (Hb less than 110 g/L and at least one additional laboratory indicators at 37 weeks' gestation or more) (ALL).

Comparison 5 Supplementation with iron+folic acid versus folic acid alone (without iron) supplementation, Outcome 30 Side effects (any reported throughout the intervention period) (ALL).

Comparison 5 Supplementation with iron+folic acid versus folic acid alone (without iron) supplementation, Outcome 31 Maternal severe anaemia at any time during second and third trimester (Hb less than 70 g/L) (ALL).

Comparison 5 Supplementation with iron+folic acid versus folic acid alone (without iron) supplementation, Outcome 33 Infection during pregnancy (including urinary tract infections) (ALL).

Comparison 5 Supplementation with iron+folic acid versus folic acid alone (without iron) supplementation, Outcome 34 Very low birthweight (less than 1500 g) (ALL).

Comparison 5 Supplementation with iron+folic acid versus folic acid alone (without iron) supplementation, Outcome 35 Very premature birth (less than 34 weeks' gestation) (ALL).

Comparison 5 Supplementation with iron+folic acid versus folic acid alone (without iron) supplementation, Outcome 39 Maternal anaemia at or near term (Hb less than 110 g/L at 34 weeks' gestation or more) (ALL).

Comparison 5 Supplementation with iron+folic acid versus folic acid alone (without iron) supplementation, Outcome 41 Maternal iron‐deficiency anaemia at or near term (Hb less than 110 g/L and at least one additional laboratory indicators at 34 weeks' gestation or more) (ALL).

Comparison 5 Supplementation with iron+folic acid versus folic acid alone (without iron) supplementation, Outcome 42 Maternal Hb concentration at or near term (in g/L at 34 weeks' gestation or more) (ALL).

Comparison 5 Supplementation with iron+folic acid versus folic acid alone (without iron) supplementation, Outcome 43 Maternal Hb concentration within 6 wk postpartum (in g/L) (ALL).

Comparison 5 Supplementation with iron+folic acid versus folic acid alone (without iron) supplementation, Outcome 44 Maternal high haemoglobin concentrations during second or third trimester (Hb more than 130 g/L) (ALL).

Comparison 5 Supplementation with iron+folic acid versus folic acid alone (without iron) supplementation, Outcome 45 Maternal high haemoglobin concentrations at or near term (Hb more than 130 g/L at 34 weeks' gestation or more) (ALL).

Comparison 5 Supplementation with iron+folic acid versus folic acid alone (without iron) supplementation, Outcome 46 Moderate anaemia at postpartum (Hb more than 80 g/L and less than 110 g/L) (ALL).

Comparison 5 Supplementation with iron+folic acid versus folic acid alone (without iron) supplementation, Outcome 47 Maternal severe anaemia at or near term (Hb less than 70 g/L at 34 weeks' gestation or more) (ALL).

Comparison 5 Supplementation with iron+folic acid versus folic acid alone (without iron) supplementation, Outcome 48 Severe anaemia at postpartum (Hb less than 80 g/L) (ALL).

Comparison 5 Supplementation with iron+folic acid versus folic acid alone (without iron) supplementation, Outcome 49 Puerperal infection (ALL).

Comparison 5 Supplementation with iron+folic acid versus folic acid alone (without iron) supplementation, Outcome 50 Antepartum haemorrhage (ALL).

Comparison 5 Supplementation with iron+folic acid versus folic acid alone (without iron) supplementation, Outcome 51 Postpartum haemorrhage (ALL).

Comparison 5 Supplementation with iron+folic acid versus folic acid alone (without iron) supplementation, Outcome 52 Transfusion provided (ALL).

Comparison 5 Supplementation with iron+folic acid versus folic acid alone (without iron) supplementation, Outcome 53 Diarrhoea (ALL).

Comparison 5 Supplementation with iron+folic acid versus folic acid alone (without iron) supplementation, Outcome 54 Constipation (ALL).

Comparison 5 Supplementation with iron+folic acid versus folic acid alone (without iron) supplementation, Outcome 55 Nausea (ALL).

Comparison 5 Supplementation with iron+folic acid versus folic acid alone (without iron) supplementation, Outcome 56 Heartburn (ALL).

Comparison 5 Supplementation with iron+folic acid versus folic acid alone (without iron) supplementation, Outcome 59 Placental abruption (ALL).

Comparison 5 Supplementation with iron+folic acid versus folic acid alone (without iron) supplementation, Outcome 60 Premature rupture of membranes (ALL).

Comparison 5 Supplementation with iron+folic acid versus folic acid alone (without iron) supplementation, Outcome 61 Pre‐eclampsia (ALL).

Comparison 6 Supplementation with iron+other vitamins and minerals supplementation versus same other vitamins and minerals (without iron) supplementation, Outcome 1 Low birthweight (less than 2500 g) (ALL).

Comparison 6 Supplementation with iron+other vitamins and minerals supplementation versus same other vitamins and minerals (without iron) supplementation, Outcome 2 Birthweight (g) (ALL).

Comparison 6 Supplementation with iron+other vitamins and minerals supplementation versus same other vitamins and minerals (without iron) supplementation, Outcome 3 Preterm birth (less than 37 weeks of gestation) (ALL).

Comparison 6 Supplementation with iron+other vitamins and minerals supplementation versus same other vitamins and minerals (without iron) supplementation, Outcome 10 Side effects (any reported throughout the intervention period) (ALL).

Comparison 6 Supplementation with iron+other vitamins and minerals supplementation versus same other vitamins and minerals (without iron) supplementation, Outcome 22 Maternal Hb concentration at or near term (in g/L at 34 weeks' gestation or more) (ALL).

Comparison 6 Supplementation with iron+other vitamins and minerals supplementation versus same other vitamins and minerals (without iron) supplementation, Outcome 23 Maternal Hb concentration within 6 wk postpartum (in g/L) (ALL).

Comparison 6 Supplementation with iron+other vitamins and minerals supplementation versus same other vitamins and minerals (without iron) supplementation, Outcome 33 Constipation (ALL).

Comparison 6 Supplementation with iron+other vitamins and minerals supplementation versus same other vitamins and minerals (without iron) supplementation, Outcome 35 Heartburn (ALL).

Comparison 6 Supplementation with iron+other vitamins and minerals supplementation versus same other vitamins and minerals (without iron) supplementation, Outcome 36 Vomiting (ALL).

Comparison 6 Supplementation with iron+other vitamins and minerals supplementation versus same other vitamins and minerals (without iron) supplementation, Outcome 37 Diarrhoea (ALL).

Comparison 6 Supplementation with iron+other vitamins and minerals supplementation versus same other vitamins and minerals (without iron) supplementation, Outcome 39 Placental abruption (ALL).

Comparison 6 Supplementation with iron+other vitamins and minerals supplementation versus same other vitamins and minerals (without iron) supplementation, Outcome 40 Premature rupture of membranes (ALL).

Comparison 6 Supplementation with iron+other vitamins and minerals supplementation versus same other vitamins and minerals (without iron) supplementation, Outcome 41 Pre‐eclampsia (ALL).
| (Infant outcomes) Any supplements containing iron compared with same supplements without iron or no treatment/placebo (no iron or placebo) | ||||
| Patient or population: Pregnant women of any gestational age and parity Setting: Hospital or community‐based antenatal clinics | ||||
| Outcomes | Relative effect | No of Participants | Quality of the evidence | Comments |
| Low birthweight (less than 2500 g) (ALL) | RR 0.84 | 17,613 | ⊕⊕⊝⊝ | |
| Birthweight (g) (ALL) | The mean birthweight (g) (ALL) in the intervention group was 23.75 higher (3.02 lower to 50.51 higher) | 18,590 | ⊕⊕⊕⊝ | |
| Preterm birth (less than 37 weeks of gestation) (ALL) | RR 0.93 | 19,286 | ⊕⊕⊕⊝ | |
| Neonatal death (within 28 days after delivery) (ALL) | RR 0.91 | 16,603 | ⊕⊕⊝⊝ | |
| Congenital anomalies (ALL) | RR 0.88 | 14,636 | ⊕⊕⊝⊝ | |
| CI: Confidence interval; RR: risk ratio | ||||
| GRADE Working Group grades of evidence | ||||
| 1Several studies contributing data had design limitations 2Wide 95% CI crossing the line of no effect | ||||
| (Maternal outcomes) Any supplements containing iron compared with same supplements without iron or no treatment/placebo (no iron or placebo) | ||||
| Patient or population: Pregnant women of any gestational age and parity | ||||
| Outcomes | Relative effect | No of Participants | Quality of the evidence | Comments |
| Maternal anaemia at term (Hb less than 110 g/L at 37 weeks' gestation or more) (ALL) | RR 0.30 | 2199 | ⊕⊕⊝⊝ | |
| Maternal iron deficiency at term (as defined by as defined by trialists, based on any indicator of iron status at 37 weeks's gestation or more) (ALL) | RR 0.43 | 1256 | ⊕⊕⊝⊝ | |
| Maternal death (death while pregnant or within 42 days of termination of pregnancy) (ALL) | RR 0.33 | 12,560 | ⊕⊝⊝⊝ | |
| Side effects (any reported throughout the intervention period) (ALL) | RR 1.29 | 2423 | ⊕⊝⊝⊝ | |
| Maternal severe anaemia at any time during second and third trimester (Hb less than 70 g/L) (ALL) | RR 0.22 | 2125 | ⊕⊝⊝⊝ | |
| Infection during pregnancy (including urinary tract infections) (ALL) | RR 1.21 | 727 | ⊕⊕⊝⊝ | |
| CI: Confidence interval; RR: risk ratio | ||||
| GRADE Working Group grades of evidence | ||||
| 1Several studies contributing data had design limitations and one had serious design limitations 2High heterogeneity I² > 80% 3Several studies contributing data had design limitations 4One of the studies contributing data had design limitations 5Wide 95% CI crossing the line of no effect. Low event rate 6Wide 95% CI crossing the line of no effect 7High heterogeneity I² = 69% | ||||
| Any supplements containing iron and folic acid compared with same supplements without iron nor folic acid (no iron nor folic acid or placebo) | ||||
| Patient or population: Pregnant women of any gestational age and parity | ||||
| Outcomes | Relative effect | No of Participants | Quality of the evidence | Comments |
| Low birthweight (less than 2500 g) (ALL) | RR 1.07 | 1311 | ⊕⊕⊝⊝ | |
| Birthweight (ALL) | The mean birthweight (ALL) in the intervention group was 57.73 higher (7.66 higher to 107.79 higher) | 1365 | ⊕⊕⊕⊝ | |
| Preterm birth (less than 37 weeks of gestation) (ALL) | RR 1.55 | 1497 | ⊕⊕⊝⊝ | |
| Neonatal death (within 28 days after delivery) (ALL) | RR 0.81 | 1793 | ⊕⊕⊝⊝ | |
| Congenital anomalies (ALL) | RR 0.70 | 1652 | ⊕⊕⊝⊝ | |
| CI: Confidence interval; RR: risk ratio | ||||
| GRADE Working Group grades of evidence | ||||
| 1Both studies contributing data had design limitations 2Wide 95% CI crossing the line of no effect 3All studies contributing data had design limitations 4Study contributing data had design limitations | ||||
| (Maternal outcomes) Any supplements containing iron and folic acid compared with same supplements without iron nor folic acid (no iron nor folic acid or placebo) | ||||
| Patient or population: Pregnant women of any gestational age and parity | ||||
| Outcomes | Relative effect | No of Participants | Quality of the evidence | Comments |
| Maternal anaemia at term (Hb less than 110 g/L at 37 weeks' gestation or more) (ALL) | RR 0.34 | 346 | ⊕⊕⊕⊝ | |
| Maternal iron deficiency at term (as defined by trialists, based on any indicator of iron status at 37 weeks' gestation or more) (ALL) | RR 0.24 | 131 | ⊕⊕⊝⊝ | |
| Maternal death (death while pregnant or within 42 days of termination of pregnancy) (ALL) | not estimable | 131 | ⊕⊕⊝⊝ | |
| Side effects (any reported throughout the intervention period) (ALL) | RR 44.32 | 456 | ⊕⊕⊕⊝ | |
| Maternal severe anaemia at any time during second and third trimester (Hb less than 70 g/L) (ALL) | RR 0.12 | 506 | ⊕⊝⊝⊝ | |
| Infection during pregnancy (including urinary tract infections) (ALL) | RR 1.00 | 48 | ⊕⊝⊝⊝ | |
| CI: Confidence interval; RR: risk ratio | ||||
| GRADE Working Group grades of evidence | ||||
| 1Studies contributing data had design limitations 2Study contributing data had design limitations 3Estimate based on small sample size 4Small sample size and no events 5Wide 95% CI crossing the line of no effect and low event rate 6Wide 95% CI crossing the line of no effect, small sample size and low event rate | ||||
| Outcome or subgroup title | No. of studies | No. of participants | Statistical method | Effect size |
| 1 Low birthweight (less than 2500 g) (ALL) Show forest plot | 11 | 17613 | Risk Ratio (M‐H, Random, 95% CI) | 0.84 [0.69, 1.03] |
| 2 Low birthweight (less than 2500 g): SUBGROUP ANALYSIS by gestational age at the start of supplementation Show forest plot | 11 | 17613 | Risk Ratio (M‐H, Random, 95% CI) | 0.84 [0.69, 1.03] |
| 2.1 Early gestational age (supplementation started before 20 weeks' gestation or prior to pregnancy) | 6 | 14512 | Risk Ratio (M‐H, Random, 95% CI) | 0.79 [0.59, 1.05] |
| 2.2 Late gestational age (supplementation started at 20 weeks of gestation or later) | 3 | 665 | Risk Ratio (M‐H, Random, 95% CI) | 1.05 [0.50, 2.19] |
| 2.3 Unspecified or mixed gestational age at the start of supplementation | 2 | 2436 | Risk Ratio (M‐H, Random, 95% CI) | 0.87 [0.61, 1.24] |
| 3 Low birthweight (less than 2500 g): SUBGROUP ANALYSIS by anaemia status at the start of supplementation Show forest plot | 11 | 17613 | Risk Ratio (M‐H, Random, 95% CI) | 0.84 [0.69, 1.03] |
| 3.1 Anaemic at start of supplementation | 0 | 0 | Risk Ratio (M‐H, Random, 95% CI) | 0.0 [0.0, 0.0] |
| 3.2 Non‐anaemic at the start of supplementation | 8 | 13843 | Risk Ratio (M‐H, Random, 95% CI) | 0.79 [0.51, 1.22] |
| 3.3 Unspecified or mixed anaemia status | 3 | 3770 | Risk Ratio (M‐H, Random, 95% CI) | 0.82 [0.72, 0.94] |
| 4 Low birthweight (less than 2500 g): SUBGROUP ANALYSIS by dose of iron Show forest plot | 11 | 17613 | Risk Ratio (M‐H, Random, 95% CI) | 0.84 [0.69, 1.03] |
| 4.1 Low daily dose of iron (30 mg or less of elemental iron) | 5 | 12858 | Risk Ratio (M‐H, Random, 95% CI) | 0.70 [0.38, 1.32] |
| 4.2 Medium daily dose of iron (more than 30 mg and less than 60 mg elemental iron) | 1 | 727 | Risk Ratio (M‐H, Random, 95% CI) | 1.21 [0.57, 2.54] |
| 4.3 Higher daily dose of iron (60 mg elemental iron or more) | 5 | 4028 | Risk Ratio (M‐H, Random, 95% CI) | 0.82 [0.72, 0.94] |
| 5 Low birthweight (less than 2500 g): SUBGROUP ANALYSIS by malarial status of setting Show forest plot | 11 | 17613 | Risk Ratio (M‐H, Random, 95% CI) | 0.84 [0.69, 1.03] |
| 5.1 Malarial setting | 5 | 4645 | Risk Ratio (M‐H, Random, 95% CI) | 0.83 [0.73, 0.94] |
| 5.2 Non‐malarial setting | 6 | 12968 | Risk Ratio (M‐H, Random, 95% CI) | 0.74 [0.42, 1.33] |
| 6 Birthweight (g) (ALL) Show forest plot | 15 | 18590 | Mean Difference (IV, Random, 95% CI) | 23.75 [‐3.02, 50.51] |
| 7 Birthweight (g): SUBGROUP ANALYSIS by gestational age at the start of supplementation Show forest plot | 15 | 18590 | Mean Difference (IV, Random, 95% CI) | 23.75 [‐3.02, 50.51] |
| 7.1 Early gestational age (supplementation started before 20 weeks' gestation or prior to pregnancy) | 11 | 15583 | Mean Difference (IV, Random, 95% CI) | 28.55 [‐9.85, 66.95] |
| 7.2 Late gestational age (supplementation started at 20 weeks of gestation or later) | 3 | 681 | Mean Difference (IV, Random, 95% CI) | ‐0.19 [‐77.46, 77.08] |
| 7.3 Unspecified or mixed gestational age at the start of supplementation | 1 | 2326 | Mean Difference (IV, Random, 95% CI) | 20.20 [‐15.13, 55.53] |
| 8 Birthweight (g): SUBGROUP ANALYSIS by anaemia status at the start of supplementation Show forest plot | 15 | 18590 | Mean Difference (IV, Random, 95% CI) | 23.75 [‐3.02, 50.51] |
| 8.1 Anaemic at start of supplementation | 0 | 0 | Mean Difference (IV, Random, 95% CI) | 0.0 [0.0, 0.0] |
| 8.2 Non‐anaemic at the start of supplementation | 11 | 14631 | Mean Difference (IV, Random, 95% CI) | 20.24 [‐20.13, 60.61] |
| 8.3 Unspecified or mixed anaemia status | 4 | 3959 | Mean Difference (IV, Random, 95% CI) | 33.02 [3.65, 62.38] |
| 9 Birthweight (g): SUBGROUP ANALYSIS by dose of iron Show forest plot | 15 | 18590 | Mean Difference (IV, Random, 95% CI) | 23.49 [‐2.55, 49.52] |
| 9.1 Low daily dose (30 mg or less of elemental iron) | 7 | 13729 | Mean Difference (IV, Random, 95% CI) | 33.94 [‐13.42, 81.29] |
| 9.2 Medium daily dose (more than 30 mg and less than 60 mg elemental iron) | 1 | 727 | Mean Difference (IV, Random, 95% CI) | 10.0 [‐51.92, 71.92] |
| 9.3 Higher daily dose (60 mg elemental iron or more) | 8 | 4134 | Mean Difference (IV, Random, 95% CI) | 19.18 [‐26.63, 64.99] |
| 10 Birthweight (g): SUBGROUP ANALYSIS by malarial status of setting Show forest plot | 15 | 18590 | Mean Difference (IV, Random, 95% CI) | 23.75 [‐3.02, 50.51] |
| 10.1 Malarial setting | 6 | 5443 | Mean Difference (IV, Random, 95% CI) | 33.48 [10.58, 56.37] |
| 10.2 Non‐malarial setting | 9 | 13147 | Mean Difference (IV, Random, 95% CI) | 8.06 [‐57.13, 73.25] |
| 11 Preterm birth (less than 37 weeks of gestation) (ALL) Show forest plot | 13 | 19286 | Risk Ratio (M‐H, Random, 95% CI) | 0.93 [0.84, 1.03] |
| 12 Preterm birth (less than 37 weeks of gestation): SUBGROUP ANALYSIS by gestational age at the start of supplementation Show forest plot | 13 | 19286 | Risk Ratio (M‐H, Random, 95% CI) | 0.93 [0.84, 1.03] |
| 12.1 Early gestational age (supplementation started before 20 weeks' gestation or prior to pregnancy) | 10 | 16483 | Risk Ratio (M‐H, Random, 95% CI) | 0.96 [0.86, 1.07] |
| 12.2 Late gestational age (supplementation started at 20 weeks of gestation or later) | 2 | 477 | Risk Ratio (M‐H, Random, 95% CI) | 0.58 [0.29, 1.13] |
| 12.3 Unspecified or mixed`gestational age at the start of supplementation | 1 | 2326 | Risk Ratio (M‐H, Random, 95% CI) | 0.79 [0.57, 1.09] |
| 13 Preterm birth (less than 37 weeks of gestation): SUBGROUP ANALYSIS by anaemia status at the start of supplementation Show forest plot | 13 | 19286 | Risk Ratio (M‐H, Random, 95% CI) | 0.93 [0.84, 1.03] |
| 13.1 Anaemic at start of supplementation | 0 | 0 | Risk Ratio (M‐H, Random, 95% CI) | 0.0 [0.0, 0.0] |
| 13.2 Non‐anaemic at the start of supplementation | 10 | 14837 | Risk Ratio (M‐H, Random, 95% CI) | 0.92 [0.81, 1.04] |
| 13.3 Unspecified/ mixed anaemia status | 3 | 4449 | Risk Ratio (M‐H, Random, 95% CI) | 0.96 [0.81, 1.14] |
| 14 Preterm birth (less than 37 weeks of gestation): SUBGROUP ANALYSIS by dose of iron Show forest plot | 13 | 19286 | Risk Ratio (M‐H, Random, 95% CI) | 0.93 [0.84, 1.03] |
| 14.1 Low daily dose (30 mg or less of elemental iron) | 6 | 13649 | Risk Ratio (M‐H, Random, 95% CI) | 0.89 [0.76, 1.05] |
| 14.2 Medium daily dose (more than 30 mg and less than 60 mg elemental iron) | 1 | 727 | Risk Ratio (M‐H, Random, 95% CI) | 1.26 [0.62, 2.56] |
| 14.3 Higher daily dose (60 mg elemental iron or more) | 6 | 4910 | Risk Ratio (M‐H, Random, 95% CI) | 0.95 [0.81, 1.12] |
| 15 Preterm birth (less 37 weeks of gestation): SUBGROUP ANALYSIS by malarial status of setting Show forest plot | 13 | 19286 | Risk Ratio (M‐H, Random, 95% CI) | 0.93 [0.84, 1.03] |
| 15.1 Malarial setting | 7 | 6406 | Risk Ratio (M‐H, Random, 95% CI) | 0.95 [0.82, 1.11] |
| 15.2 Non‐malarial setting | 6 | 12880 | Risk Ratio (M‐H, Random, 95% CI) | 0.84 [0.65, 1.09] |
| 16 Neonatal death (within 28 days after delivery) (ALL) Show forest plot | 4 | 16603 | Risk Ratio (M‐H, Random, 95% CI) | 0.91 [0.71, 1.18] |
| 17 Neonatal death (within 28 days after delivery): SUBGROUP ANALYSIS by gestational age at the start of supplementation Show forest plot | 4 | 16603 | Risk Ratio (M‐H, Random, 95% CI) | 0.91 [0.71, 1.18] |
| 17.1 Early gestational age (supplementation started before 20 weeks' gestation or prior to pregnancy) | 3 | 14108 | Risk Ratio (M‐H, Random, 95% CI) | 1.00 [0.71, 1.42] |
| 17.2 Late gestational age (supplementation started at 20 weeks of gestation or later) | 0 | 0 | Risk Ratio (M‐H, Random, 95% CI) | 0.0 [0.0, 0.0] |
| 17.3 Unspecified or mixed gestational age at the start of supplementation | 1 | 2495 | Risk Ratio (M‐H, Random, 95% CI) | 0.81 [0.56, 1.19] |
| 18 Neonatal death (within 28 days after delivery): SUBGROUP ANALYSIS by anaemia status at the start of supplementation Show forest plot | 4 | 16603 | Risk Ratio (M‐H, Random, 95% CI) | 0.91 [0.71, 1.18] |
| 18.1 Anaemic at start of supplementation | 0 | 0 | Risk Ratio (M‐H, Random, 95% CI) | 0.0 [0.0, 0.0] |
| 18.2 Non‐anaemic at the start of supplementation | 2 | 12559 | Risk Ratio (M‐H, Random, 95% CI) | 0.94 [0.51, 1.77] |
| 18.3 Unspecified or mixed anaemia status | 2 | 4044 | Risk Ratio (M‐H, Random, 95% CI) | 0.88 [0.65, 1.19] |
| 19 Neonatal death (within 28 days after delivery): SUBGROUP ANALYSIS by dose of iron Show forest plot | 4 | 16603 | Risk Ratio (M‐H, Random, 95% CI) | 0.91 [0.71, 1.18] |
| 19.1 Low daily dose (30 mg or less of elemental iron) | 1 | 11832 | Risk Ratio (M‐H, Random, 95% CI) | 1.10 [0.67, 1.82] |
| 19.2 Medium daily dose (more than 30 mg and less than 60 mg elemental iron) | 1 | 727 | Risk Ratio (M‐H, Random, 95% CI) | 0.48 [0.12, 1.91] |
| 19.3 Higher daily dose (60 mg elemental iron or more) | 2 | 4044 | Risk Ratio (M‐H, Random, 95% CI) | 0.88 [0.65, 1.19] |
| 20 Neonatal death (within 28 days after delivery): SUBGROUP ANALYSIS by malarial status of setting Show forest plot | 4 | 16603 | Risk Ratio (M‐H, Random, 95% CI) | 0.91 [0.71, 1.18] |
| 20.1 Malarial setting | 3 | 4771 | Risk Ratio (M‐H, Random, 95% CI) | 0.85 [0.63, 1.15] |
| 20.2 Non‐malarial setting | 1 | 11832 | Risk Ratio (M‐H, Random, 95% CI) | 1.10 [0.67, 1.82] |
| 21 Congenital anomalies (ALL) Show forest plot | 4 | 14636 | Risk Ratio (M‐H, Random, 95% CI) | 0.88 [0.58, 1.33] |
| 22 Congenital anomalies: SUBGROUP ANALYSIS by gestational age at the start of supplementation) Show forest plot | 4 | 14636 | Risk Ratio (M‐H, Random, 95% CI) | 0.88 [0.58, 1.33] |
| 22.1 Early gestational age (supplementation started before 20 weeks' gestation or prior to pregnancy) | 4 | 14636 | Risk Ratio (M‐H, Random, 95% CI) | 0.88 [0.58, 1.33] |
| 22.2 Late gestational age (supplementation started at 20 weeks of gestation or later) | 0 | 0 | Risk Ratio (M‐H, Random, 95% CI) | 0.0 [0.0, 0.0] |
| 22.3 Unspecified or mixed gestational age at the start of supplementation | 0 | 0 | Risk Ratio (M‐H, Random, 95% CI) | 0.0 [0.0, 0.0] |
| 23 Congenital anomalies: SUBGROUP ANALYSIS by anaemia status at the start of supplementation Show forest plot | 4 | 14636 | Risk Ratio (M‐H, Random, 95% CI) | 0.88 [0.58, 1.33] |
| 23.1 Anaemic at start of supplementation | 0 | 0 | Risk Ratio (M‐H, Random, 95% CI) | 0.0 [0.0, 0.0] |
| 23.2 Non‐anaemic at the start of supplementation | 2 | 12234 | Risk Ratio (M‐H, Random, 95% CI) | 1.00 [0.35, 2.84] |
| 23.3 Unspecified or mixed anaemia status | 2 | 2402 | Risk Ratio (M‐H, Random, 95% CI) | 0.86 [0.55, 1.35] |
| 24 Congenital anomalies: SUBGROUP ANALYSIS by dose of iron Show forest plot | 4 | 14636 | Risk Ratio (M‐H, Random, 95% CI) | 0.88 [0.58, 1.33] |
| 24.1 Low daily dose (30 mg or less of elemental iron) | 1 | 11934 | Risk Ratio (M‐H, Random, 95% CI) | 1.00 [0.35, 2.84] |
| 24.2 Medium daily dose (more than 30 mg and less than 60 mg elemental iron) | 0 | 0 | Risk Ratio (M‐H, Random, 95% CI) | 0.0 [0.0, 0.0] |
| 24.3 Higher daily dose (60 mg elemental iron or more) | 3 | 2702 | Risk Ratio (M‐H, Random, 95% CI) | 0.86 [0.55, 1.35] |
| 25 Congenital anomalies: SUBGROUP ANALYSIS by malarial status of setting Show forest plot | 4 | 14633 | Risk Ratio (M‐H, Random, 95% CI) | 0.88 [0.62, 1.26] |
| 25.1 Malarial setting | 3 | 2699 | Risk Ratio (M‐H, Random, 95% CI) | 0.87 [0.60, 1.26] |
| 25.2 Non‐malarial setting | 1 | 11934 | Risk Ratio (M‐H, Random, 95% CI) | 1.00 [0.35, 2.84] |
| 26 Maternal anaemia at term (Hb less than 110 g/L at 37 weeks' gestation or more) (ALL) Show forest plot | 14 | 2199 | Risk Ratio (M‐H, Random, 95% CI) | 0.30 [0.19, 0.46] |
| 27 Maternal anaemia at term (Hb less than 110 g/L at 37 weeks' gestation or more): SUBGROUP ANALYSIS by gestational age at the start of supplementation): Show forest plot | 14 | 2199 | Risk Ratio (M‐H, Random, 95% CI) | 0.30 [0.19, 0.46] |
| 27.1 Early gestational age (supplementation started before 20 weeks' gestation or prior to pregnancy) | 7 | 749 | Risk Ratio (M‐H, Random, 95% CI) | 0.28 [0.12, 0.70] |
| 27.2 Late gestational age (supplementation started at 20 weeks of gestation or later) | 5 | 1178 | Risk Ratio (M‐H, Random, 95% CI) | 0.36 [0.22, 0.61] |
| 27.3 Unspecified or mixed gestational age | 2 | 272 | Risk Ratio (M‐H, Random, 95% CI) | 0.08 [0.01, 0.59] |
| 28 Maternal anaemia at term (Hb less than 110 g/L at 37 weeks' gestation or more): SUBGROUP ANALYSIS by anaemia status at the start of supplementation) Show forest plot | 14 | 2199 | Risk Ratio (M‐H, Random, 95% CI) | 0.30 [0.19, 0.46] |
| 28.1 Anaemic at start of supplementation | 0 | 0 | Risk Ratio (M‐H, Random, 95% CI) | 0.0 [0.0, 0.0] |
| 28.2 Non‐anaemic at the start of supplementation | 8 | 1295 | Risk Ratio (M‐H, Random, 95% CI) | 0.32 [0.16, 0.64] |
| 28.3 Unspecified or mixed anaemia status | 6 | 904 | Risk Ratio (M‐H, Random, 95% CI) | 0.24 [0.12, 0.49] |
| 29 Maternal anaemia at term (Hb less than 110 g/L at 37 weeks' gestation or more): SUBGROUP ANALYSIS by dose of iron) Show forest plot | 14 | 2199 | Risk Ratio (M‐H, Random, 95% CI) | 0.30 [0.19, 0.46] |
| 29.1 Low daily dose (30 mg or less of elemental iron) | 3 | 590 | Risk Ratio (M‐H, Random, 95% CI) | 0.49 [0.24, 1.03] |
| 29.2 Medium daily dose (more than 30 mg and less than 60 mg elemental iron) | 1 | 69 | Risk Ratio (M‐H, Random, 95% CI) | 0.21 [0.06, 0.73] |
| 29.3 Higher daily dose (60 mg elemental iron or more) | 10 | 1540 | Risk Ratio (M‐H, Random, 95% CI) | 0.25 [0.14, 0.45] |
| 30 Maternal anaemia at term (Hb less than 110 g/L at 37 weeks' gestation or more): SUBGROUP ANALYSIS by malarial status of setting) Show forest plot | 14 | 2199 | Risk Ratio (M‐H, Random, 95% CI) | 0.30 [0.19, 0.46] |
| 30.1 Malarial setting | 3 | 530 | Risk Ratio (M‐H, Random, 95% CI) | 0.61 [0.45, 0.82] |
| 30.2 Non‐malarial setting | 11 | 1669 | Risk Ratio (M‐H, Random, 95% CI) | 0.18 [0.10, 0.34] |
| 31 Maternal iron deficiency at term (as defined by as defined by trialists, based on any indicator of iron status at 37 weeks's gestation or more) (ALL) Show forest plot | 7 | 1256 | Risk Ratio (M‐H, Random, 95% CI) | 0.43 [0.27, 0.66] |
| 32 Maternal iron deficiency at term (as defined by as defined by trialists, based on any indicator of iron status at 37 weeks' gestation or more): SUBGROUP ANALYSIS by gestational age at the start of supplementation Show forest plot | 7 | 1256 | Risk Ratio (M‐H, Random, 95% CI) | 0.43 [0.27, 0.66] |
| 32.1 Early gestational age (supplementation started before 20 weeks' gestation or prior to pregnancy) | 4 | 653 | Risk Ratio (M‐H, Random, 95% CI) | 0.45 [0.22, 0.93] |
| 32.2 Late gestational age (supplementation started at 20 weeks of gestation or later) | 3 | 603 | Risk Ratio (M‐H, Random, 95% CI) | 0.36 [0.18, 0.72] |
| 32.3 Unspecified or mixed gestational age | 0 | 0 | Risk Ratio (M‐H, Random, 95% CI) | 0.0 [0.0, 0.0] |
| 33 Maternal iron deficiency at term (as defined by as defined by trialists, based on any indicator of iron status at 37 weeks' gestation or more): SUBGROUP ANALYSIS by anaemia status at the start of supplementation Show forest plot | 7 | 1256 | Risk Ratio (M‐H, Random, 95% CI) | 0.43 [0.27, 0.66] |
| 33.1 Anaemic at start of supplementation | 0 | 0 | Risk Ratio (M‐H, Random, 95% CI) | 0.0 [0.0, 0.0] |
| 33.2 Non‐anaemic at the start of supplementation | 5 | 1092 | Risk Ratio (M‐H, Random, 95% CI) | 0.56 [0.39, 0.82] |
| 33.3 Unspecified/ mixed anaemia status | 2 | 164 | Risk Ratio (M‐H, Random, 95% CI) | 0.14 [0.07, 0.29] |
| 34 Maternal iron deficiency at term (as defined by as defined by trialists, based on any indicator of iron status at 37 weeks' gestation or more): SUBGROUP ANALYSIS by dose of iron Show forest plot | 7 | 1256 | Risk Ratio (M‐H, Random, 95% CI) | 0.43 [0.27, 0.66] |
| 34.1 Low daily dose (30 mg or less of elemental iron) | 3 | 703 | Risk Ratio (M‐H, Random, 95% CI) | 0.52 [0.34, 0.78] |
| 34.2 Medium daily dose (more than 30 mg and less than 60 mg elemental iron) | 1 | 241 | Risk Ratio (M‐H, Random, 95% CI) | 0.92 [0.73, 1.17] |
| 34.3 Higher daily dose (60 mg elemental iron or more) | 3 | 312 | Risk Ratio (M‐H, Random, 95% CI) | 0.21 [0.10, 0.41] |
| 35 Maternal iron deficiency at term (as defined by trialists, based on any indicator of iron status at 37 weeks' gestation or more): SUBGROUP ANALYSIS by malarial status of setting Show forest plot | 7 | 1256 | Risk Ratio (M‐H, Random, 95% CI) | 0.43 [0.27, 0.66] |
| 35.1 Malarial setting | 2 | 192 | Risk Ratio (M‐H, Random, 95% CI) | 0.28 [0.15, 0.53] |
| 35.2 Non‐malarial setting | 5 | 1064 | Risk Ratio (M‐H, Random, 95% CI) | 0.49 [0.30, 0.78] |
| 36 Maternal iron‐deficiency anaemia at term (Hb less than 110 g/L and at least one additional laboratory indicators at 37 weeks' gestation or more) (ALL) Show forest plot | 6 | 1088 | Risk Ratio (M‐H, Random, 95% CI) | 0.33 [0.16, 0.69] |
| 37 Maternal iron‐deficiency anaemia at term (Hb less than 110 g/L and at least one additional laboratory indicators at 37 weeks' gestation): SUBGROUP ANALYSIS by gestational age at the start of supplementation Show forest plot | 6 | 1088 | Risk Ratio (M‐H, Random, 95% CI) | 0.33 [0.16, 0.69] |
| 37.1 Early gestational age (supplementation started before 20 weeks' gestation or prior to pregnancy) | 4 | 660 | Risk Ratio (M‐H, Random, 95% CI) | 0.39 [0.13, 1.11] |
| 37.2 Late gestational age (supplementation started at 20 weeks of gestation or later) | 2 | 428 | Risk Ratio (M‐H, Random, 95% CI) | 0.25 [0.11, 0.58] |
| 37.3 Unspecified or mixed gestational age | 0 | 0 | Risk Ratio (M‐H, Random, 95% CI) | 0.0 [0.0, 0.0] |
| 38 Maternal iron‐deficiency anaemia at term (Hb less than 110 g/L and at least one additional laboratory indicators at 37 weeks' gestation or more): SUBGROUP ANALYSIS by anaemia status at the start of supplementation Show forest plot | 6 | 1088 | Risk Ratio (M‐H, Random, 95% CI) | 0.33 [0.16, 0.69] |
| 38.1 Anaemic at start of supplementation | 0 | 0 | Risk Ratio (M‐H, Random, 95% CI) | 0.0 [0.0, 0.0] |
| 38.2 Non‐anaemic at the start of supplementation | 5 | 968 | Risk Ratio (M‐H, Random, 95% CI) | 0.39 [0.20, 0.74] |
| 38.3 Unspecified or mixed anaemia status | 1 | 120 | Risk Ratio (M‐H, Random, 95% CI) | 0.04 [0.00, 0.72] |
| 39 Maternal iron‐deficiency anaemia at term (Hb less than 110 g/L and at least one additional laboratory indicators at 37 weeks' gestation or more): SUBGROUP ANALYSIS by dose of iron Show forest plot | 6 | 1088 | Risk Ratio (M‐H, Random, 95% CI) | 0.33 [0.16, 0.69] |
| 39.1 Low daily dose (30 mg or less of elemental iron) | 3 | 579 | Risk Ratio (M‐H, Random, 95% CI) | 0.38 [0.13, 1.11] |
| 39.2 Medium daily dose (more than 30 mg and less than 60 mg elemental iron) | 1 | 241 | Risk Ratio (M‐H, Random, 95% CI) | 0.34 [0.16, 0.70] |
| 39.3 Higher daily dose (60 mg elemental iron or more) | 2 | 268 | Risk Ratio (M‐H, Random, 95% CI) | 0.04 [0.00, 0.72] |
| 40 Maternal iron‐deficiency anaemia at term (Hb less than 110 g/L and at least one additional laboratory indicators at 37 weeks' gestation or more): SUBGROUP ANALYSIS by malarial status of setting Show forest plot | 6 | 1088 | Risk Ratio (M‐H, Random, 95% CI) | 0.33 [0.16, 0.69] |
| 40.1 Malarial setting | 1 | 148 | Risk Ratio (M‐H, Random, 95% CI) | 0.0 [0.0, 0.0] |
| 40.2 Non‐malarial setting | 5 | 940 | Risk Ratio (M‐H, Random, 95% CI) | 0.33 [0.16, 0.69] |
| 41 Maternal death (death while pregnant or within 42 days of termination of pregnancy) (ALL) Show forest plot | 2 | 12560 | Risk Ratio (M‐H, Random, 95% CI) | 0.33 [0.01, 8.19] |
| 42 Side effects (any reported throughout the intervention period) (ALL) Show forest plot | 11 | 2423 | Risk Ratio (M‐H, Random, 95% CI) | 1.29 [0.83, 2.02] |
| 43 Side effects (any reported throughout the intervention period): SUBGROUP ANALYSIS by gestational age at the start of supplementation: Show forest plot | 11 | 2423 | Risk Ratio (M‐H, Random, 95% CI) | 1.32 [0.92, 1.91] |
| 43.1 Early gestational age (supplementation started before 20 weeks' gestation or prior to pregnancy) | 5 | 1186 | Risk Ratio (M‐H, Random, 95% CI) | 1.00 [0.68, 1.45] |
| 43.2 Late gestational age (supplementation started at 20 weeks of gestation or later) | 5 | 1032 | Risk Ratio (M‐H, Random, 95% CI) | 1.43 [0.89, 2.29] |
| 43.3 Unspecified or mixed gestational age | 1 | 205 | Risk Ratio (M‐H, Random, 95% CI) | 62.79 [3.89, 1013.31] |
| 44 Side effects (any reported throughout the intervention period): SUBGROUP ANALYSIS by anaemia status at the start of supplementation Show forest plot | 11 | 2423 | Risk Ratio (M‐H, Random, 95% CI) | 1.32 [0.92, 1.91] |
| 44.1 Anaemic at start of supplementation | 0 | 0 | Risk Ratio (M‐H, Random, 95% CI) | 0.0 [0.0, 0.0] |
| 44.2 Non‐anaemic at the start of supplementation | 7 | 1648 | Risk Ratio (M‐H, Random, 95% CI) | 1.01 [0.85, 1.20] |
| 44.3 Unspecified or mixed anaemia status | 4 | 775 | Risk Ratio (M‐H, Random, 95% CI) | 5.16 [0.78, 34.29] |
| 45 Side effects (any reported throughout the intervention period): SUBGROUP ANALYSIS by dose of iron Show forest plot | 11 | 2423 | Risk Ratio (M‐H, Random, 95% CI) | 1.32 [0.93, 1.89] |
| 45.1 Low daily dose (30 mg or less of elemental iron) | 6 | 1533 | Risk Ratio (M‐H, Random, 95% CI) | 1.00 [0.86, 1.16] |
| 45.2 Medium daily dose (more than 30 mg and less than 60 mg elemental iron) | 2 | 225 | Risk Ratio (M‐H, Random, 95% CI) | 2.00 [0.66, 6.02] |
| 45.3 Higher daily dose (60 mg elemental iron or more) | 5 | 665 | Risk Ratio (M‐H, Random, 95% CI) | 4.33 [0.61, 30.67] |
| 46 Side effects (any reported throughout the intervention period): SUBGROUP ANALYSIS by malarial status of setting Show forest plot | 11 | 2423 | Risk Ratio (M‐H, Random, 95% CI) | 1.32 [0.92, 1.91] |
| 46.1 Malarial setting | 1 | 205 | Risk Ratio (M‐H, Random, 95% CI) | 62.79 [3.89, 1013.31] |
| 46.2 Non‐malarial setting | 10 | 2218 | Risk Ratio (M‐H, Random, 95% CI) | 1.22 [0.91, 1.63] |
| 47 Maternal severe anaemia at any time during second and third trimester (Hb less than 70 g/L) (ALL) Show forest plot | 9 | 2125 | Risk Ratio (M‐H, Random, 95% CI) | 0.22 [0.01, 3.20] |
| 48 Maternal severe anaemia at any time during second and third trimester (Hb less than 70 g/L): SUBGROUP ANALYSIS by gestational age at the start of supplementation Show forest plot | 9 | 2125 | Risk Ratio (M‐H, Random, 95% CI) | 0.22 [0.01, 3.20] |
| 48.1 Early gestational age (supplementation started before 20 weeks' gestation or prior to pregnancy) | 5 | 1417 | Risk Ratio (M‐H, Random, 95% CI) | 0.06 [0.01, 0.47] |
| 48.2 Late gestational age (supplementation started at 20 weeks of gestation or later) | 3 | 559 | Risk Ratio (M‐H, Random, 95% CI) | 0.48 [0.00, 46.15] |
| 48.3 Unspecified or mixed gestational age | 1 | 149 | Risk Ratio (M‐H, Random, 95% CI) | 0.0 [0.0, 0.0] |
| 49 Maternal severe anaemia at any time during second and third trimester (Hb less than 70 g/L): SUBGROUP ANALYSIS by anaemia status at the start of supplementation Show forest plot | 9 | 2125 | Risk Ratio (M‐H, Random, 95% CI) | 0.22 [0.01, 3.20] |
| 49.1 Anaemic at start of supplementation | 0 | 0 | Risk Ratio (M‐H, Random, 95% CI) | 0.0 [0.0, 0.0] |
| 49.2 Non‐anaemic at the start of supplementation | 5 | 1394 | Risk Ratio (M‐H, Random, 95% CI) | 4.98 [0.24, 103.01] |
| 49.3 Unspecified or mixed anaemia status | 4 | 731 | Risk Ratio (M‐H, Random, 95% CI) | 0.06 [0.01, 0.30] |
| 50 Maternal severe anaemia at any time during second and third trimester (Hb less than 70 g/L): SUBGROUP ANALYSIS by dose of iron Show forest plot | 9 | 2125 | Risk Ratio (M‐H, Random, 95% CI) | 0.22 [0.01, 3.20] |
| 50.1 Low daily dose (30 mg or less of elemental iron) | 3 | 654 | Risk Ratio (M‐H, Random, 95% CI) | 4.98 [0.24, 103.01] |
| 50.2 Medium daily dose (more than 30 mg and less than 60 mg elemental iron) | 1 | 727 | Risk Ratio (M‐H, Random, 95% CI) | 0.0 [0.0, 0.0] |
| 50.3 Higher daily dose (60 mg elemental iron or more) | 5 | 744 | Risk Ratio (M‐H, Random, 95% CI) | 0.06 [0.01, 0.30] |
| 51 Maternal severe anaemia at any time during second and third trimester (Hb less than 70 g/L): SUBGROUP ANALYSIS by malarial status of setting Show forest plot | 9 | 2125 | Risk Ratio (M‐H, Random, 95% CI) | 0.22 [0.01, 3.20] |
| 51.1 Malarial setting | 3 | 1102 | Risk Ratio (M‐H, Random, 95% CI) | 0.06 [0.01, 0.30] |
| 51.2 Non‐malarial setting | 6 | 1023 | Risk Ratio (M‐H, Random, 95% CI) | 4.98 [0.24, 103.01] |
| 52 Maternal clinical malaria | 0 | 0 | Risk Ratio (M‐H, Random, 95% CI) | 0.0 [0.0, 0.0] |
| 53 Infection during pregnancy (including urinary tract infections) (ALL) Show forest plot | 1 | 727 | Risk Ratio (M‐H, Random, 95% CI) | 1.21 [0.33, 4.46] |
| 54 Infection during pregnancy (including urinary tract infections): SUBGROUP ANALYSIS by gestational age at the start of supplementation Show forest plot | 1 | 727 | Risk Ratio (M‐H, Random, 95% CI) | 1.21 [0.33, 4.46] |
| 54.1 Early gestational age (supplementation started before 20 weeks' gestation or prior to pregnancy) | 1 | 727 | Risk Ratio (M‐H, Random, 95% CI) | 1.21 [0.33, 4.46] |
| 54.2 Late gestational age (supplementation started at 20 weeks of gestation or later) | 0 | 0 | Risk Ratio (M‐H, Random, 95% CI) | 0.0 [0.0, 0.0] |
| 54.3 Unspecified or mixed gestational age | 0 | 0 | Risk Ratio (M‐H, Random, 95% CI) | 0.0 [0.0, 0.0] |
| 55 Infection during pregnancy (including urinary tract infections): SUBGROUP ANALYSIS by anaemia status at the start of supplementation Show forest plot | 1 | 727 | Risk Ratio (M‐H, Random, 95% CI) | 1.21 [0.33, 4.46] |
| 55.1 Anaemic at start of supplementation | 0 | 0 | Risk Ratio (M‐H, Random, 95% CI) | 0.0 [0.0, 0.0] |
| 55.2 Non‐anaemic at the start of supplementation | 1 | 727 | Risk Ratio (M‐H, Random, 95% CI) | 1.21 [0.33, 4.46] |
| 55.3 Unspecified or mixed anaemia status | 0 | 0 | Risk Ratio (M‐H, Random, 95% CI) | 0.0 [0.0, 0.0] |
| 56 Infection during pregnancy (including urinary tract infections): SUBGROUP ANALYSIS by dose of iron Show forest plot | 1 | 727 | Risk Ratio (M‐H, Random, 95% CI) | 1.21 [0.33, 4.46] |
| 56.1 Low daily dose (30 mg or less of elemental iron) | 0 | 0 | Risk Ratio (M‐H, Random, 95% CI) | 0.0 [0.0, 0.0] |
| 56.2 Medium daily dose (more than 30 mg and less than 60 mg elemental iron) | 1 | 727 | Risk Ratio (M‐H, Random, 95% CI) | 1.21 [0.33, 4.46] |
| 56.3 Higher daily dose (60 mg elemental iron or more) | 0 | 0 | Risk Ratio (M‐H, Random, 95% CI) | 0.0 [0.0, 0.0] |
| 57 Infection during pregnancy (including urinary tract infections): SUBGROUP ANALYSIS by malarial status of setting Show forest plot | 1 | 727 | Risk Ratio (M‐H, Random, 95% CI) | 1.21 [0.33, 4.46] |
| 57.1 Malarial setting | 1 | 727 | Risk Ratio (M‐H, Random, 95% CI) | 1.21 [0.33, 4.46] |
| 57.2 Non‐malarial setting | 0 | 0 | Risk Ratio (M‐H, Random, 95% CI) | 0.0 [0.0, 0.0] |
| 58 Very low birthweight (less than 1500 g) (ALL) Show forest plot | 5 | 2687 | Risk Ratio (M‐H, Random, 95% CI) | 0.73 [0.31, 1.74] |
| 59 Very premature birth (less than 34 weeks' gestation) (ALL) Show forest plot | 5 | 3743 | Risk Ratio (M‐H, Random, 95% CI) | 0.51 [0.29, 0.91] |
| 60 Infant Hb concentration within the first 6 months (in g/L counting the last reported measure after birth within this period) (ALL) Show forest plot | 2 | 533 | Mean Difference (IV, Random, 95% CI) | ‐1.25 [‐8.10, 5.59] |
| 61 Infant serum ferritin concentration within first 6 months (in μg/L counting the last reported measure after birth within this period) (ALL) Show forest plot | 1 | 197 | Mean Difference (IV, Random, 95% CI) | 11.0 [4.37, 17.63] |
| 62 Admission to special care unit (ALL) Show forest plot | 1 | 111 | Risk Ratio (M‐H, Random, 95% CI) | 0.0 [0.0, 0.0] |
| 63 Maternal anaemia at or near term (Hb less than 110 g/L at 34 weeks' gestation or more) (ALL) Show forest plot | 14 | 2199 | Risk Ratio (M‐H, Random, 95% CI) | 0.30 [0.19, 0.46] |
| 64 Maternal iron deficiency at or near term (as defined by as defined by trialists, based on any indicator of iron status at 34 weeks's gestation or more)) (ALL) Show forest plot | 7 | 1256 | Risk Ratio (M‐H, Random, 95% CI) | 0.43 [0.27, 0.66] |
| 65 Maternal iron‐deficiency anaemia at or near term (Hb less than 110 g/L and at least one additional laboratory indicators at 34 weeks' gestation or more) (ALL) Show forest plot | 6 | 1088 | Risk Ratio (M‐H, Random, 95% CI) | 0.33 [0.16, 0.69] |
| 66 Maternal Hb concentration at or near term (in g/L, at 34 weeks' gestation or more) (ALL) Show forest plot | 19 | 3704 | Mean Difference (IV, Random, 95% CI) | 8.88 [6.96, 10.80] |
| 67 Maternal Hb concentration within 6 wk postpartum (in g/L) (ALL) Show forest plot | 7 | 956 | Mean Difference (IV, Random, 95% CI) | 7.61 [5.50, 9.72] |
| 68 Maternal high haemoglobin concentrations during second or third trimester (Hb more than 130 g/L) (ALL) Show forest plot | 9 | 2188 | Risk Ratio (M‐H, Random, 95% CI) | 2.37 [1.34, 4.21] |
| 69 Maternal high haemoglobin concentrations at or near term (Hb more than 130 g/L at 34 weeks' gestation or more) (ALL) Show forest plot | 8 | 2156 | Risk Ratio (M‐H, Random, 95% CI) | 3.07 [1.18, 8.02] |
| 70 Maternal severe anaemia at or near term (Hb less than 70 g/L at 34 weeks' gestation or more) (ALL) Show forest plot | 8 | 1819 | Risk Ratio (M‐H, Random, 95% CI) | 0.47 [0.01, 44.11] |
| 71 Severe anaemia at postpartum (Hb less than 80 g/L) (ALL) Show forest plot | 8 | 1339 | Risk Ratio (M‐H, Random, 95% CI) | 0.04 [0.01, 0.28] |
| 72 Moderate anaemia at postpartum (Hb more than 80 g/L and less than 110 g/L) (ALL) Show forest plot | 3 | 766 | Risk Ratio (M‐H, Random, 95% CI) | 0.55 [0.12, 2.51] |
| 73 Puerperal infection (ALL) Show forest plot | 4 | 4374 | Risk Ratio (M‐H, Random, 95% CI) | 0.68 [0.50, 0.92] |
| 74 Antepartum haemorrhage (ALL) Show forest plot | 2 | 1157 | Risk Ratio (M‐H, Random, 95% CI) | 1.48 [0.51, 4.31] |
| 75 Postpartum haemorrhage (ALL) Show forest plot | 4 | 1488 | Risk Ratio (M‐H, Random, 95% CI) | 0.93 [0.59, 1.49] |
| 76 Transfusion provided (ALL) Show forest plot | 2 | 759 | Risk Ratio (M‐H, Random, 95% CI) | 0.96 [0.10, 8.98] |
| 77 Diarrhoea (ALL) Show forest plot | 3 | 1088 | Risk Ratio (M‐H, Random, 95% CI) | 0.55 [0.32, 0.93] |
| 78 Constipation (ALL) Show forest plot | 4 | 1495 | Risk Ratio (M‐H, Random, 95% CI) | 0.95 [0.62, 1.43] |
| 79 Nausea (ALL) Show forest plot | 4 | 1377 | Risk Ratio (M‐H, Random, 95% CI) | 1.21 [0.72, 2.03] |
| 80 Heartburn (ALL) Show forest plot | 3 | 1323 | Risk Ratio (M‐H, Random, 95% CI) | 1.19 [0.86, 1.66] |
| 81 Vomiting (ALL) Show forest plot | 4 | 1392 | Risk Ratio (M‐H, Random, 95% CI) | 0.88 [0.59, 1.30] |
| 82 Maternal wellbeing/satisfaction (ALL) Show forest plot | 1 | 49 | Risk Ratio (M‐H, Random, 95% CI) | 0.91 [0.77, 1.08] |
| 83 Placental abruption (ALL) Show forest plot | 3 | 2951 | Risk Ratio (M‐H, Random, 95% CI) | 1.41 [0.56, 3.59] |
| 84 Premature rupture of membranes (ALL) Show forest plot | 3 | 1581 | Risk Ratio (M‐H, Random, 95% CI) | 0.93 [0.72, 1.22] |
| 85 Pre‐eclampsia (ALL) Show forest plot | 4 | 1704 | Risk Ratio (M‐H, Random, 95% CI) | 1.63 [0.87, 3.07] |
| Outcome or subgroup title | No. of studies | No. of participants | Statistical method | Effect size |
| 1 Low birthweight (less than 2500 g) (ALL) Show forest plot | 2 | 1311 | Risk Ratio (M‐H, Random, 95% CI) | 1.07 [0.31, 3.74] |
| 2 Neonatal death (within 28 days after delivery) (ALL) Show forest plot | 3 | 1793 | Risk Ratio (M‐H, Random, 95% CI) | 0.81 [0.51, 1.30] |
| 3 Preterm birth (less than 37 weeks of gestation) (ALL) Show forest plot | 3 | 1497 | Risk Ratio (M‐H, Random, 95% CI) | 1.55 [0.40, 6.00] |
| 4 Preterm birth (less than 37 weeks of gestation): SUBGROUP ANALYSIS by gestation at the start of supplementation Show forest plot | 3 | Risk Ratio (M‐H, Random, 95% CI) | Subtotals only | |
| 4.1 Early gestational age (less than 20 weeks of gestation or pre‐pregnancy) at start of supplementation | 2 | 1366 | Risk Ratio (M‐H, Random, 95% CI) | 1.55 [0.40, 6.00] |
| 4.2 Late gestational age (supplementation started at 20 weeks of gestation or later) | 0 | 0 | Risk Ratio (M‐H, Random, 95% CI) | 0.0 [0.0, 0.0] |
| 4.3 Unspecified or mixed gestational age at start of supplementation | 1 | 44 | Risk Ratio (M‐H, Random, 95% CI) | 0.0 [0.0, 0.0] |
| 5 Preterm birth (less than 37 weeks of gestation): SUBGROUP ANALYSIS by anaemia status at the start of supplementation Show forest plot | 3 | Risk Ratio (M‐H, Random, 95% CI) | Subtotals only | |
| 5.1 Anaemic at start of supplementation | 0 | 0 | Risk Ratio (M‐H, Random, 95% CI) | 0.0 [0.0, 0.0] |
| 5.2 Non‐anaemic at the start of supplementation | 0 | 0 | Risk Ratio (M‐H, Random, 95% CI) | 0.0 [0.0, 0.0] |
| 5.3 Unspecified or mixed anaemic status at start of supplementation | 3 | 1497 | Risk Ratio (M‐H, Random, 95% CI) | 1.55 [0.40, 6.00] |
| 6 Preterm birth (less than 37 weeks of gestation): SUBGROUP ANALYSIS by dose of iron Show forest plot | 3 | 1497 | Risk Ratio (M‐H, Random, 95% CI) | 1.55 [0.40, 6.00] |
| 6.1 Low daily dose (30 mg elemental iron or less) | 1 | 131 | Risk Ratio (M‐H, Random, 95% CI) | 0.0 [0.0, 0.0] |
| 6.2 Medium daily dose (31 to 59 mg elemental iron) | 0 | 0 | Risk Ratio (M‐H, Random, 95% CI) | 0.0 [0.0, 0.0] |
| 6.3 Higher daily dose (60 mg elemental iron and above) | 2 | 1366 | Risk Ratio (M‐H, Random, 95% CI) | 1.55 [0.40, 6.00] |
| 7 Preterm birth (less than 37 weeks of gestation): SUBGROUP ANALYSIS by malarial status of settings Show forest plot | 3 | 1497 | Risk Ratio (M‐H, Random, 95% CI) | 1.55 [0.40, 6.00] |
| 7.1 Malarial setting | 2 | 1449 | Risk Ratio (M‐H, Random, 95% CI) | 1.13 [0.92, 1.39] |
| 7.2 Non‐malarial setting | 1 | 48 | Risk Ratio (M‐H, Random, 95% CI) | 7.00 [0.38, 128.61] |
| 8 Birthweight (ALL) Show forest plot | 2 | 1365 | Mean Difference (IV, Random, 95% CI) | 57.73 [7.66, 107.79] |
| 9 Neonatal death (within 28 days after delivery): SUBGROUP ANALYSIS by gestation at the start of supplementation Show forest plot | 3 | 1793 | Risk Ratio (M‐H, Random, 95% CI) | 0.81 [0.51, 1.30] |
| 9.1 Early gestational age (less than 20 weeks of gestation or pre‐pregnancy) at start of supplementation | 3 | 1793 | Risk Ratio (M‐H, Random, 95% CI) | 0.81 [0.51, 1.30] |
| 9.2 Late gestational age (20 weeks or more of gestation) at start of supplementation | 0 | 0 | Risk Ratio (M‐H, Random, 95% CI) | 0.0 [0.0, 0.0] |
| 9.3 Unspecified or mixed gestational age at start of supplementation | 0 | 0 | Risk Ratio (M‐H, Random, 95% CI) | 0.0 [0.0, 0.0] |
| 10 Neonatal death (within 28 days after delivery): SUBGROUP ANALYSIS by anaemia status at the start of supplementation Show forest plot | 3 | 1793 | Risk Ratio (M‐H, Random, 95% CI) | 0.81 [0.51, 1.30] |
| 10.1 Anaemic at start of supplementation | 0 | 0 | Risk Ratio (M‐H, Random, 95% CI) | 0.0 [0.0, 0.0] |
| 10.2 Non‐anaemic at start of supplementation | 1 | 97 | Risk Ratio (M‐H, Random, 95% CI) | 2.5 [0.10, 59.88] |
| 10.3 Unspecified or mixed anaemic status at start of supplementation | 2 | 1696 | Risk Ratio (M‐H, Random, 95% CI) | 0.79 [0.49, 1.27] |
| 11 Neonatal death (within 28 days after delivery): SUBGROUP ANALYSIS by dose of iron Show forest plot | 3 | 1793 | Risk Ratio (M‐H, Random, 95% CI) | 0.81 [0.51, 1.30] |
| 11.1 Low daily dose (30 mg elemental iron or less) | 0 | 0 | Risk Ratio (M‐H, Random, 95% CI) | 0.0 [0.0, 0.0] |
| 11.2 Medium daily dose (31 to 59 mg elemental iron) | 0 | 0 | Risk Ratio (M‐H, Random, 95% CI) | 0.0 [0.0, 0.0] |
| 11.3 Higher daily dose (60 mg elemental iron and above) | 3 | 1793 | Risk Ratio (M‐H, Random, 95% CI) | 0.81 [0.51, 1.30] |
| 12 Neonatal death (within 28 days after delivery): SUBGROUP ANALYSIS by malarial status at the start of supplementation Show forest plot | 3 | 1793 | Risk Ratio (M‐H, Random, 95% CI) | 0.81 [0.51, 1.30] |
| 12.1 Malarial setting | 1 | 1648 | Risk Ratio (M‐H, Random, 95% CI) | 0.79 [0.49, 1.27] |
| 12.2 Non‐malarial setting | 2 | 145 | Risk Ratio (M‐H, Random, 95% CI) | 2.5 [0.10, 59.88] |
| 13 Congenital anomalies (ALL) Show forest plot | 1 | 1652 | Risk Ratio (M‐H, Random, 95% CI) | 0.70 [0.35, 1.40] |
| 14 Maternal anaemia at term (Hb less than 110 g/L at 37 weeks' gestation or more) (ALL) Show forest plot | 3 | 346 | Risk Ratio (M‐H, Random, 95% CI) | 0.34 [0.21, 0.54] |
| 15 Maternal anaemia at term (Hb less than 110 g/L at 37 weeks' gestation or more): SUBGROUP ANALYSIS by gestation at the start of supplementation Show forest plot | 3 | 346 | Risk Ratio (M‐H, Random, 95% CI) | 0.34 [0.21, 0.54] |
| 15.1 Early gestational age (less than 20 weeks of gestation or pre‐pregnancy) at start of supplementation | 1 | 97 | Risk Ratio (M‐H, Random, 95% CI) | 0.0 [0.0, 0.0] |
| 15.2 Late gestational age (20 weeks or more of gestation) at start of supplementation | 1 | 66 | Risk Ratio (M‐H, Random, 95% CI) | 0.37 [0.22, 0.62] |
| 15.3 Unspecified or mixed gestational age at start of supplementation | 1 | 183 | Risk Ratio (M‐H, Random, 95% CI) | 0.24 [0.09, 0.68] |
| 16 Maternal anaemia at term (Hb less than 110 g/L at 37 weeks' gestation or more): SUBGROUP ANALYSIS by anaemia status at the start of supplementation Show forest plot | 3 | 346 | Risk Ratio (M‐H, Random, 95% CI) | 0.34 [0.21, 0.54] |
| 16.1 Anaemic at start of supplementation | 0 | 0 | Risk Ratio (M‐H, Random, 95% CI) | 0.0 [0.0, 0.0] |
| 16.2 Non‐anaemic at start of supplementation | 2 | 280 | Risk Ratio (M‐H, Random, 95% CI) | 0.24 [0.09, 0.68] |
| 16.3 Unspecified or mixed anaemic status at start of supplementation | 1 | 66 | Risk Ratio (M‐H, Random, 95% CI) | 0.37 [0.22, 0.62] |
| 17 Maternal anaemia at term (Hb less than 110 g/L at 37 weeks' gestation or more): SUBGROUP ANALYSIS by dose of iron Show forest plot | 3 | 346 | Risk Ratio (M‐H, Random, 95% CI) | 0.34 [0.21, 0.54] |
| 17.1 Low daily dose (30 mg elemental iron or less) | 0 | 0 | Risk Ratio (M‐H, Random, 95% CI) | 0.0 [0.0, 0.0] |
| 17.2 Medium daily dose (31 to 59 mg elemental iron) | 0 | 0 | Risk Ratio (M‐H, Random, 95% CI) | 0.0 [0.0, 0.0] |
| 17.3 Higher daily dose (60 mg elemental iron and above) | 3 | 346 | Risk Ratio (M‐H, Random, 95% CI) | 0.34 [0.21, 0.54] |
| 18 Maternal anaemia at term (Hb less than 110 g/L at 37 weeks' gestation or more): SUBGROUP ANALYSIS by malarial status of setting Show forest plot | 3 | 346 | Risk Ratio (M‐H, Random, 95% CI) | 0.34 [0.21, 0.54] |
| 18.1 Malarial setting | 1 | 66 | Risk Ratio (M‐H, Random, 95% CI) | 0.37 [0.22, 0.62] |
| 18.2 Non‐malarial setting | 2 | 280 | Risk Ratio (M‐H, Random, 95% CI) | 0.24 [0.09, 0.68] |
| 19 Maternal iron deficiency at term (as defined by trialists, based on any indicator of iron status at 37 weeks' gestation or more) (ALL) Show forest plot | 1 | 131 | Risk Ratio (M‐H, Random, 95% CI) | 0.24 [0.06, 0.99] |
| 20 Maternal iron‐deficiency anaemia at term (Hb less than 110 g/L and at least one additional laboratory indicators at 37 weeks' gestation or more) (ALL) Show forest plot | 1 | 131 | Risk Ratio (M‐H, Random, 95% CI) | 0.43 [0.17, 1.09] |
| 21 Maternal death (death while pregnant or within 42 days of termination of pregnancy) (ALL) Show forest plot | 1 | 131 | Risk Ratio (M‐H, Random, 95% CI) | 0.0 [0.0, 0.0] |
| 22 Side effects (any reported throughout the intervention period) (ALL) Show forest plot | 1 | 456 | Risk Ratio (M‐H, Random, 95% CI) | 44.32 [2.77, 709.09] |
| 23 Maternal severe anaemia at any time during second and third trimester (Hb less than 70 g/L) (ALL) Show forest plot | 4 | 506 | Risk Ratio (M‐H, Random, 95% CI) | 0.12 [0.02, 0.63] |
| 24 Maternal severe anaemia at any time during second and third trimester (Hb less than 70 g/L): SUBGROUP ANALYSIS by gestation at the start of supplementation Show forest plot | 4 | 506 | Risk Ratio (M‐H, Random, 95% CI) | 0.12 [0.02, 0.63] |
| 24.1 Early gestational age (less than 20 weeks of gestation or pre‐pregnancy) at start of supplementation | 3 | 456 | Risk Ratio (M‐H, Random, 95% CI) | 0.11 [0.01, 0.83] |
| 24.2 Late gestational age (20 weeks or more of gestation) at start of supplementation | 1 | 50 | Risk Ratio (M‐H, Random, 95% CI) | 0.14 [0.01, 2.63] |
| 24.3 Unspecified or mixed gestational age at start of supplementation | 0 | 0 | Risk Ratio (M‐H, Random, 95% CI) | 0.0 [0.0, 0.0] |
| 25 Maternal severe anaemia at any time during second and third trimester (Hb less than 70 g/L): SUBGROUP ANALYSIS by anaemia status at the start of supplementation Show forest plot | 4 | 506 | Risk Ratio (M‐H, Random, 95% CI) | 0.12 [0.02, 0.63] |
| 25.1 Anaemic at start of supplementation | 0 | 0 | Risk Ratio (M‐H, Random, 95% CI) | 0.0 [0.0, 0.0] |
| 25.2 Non‐anaemic at start of supplementation | 1 | 97 | Risk Ratio (M‐H, Random, 95% CI) | 0.0 [0.0, 0.0] |
| 25.3 Unspecified or mixed anaemic status at start of supplementation | 3 | 409 | Risk Ratio (M‐H, Random, 95% CI) | 0.12 [0.02, 0.63] |
| 26 Maternal severe anaemia at any time during second and third trimester (Hb less than 70 g/L): SUBGROUP ANALYSIS by dose of iron Show forest plot | 4 | 506 | Risk Ratio (M‐H, Random, 95% CI) | 0.12 [0.02, 0.63] |
| 26.1 Low daily dose (30 mg elemental iron or less) | 1 | 44 | Risk Ratio (M‐H, Random, 95% CI) | 0.0 [0.0, 0.0] |
| 26.2 Medium daily dose (31 to 59 mg elemental iron) | 0 | 0 | Risk Ratio (M‐H, Random, 95% CI) | 0.0 [0.0, 0.0] |
| 26.3 Higher daily dose (60 mg elemental iron and above) | 3 | 462 | Risk Ratio (M‐H, Random, 95% CI) | 0.12 [0.02, 0.63] |
| 27 Maternal severe anaemia at any time during second and third trimester (Hb less than 70 g/L): SUBGROUP ANALYSIS by malarial status of setting Show forest plot | 4 | 506 | Risk Ratio (M‐H, Random, 95% CI) | 0.12 [0.02, 0.63] |
| 27.1 Malarial setting | 3 | 409 | Risk Ratio (M‐H, Random, 95% CI) | 0.12 [0.02, 0.63] |
| 27.2 Non‐malarial setting | 1 | 97 | Risk Ratio (M‐H, Random, 95% CI) | 0.0 [0.0, 0.0] |
| 28 Maternal clinical malaria | 0 | 0 | Risk Ratio (M‐H, Random, 95% CI) | 0.0 [0.0, 0.0] |
| 29 Infection during pregnancy (including urinary tract infections) (ALL) Show forest plot | 1 | 48 | Risk Ratio (M‐H, Random, 95% CI) | 1.0 [0.15, 6.53] |
| 30 Very low birthweight (less than 1500 g) (ALL) Show forest plot | 1 | 48 | Risk Ratio (M‐H, Random, 95% CI) | 5.0 [0.25, 98.96] |
| 31 Very premature birth (less than 34 weeks' gestation) (ALL) Show forest plot | 2 | 92 | Risk Ratio (M‐H, Random, 95% CI) | 5.0 [0.25, 98.96] |
| 32 Admission to special care unit (ALL) Show forest plot | 1 | 48 | Risk Ratio (M‐H, Random, 95% CI) | 0.0 [0.0, 0.0] |
| 33 Maternal anaemia at or near term (Hb less than 110 g/L at 34 weeks' gestation or more) (ALL) Show forest plot | 3 | 346 | Risk Ratio (M‐H, Random, 95% CI) | 0.34 [0.21, 0.54] |
| 34 Maternal iron deficiency at or near term (as defined by trialists, based on any indicator of iron status at 34 weeks' gestation or more) (ALL) Show forest plot | 1 | 131 | Risk Ratio (M‐H, Random, 95% CI) | 0.24 [0.06, 0.99] |
| 35 Maternal iron‐deficiency anaemia at or near term (Hb less than 110 g/L and at least one additional laboratory indicators at 34 weeks' gestation or more) (ALL) Show forest plot | 1 | 131 | Risk Ratio (M‐H, Random, 95% CI) | 0.43 [0.17, 1.09] |
| 36 Maternal Hb concentration at or near term (in g/L, at 34 weeks' gestation or more) (ALL) Show forest plot | 3 | 140 | Mean Difference (IV, Random, 95% CI) | 16.13 [12.74, 19.52] |
| 37 Maternal Hb concentration within 6 wk postpartum (in g/L) (ALL) Show forest plot | 2 | 459 | Mean Difference (IV, Random, 95% CI) | 10.07 [7.33, 12.81] |
| 38 Maternal high haemoglobin concentrations during second or third trimester (Hb more than 130 g/L) (ALL) Show forest plot | 2 | 446 | Risk Ratio (M‐H, Random, 95% CI) | 1.78 [0.63, 5.04] |
| 39 Maternal high haemoglobin concentrations at or near term (Hb more than 130 g/L at 34 weeks' gestation or more) (ALL) Show forest plot | 2 | 314 | Risk Ratio (M‐H, Random, 95% CI) | 4.37 [0.58, 32.71] |
| 40 Moderate anaemia at postpartum (Hb more than 80 g/L and less than 110 g/L) (ALL) Show forest plot | 3 | 491 | Risk Ratio (M‐H, Random, 95% CI) | 0.33 [0.17, 0.65] |
| 41 Maternal severe anaemia at or near term (Hb less than 70 g/L at 34 weeks' gestation or more ) (ALL) Show forest plot | 3 | 191 | Risk Ratio (M‐H, Random, 95% CI) | 0.14 [0.01, 2.63] |
| 42 Severe anaemia at postpartum (Hb less than 80 g/L) (ALL) Show forest plot | 3 | 491 | Risk Ratio (M‐H, Random, 95% CI) | 0.05 [0.00, 0.76] |
| 43 Puerperal infection (ALL) Show forest plot | 1 | 2863 | Risk Ratio (M‐H, Random, 95% CI) | 0.55 [0.13, 2.28] |
| 44 Antepartum haemorrhage (ALL) Show forest plot | 2 | 145 | Risk Ratio (M‐H, Random, 95% CI) | 1.25 [0.22, 7.12] |
| 45 Postpartum haemorrhage (ALL) | 0 | 0 | Risk Ratio (M‐H, Random, 95% CI) | 0.0 [0.0, 0.0] |
| 46 Placental abruption (ALL) Show forest plot | 1 | 2863 | Risk Ratio (M‐H, Random, 95% CI) | 8.19 [0.49, 138.16] |
| 47 Pre‐eclampsia (ALL) Show forest plot | 1 | 48 | Risk Ratio (M‐H, Random, 95% CI) | 3.0 [0.13, 70.16] |
| Outcome or subgroup title | No. of studies | No. of participants | Statistical method | Effect size |
| 1 Low birthweight (less than 2500 g) (ALL) Show forest plot | 6 | 1136 | Risk Ratio (M‐H, Random, 95% CI) | 0.63 [0.30, 1.32] |
| 2 Low birthweight (less than 2500 g): SUBGROUP ANALYSIS by gestational age at the start of supplementation Show forest plot | 6 | 1136 | Risk Ratio (M‐H, Random, 95% CI) | 0.63 [0.30, 1.32] |
| 2.1 Early gestational age (less than 20 weeks of gestation or pre‐pregnancy) at start of supplementation | 2 | 361 | Risk Ratio (M‐H, Random, 95% CI) | 0.32 [0.15, 0.70] |
| 2.2 Late gestational age (20 weeks or more of gestation) at start of supplementation | 3 | 665 | Risk Ratio (M‐H, Random, 95% CI) | 1.05 [0.50, 2.19] |
| 2.3 Unspecified or mixed gestational age at the start of supplementation | 1 | 110 | Risk Ratio (M‐H, Random, 95% CI) | 1.79 [0.17, 19.20] |
| 3 Low birthweight (less than 2500 g): SUBGROUP ANALYSIS by anaemia status at the start of supplementation Show forest plot | 6 | 1136 | Risk Ratio (M‐H, Random, 95% CI) | 0.63 [0.30, 1.32] |
| 3.1 Anaemic at start of supplementation | 0 | 0 | Risk Ratio (M‐H, Random, 95% CI) | 0.0 [0.0, 0.0] |
| 3.2 Non‐anaemic at start of supplementation | 5 | 955 | Risk Ratio (M‐H, Random, 95% CI) | 0.65 [0.25, 1.66] |
| 3.3 Unspecified or mixed anaemic status at start of supplementation | 1 | 181 | Risk Ratio (M‐H, Random, 95% CI) | 0.57 [0.14, 2.31] |
| 4 Low birthweight (less than 2500 g): SUBGROUP ANALYSIS by dose of iron Show forest plot | 6 | 1136 | Risk Ratio (M‐H, Random, 95% CI) | 0.63 [0.30, 1.32] |
| 4.1 Low daily dose (30 mg elemental iron or less) | 3 | 697 | Risk Ratio (M‐H, Random, 95% CI) | 0.59 [0.12, 2.96] |
| 4.2 Medium daily dose (31 to 59 mg elemental iron) | 0 | 0 | Risk Ratio (M‐H, Random, 95% CI) | 0.0 [0.0, 0.0] |
| 4.3 Higher daily dose (60 mg elemental iron and above) | 3 | 439 | Risk Ratio (M‐H, Random, 95% CI) | 0.62 [0.25, 1.50] |
| 5 Low birthweight (less than 2500 g): SUBGROUP ANALYSIS by malarial status of setting Show forest plot | 6 | 1136 | Risk Ratio (M‐H, Random, 95% CI) | 0.63 [0.30, 1.32] |
| 5.1 Malarial setting | 2 | 329 | Risk Ratio (M‐H, Random, 95% CI) | 0.52 [0.20, 1.35] |
| 5.2 Non‐malarial setting | 4 | 807 | Risk Ratio (M‐H, Random, 95% CI) | 0.73 [0.20, 2.70] |
| 6 Birthweight (g) (ALL) Show forest plot | 9 | 1331 | Mean Difference (IV, Random, 95% CI) | ‐1.04 [‐78.77, 76.70] |
| 7 Birthweight (g): SUBGROUP ANALYSIS by gestational age at the start of supplementation Show forest plot | 9 | 1331 | Mean Difference (IV, Random, 95% CI) | ‐1.04 [‐78.77, 76.70] |
| 7.1 Early gestational age (less than 20 weeks of gestation or pre‐pregnancy) at start of supplementation | 5 | 477 | Mean Difference (IV, Random, 95% CI) | ‐31.62 [‐214.93, 151.70] |
| 7.2 Late gestational age (20 weeks or more of gestation) at start of supplementation | 4 | 854 | Mean Difference (IV, Random, 95% CI) | ‐8.70 [‐74.71, 57.31] |
| 7.3 Unspecified or mixed gestational age at the start of supplementation | 0 | 0 | Mean Difference (IV, Random, 95% CI) | 0.0 [0.0, 0.0] |
| 8 Birthweight (g): SUBGROUP ANALYSIS by anaemia status at the start of supplementation Show forest plot | 9 | 1331 | Mean Difference (IV, Random, 95% CI) | ‐1.04 [‐78.77, 76.70] |
| 8.1 Anaemic at start of supplementation | 0 | 0 | Mean Difference (IV, Random, 95% CI) | 0.0 [0.0, 0.0] |
| 8.2 Non‐anaemic at start of supplementation | 7 | 961 | Mean Difference (IV, Random, 95% CI) | ‐9.03 [‐125.10, 107.04] |
| 8.3 Unspecified or mixed anaemic status at start of supplementation | 2 | 370 | Mean Difference (IV, Random, 95% CI) | 0.90 [‐86.32, 88.12] |
| 9 Birthweight (g): SUBGROUP ANALYSIS by dose of iron Show forest plot | 9 | 1331 | Mean Difference (IV, Random, 95% CI) | ‐1.70 [‐72.00, 70.60] |
| 9.1 Low daily dose (30 mg elemental iron or less) | 4 | 785 | Mean Difference (IV, Random, 95% CI) | 46.83 [‐76.57, 170.22] |
| 9.2 Medium daily dose (31 to 59 mg elemental iron) | 0 | 0 | Mean Difference (IV, Random, 95% CI) | 0.0 [0.0, 0.0] |
| 9.3 Higher daily dose (60 mg elemental iron and above) | 6 | 546 | Mean Difference (IV, Random, 95% CI) | ‐36.28 [‐126.66, 54.10] |
| 10 Birthweight (g): SUBGROUP ANALYSIS by malarial status of setting Show forest plot | 9 | 1331 | Mean Difference (IV, Random, 95% CI) | ‐1.04 [‐78.77, 76.70] |
| 10.1 Malarial setting | 2 | 345 | Mean Difference (IV, Random, 95% CI) | 33.74 [‐61.16, 128.65] |
| 10.2 Non‐malarial setting | 7 | 986 | Mean Difference (IV, Random, 95% CI) | ‐21.75 [‐132.94, 89.44] |
| 11 Preterm birth (less than 37 weeks of gestation) (ALL) Show forest plot | 6 | 1713 | Risk Ratio (M‐H, Random, 95% CI) | 0.82 [0.58, 1.14] |
| 12 Preterm birth (less 37 weeks of gestation): SUBGROUP ANALYSIS by gestational age at the start of supplementation Show forest plot | 6 | 1713 | Risk Ratio (M‐H, Random, 95% CI) | 0.82 [0.58, 1.14] |
| 12.1 Early gestational age (less than 20 weeks of gestation or pre‐pregnancy) at start of supplementation | 4 | 1236 | Risk Ratio (M‐H, Random, 95% CI) | 0.92 [0.62, 1.35] |
| 12.2 Late gestational age (20 weeks or more of gestation) at start of supplementation | 2 | 477 | Risk Ratio (M‐H, Random, 95% CI) | 0.58 [0.29, 1.13] |
| 12.3 Unspecified or mixed gestational age at start of supplementation | 0 | 0 | Risk Ratio (M‐H, Random, 95% CI) | 0.0 [0.0, 0.0] |
| 13 Preterm birth (less 37 weeks of gestation): SUBGROUP ANALYSIS by anaemia status at the start of supplementation Show forest plot | 6 | 1713 | Risk Ratio (M‐H, Random, 95% CI) | 0.82 [0.58, 1.14] |
| 13.1 Anaemic at start of supplementation | 0 | 0 | Risk Ratio (M‐H, Random, 95% CI) | 0.0 [0.0, 0.0] |
| 13.2 Non‐anaemic at start of supplementation | 5 | 851 | Risk Ratio (M‐H, Random, 95% CI) | 0.72 [0.45, 1.13] |
| 13.3 Unspecified or mixed anaemic status at start of supplementation | 1 | 862 | Risk Ratio (M‐H, Random, 95% CI) | 0.95 [0.58, 1.57] |
| 14 Preterm birth (less 37 weeks of gestation): SUBGROUP ANALYSIS by dose of iron Show forest plot | 6 | 1713 | Risk Ratio (M‐H, Random, 95% CI) | 0.82 [0.58, 1.14] |
| 14.1 Low daily dose (30 mg elemental iron or less) | 3 | 690 | Risk Ratio (M‐H, Random, 95% CI) | 0.76 [0.47, 1.24] |
| 14.2 Medium daily dose (31 to 59 mg elemental iron) | 0 | 0 | Risk Ratio (M‐H, Random, 95% CI) | 0.0 [0.0, 0.0] |
| 14.3 Higher daily dose (60 mg elemental iron and above) | 3 | 1023 | Risk Ratio (M‐H, Random, 95% CI) | 0.87 [0.54, 1.39] |
| 15 Preterm birth (less 37 weeks of gestation): SUBGROUP ANALYSIS by malarial status of setting Show forest plot | 6 | 1713 | Risk Ratio (M‐H, Random, 95% CI) | 0.82 [0.58, 1.14] |
| 15.1 Malarial setting | 2 | 1010 | Risk Ratio (M‐H, Random, 95% CI) | 0.87 [0.54, 1.39] |
| 15.2 Non‐malarial setting | 4 | 703 | Risk Ratio (M‐H, Random, 95% CI) | 0.76 [0.47, 1.24] |
| 16 Neonatal death (within 28 days after delivery) (ALL) | 0 | 0 | Risk Ratio (M‐H, Random, 95% CI) | 0.0 [0.0, 0.0] |
| 17 Congenital anomalies (ALL) Show forest plot | 2 | 2402 | Risk Ratio (M‐H, Random, 95% CI) | 0.86 [0.55, 1.35] |
| 18 Maternal anaemia at term (Hb less than 110 g/L at 37 weeks' gestation or more) (ALL) Show forest plot | 14 | 2136 | Risk Ratio (M‐H, Random, 95% CI) | 0.29 [0.19, 0.47] |
| 19 Maternal anaemia at term (Hb less than 110 g/L at 37 weeks' gestation or more): SUBGROUP ANALYSIS by gestational age at the start of supplementation Show forest plot | 13 | 1999 | Risk Ratio (M‐H, Random, 95% CI) | 0.25 [0.16, 0.41] |
| 19.1 Early gestational age (less than 20 weeks of gestation or pre‐pregnancy) at start of supplementation | 6 | 549 | Risk Ratio (M‐H, Random, 95% CI) | 0.18 [0.06, 0.57] |
| 19.2 Late gestational age (20 weeks or more of gestation) at start of supplementation | 6 | 1301 | Risk Ratio (M‐H, Random, 95% CI) | 0.32 [0.20, 0.53] |
| 19.3 Unspecified or mixed gestational age at start of supplementation | 1 | 149 | Risk Ratio (M‐H, Random, 95% CI) | 0.03 [0.00, 0.18] |
| 20 Maternal anaemia at term (Hb less than 110 g/L at 37 weeks gestation or more): SUBGROUP ANALYSIS by anaemia status at the start of supplementation Show forest plot | 13 | 1936 | Risk Ratio (M‐H, Random, 95% CI) | 0.25 [0.15, 0.42] |
| 20.1 Anaemic at start of supplementation | 0 | 0 | Risk Ratio (M‐H, Random, 95% CI) | 0.0 [0.0, 0.0] |
| 20.2 Non‐anaemic at start of supplementation | 8 | 1244 | Risk Ratio (M‐H, Random, 95% CI) | 0.20 [0.10, 0.44] |
| 20.3 Unspecified or mixed anaemic status at start of supplementation | 5 | 692 | Risk Ratio (M‐H, Random, 95% CI) | 0.34 [0.18, 0.64] |
| 21 Maternal anaemia at term (Hb less than 110 g/L at 37 weeks' gestation or more): SUBGROUP ANALYSIS by dose of iron Show forest plot | 13 | 1999 | Risk Ratio (M‐H, Random, 95% CI) | 0.25 [0.16, 0.41] |
| 21.1 Low daily dose (30 mg elemental iron or less) | 3 | 590 | Risk Ratio (M‐H, Random, 95% CI) | 0.49 [0.24, 1.03] |
| 21.2 Medium daily dose (31 to 59 mg elemental iron) | 1 | 69 | Risk Ratio (M‐H, Random, 95% CI) | 0.21 [0.06, 0.73] |
| 21.3 Higher daily dose (60 mg elemental iron and above) | 9 | 1340 | Risk Ratio (M‐H, Random, 95% CI) | 0.19 [0.10, 0.38] |
| 22 Maternal anaemia at term (Hb less than 110 g/L at 37 weeks' gestation or more): SUBGROUP ANALYSIS by malarial status of setting Show forest plot | 13 | 1936 | Risk Ratio (M‐H, Random, 95% CI) | 0.25 [0.15, 0.42] |
| 22.1 Malarial setting | 2 | 267 | Risk Ratio (M‐H, Random, 95% CI) | 0.58 [0.46, 0.72] |
| 22.2 Non‐malarial setting | 11 | 1669 | Risk Ratio (M‐H, Random, 95% CI) | 0.18 [0.10, 0.34] |
| 23 Maternal iron deficiency at term (as defined by trialists, based on any indicator of iron status at 37 weeks' gestation or more) (ALL) Show forest plot | 7 | 1256 | Risk Ratio (M‐H, Random, 95% CI) | 0.43 [0.27, 0.66] |
| 24 Maternal iron deficiency at term (as defined by trialists, based on any indicator of iron status at 37 weeks' gestation or more): SUBGROUP ANALYSIS by gestational age at the start of supplementation Show forest plot | 7 | 1256 | Risk Ratio (M‐H, Random, 95% CI) | 0.43 [0.27, 0.66] |
| 24.1 Early gestational age (less than 20 weeks of gestation or pre‐pregnancy) at start of supplementation | 4 | 653 | Risk Ratio (M‐H, Random, 95% CI) | 0.45 [0.22, 0.93] |
| 24.2 Late gestational age (20 weeks or more of gestation) at start of supplementation | 3 | 603 | Risk Ratio (M‐H, Random, 95% CI) | 0.36 [0.18, 0.72] |
| 24.3 Unspecified or mixed gestational age at start of supplementation | 0 | 0 | Risk Ratio (M‐H, Random, 95% CI) | 0.0 [0.0, 0.0] |
| 25 Maternal iron deficiency at term (as defined by trialists, based on any indicator of iron status at 37 weeks' gestation or more): SUBGROUP ANALYSIS by anaemia status at the start of supplementation Show forest plot | 7 | 1256 | Risk Ratio (M‐H, Random, 95% CI) | 0.43 [0.27, 0.66] |
| 25.1 Anaemic at start of supplementation | 0 | 0 | Risk Ratio (M‐H, Random, 95% CI) | 0.0 [0.0, 0.0] |
| 25.2 Non‐anaemic at start of supplementation | 5 | 1092 | Risk Ratio (M‐H, Random, 95% CI) | 0.56 [0.39, 0.82] |
| 25.3 Unspecified or mixed anaemic status at start of supplementation | 2 | 164 | Risk Ratio (M‐H, Random, 95% CI) | 0.14 [0.07, 0.29] |
| 26 Maternal iron deficiency at term (as defined by trialists, based on any indicator of iron status at 37 weeks' gestation or more): SUBGROUP ANALYSIS by dose of iron Show forest plot | 7 | 1256 | Risk Ratio (M‐H, Random, 95% CI) | 0.43 [0.27, 0.66] |
| 26.1 Low daily dose (30 mg elemental iron or less) | 3 | 703 | Risk Ratio (M‐H, Random, 95% CI) | 0.52 [0.34, 0.78] |
| 26.2 Medium daily dose (31 to 59 mg elemental iron) | 1 | 241 | Risk Ratio (M‐H, Random, 95% CI) | 0.92 [0.73, 1.17] |
| 26.3 Higher daily dose (60 mg elemental iron and above) | 3 | 312 | Risk Ratio (M‐H, Random, 95% CI) | 0.21 [0.10, 0.41] |
| 27 Maternal iron deficiency at term (as defined by trialists, based on any indicator of iron status at 37 weeks' gestation or more): SUBGROUP ANALYSIS by malarial status of setting Show forest plot | 7 | 1256 | Risk Ratio (M‐H, Random, 95% CI) | 0.43 [0.27, 0.66] |
| 27.1 Malarial setting | 2 | 192 | Risk Ratio (M‐H, Random, 95% CI) | 0.28 [0.15, 0.53] |
| 27.2 Non‐malarial setting | 5 | 1064 | Risk Ratio (M‐H, Random, 95% CI) | 0.49 [0.30, 0.78] |
| 28 Maternal iron‐deficiency anaemia at term (Hb less than 110 g/L and at least one additional laboratory indicators at 37 weeks' gestation or more) (ALL) Show forest plot | 6 | 1088 | Risk Ratio (M‐H, Random, 95% CI) | 0.33 [0.16, 0.69] |
| 29 Maternal iron‐deficiency anaemia at term (Hb less than 110 g/L and at least one additional laboratory indicators at 37 weeks' gestation or more): SUBGROUP ANALYSIS by gestational age at the start of supplementation Show forest plot | 6 | 1088 | Risk Ratio (M‐H, Random, 95% CI) | 0.33 [0.16, 0.69] |
| 29.1 Early gestational age (less than 20 weeks of gestation or pre‐pregnancy) at start of supplementation | 4 | 660 | Risk Ratio (M‐H, Random, 95% CI) | 0.39 [0.13, 1.11] |
| 29.2 Late gestational age (20 weeks or more of gestation) at start of supplementation | 2 | 428 | Risk Ratio (M‐H, Random, 95% CI) | 0.25 [0.11, 0.58] |
| 29.3 Unspecified or mixed gestational age at start of supplementation | 0 | 0 | Risk Ratio (M‐H, Random, 95% CI) | 0.0 [0.0, 0.0] |
| 30 Maternal iron‐deficiency anaemia at term (Hb less than 110 g/L and at least one additional laboratory indicators at 37 weeks' gestation or more): SUBGROUP ANALYSIS by anaemia status at the start of supplementation Show forest plot | 6 | 1088 | Risk Ratio (M‐H, Random, 95% CI) | 0.33 [0.16, 0.69] |
| 30.1 Anaemic at start of supplementation | 0 | 0 | Risk Ratio (M‐H, Random, 95% CI) | 0.0 [0.0, 0.0] |
| 30.2 Non‐anaemic at start of supplementation | 5 | 968 | Risk Ratio (M‐H, Random, 95% CI) | 0.39 [0.20, 0.74] |
| 30.3 Unspecified or mixed anaemic status at start of supplementation | 1 | 120 | Risk Ratio (M‐H, Random, 95% CI) | 0.04 [0.00, 0.72] |
| 31 Maternal iron‐deficiency anaemia at term (Hb less than 110 g/L and at least one additional laboratory indicators at 37 weeks' gestation or more): SUBGROUP ANALYSIS by dose of iron Show forest plot | 6 | 1088 | Risk Ratio (M‐H, Random, 95% CI) | 0.33 [0.16, 0.69] |
| 31.1 Daily low dose (60 mg elemental iron or less) | 3 | 579 | Risk Ratio (M‐H, Random, 95% CI) | 0.38 [0.13, 1.11] |
| 31.2 Medium dose (31 to 59 mg elemental iron) | 1 | 241 | Risk Ratio (M‐H, Random, 95% CI) | 0.34 [0.16, 0.70] |
| 31.3 High dose (60 mg elemental iron and above) | 2 | 268 | Risk Ratio (M‐H, Random, 95% CI) | 0.04 [0.00, 0.72] |
| 32 Maternal iron‐deficiency anaemia at term (Hb less than 110 g/L and at least one additional laboratory indicators at 37 weeks' gestation or more): SUBGROUP ANALYSIS by malarial status of setting Show forest plot | 6 | 1088 | Risk Ratio (M‐H, Random, 95% CI) | 0.33 [0.16, 0.69] |
| 32.1 Malarial setting | 1 | 148 | Risk Ratio (M‐H, Random, 95% CI) | 0.0 [0.0, 0.0] |
| 32.2 Non‐malarial setting | 5 | 940 | Risk Ratio (M‐H, Random, 95% CI) | 0.33 [0.16, 0.69] |
| 33 Maternal death (death while pregnant or within 42 days of termination of pregnancy) (ALL) Show forest plot | 1 | 47 | Risk Ratio (M‐H, Random, 95% CI) | 0.0 [0.0, 0.0] |
| 34 Side effects (any reported throughout the intervention period) (ALL) Show forest plot | 9 | 1677 | Risk Ratio (M‐H, Random, 95% CI) | 1.59 [1.00, 2.52] |
| 35 Side effects (any reported throughout the intervention period): SUBGROUP ANALYSIS by gestational age at the start of supplementation Show forest plot | 9 | 1677 | Risk Ratio (M‐H, Random, 95% CI) | 1.59 [1.00, 2.52] |
| 35.1 Early gestational age (less than 20 weeks of gestation or pre‐pregnancy) at start of supplementation | 3 | 438 | Risk Ratio (M‐H, Random, 95% CI) | 1.38 [0.87, 2.19] |
| 35.2 Late gestational age (20 weeks or more of gestation) at start of supplementation | 5 | 1034 | Risk Ratio (M‐H, Random, 95% CI) | 1.42 [0.89, 2.28] |
| 35.3 Unspecified or mixed gestational age at start of supplementation | 1 | 205 | Risk Ratio (M‐H, Random, 95% CI) | 62.79 [3.89, 1013.31] |
| 36 Side effects (any reported throughout the intervention period): SUBGROUP ANALYSIS by anaemia status at the start of supplementation Show forest plot | 9 | 1677 | Risk Ratio (M‐H, Random, 95% CI) | 1.59 [1.00, 2.52] |
| 36.1 Anaemic at start of supplementation | 0 | 0 | Risk Ratio (M‐H, Random, 95% CI) | 0.0 [0.0, 0.0] |
| 36.2 Non‐anaemic at start of supplementation | 5 | 900 | Risk Ratio (M‐H, Random, 95% CI) | 1.08 [0.91, 1.28] |
| 36.3 Unspecified or mixed anaemic status at start of supplementation | 4 | 777 | Risk Ratio (M‐H, Random, 95% CI) | 5.11 [0.78, 33.60] |
| 37 Side effects (any reported throughout the intervention period): SUBGROUP ANALYSIS by dose of iron Show forest plot | 9 | 1677 | Risk Ratio (M‐H, Random, 95% CI) | 1.58 [1.02, 2.43] |
| 37.1 Low daily dose (30 mg elemental iron or less) | 4 | 785 | Risk Ratio (M‐H, Random, 95% CI) | 1.07 [0.90, 1.26] |
| 37.2 Medium daily dose (31 to 59 mg elemental iron) | 2 | 225 | Risk Ratio (M‐H, Random, 95% CI) | 2.00 [0.66, 6.02] |
| 37.3 Higher daily dose (60 mg elemental iron and above) | 5 | 667 | Risk Ratio (M‐H, Random, 95% CI) | 5.53 [0.81, 37.89] |
| 38 Side effects (any reported throughout the intervention period): SUBGROUP ANALYSIS by malarial status of setting Show forest plot | 9 | 1677 | Risk Ratio (M‐H, Random, 95% CI) | 1.59 [1.00, 2.52] |
| 38.1 Malarial setting | 1 | 205 | Risk Ratio (M‐H, Random, 95% CI) | 62.79 [3.89, 1013.31] |
| 38.2 Non‐malarial setting | 8 | 1472 | Risk Ratio (M‐H, Random, 95% CI) | 1.40 [0.99, 1.97] |
| 39 Maternal severe anaemia at any time during second and third trimester (Hb less than 70 g/L) (ALL) Show forest plot | 7 | 1078 | Risk Ratio (M‐H, Random, 95% CI) | 0.75 [0.02, 29.10] |
| 40 Maternal severe anaemia at any time during second and third trimester (Hb less than 70 g/L): SUBGROUP ANALYSIS by gestational age at the start of supplementation Show forest plot | 7 | 1078 | Risk Ratio (M‐H, Random, 95% CI) | 0.75 [0.02, 29.10] |
| 40.1 Early gestational age (less than 20 weeks of gestation or pre‐pregnancy) at start of supplementation | 3 | 416 | Risk Ratio (M‐H, Random, 95% CI) | 0.0 [0.0, 0.0] |
| 40.2 Late gestational age (20 weeks or more of gestation) at start of supplementation | 3 | 513 | Risk Ratio (M‐H, Random, 95% CI) | 0.75 [0.02, 29.10] |
| 40.3 Unspecified or mixed gestational age at start of supplementation | 1 | 149 | Risk Ratio (M‐H, Random, 95% CI) | 0.0 [0.0, 0.0] |
| 41 Maternal severe anaemia at any time during second and third trimester (Hb less than 70 g/L): SUBGROUP ANALYSIS by anaemia status age at the start of supplementation Show forest plot | 7 | 1078 | Risk Ratio (M‐H, Random, 95% CI) | 0.75 [0.02, 29.10] |
| 41.1 Anaemic at start of supplementation | 0 | 0 | Risk Ratio (M‐H, Random, 95% CI) | 0.0 [0.0, 0.0] |
| 41.2 Non‐anaemic at start of supplementation | 5 | 816 | Risk Ratio (M‐H, Random, 95% CI) | 4.98 [0.24, 103.01] |
| 41.3 Unspecified or mixed anaemic status at start of supplementation | 2 | 262 | Risk Ratio (M‐H, Random, 95% CI) | 0.12 [0.01, 2.21] |
| 42 Maternal severe anaemia at any time during second and third trimester (Hb less than 70 g/L): SUBGROUP ANALYSIS by dose of iron Show forest plot | 7 | 1078 | Risk Ratio (M‐H, Random, 95% CI) | 0.75 [0.02, 29.10] |
| 42.1 Low daily dose (30 mg elemental iron or less) | 3 | 654 | Risk Ratio (M‐H, Random, 95% CI) | 4.98 [0.24, 103.01] |
| 42.2 Medium daily dose (31 to 59 mg elemental iron) | 0 | 0 | Risk Ratio (M‐H, Random, 95% CI) | 0.0 [0.0, 0.0] |
| 42.3 Higher daily dose (60 mg elemental iron and above) | 4 | 424 | Risk Ratio (M‐H, Random, 95% CI) | 0.12 [0.01, 2.21] |
| 43 Maternal severe anaemia at any time during second and third trimester (Hb less than 70 g/L): SUBGROUP ANALYSIS by malarial status of setting Show forest plot | 7 | 1078 | Risk Ratio (M‐H, Random, 95% CI) | 0.75 [0.02, 29.10] |
| 43.1 Malarial setting | 1 | 55 | Risk Ratio (M‐H, Random, 95% CI) | 0.12 [0.01, 2.21] |
| 43.2 Non‐malarial setting | 6 | 1023 | Risk Ratio (M‐H, Random, 95% CI) | 4.98 [0.24, 103.01] |
| 44 Maternal clinical malaria | 0 | 0 | Risk Ratio (M‐H, Random, 95% CI) | 0.0 [0.0, 0.0] |
| 45 Infection during pregnancy (including urinary tract infections) (ALL) | 0 | 0 | Risk Ratio (M‐H, Random, 95% CI) | 0.0 [0.0, 0.0] |
| 46 Very low birthweight (less than 1500 g) (ALL) Show forest plot | 3 | 697 | Risk Ratio (M‐H, Random, 95% CI) | 0.55 [0.03, 9.07] |
| 47 Very premature birth (less than 34 weeks' gestation) (ALL) Show forest plot | 3 | 690 | Risk Ratio (M‐H, Random, 95% CI) | 0.32 [0.10, 1.09] |
| 48 Infant Hb concentration in the first 6 months (in g/L, counting the last reported measure after birth within this period) (ALL) Show forest plot | 2 | 533 | Mean Difference (IV, Random, 95% CI) | ‐1.25 [‐8.10, 5.59] |
| 49 Infant serum ferritin concentration in the first 6 months (in μg/L, counting the last reported measure after birth within this period) (ALL) Show forest plot | 1 | 197 | Mean Difference (IV, Random, 95% CI) | 11.0 [4.37, 17.63] |
| 50 Admission to special care unit (ALL) Show forest plot | 1 | 111 | Risk Ratio (M‐H, Random, 95% CI) | 0.0 [0.0, 0.0] |
| 51 Maternal anaemia at or near term (Hb less than 110 g/L at 34 weeks' gestation or more) (ALL) Show forest plot | 13 | 1696 | Risk Ratio (M‐H, Random, 95% CI) | 0.29 [0.18, 0.46] |
| 52 Maternal iron deficiency at or near term (as defined by trialists, based on any indicator of iron status at 34 weeks' gestation or more) (ALL) Show forest plot | 7 | 1256 | Risk Ratio (M‐H, Random, 95% CI) | 0.43 [0.27, 0.66] |
| 53 Maternal iron‐deficiency anaemia at or near term (Hb less than 110 g/L and at least one additional laboratory indicators at 34 weeks' gestation or more) (ALL) Show forest plot | 6 | 1088 | Risk Ratio (M‐H, Random, 95% CI) | 0.33 [0.16, 0.69] |
| 54 Maternal Hb concentration at or near term (in g/L, at 34 weeks' gestation or more) (ALL) Show forest plot | 16 | 1851 | Mean Difference (IV, Random, 95% CI) | 8.95 [6.37, 11.53] |
| 55 Maternal Hb concentration within 6 wk postpartum (in g/L) (ALL) Show forest plot | 6 | 659 | Mean Difference (IV, Random, 95% CI) | 7.26 [4.78, 9.74] |
| 56 Maternal high haemoglobin concentrations during second or third trimester (Hb more than 130 g/L) (ALL) Show forest plot | 7 | 1146 | Risk Ratio (M‐H, Random, 95% CI) | 1.90 [1.07, 3.35] |
| 57 Maternal high haemoglobin concentrations at or near term (Hb more than 130 g/L at 34 weeks' gestation or more) (ALL) Show forest plot | 7 | 1189 | Risk Ratio (M‐H, Random, 95% CI) | 3.80 [1.74, 8.28] |
| 58 Moderate anaemia at postpartum (Hb more than 80 g/L and less than 110 g/L) (ALL) Show forest plot | 3 | 453 | Risk Ratio (M‐H, Random, 95% CI) | 0.46 [0.02, 13.91] |
| 59 Maternal severe anaemia at or near term (Hb less than 70 g/L at 34 weeks' gestation or more) (ALL) Show forest plot | 7 | 1046 | Risk Ratio (M‐H, Random, 95% CI) | 0.74 [0.02, 27.81] |
| 60 Severe anaemia at postpartum (Hb less than 80 g/L) (ALL) Show forest plot | 7 | 953 | Risk Ratio (M‐H, Random, 95% CI) | 0.02 [0.00, 0.33] |
| 61 Puerperal infection (ALL) Show forest plot | 2 | 2292 | Risk Ratio (M‐H, Random, 95% CI) | 0.65 [0.41, 1.03] |
| 62 Antepartum haemorrhage (ALL) Show forest plot | 1 | 430 | Risk Ratio (M‐H, Random, 95% CI) | 2.97 [0.12, 72.56] |
| 63 Postpartum haemorrhage (ALL) Show forest plot | 3 | 761 | Risk Ratio (M‐H, Random, 95% CI) | 0.82 [0.51, 1.34] |
| 64 Transfusion provided (ALL) Show forest plot | 1 | 32 | Risk Ratio (M‐H, Random, 95% CI) | 0.33 [0.01, 7.62] |
| 65 Diarrhoea (ALL) Show forest plot | 1 | 173 | Risk Ratio (M‐H, Random, 95% CI) | 0.98 [0.09, 10.61] |
| 66 Constipation (ALL) Show forest plot | 2 | 580 | Risk Ratio (M‐H, Random, 95% CI) | 0.88 [0.18, 4.40] |
| 67 Nausea (ALL) Show forest plot | 3 | 650 | Risk Ratio (M‐H, Random, 95% CI) | 2.38 [0.49, 11.52] |
| 68 Heartburn (ALL) Show forest plot | 1 | 408 | Risk Ratio (M‐H, Random, 95% CI) | 1.0 [0.82, 1.22] |
| 69 Vomiting (ALL) Show forest plot | 2 | 477 | Risk Ratio (M‐H, Random, 95% CI) | 0.88 [0.38, 2.07] |
| 70 Maternal wellbeing/satisfaction (ALL) Show forest plot | 1 | 49 | Risk Ratio (M‐H, Random, 95% CI) | 0.91 [0.77, 1.08] |
| 71 Placental abruption (ALL) Show forest plot | 1 | 1442 | Risk Ratio (M‐H, Random, 95% CI) | 2.88 [0.12, 70.53] |
| 72 Premature rupture of membranes (ALL) Show forest plot | 1 | 72 | Risk Ratio (M‐H, Random, 95% CI) | 0.2 [0.01, 4.03] |
| 73 Pre‐eclampsia (ALL) Show forest plot | 1 | 47 | Risk Ratio (M‐H, Random, 95% CI) | 0.96 [0.06, 14.43] |
| Outcome or subgroup title | No. of studies | No. of participants | Statistical method | Effect size |
| 1 Low birthweight (less than 2500 g) (ALL) Show forest plot | 2 | 1311 | Risk Ratio (M‐H, Random, 95% CI) | 1.07 [0.31, 3.74] |
| 2 Birthweight (ALL) Show forest plot | 2 | 1365 | Mean Difference (IV, Random, 95% CI) | 57.73 [7.66, 107.79] |
| 3 Preterm birth (less than 37 weeks of gestation) (ALL) Show forest plot | 3 | 1497 | Risk Ratio (M‐H, Random, 95% CI) | 1.55 [0.40, 6.00] |
| 4 Preterm birth (less than 37 weeks of gestation): SUBGROUP ANALYSIS by gestational age at the start of supplementation Show forest plot | 3 | 1410 | Risk Ratio (M‐H, Random, 95% CI) | 1.55 [0.40, 6.00] |
| 4.1 Early gestational age (less than 20 weeks of gestation or pre‐pregnancy) at start of supplementation | 2 | 1366 | Risk Ratio (M‐H, Random, 95% CI) | 1.55 [0.40, 6.00] |
| 4.2 Late gestational age (20 weeks or more of gestation) at start of supplementation | 0 | 0 | Risk Ratio (M‐H, Random, 95% CI) | 0.0 [0.0, 0.0] |
| 4.3 Unspecified or mixed gestational age at start of supplementation | 1 | 44 | Risk Ratio (M‐H, Random, 95% CI) | 0.0 [0.0, 0.0] |
| 5 Preterm birth (less than 37 weeks of gestation): SUBGROUP ANALYSIS by anaemia status at the start of supplementation Show forest plot | 3 | 1497 | Risk Ratio (M‐H, Random, 95% CI) | 1.55 [0.40, 6.00] |
| 5.1 Anaemic at start of supplementation | 0 | 0 | Risk Ratio (M‐H, Random, 95% CI) | 0.0 [0.0, 0.0] |
| 5.2 Non‐anaemic at start of supplementation | 0 | 0 | Risk Ratio (M‐H, Random, 95% CI) | 0.0 [0.0, 0.0] |
| 5.3 Unspecified or mixed anaemic status at start of supplementation | 3 | 1497 | Risk Ratio (M‐H, Random, 95% CI) | 1.55 [0.40, 6.00] |
| 6 Preterm birth (less than 37 weeks of gestation): SUBGROUP ANALYSIS by dose of iron Show forest plot | 3 | 1497 | Risk Ratio (M‐H, Random, 95% CI) | 1.55 [0.40, 6.00] |
| 6.1 Low daily dose (30 mg elemental iron or less) | 1 | 131 | Risk Ratio (M‐H, Random, 95% CI) | 0.0 [0.0, 0.0] |
| 6.2 Medium daily dose (31 to 59 mg elemental iron) | 0 | 0 | Risk Ratio (M‐H, Random, 95% CI) | 0.0 [0.0, 0.0] |
| 6.3 Higher daily dose (60 mg elemental iron and above) | 2 | 1366 | Risk Ratio (M‐H, Random, 95% CI) | 1.55 [0.40, 6.00] |
| 7 Preterm birth (less than 37 weeks of gestation): SUBGROUP ANALYSIS by malarial status of setting Show forest plot | 3 | 1497 | Risk Ratio (M‐H, Random, 95% CI) | 1.55 [0.40, 6.00] |
| 7.1 Malarial setting | 2 | 1449 | Risk Ratio (M‐H, Random, 95% CI) | 1.13 [0.92, 1.39] |
| 7.2 Non‐malarial setting | 1 | 48 | Risk Ratio (M‐H, Random, 95% CI) | 7.00 [0.38, 128.61] |
| 8 Neonatal death (within 28 days after delivery) (ALL) Show forest plot | 3 | 1793 | Risk Ratio (M‐H, Random, 95% CI) | 0.81 [0.51, 1.30] |
| 9 Neonatal death (within 28 days after delivery): SUBGROUP ANALYSIS by gestational age at start of supplementation Show forest plot | 3 | 1793 | Risk Ratio (M‐H, Random, 95% CI) | 0.81 [0.51, 1.30] |
| 9.1 Early gestational age (less than 20 weeks of gestation or pre‐pregnancy) at start of supplementation | 3 | 1793 | Risk Ratio (M‐H, Random, 95% CI) | 0.81 [0.51, 1.30] |
| 9.2 Late gestational age (20 weeks or more of gestation) at start of supplementation | 0 | 0 | Risk Ratio (M‐H, Random, 95% CI) | 0.0 [0.0, 0.0] |
| 9.3 Unspecified or mixed gestational age at start of supplementation | 0 | 0 | Risk Ratio (M‐H, Random, 95% CI) | 0.0 [0.0, 0.0] |
| 10 Neonatal death (within 28 days after delivery): SUBGROUP ANALYSIS by anaemia status at start of supplementation Show forest plot | 3 | 1793 | Risk Ratio (M‐H, Random, 95% CI) | 0.81 [0.51, 1.30] |
| 10.1 Anaemic at start of supplementation | 0 | 0 | Risk Ratio (M‐H, Random, 95% CI) | 0.0 [0.0, 0.0] |
| 10.2 Non‐anaemic at start of supplementation | 1 | 97 | Risk Ratio (M‐H, Random, 95% CI) | 2.5 [0.10, 59.88] |
| 10.3 Unspecified or mixed anaemic status at start of supplementation | 2 | 1696 | Risk Ratio (M‐H, Random, 95% CI) | 0.79 [0.49, 1.27] |
| 11 Neonatal death (within 28 days after delivery): SUBGROUP ANALYSIS by dose of iron Show forest plot | 3 | 1793 | Risk Ratio (M‐H, Random, 95% CI) | 0.81 [0.51, 1.30] |
| 11.1 Low daily dose (30 mg elemental iron or less) | 0 | 0 | Risk Ratio (M‐H, Random, 95% CI) | 0.0 [0.0, 0.0] |
| 11.2 Medium daily dose (31 to 59 mg elemental iron) | 0 | 0 | Risk Ratio (M‐H, Random, 95% CI) | 0.0 [0.0, 0.0] |
| 11.3 Higher daily dose (60 mg elemental iron and above) | 3 | 1793 | Risk Ratio (M‐H, Random, 95% CI) | 0.81 [0.51, 1.30] |
| 12 Neonatal death (within 28 days after delivery): SUBGROUP ANALYSIS by malarial status of setting Show forest plot | 3 | 1793 | Risk Ratio (M‐H, Random, 95% CI) | 0.81 [0.51, 1.30] |
| 12.1 Malarial setting | 1 | 1648 | Risk Ratio (M‐H, Random, 95% CI) | 0.79 [0.49, 1.27] |
| 12.2 Non‐malarial setting | 2 | 145 | Risk Ratio (M‐H, Random, 95% CI) | 2.5 [0.10, 59.88] |
| 13 Congenital anomalies (ALL) Show forest plot | 1 | 1652 | Risk Ratio (M‐H, Random, 95% CI) | 0.70 [0.35, 1.40] |
| 14 Maternal anaemia at term (Hb less than 110 g/L at 37 weeks' gestation or more) (ALL) Show forest plot | 3 | 346 | Risk Ratio (M‐H, Random, 95% CI) | 0.34 [0.21, 0.54] |
| 15 Maternal anaemia at term (Hb less than 110 g/L at 37 weeks' gestation or more): SUBGROUP ANALYSIS by gestational age at the start of supplementation Show forest plot | 3 | 346 | Risk Ratio (M‐H, Random, 95% CI) | 0.34 [0.21, 0.54] |
| 15.1 Early gestational age (less than 20 weeks of gestation or pre‐pregnancy) at start of supplementation | 1 | 97 | Risk Ratio (M‐H, Random, 95% CI) | 0.0 [0.0, 0.0] |
| 15.2 Late gestational age (20 weeks or more of gestation) at start of supplementation | 2 | 249 | Risk Ratio (M‐H, Random, 95% CI) | 0.34 [0.21, 0.54] |
| 15.3 Unspecified or mixed gestational age at start of supplementation | 0 | 0 | Risk Ratio (M‐H, Random, 95% CI) | 0.0 [0.0, 0.0] |
| 16 Maternal anaemia at term (Hb less than 110 g/L at 37 weeks' gestation or more): SUBGROUP ANALYSIS by anaemia status at the start of supplementation Show forest plot | 3 | 346 | Risk Ratio (M‐H, Random, 95% CI) | 0.34 [0.21, 0.54] |
| 16.1 Anaemic at start of supplementation | 0 | 0 | Risk Ratio (M‐H, Random, 95% CI) | 0.0 [0.0, 0.0] |
| 16.2 Non‐anaemic at start of supplementation | 2 | 280 | Risk Ratio (M‐H, Random, 95% CI) | 0.24 [0.09, 0.68] |
| 16.3 Unspecified or mixed anaemic status at start of supplementation | 1 | 66 | Risk Ratio (M‐H, Random, 95% CI) | 0.37 [0.22, 0.62] |
| 17 Maternal anaemia at term (Hb less than 110 g/Lat 37 weeks' gestation or more): SUBGROUP ANALYSIS by dose of iron Show forest plot | 3 | 346 | Risk Ratio (M‐H, Random, 95% CI) | 0.34 [0.21, 0.54] |
| 17.1 Low daily dose (30 mg elemental iron or less) | 0 | 0 | Risk Ratio (M‐H, Random, 95% CI) | 0.0 [0.0, 0.0] |
| 17.2 Medium daily dose (31 to 59 mg elemental iron) | 0 | 0 | Risk Ratio (M‐H, Random, 95% CI) | 0.0 [0.0, 0.0] |
| 17.3 Higher daily dose (60 mg elemental iron and above) | 3 | 346 | Risk Ratio (M‐H, Random, 95% CI) | 0.34 [0.21, 0.54] |
| 18 Maternal anaemia at term (Hb less than 110 g/L at 37 weeks' gestation or more): SUBGROUP ANALYSIS by malarial status of setting Show forest plot | 3 | 346 | Risk Ratio (M‐H, Random, 95% CI) | 0.34 [0.21, 0.54] |
| 18.1 Malarial setting | 1 | 66 | Risk Ratio (M‐H, Random, 95% CI) | 0.37 [0.22, 0.62] |
| 18.2 Non‐malarial setting | 2 | 280 | Risk Ratio (M‐H, Random, 95% CI) | 0.24 [0.09, 0.68] |
| 19 Maternal iron deficiency at term (as defined by trialists, based on any indicator of iron status at 37 weeks' gestation or more) (ALL) Show forest plot | 1 | 131 | Risk Ratio (M‐H, Random, 95% CI) | 0.24 [0.06, 0.99] |
| 20 Maternal iron‐deficiency anaemia at term (Hb less than 110 g/L and at least one additional laboratory indicators at 37 weeks' gestation or more) (ALL) Show forest plot | 1 | 131 | Risk Ratio (M‐H, Random, 95% CI) | 0.43 [0.17, 1.09] |
| 21 Maternal death (death while pregnant or within 42 days of termination of pregnancy) (ALL) Show forest plot | 1 | 131 | Risk Ratio (M‐H, Random, 95% CI) | 0.0 [0.0, 0.0] |
| 22 Side effects (any reported throughout the intervention period) (ALL) Show forest plot | 1 | 456 | Risk Ratio (M‐H, Random, 95% CI) | 44.32 [2.77, 709.09] |
| 23 Maternal severe anaemia at any time during second and third trimester (Hb less than 70 g/L) (ALL) Show forest plot | 4 | 506 | Risk Ratio (M‐H, Random, 95% CI) | 0.12 [0.02, 0.63] |
| 24 Maternal clinical malaria | 0 | 0 | Risk Ratio (M‐H, Random, 95% CI) | 0.0 [0.0, 0.0] |
| 25 Infection during pregnancy (including urinary tract infections) (ALL) Show forest plot | 1 | 48 | Risk Ratio (M‐H, Random, 95% CI) | 1.0 [0.15, 6.53] |
| 26 Very low birthweight (less than 1500 g) (ALL) Show forest plot | 1 | 48 | Risk Ratio (M‐H, Random, 95% CI) | 5.0 [0.25, 98.96] |
| 27 Very premature birth (less than 34 weeks' gestation) (ALL) Show forest plot | 2 | 92 | Risk Ratio (M‐H, Random, 95% CI) | 5.0 [0.25, 98.96] |
| 28 Infant Hb concentration in the first 6 months (in g/L, counting the last reported measure after birth within this period) (ALL) | 0 | 0 | Mean Difference (IV, Random, 95% CI) | 0.0 [0.0, 0.0] |
| 29 Infant serum ferritin concentration in the first 6 months (in μg/L, counting the last reported measure after birth within this period) (ALL) | 0 | 0 | Mean Difference (IV, Random, 95% CI) | 0.0 [0.0, 0.0] |
| 30 Admission to special care unit (ALL) Show forest plot | 1 | 48 | Risk Ratio (M‐H, Random, 95% CI) | 0.0 [0.0, 0.0] |
| 31 Maternal anaemia at or near term (Hb less than 110 g/L at 34 weeks' gestation or more) (ALL) Show forest plot | 3 | 346 | Risk Ratio (M‐H, Random, 95% CI) | 0.34 [0.21, 0.54] |
| 32 Maternal iron deficiency at or near term (as defined by trialists, based on any indicator of iron status at 34 weeks' gestation or more) (ALL) Show forest plot | 1 | 131 | Risk Ratio (M‐H, Random, 95% CI) | 0.24 [0.06, 0.99] |
| 33 Maternal iron‐deficiency anaemia at or near term (Hb less than 110 g/L and at least one additional laboratory indicators at 34 weeks' gestation or more) (ALL) Show forest plot | 1 | 131 | Risk Ratio (M‐H, Random, 95% CI) | 0.43 [0.17, 1.09] |
| 34 Maternal Hb concentration at term or near term (in g/L, at 34 weeks' gestation or more) (ALL) Show forest plot | 3 | 140 | Mean Difference (IV, Random, 95% CI) | 16.13 [12.74, 19.52] |
| 35 Maternal Hb concentration within 6 wk postpartum (g/L) (ALL) Show forest plot | 2 | 459 | Mean Difference (IV, Random, 95% CI) | 10.07 [7.33, 12.81] |
| 36 Maternal high haemoglobin concentrations during second or third trimester (Hb more than 130 g/L) (ALL) Show forest plot | 2 | 446 | Risk Ratio (M‐H, Random, 95% CI) | 1.78 [0.63, 5.04] |
| 37 Maternal high haemoglobin concentrations at or near term (Hb more than 130 g/L at 34 weeks' gestation or more) (ALL) Show forest plot | 2 | 314 | Risk Ratio (M‐H, Random, 95% CI) | 4.37 [0.58, 32.71] |
| 38 Moderate anaemia at postpartum (Hb more than 80 g/L and less than 110 g/L) (ALL) Show forest plot | 2 | 458 | Risk Ratio (M‐H, Random, 95% CI) | 0.34 [0.17, 0.69] |
| 39 Maternal severe anaemia at term or near (Hb less than 70 g/L at 34 weeks' gestation or more) (ALL) Show forest plot | 3 | 191 | Risk Ratio (M‐H, Random, 95% CI) | 0.14 [0.01, 2.63] |
| 40 Severe anaemia at postpartum (Hb less than 80 g/L) (ALL) Show forest plot | 3 | 491 | Risk Ratio (M‐H, Random, 95% CI) | 0.05 [0.00, 0.76] |
| 41 Puerperal infection (ALL) Show forest plot | 1 | 2863 | Risk Ratio (M‐H, Random, 95% CI) | 0.55 [0.13, 2.28] |
| 42 Antepartum haemorrhage (ALL) Show forest plot | 2 | 145 | Risk Ratio (M‐H, Random, 95% CI) | 1.25 [0.22, 7.12] |
| 43 Postpartum haemorrhage (ALL) | 0 | 0 | Risk Ratio (M‐H, Random, 95% CI) | 0.0 [0.0, 0.0] |
| 44 Placental abruption (ALL) Show forest plot | 1 | 2863 | Risk Ratio (M‐H, Random, 95% CI) | 8.19 [0.49, 138.16] |
| 45 Pre‐eclampsia (ALL) Show forest plot | 1 | 48 | Risk Ratio (M‐H, Random, 95% CI) | 3.0 [0.13, 70.16] |
| Outcome or subgroup title | No. of studies | No. of participants | Statistical method | Effect size |
| 1 Low birthweight (less than 2500 g) (ALL) Show forest plot | 4 | 16143 | Risk Ratio (M‐H, Random, 95% CI) | 0.88 [0.78, 1.00] |
| 2 Low birthweight (less than 2500 g): SUBGROUP ANALYSIS by gestational age at the start of supplementation Show forest plot | 4 | 16143 | Risk Ratio (M‐H, Random, 95% CI) | 0.88 [0.78, 1.00] |
| 2.1 Early gestational age (less than 20 weeks of gestation or pre‐pregnancy) at start of supplementation | 3 | 13817 | Risk Ratio (M‐H, Random, 95% CI) | 0.91 [0.75, 1.11] |
| 2.2 Late gestational age (20 weeks or more of gestation) at start of supplementation | 0 | 0 | Risk Ratio (M‐H, Random, 95% CI) | 0.0 [0.0, 0.0] |
| 2.3 Unspecified or mixed gestational age at the start of supplementation | 1 | 2326 | Risk Ratio (M‐H, Random, 95% CI) | 0.85 [0.59, 1.22] |
| 3 Low birthweight (less than 2500 g): SUBGROUP ANALYSIS by anaemia status at the start of supplementation Show forest plot | 4 | 16143 | Risk Ratio (M‐H, Random, 95% CI) | 0.88 [0.78, 1.00] |
| 3.1 Anaemic at start of supplementation | 0 | 0 | Risk Ratio (M‐H, Random, 95% CI) | 0.0 [0.0, 0.0] |
| 3.2 Non‐anaemic at start of supplementation | 2 | 12554 | Risk Ratio (M‐H, Random, 95% CI) | 1.04 [0.83, 1.32] |
| 3.3 Unspecified or mixed anaemia status | 2 | 3589 | Risk Ratio (M‐H, Random, 95% CI) | 0.83 [0.72, 0.94] |
| 4 Low birthweight (less than 2500 g): SUBGROUP ANALYSIS by dose of iron Show forest plot | 4 | 16143 | Risk Ratio (M‐H, Random, 95% CI) | 0.88 [0.78, 1.00] |
| 4.1 Low daily dose (30 mg elemental iron or less) | 1 | 11827 | Risk Ratio (M‐H, Random, 95% CI) | 1.03 [0.81, 1.31] |
| 4.2 Medium daily dose (31 to 59 mg elemental iron) | 1 | 727 | Risk Ratio (M‐H, Random, 95% CI) | 1.21 [0.57, 2.54] |
| 4.3 Higher daily dose (60 mg elemental iron and above) | 2 | 3589 | Risk Ratio (M‐H, Random, 95% CI) | 0.83 [0.72, 0.94] |
| 5 Low birthweight (less than 2500 g): SUBGROUP ANALYSIS by malarial status of setting Show forest plot | 4 | 16143 | Risk Ratio (M‐H, Random, 95% CI) | 0.88 [0.78, 1.00] |
| 5.1 Malarial setting | 3 | 4316 | Risk Ratio (M‐H, Random, 95% CI) | 0.84 [0.73, 0.95] |
| 5.2 Non‐malarial setting | 1 | 11827 | Risk Ratio (M‐H, Random, 95% CI) | 1.03 [0.81, 1.31] |
| 6 Birthweight (g) (ALL) Show forest plot | 4 | 16143 | Mean Difference (IV, Random, 95% CI) | 19.50 [‐6.90, 45.89] |
| 7 Birthweight (g): SUBGROUP ANALYSIS by gestational age at the start of supplementation Show forest plot | 4 | 16143 | Mean Difference (IV, Random, 95% CI) | 19.50 [‐6.90, 45.89] |
| 7.1 Early gestational age (less than 20 weeks of gestation or pre‐pregnancy) at start of supplementation | 3 | 13817 | Mean Difference (IV, Random, 95% CI) | 22.47 [‐18.18, 63.12] |
| 7.2 Late gestational age (20 weeks or more of gestation) at start of supplementation | 0 | 0 | Mean Difference (IV, Random, 95% CI) | 0.0 [0.0, 0.0] |
| 7.3 Unspecified or mixed gestational age at the start of supplementation | 1 | 2326 | Mean Difference (IV, Random, 95% CI) | 20.20 [‐15.13, 55.53] |
| 8 Birthweight (g): SUBGROUP ANALYSIS by anaemia status at the start of supplementation Show forest plot | 4 | 16143 | Mean Difference (IV, Random, 95% CI) | 19.50 [‐6.90, 45.89] |
| 8.1 Anaemic at start of supplementation | 0 | 0 | Mean Difference (IV, Random, 95% CI) | 0.0 [0.0, 0.0] |
| 8.2 Non‐anaemic at start of supplementation | 2 | 12554 | Mean Difference (IV, Random, 95% CI) | 2.30 [‐11.42, 16.01] |
| 8.3 Unspecified or mixed anaemic status at start of supplementation | 2 | 3589 | Mean Difference (IV, Random, 95% CI) | 39.61 [‐3.90, 83.13] |
| 9 Birthweight (g): SUBGROUP ANALYSIS by dose of iron Show forest plot | 4 | 16143 | Mean Difference (IV, Random, 95% CI) | 19.50 [‐6.90, 45.89] |
| 9.1 Low daily dose (30 mg elemental iron or less) | 1 | 11827 | Mean Difference (IV, Random, 95% CI) | 1.90 [‐12.17, 15.97] |
| 9.2 Medium daily dose (31 to 59 mg elemental iron) | 1 | 727 | Mean Difference (IV, Random, 95% CI) | 10.0 [‐51.92, 71.92] |
| 9.3 Higher daily dose (60 mg elemental iron and above) | 2 | 3589 | Mean Difference (IV, Random, 95% CI) | 39.61 [‐3.90, 83.13] |
| 10 Birthweight (g): SUBGROUP ANALYSIS by malarial status of setting Show forest plot | 4 | 16143 | Mean Difference (IV, Random, 95% CI) | 19.50 [‐6.90, 45.89] |
| 10.1 Malarial setting | 3 | 4316 | Mean Difference (IV, Random, 95% CI) | 32.23 [0.86, 63.60] |
| 10.2 Non‐malarial setting | 1 | 11827 | Mean Difference (IV, Random, 95% CI) | 1.90 [‐12.17, 15.97] |
| 11 Preterm birth (less than 37 weeks of gestation) (ALL) Show forest plot | 4 | 16146 | Risk Ratio (M‐H, Random, 95% CI) | 0.97 [0.87, 1.08] |
| 12 Preterm birth (less 37 weeks of gestation): SUBGROUP ANALYSIS by gestational age at the start of supplementation Show forest plot | 4 | 16146 | Risk Ratio (M‐H, Random, 95% CI) | 0.97 [0.87, 1.08] |
| 12.1 Early gestational age (less than 20 weeks of gestation or pre‐pregnancy) at start of supplementation | 3 | 13820 | Risk Ratio (M‐H, Random, 95% CI) | 0.99 [0.88, 1.12] |
| 12.2 Late gestational age (20 weeks or more of gestation) at start of supplementation | 0 | 0 | Risk Ratio (M‐H, Random, 95% CI) | 0.0 [0.0, 0.0] |
| 12.3 Unspecified or mixed gestational age at the start of supplementation | 1 | 2326 | Risk Ratio (M‐H, Random, 95% CI) | 0.79 [0.57, 1.09] |
| 13 Preterm birth (less 37 weeks of gestation): SUBGROUP ANALYSIS by anaemia status at the start of supplementation Show forest plot | 4 | 16146 | Risk Ratio (M‐H, Random, 95% CI) | 0.97 [0.87, 1.08] |
| 13.1 Anaemic at start of supplementation | 0 | 0 | Risk Ratio (M‐H, Random, 95% CI) | 0.0 [0.0, 0.0] |
| 13.2 Non‐anaemic at start of supplementation | 2 | 12559 | Risk Ratio (M‐H, Random, 95% CI) | 0.97 [0.84, 1.12] |
| 13.3 Unspecified or mixed anaemic status at start of supplementation | 2 | 3587 | Risk Ratio (M‐H, Random, 95% CI) | 0.93 [0.71, 1.22] |
| 14 Preterm birth (less 37 weeks of gestation): SUBGROUP ANALYSIS by dose of iron Show forest plot | 4 | 16146 | Risk Ratio (M‐H, Random, 95% CI) | 0.97 [0.87, 1.08] |
| 14.1 Low daily dose (30 mg elemental iron or less) | 1 | 11832 | Risk Ratio (M‐H, Random, 95% CI) | 0.96 [0.83, 1.11] |
| 14.2 Medium daily dose (31 to 59 mg elemental iron) | 1 | 727 | Risk Ratio (M‐H, Random, 95% CI) | 1.26 [0.62, 2.56] |
| 14.3 Higher daily dose (60 mg elemental iron and above) | 2 | 3587 | Risk Ratio (M‐H, Random, 95% CI) | 0.93 [0.71, 1.22] |
| 15 Preterm birth (less 37 weeks of gestation): SUBGROUP ANALYSIS by malarial status of setting Show forest plot | 4 | 16146 | Risk Ratio (M‐H, Random, 95% CI) | 0.97 [0.87, 1.08] |
| 15.1 Malarial setting | 3 | 4314 | Risk Ratio (M‐H, Random, 95% CI) | 0.97 [0.78, 1.20] |
| 15.2 Non‐malarial setting | 1 | 11832 | Risk Ratio (M‐H, Random, 95% CI) | 0.96 [0.83, 1.11] |
| 16 Neonatal death (within 28 days after delivery) (ALL) Show forest plot | 4 | 16603 | Risk Ratio (M‐H, Random, 95% CI) | 0.91 [0.71, 1.18] |
| 17 Neonatal death (within 28 days after delivery): SUBGROUP ANALYSIS by gestational age at the start of supplementation Show forest plot | 4 | 16603 | Risk Ratio (M‐H, Random, 95% CI) | 0.91 [0.71, 1.18] |
| 17.1 Early gestational age (less than 20 weeks of gestation or pre‐pregnancy) at start of supplementation | 3 | 14108 | Risk Ratio (M‐H, Random, 95% CI) | 1.00 [0.71, 1.42] |
| 17.2 Late gestational age (20 weeks or more of gestation) at start of supplementation | 0 | 0 | Risk Ratio (M‐H, Random, 95% CI) | 0.0 [0.0, 0.0] |
| 17.3 Unspecified or mixed gestational age at the start of supplementation | 1 | 2495 | Risk Ratio (M‐H, Random, 95% CI) | 0.81 [0.56, 1.19] |
| 18 Neonatal death (within 28 days after delivery) : SUBGROUP ANALYSIS by anaemia status at the start of supplementation Show forest plot | 4 | 16603 | Risk Ratio (M‐H, Random, 95% CI) | 0.91 [0.71, 1.18] |
| 18.1 Anaemic at start of supplementation | 0 | 0 | Risk Ratio (M‐H, Random, 95% CI) | 0.0 [0.0, 0.0] |
| 18.2 Non‐anaemic at start of supplementation | 2 | 12559 | Risk Ratio (M‐H, Random, 95% CI) | 0.94 [0.51, 1.77] |
| 18.3 Unspecified or mixed anaemic status at start of supplementation | 2 | 4044 | Risk Ratio (M‐H, Random, 95% CI) | 0.88 [0.65, 1.19] |
| 19 Neonatal death (within 28 days after delivery): SUBGROUP ANALYSIS by dose of iron Show forest plot | 4 | 16603 | Risk Ratio (M‐H, Random, 95% CI) | 0.91 [0.71, 1.18] |
| 19.1 Low daily dose (30 mg elemental iron or less) | 1 | 11832 | Risk Ratio (M‐H, Random, 95% CI) | 1.10 [0.67, 1.82] |
| 19.2 Medium daily dose (31 to 59 mg elemental iron) | 1 | 727 | Risk Ratio (M‐H, Random, 95% CI) | 0.48 [0.12, 1.91] |
| 19.3 Higher daily dose (60 mg elemental iron and above) | 2 | 4044 | Risk Ratio (M‐H, Random, 95% CI) | 0.88 [0.65, 1.19] |
| 20 Neonatal death (within 28 days after delivery): SUBGROUP ANALYSIS by malarial status of setting Show forest plot | 4 | 16603 | Risk Ratio (M‐H, Random, 95% CI) | 0.91 [0.71, 1.18] |
| 20.1 Malarial setting | 3 | 4771 | Risk Ratio (M‐H, Random, 95% CI) | 0.85 [0.63, 1.15] |
| 20.2 Non‐malarial setting | 1 | 11832 | Risk Ratio (M‐H, Random, 95% CI) | 1.10 [0.67, 1.82] |
| 21 Congenital anomalies (ALL) Show forest plot | 2 | 13586 | Risk Ratio (M‐H, Random, 95% CI) | 0.78 [0.44, 1.39] |
| 22 Maternal anaemia at term (Hb less than 110 g/L at 37 weeks' gestation or more) (ALL) Show forest plot | 2 | 303 | Risk Ratio (M‐H, Random, 95% CI) | 0.34 [0.21, 0.55] |
| 23 Maternal anaemia at term (Hb less than 110 g/L at 37 weeks' gestation or more): SUBGROUP ANALYSIS by gestational age at the start of supplementation Show forest plot | 2 | 303 | Risk Ratio (M‐H, Random, 95% CI) | 0.34 [0.21, 0.55] |
| 23.1 Early gestational age (less than 20 weeks of gestation or pre‐pregnancy) at start of supplementation | 0 | 0 | Risk Ratio (M‐H, Random, 95% CI) | 0.0 [0.0, 0.0] |
| 23.2 Late gestational age (20 weeks or more of gestation) at start of supplementation | 2 | 303 | Risk Ratio (M‐H, Random, 95% CI) | 0.34 [0.21, 0.55] |
| 23.3 Unspecified or mixed gestational age at start of supplementation | 0 | 0 | Risk Ratio (M‐H, Random, 95% CI) | 0.0 [0.0, 0.0] |
| 24 Maternal anaemia at term (Hb less than 110 g/L at 37 weeks' gestation or more): SUBGROUP ANALYSIS by anaemia status at the start of supplementation Show forest plot | 2 | 303 | Risk Ratio (M‐H, Random, 95% CI) | 0.34 [0.21, 0.55] |
| 24.1 Anaemic at start of supplementation | 0 | 0 | Risk Ratio (M‐H, Random, 95% CI) | 0.0 [0.0, 0.0] |
| 24.2 Non‐anaemic at start of supplementation | 1 | 240 | Risk Ratio (M‐H, Random, 95% CI) | 0.24 [0.09, 0.61] |
| 24.3 Unspecified or mixed anaemic status at start of supplementation | 1 | 63 | Risk Ratio (M‐H, Random, 95% CI) | 0.39 [0.23, 0.67] |
| 25 Maternal anaemia at term (Hb less than 110 g/L at 37 weeks' gestation or more ): SUBGROUP ANALYSIS by dose of iron Show forest plot | 2 | 303 | Risk Ratio (M‐H, Random, 95% CI) | 0.34 [0.21, 0.55] |
| 25.1 Low daily dose (30 mg elemental iron or less) | 0 | 0 | Risk Ratio (M‐H, Random, 95% CI) | 0.0 [0.0, 0.0] |
| 25.2 Medium daily dose (31 to 59 mg elemental iron) | 0 | 0 | Risk Ratio (M‐H, Random, 95% CI) | 0.0 [0.0, 0.0] |
| 25.3 Higher daily dose (60 mg elemental iron and above) | 2 | 303 | Risk Ratio (M‐H, Random, 95% CI) | 0.34 [0.21, 0.55] |
| 26 Maternal anaemia at term (Hb less than 110 g/L at 37 weeks' gestation or more ): SUBGROUP ANALYSIS by malarial status of setting Show forest plot | 2 | 303 | Risk Ratio (M‐H, Random, 95% CI) | 0.34 [0.21, 0.55] |
| 26.1 Malarial setting | 1 | 63 | Risk Ratio (M‐H, Random, 95% CI) | 0.39 [0.23, 0.67] |
| 26.2 Non‐malarial setting | 1 | 240 | Risk Ratio (M‐H, Random, 95% CI) | 0.24 [0.09, 0.61] |
| 27 Maternal iron deficiency at term (as defined by trialists, based on any indicator of iron status at 37 weeks' gestation or more) (ALL) | 0 | 0 | Risk Ratio (M‐H, Random, 95% CI) | 0.0 [0.0, 0.0] |
| 28 Maternal iron‐deficiency anaemia at term (Hb less than 110 g/L and at least one additional laboratory indicators at 37 weeks' gestation or more) (ALL) Show forest plot | 1 | 727 | Risk Ratio (M‐H, Random, 95% CI) | 0.0 [0.0, 0.0] |
| 29 Maternal death (death while pregnant or within 42 days of termination of pregnancy) (ALL) | 0 | 0 | Risk Ratio (M‐H, Random, 95% CI) | 0.0 [0.0, 0.0] |
| 30 Side effects (any reported throughout the intervention period) (ALL) Show forest plot | 1 | 727 | Risk Ratio (M‐H, Random, 95% CI) | 1.10 [0.55, 2.23] |
| 31 Maternal severe anaemia at any time during second and third trimester (Hb less than 70 g/L) (ALL) Show forest plot | 3 | 1047 | Risk Ratio (M‐H, Random, 95% CI) | 0.06 [0.01, 0.47] |
| 32 Maternal clinical malaria | 0 | 0 | Risk Ratio (M‐H, Random, 95% CI) | 0.0 [0.0, 0.0] |
| 33 Infection during pregnancy (including urinary tract infections) (ALL) Show forest plot | 1 | 727 | Risk Ratio (M‐H, Random, 95% CI) | 1.21 [0.33, 4.46] |
| 34 Very low birthweight (less than 1500 g) (ALL) Show forest plot | 2 | 1990 | Risk Ratio (M‐H, Random, 95% CI) | 0.76 [0.28, 2.01] |
| 35 Very premature birth (less than 34 weeks' gestation) (ALL) Show forest plot | 2 | 3053 | Risk Ratio (M‐H, Random, 95% CI) | 0.58 [0.30, 1.12] |
| 36 Infant Hb concentration in the first 6 months (in g/L, counting the last reported measure after birth within this period) (ALL) | 0 | 0 | Mean Difference (IV, Random, 95% CI) | 0.0 [0.0, 0.0] |
| 37 Infant serum ferritin concentration in the first 6 months (in μg/L, counting the last reported measure after birth within this period) (ALL) | 0 | 0 | Mean Difference (IV, Random, 95% CI) | 0.0 [0.0, 0.0] |
| 38 Admission to special care unit (ALL) | 0 | 0 | Risk Ratio (M‐H, Random, 95% CI) | 0.0 [0.0, 0.0] |
| 39 Maternal anaemia at or near term (Hb less than 110 g/L at 34 weeks' gestation or more) (ALL) Show forest plot | 2 | 303 | Risk Ratio (M‐H, Random, 95% CI) | 0.34 [0.21, 0.55] |
| 40 Maternal iron deficiency at or near term (as defined by trialists, based on any indicator of iron status at 34 weeks' gestation or more) (ALL) | 0 | 0 | Risk Ratio (M‐H, Random, 95% CI) | 0.0 [0.0, 0.0] |
| 41 Maternal iron‐deficiency anaemia at or near term (Hb less than 110 g/L and at least one additional laboratory indicators at 34 weeks' gestation or more) (ALL) Show forest plot | 1 | 727 | Risk Ratio (M‐H, Random, 95% CI) | 0.0 [0.0, 0.0] |
| 42 Maternal Hb concentration at or near term (in g/L at 34 weeks' gestation or more) (ALL) Show forest plot | 2 | 771 | Mean Difference (IV, Random, 95% CI) | 12.44 [0.95, 23.93] |
| 43 Maternal Hb concentration within 6 wk postpartum (in g/L) (ALL) Show forest plot | 1 | 297 | Mean Difference (IV, Random, 95% CI) | 9.20 [5.78, 12.62] |
| 44 Maternal high haemoglobin concentrations during second or third trimester (Hb more than 130 g/L) (ALL) Show forest plot | 2 | 1042 | Risk Ratio (M‐H, Random, 95% CI) | 4.33 [2.26, 8.30] |
| 45 Maternal high haemoglobin concentrations at or near term (Hb more than 130 g/L at 34 weeks' gestation or more) (ALL) Show forest plot | 2 | 967 | Risk Ratio (M‐H, Random, 95% CI) | 1.87 [0.32, 10.84] |
| 46 Moderate anaemia at postpartum (Hb more than 80 g/L and less than 110 g/L) (ALL) Show forest plot | 1 | 353 | Risk Ratio (M‐H, Random, 95% CI) | 0.38 [0.18, 0.81] |
| 47 Maternal severe anaemia at or near term (Hb less than 70 g/L at 34 weeks' gestation or more) (ALL) Show forest plot | 2 | 773 | Risk Ratio (M‐H, Random, 95% CI) | 0.0 [0.0, 0.0] |
| 48 Severe anaemia at postpartum (Hb less than 80 g/L) (ALL) Show forest plot | 2 | 386 | Risk Ratio (M‐H, Random, 95% CI) | 0.08 [0.00, 1.33] |
| 49 Puerperal infection (ALL) Show forest plot | 1 | 727 | Risk Ratio (M‐H, Random, 95% CI) | 0.96 [0.20, 4.75] |
| 50 Antepartum haemorrhage (ALL) Show forest plot | 1 | 727 | Risk Ratio (M‐H, Random, 95% CI) | 1.35 [0.43, 4.22] |
| 51 Postpartum haemorrhage (ALL) Show forest plot | 1 | 727 | Risk Ratio (M‐H, Random, 95% CI) | 3.38 [0.71, 16.15] |
| 52 Transfusion provided (ALL) Show forest plot | 1 | 727 | Risk Ratio (M‐H, Random, 95% CI) | 2.89 [0.12, 70.83] |
| 53 Diarrhoea (ALL) Show forest plot | 1 | 727 | Risk Ratio (M‐H, Random, 95% CI) | 0.55 [0.16, 1.87] |
| 54 Constipation (ALL) Show forest plot | 1 | 727 | Risk Ratio (M‐H, Random, 95% CI) | 1.10 [0.55, 2.23] |
| 55 Nausea (ALL) Show forest plot | 1 | 727 | Risk Ratio (M‐H, Random, 95% CI) | 0.96 [0.47, 1.99] |
| 56 Heartburn (ALL) Show forest plot | 1 | 727 | Risk Ratio (M‐H, Random, 95% CI) | 1.65 [0.66, 4.15] |
| 57 Vomiting (ALL) | 0 | 0 | Risk Ratio (M‐H, Random, 95% CI) | 0.0 [0.0, 0.0] |
| 58 Maternal wellbeing/satisfaction (ALL) | 0 | 0 | Risk Ratio (M‐H, Random, 95% CI) | 0.0 [0.0, 0.0] |
| 59 Placental abruption (ALL) Show forest plot | 1 | 727 | Risk Ratio (M‐H, Random, 95% CI) | 0.96 [0.24, 3.83] |
| 60 Premature rupture of membranes (ALL) Show forest plot | 1 | 727 | Risk Ratio (M‐H, Random, 95% CI) | 0.99 [0.74, 1.34] |
| 61 Pre‐eclampsia (ALL) Show forest plot | 1 | 727 | Risk Ratio (M‐H, Random, 95% CI) | 3.22 [0.89, 11.59] |
| 62 Mental development index in infants at 3 months | 0 | 0 | Mean Difference (IV, Random, 95% CI) | 0.0 [0.0, 0.0] |
| 63 Mental development index in infants at 6 months | 0 | 0 | Mean Difference (IV, Random, 95% CI) | 0.0 [0.0, 0.0] |
| 64 Mental development index in infants at 12 months | 0 | 0 | Mean Difference (IV, Random, 95% CI) | 0.0 [0.0, 0.0] |
| 65 Mental development index in infants at 18 months | 0 | 0 | Mean Difference (IV, Random, 95% CI) | 0.0 [0.0, 0.0] |
| 66 Mental development index in infants at 24 months | 0 | 0 | Mean Difference (IV, Random, 95% CI) | 0.0 [0.0, 0.0] |
| 67 Mental development index in infants at 18 months | 0 | 0 | Mean Difference (IV, Random, 95% CI) | 0.0 [0.0, 0.0] |
| 68 Psychomotor development index in infants at 3 months | 0 | 0 | Mean Difference (IV, Random, 95% CI) | 0.0 [0.0, 0.0] |
| 69 Psychomotor development index in infants at 6 months | 0 | 0 | Mean Difference (IV, Random, 95% CI) | 0.0 [0.0, 0.0] |
| 70 Psychomotor development index in infants at 12 months | 0 | 0 | Mean Difference (IV, Random, 95% CI) | 0.0 [0.0, 0.0] |
| 71 Psychomotor development index in infants at 24 months | 0 | 0 | Mean Difference (IV, Random, 95% CI) | 0.0 [0.0, 0.0] |
| Outcome or subgroup title | No. of studies | No. of participants | Statistical method | Effect size |
| 1 Low birthweight (less than 2500 g) (ALL) Show forest plot | 1 | 334 | Risk Ratio (M‐H, Random, 95% CI) | 0.51 [0.22, 1.15] |
| 2 Birthweight (g) (ALL) Show forest plot | 2 | 1116 | Mean Difference (IV, Random, 95% CI) | 55.70 [3.42, 107.97] |
| 3 Preterm birth (less than 37 weeks of gestation) (ALL) Show forest plot | 2 | 1127 | Risk Ratio (M‐H, Random, 95% CI) | 0.66 [0.41, 1.04] |
| 4 Neonatal death (within 28 days after delivery) (ALL) | 0 | 0 | Risk Ratio (M‐H, Random, 95% CI) | 0.0 [0.0, 0.0] |
| 5 Congenital anomalies (ALL) | 0 | 0 | Risk Ratio (M‐H, Random, 95% CI) | 0.0 [0.0, 0.0] |
| 6 Maternal anaemia at term (Hb less than 110 g/L at 37 weeks' gestation or more) (ALL) | 0 | 0 | Risk Ratio (M‐H, Random, 95% CI) | 0.0 [0.0, 0.0] |
| 7 Maternal iron deficiency at term (as defined by trialists, based on any indicator of iron status at 37 weeks' gestation or more)(ALL) | 0 | 0 | Risk Ratio (M‐H, Random, 95% CI) | 0.0 [0.0, 0.0] |
| 8 Maternal iron‐deficiency anaemia at term (Hb less than 110 g/L and at least one additional laboratory indicators at 37 weeks' gestation or more) (ALL) | 0 | 0 | Risk Ratio (M‐H, Random, 95% CI) | 0.0 [0.0, 0.0] |
| 9 Maternal death (death while pregnant or within 42 days of termination of pregnancy) (ALL) | 0 | 0 | Risk Ratio (M‐H, Random, 95% CI) | 0.0 [0.0, 0.0] |
| 10 Side effects (any reported throughout the intervention period) (ALL) Show forest plot | 1 | 188 | Risk Ratio (M‐H, Random, 95% CI) | 0.77 [0.55, 1.07] |
| 11 Maternal severe anaemia at any time during second and third trimester (Hb less than 70 g/L) (ALL) | 0 | 0 | Risk Ratio (M‐H, Random, 95% CI) | 0.0 [0.0, 0.0] |
| 12 Maternal clinical malaria | 0 | 0 | Risk Ratio (M‐H, Random, 95% CI) | 0.0 [0.0, 0.0] |
| 13 Infection during pregnancy (including urinary tract infections) (ALL) | 0 | 0 | Risk Ratio (M‐H, Random, 95% CI) | 0.0 [0.0, 0.0] |
| 14 Very low birthweight (less than 1500 g) (ALL) | 0 | 0 | Risk Ratio (M‐H, Random, 95% CI) | 0.0 [0.0, 0.0] |
| 15 Very premature birth (less than 34 weeks' gestation) (ALL) | 0 | 0 | Risk Ratio (M‐H, Random, 95% CI) | 0.0 [0.0, 0.0] |
| 16 Infant Hb concentration in the first 6 months (in g/L, counting the last reported measure after birth within this period) (ALL) | 0 | 0 | Mean Difference (IV, Random, 95% CI) | 0.0 [0.0, 0.0] |
| 17 Infant serum ferritin concentration in the first 6 months (in μg/L, counting the last reported measure after birth within this period) (ALL) | 0 | 0 | Mean Difference (IV, Random, 95% CI) | 0.0 [0.0, 0.0] |
| 18 Admission to special care unit (ALL) | 0 | 0 | Risk Ratio (M‐H, Random, 95% CI) | 0.0 [0.0, 0.0] |
| 19 Maternal anaemia at or near term (Hb less than 110 g/L at 34 weeks' gestation or more) (ALL) | 0 | 0 | Risk Ratio (M‐H, Random, 95% CI) | 0.0 [0.0, 0.0] |
| 20 Maternal iron deficiency at or near term (as defined by trialists, based on any indicator of iron status at 34 weeks' gestation or more)(ALL) | 0 | 0 | Risk Ratio (M‐H, Random, 95% CI) | 0.0 [0.0, 0.0] |
| 21 Maternal iron‐deficiency anaemia at or near term (Hb less than 110 g/L and at least one additional laboratory indicators at 34 weeks' gestation or more) (ALL) | 0 | 0 | Risk Ratio (M‐H, Random, 95% CI) | 0.0 [0.0, 0.0] |
| 22 Maternal Hb concentration at or near term (in g/L at 34 weeks' gestation or more) (ALL) Show forest plot | 2 | 809 | Mean Difference (IV, Random, 95% CI) | 10.85 [7.29, 14.42] |
| 23 Maternal Hb concentration within 6 wk postpartum (in g/L) (ALL) Show forest plot | 1 | 27 | Mean Difference (IV, Random, 95% CI) | 14.0 [3.56, 24.44] |
| 24 Maternal high haemoglobin concentrations during second or third trimester (Hb more than 130 g/L) (ALL) | 0 | 0 | Risk Ratio (M‐H, Random, 95% CI) | 0.0 [0.0, 0.0] |
| 25 Maternal high haemoglobin concentrations at or near term (Hb more than 130 g/L at 34 weeks' gestation or more) (ALL) | 0 | 0 | Risk Ratio (M‐H, Random, 95% CI) | 0.0 [0.0, 0.0] |
| 26 Moderate anaemia at postpartum (Hb more than 80 g/L and less than 110 g/L) (ALL) | 0 | 0 | Risk Ratio (M‐H, Random, 95% CI) | 0.0 [0.0, 0.0] |
| 27 Maternal severe anaemia at or near term (Hb less than 70 g/L at 34 weeks' gestation or more) (ALL) | 0 | 0 | Risk Ratio (M‐H, Random, 95% CI) | 0.0 [0.0, 0.0] |
| 28 Severe anaemia at postpartum (Hb less than 80 g/L) (ALL) | 0 | 0 | Risk Ratio (M‐H, Random, 95% CI) | 0.0 [0.0, 0.0] |
| 29 Puerperal infection (ALL) | 0 | 0 | Risk Ratio (M‐H, Random, 95% CI) | 0.0 [0.0, 0.0] |
| 30 Antepartum haemorrhage (ALL) | 0 | 0 | Risk Ratio (M‐H, Random, 95% CI) | 0.0 [0.0, 0.0] |
| 31 Postpartum haemorrhage (ALL) | 0 | 0 | Risk Ratio (M‐H, Random, 95% CI) | 0.0 [0.0, 0.0] |
| 32 Transfusion provided (ALL) | 0 | 0 | Risk Ratio (M‐H, Random, 95% CI) | 0.0 [0.0, 0.0] |
| 33 Constipation (ALL) Show forest plot | 1 | 188 | Risk Ratio (M‐H, Random, 95% CI) | 0.77 [0.55, 1.07] |
| 34 Nausea (ALL) | 0 | 0 | Risk Ratio (M‐H, Random, 95% CI) | 0.0 [0.0, 0.0] |
| 35 Heartburn (ALL) Show forest plot | 1 | 188 | Risk Ratio (M‐H, Random, 95% CI) | 1.49 [0.95, 2.34] |
| 36 Vomiting (ALL) Show forest plot | 1 | 188 | Risk Ratio (M‐H, Random, 95% CI) | 1.13 [0.58, 2.20] |
| 37 Diarrhoea (ALL) Show forest plot | 1 | 188 | Risk Ratio (M‐H, Random, 95% CI) | 0.53 [0.29, 0.96] |
| 38 Maternal wellbeing/satisfaction (ALL) | 0 | 0 | Risk Ratio (M‐H, Random, 95% CI) | 0.0 [0.0, 0.0] |
| 39 Placental abruption (ALL) Show forest plot | 1 | 782 | Risk Ratio (M‐H, Random, 95% CI) | 1.81 [0.46, 7.20] |
| 40 Premature rupture of membranes (ALL) Show forest plot | 1 | 782 | Risk Ratio (M‐H, Random, 95% CI) | 0.79 [0.44, 1.41] |
| 41 Pre‐eclampsia (ALL) Show forest plot | 1 | 782 | Risk Ratio (M‐H, Random, 95% CI) | 1.45 [0.67, 3.16] |