| 1 Low birthweight (less than 2500 g) (ALL) Show forest plot | 4 | 1147 | Risk Ratio (M‐H, Random, 95% CI) | 0.59 [0.23, 1.49] |
|
| 2 Low birthweight (less than 2500 g) (BY SUBGROUPS) Show forest plot | 4 | | Risk Ratio (M‐H, Random, 95% CI) | Subtotals only |
|
| 2.1 Early gestational age (less than 20 weeks of gestation or pre‐pregnancy) at start of supplementation | 2 | 643 | Risk Ratio (M‐H, Random, 95% CI) | 0.59 [0.12, 2.96] |
| 2.2 Late gestational age (20 weeks or more of gestation) at start of supplementation | 2 | 504 | Risk Ratio (M‐H, Random, 95% CI) | 0.55 [0.22, 1.38] |
| 2.4 Non‐anaemic at start of supplementation | 3 | 697 | Risk Ratio (M‐H, Random, 95% CI) | 0.59 [0.12, 2.96] |
| 2.6 Unspecified/mixed anaemic status at start of supplementation | 1 | 450 | Risk Ratio (M‐H, Random, 95% CI) | 0.55 [0.22, 1.38] |
| 2.8 Daily lower dose (60 mg elemental iron or less) | 4 | 1147 | Risk Ratio (M‐H, Random, 95% CI) | 0.59 [0.23, 1.49] |
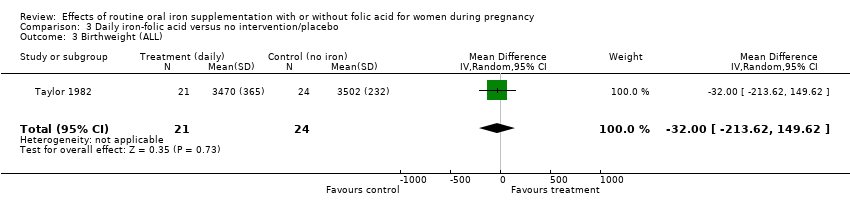
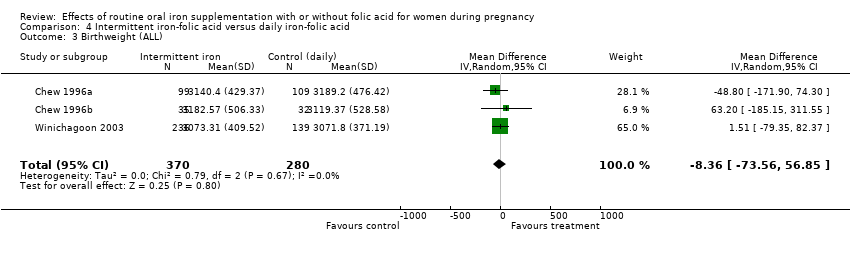
| 3 Birthweight (g) (ALL) Show forest plot | 5 | 925 | Mean Difference (IV, Random, 95% CI) | 22.49 [‐99.35, 144.34] |
|
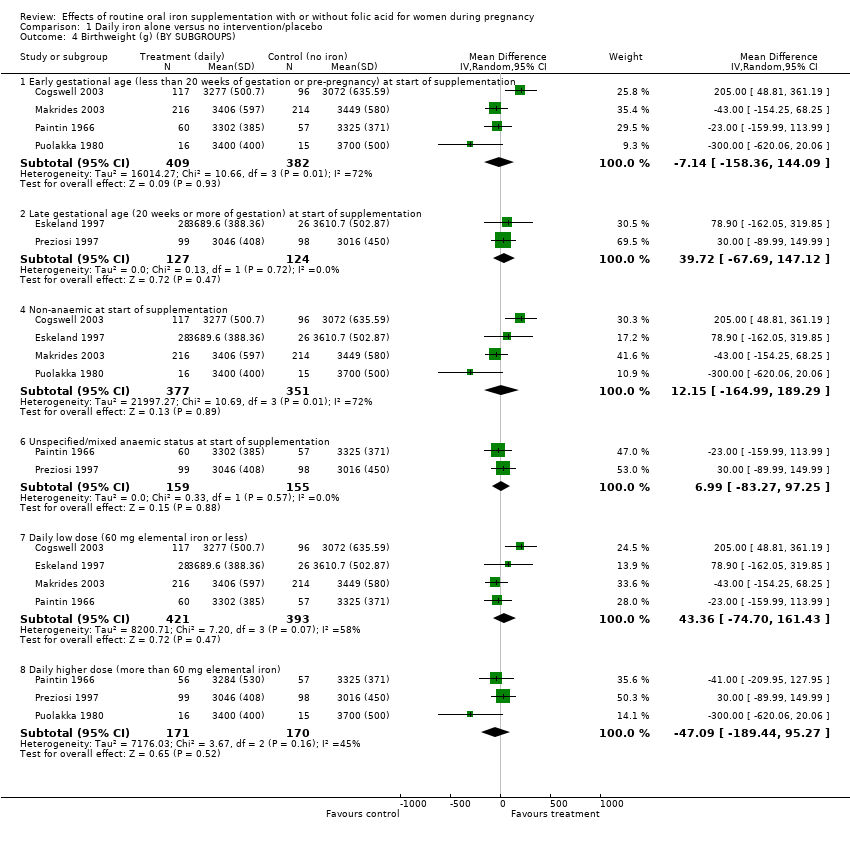
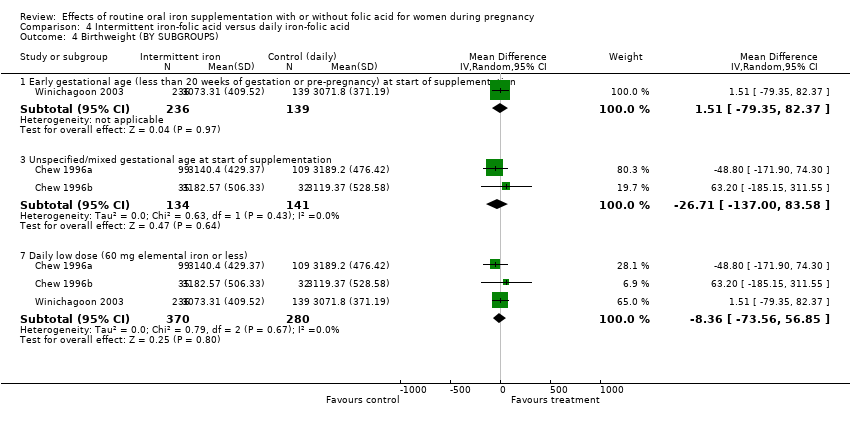
| 4 Birthweight (g) (BY SUBGROUPS) Show forest plot | 6 | | Mean Difference (IV, Random, 95% CI) | Subtotals only |
|
| 4.1 Early gestational age (less than 20 weeks of gestation or pre‐pregnancy) at start of supplementation | 4 | 791 | Mean Difference (IV, Random, 95% CI) | ‐7.14 [‐158.36, 144.09] |
| 4.2 Late gestational age (20 weeks or more of gestation) at start of supplementation | 2 | 251 | Mean Difference (IV, Random, 95% CI) | 39.72 [‐67.69, 147.12] |
| 4.4 Non‐anaemic at start of supplementation | 4 | 728 | Mean Difference (IV, Random, 95% CI) | 12.15 [‐164.99, 189.29] |
| 4.6 Unspecified/mixed anaemic status at start of supplementation | 2 | 314 | Mean Difference (IV, Random, 95% CI) | 6.99 [‐83.27, 97.25] |
| 4.7 Daily low dose (60 mg elemental iron or less) | 4 | 814 | Mean Difference (IV, Random, 95% CI) | 43.36 [‐74.70, 161.43] |
| 4.8 Daily higher dose (more than 60 mg elemental iron) | 3 | 341 | Mean Difference (IV, Random, 95% CI) | ‐47.09 [‐189.44, 95.27] |
| 5 Premature delivery (less than 37 weeks of gestation) (ALL) Show forest plot | 3 | 690 | Risk Ratio (M‐H, Random, 95% CI) | 0.76 [0.47, 1.24] |
|
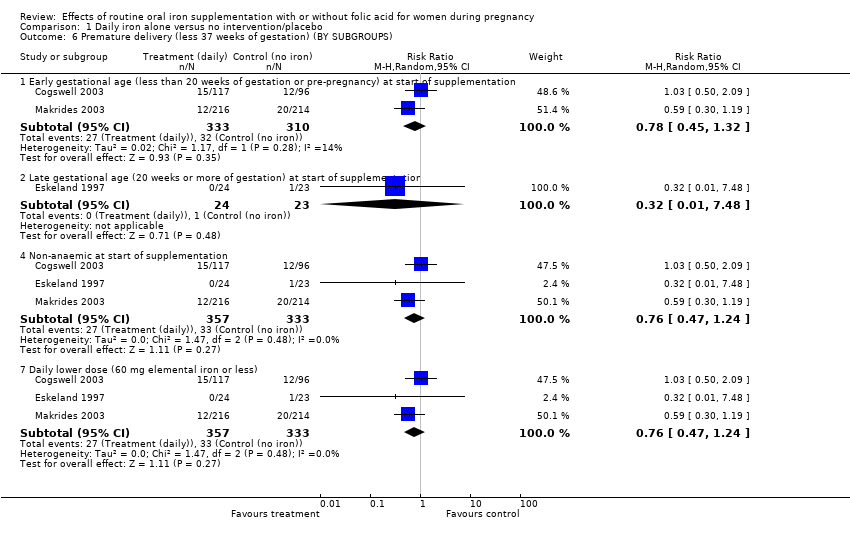
| 6 Premature delivery (less 37 weeks of gestation) (BY SUBGROUPS) Show forest plot | 3 | | Risk Ratio (M‐H, Random, 95% CI) | Subtotals only |
|
| 6.1 Early gestational age (less than 20 weeks of gestation or pre‐pregnancy) at start of supplementation | 2 | 643 | Risk Ratio (M‐H, Random, 95% CI) | 0.78 [0.45, 1.32] |
| 6.2 Late gestational age (20 weeks or more of gestation) at start of supplementation | 1 | 47 | Risk Ratio (M‐H, Random, 95% CI) | 0.32 [0.01, 7.48] |
| 6.4 Non‐anaemic at start of supplementation | 3 | 690 | Risk Ratio (M‐H, Random, 95% CI) | 0.76 [0.47, 1.24] |
| 6.7 Daily lower dose (60 mg elemental iron or less) | 3 | 690 | Risk Ratio (M‐H, Random, 95% CI) | 0.76 [0.47, 1.24] |
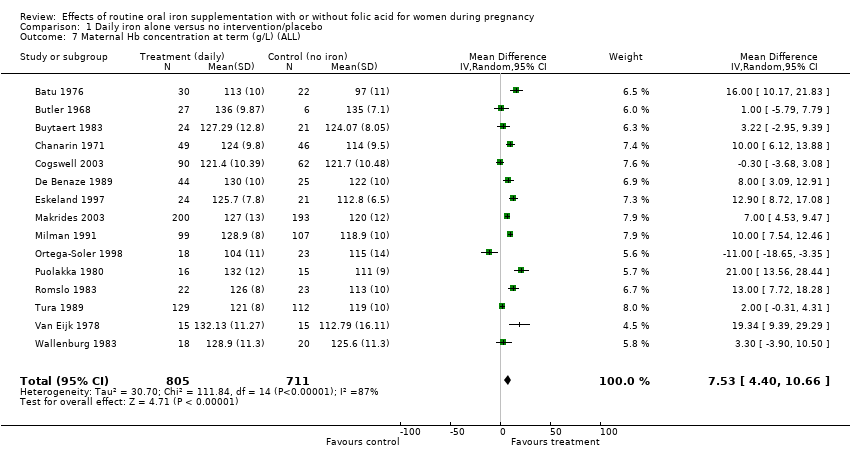
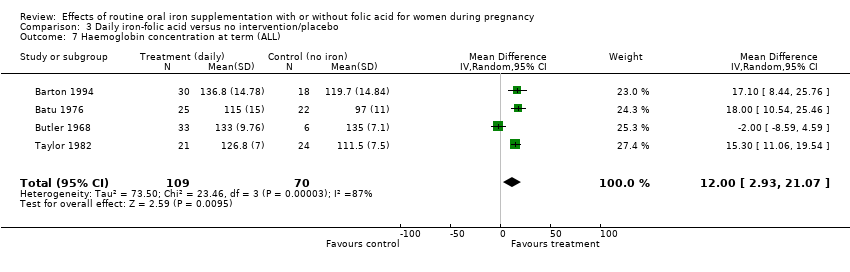
| 7 Maternal Hb concentration at term (g/L) (ALL) Show forest plot | 15 | 1516 | Mean Difference (IV, Random, 95% CI) | 7.53 [4.40, 10.66] |
|
| 8 Maternal Hb concentration at term (g/L) (BY SUBGROUPS) Show forest plot | 15 | | Mean Difference (IV, Random, 95% CI) | Subtotals only |
|
| 8.1 Early gestational age (less than 20 weeks of gestation or pre‐pregnancy) at start of supplementation | 11 | 1345 | Mean Difference (IV, Random, 95% CI) | 8.05 [4.85, 11.25] |
| 8.2 Late gestational age (20 weeks or more of gestation) at start of supplementation | 3 | 130 | Mean Difference (IV, Random, 95% CI) | 10.24 [2.45, 18.04] |
| 8.3 Unspecified/mixed gestational age at start of supplementation | 1 | 41 | Mean Difference (IV, Random, 95% CI) | ‐11.0 [‐18.65, ‐3.35] |
| 8.4 Non‐anaemic at start of supplementation | 8 | 1014 | Mean Difference (IV, Random, 95% CI) | 6.73 [2.89, 10.57] |
| 8.6 Unspecified/mixed anaemic status at start of supplementation | 7 | 502 | Mean Difference (IV, Random, 95% CI) | 8.40 [3.16, 13.64] |
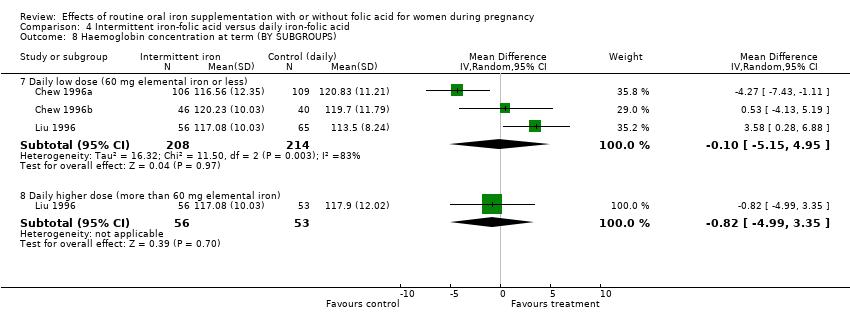
| 8.7 Daily low dose (60 mg elemental iron or less) | 6 | 995 | Mean Difference (IV, Random, 95% CI) | 6.42 [2.63, 10.21] |
| 8.8 Daily higher dose (more than 60 mg elemental iron) | 9 | 521 | Mean Difference (IV, Random, 95% CI) | 8.38 [3.10, 13.66] |
| 9 Anaemia at term (Hb less than 110 g/L) (not pre‐specified) Show forest plot | 13 | 1696 | Risk Ratio (M‐H, Random, 95% CI) | 0.26 [0.16, 0.43] |
|
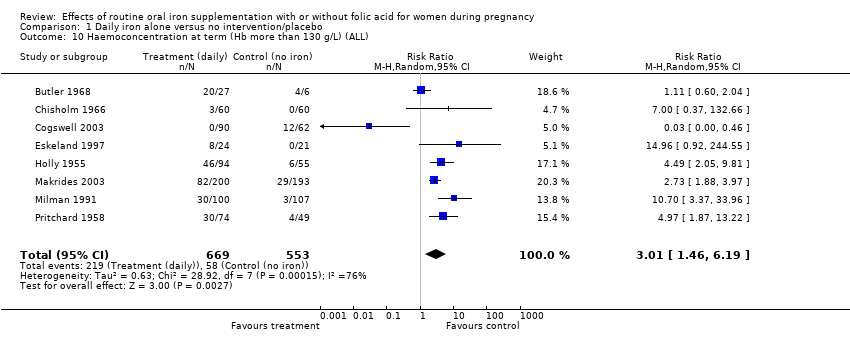
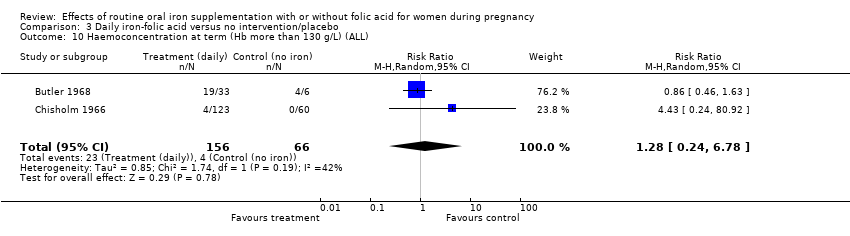
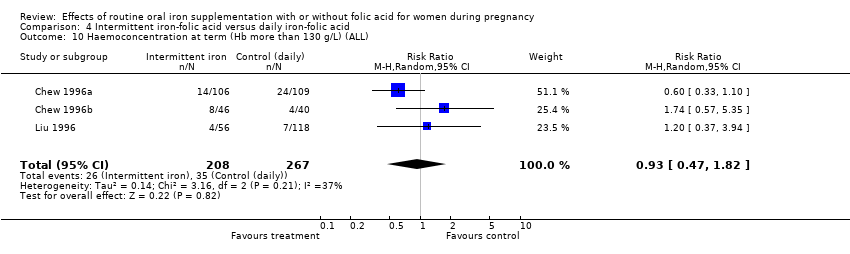
| 10 Haemoconcentration at term (Hb more than 130 g/L) (ALL) Show forest plot | 8 | 1222 | Risk Ratio (M‐H, Random, 95% CI) | 3.01 [1.46, 6.19] |
|
| 11 Haemoconcentration at term (Hb more than 130 g/L) (BY SUBGROUPS) Show forest plot | 8 | | Risk Ratio (M‐H, Random, 95% CI) | Subtotals only |
|
| 11.1 Early gestational age (less than 20 weeks of gestation or pre‐pregnancy) at start of supplementation | 3 | 752 | Risk Ratio (M‐H, Random, 95% CI) | 1.60 [0.22, 11.41] |
| 11.2 Late gestational age (20 weeks or more of gestation) at start of supplementation | 3 | 198 | Risk Ratio (M‐H, Random, 95% CI) | 3.94 [0.31, 50.47] |
| 11.3 Unspecified/mixed gestational age at start of supplementation | 2 | 272 | Risk Ratio (M‐H, Random, 95% CI) | 4.67 [2.53, 8.60] |
| 11.4 Non‐anaemic at start of supplementation | 3 | 590 | Risk Ratio (M‐H, Random, 95% CI) | 1.15 [0.05, 24.75] |
| 11.6 Unspecified/mixed anaemic status at start of supplementation | 5 | 632 | Risk Ratio (M‐H, Random, 95% CI) | 4.03 [1.39, 11.72] |
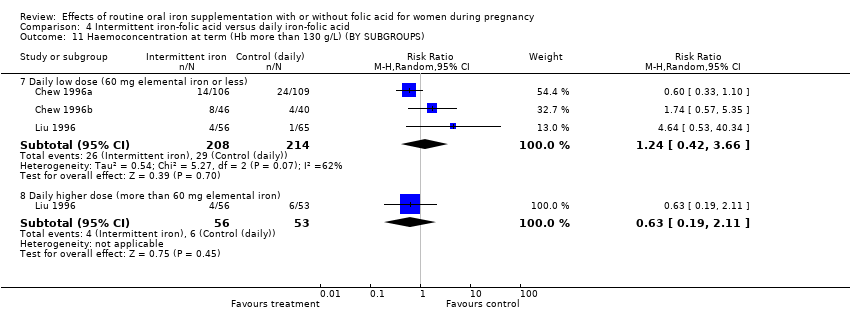
| 11.7 Daily low dose (60 mg elemental iron or less) | 3 | 590 | Risk Ratio (M‐H, Random, 95% CI) | 1.15 [0.05, 24.75] |
| 11.8 Daily higher dose (more than 60 mg elemental iron) | 5 | 632 | Risk Ratio (M‐H, Random, 95% CI) | 4.03 [1.39, 11.72] |
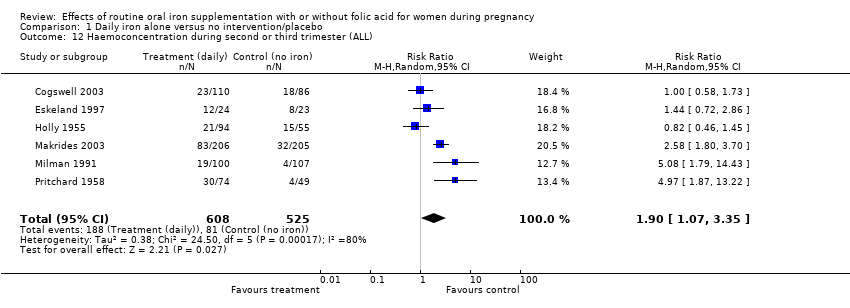
| 12 Haemoconcentration during second or third trimester (ALL) Show forest plot | 6 | 1133 | Risk Ratio (M‐H, Random, 95% CI) | 1.90 [1.07, 3.35] |
|
| 13 Haemoconcentration during second or third trimester (BY SUBGROUPS) Show forest plot | 6 | | Risk Ratio (M‐H, Random, 95% CI) | Subtotals only |
|
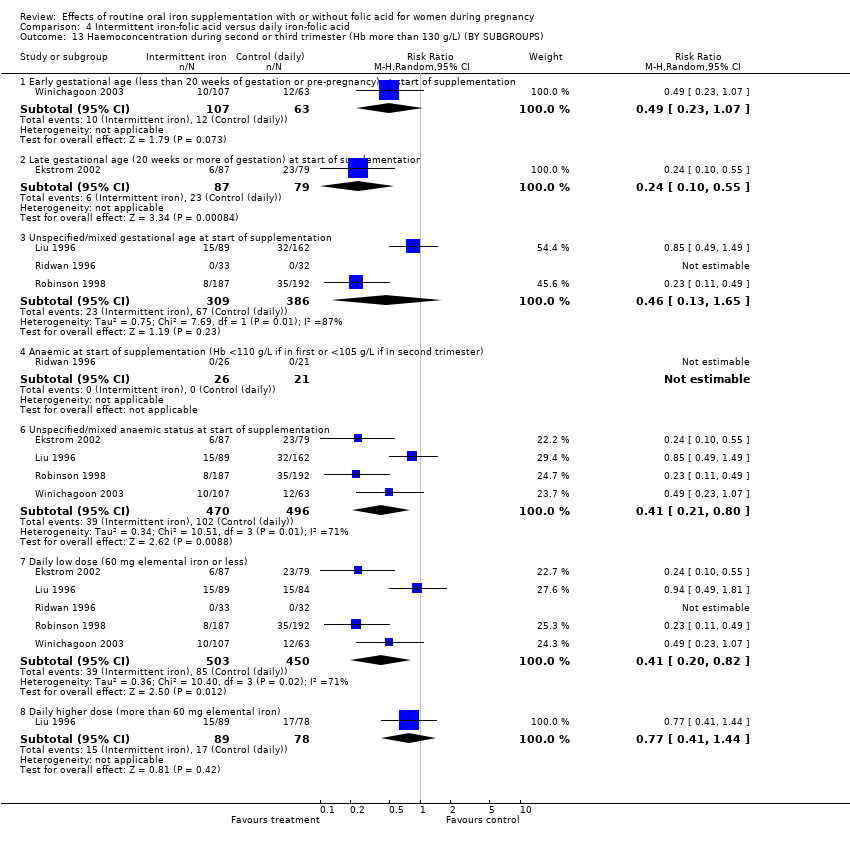
| 13.1 Early gestational age (less than 20 weeks of gestation or pre‐pregnancy) at start of supplementation | 3 | 814 | Risk Ratio (M‐H, Random, 95% CI) | 2.18 [0.97, 4.89] |
| 13.2 Late gestational age (20 weeks or more of gestation) at start of supplementation | 1 | 47 | Risk Ratio (M‐H, Random, 95% CI) | 1.44 [0.72, 2.86] |
| 13.3 Unspecified/mixed gestational age at start of supplementation | 2 | 272 | Risk Ratio (M‐H, Random, 95% CI) | 1.94 [0.30, 12.29] |
| 13.4 Non‐anaemic at start of supplementation | 3 | 654 | Risk Ratio (M‐H, Random, 95% CI) | 1.60 [0.85, 2.99] |
| 13.6 Unspecified/mixed anaemic status at start of supplementation | 3 | 479 | Risk Ratio (M‐H, Random, 95% CI) | 2.61 [0.64, 10.65] |
| 13.7 Daily low dose (60 mg elemental iron or less) | 3 | 654 | Risk Ratio (M‐H, Random, 95% CI) | 1.60 [0.85, 2.99] |
| 13.8 Daily higher dose (more than 60 mg elemental iron) | 3 | 479 | Risk Ratio (M‐H, Random, 95% CI) | 2.61 [0.64, 10.65] |
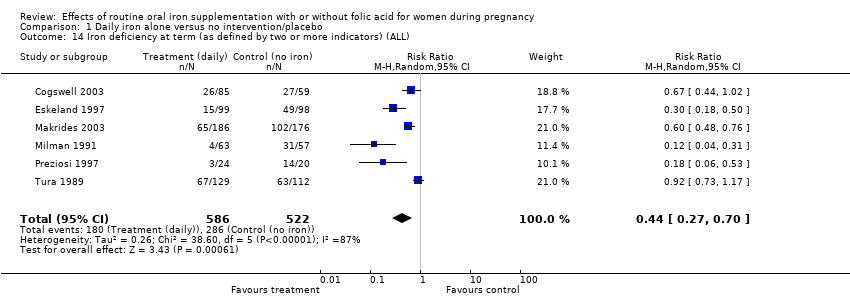
| 14 Iron deficiency at term (as defined by two or more indicators) (ALL) Show forest plot | 6 | 1108 | Risk Ratio (M‐H, Random, 95% CI) | 0.44 [0.27, 0.70] |
|
| 15 Iron deficiency at term (as defined by two or more indicators) (BY SUBGROUPS) Show forest plot | 6 | | Risk Ratio (M‐H, Random, 95% CI) | Subtotals only |
|
| 15.1 Early gestational age (less than 20 weeks of gestation or pre‐pregnancy) at start of supplementation | 4 | 867 | Risk Ratio (M‐H, Random, 95% CI) | 0.56 [0.35, 0.90] |
| 15.2 Late gestational age (20 weeks or more of gestation) at start of supplementation | 2 | 241 | Risk Ratio (M‐H, Random, 95% CI) | 0.28 [0.17, 0.44] |
| 15.4 Non‐anaemic at start of supplementation | 4 | 944 | Risk Ratio (M‐H, Random, 95% CI) | 0.60 [0.41, 0.90] |
| 15.6 Unspecified/mixed anaemic status at start of supplementation | 2 | 164 | Risk Ratio (M‐H, Random, 95% CI) | 0.14 [0.07, 0.29] |
| 15.7 Daily low dose (60 mg elemental iron or less) | 4 | 944 | Risk Ratio (M‐H, Random, 95% CI) | 0.60 [0.41, 0.90] |
| 15.8 Daily higher dose (more than 60 mg elemental iron) | 2 | 164 | Risk Ratio (M‐H, Random, 95% CI) | 0.14 [0.07, 0.29] |
| 16 Iron deficiency anaemia at term (ALL) Show forest plot | 5 | 940 | Risk Ratio (M‐H, Random, 95% CI) | 0.33 [0.16, 0.69] |
|
| 17 Iron deficiency anaemia at term (BY SUBGROUPS) Show forest plot | 5 | | Risk Ratio (M‐H, Random, 95% CI) | Subtotals only |
|
| 17.1 Early gestational age (less than 20 weeks of gestation or pre‐pregnancy) at start of supplementation | 4 | 895 | Risk Ratio (M‐H, Random, 95% CI) | 0.37 [0.18, 0.76] |
| 17.2 Late gestational age (20 weeks or more of gestation) at start of supplementation | 1 | 45 | Risk Ratio (M‐H, Random, 95% CI) | 0.07 [0.00, 1.13] |
| 17.4 Non‐anaemic at start of supplementation | 4 | 820 | Risk Ratio (M‐H, Random, 95% CI) | 0.39 [0.20, 0.74] |
| 17.6 Unspecified/mixed anaemic status at start of supplementation | 1 | 120 | Risk Ratio (M‐H, Random, 95% CI) | 0.04 [0.00, 0.72] |
| 17.7 Daily low dose (60 mg elemental iron or less) | 4 | 820 | Risk Ratio (M‐H, Random, 95% CI) | 0.39 [0.20, 0.74] |
| 17.8 Daily higher dose (more than 60 mg elemental iron) | 1 | 120 | Risk Ratio (M‐H, Random, 95% CI) | 0.04 [0.00, 0.72] |
| 18 Side‐effects (Any) (ALL) Show forest plot | 6 | 1099 | Risk Ratio (M‐H, Random, 95% CI) | 1.90 [1.09, 3.33] |
|
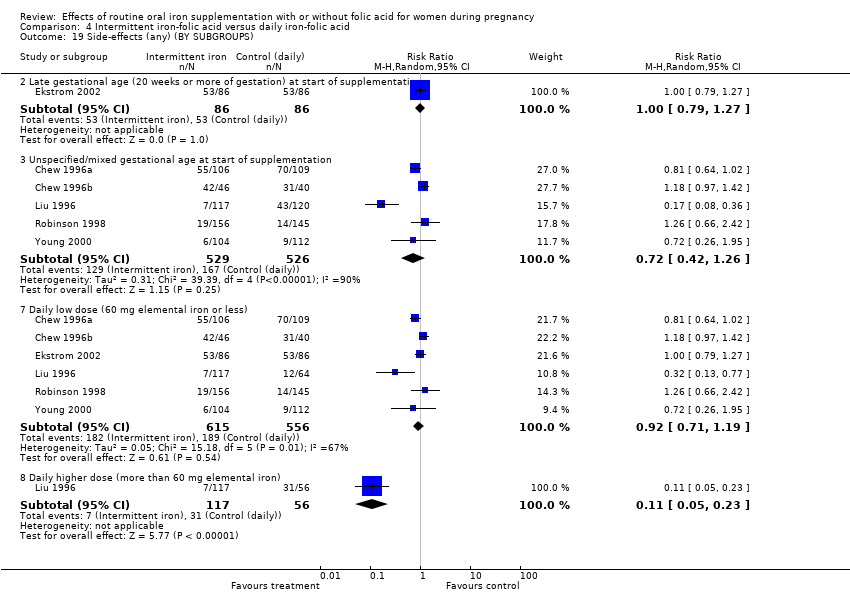
| 19 Side‐effects (Any) (BY SUBGROUPS) Show forest plot | 6 | | Risk Ratio (M‐H, Random, 95% CI) | Subtotals only |
|
| 19.1 Early gestational age (less than 20 weeks of gestation or pre‐pregnancy) at start of supplementation | 2 | 466 | Risk Ratio (M‐H, Random, 95% CI) | 1.42 [0.89, 2.26] |
| 19.2 Late gestational age (20 weeks or more of gestation) at start of supplementation | 3 | 428 | Risk Ratio (M‐H, Random, 95% CI) | 1.75 [0.99, 3.08] |
| 19.3 Unspecified/mixed gestational age at start of supplementation | 1 | 205 | Risk Ratio (M‐H, Random, 95% CI) | 62.79 [3.89, 1013.31] |
| 19.4 Non‐anaemic at start of supplementation | 2 | 329 | Risk Ratio (M‐H, Random, 95% CI) | 1.31 [0.94, 1.82] |
| 19.6 Unspecified/mixed anaemic status at start of supplementation | 4 | 770 | Risk Ratio (M‐H, Random, 95% CI) | 3.94 [1.09, 14.28] |
| 19.7 Daily low dose (60 mg elemental iron or less) | 4 | 566 | Risk Ratio (M‐H, Random, 95% CI) | 1.36 [0.99, 1.87] |
| 19.8 Daily higher dose (more than 60 mg elemental iron) | 3 | 580 | Risk Ratio (M‐H, Random, 95% CI) | 10.64 [0.67, 170.03] |
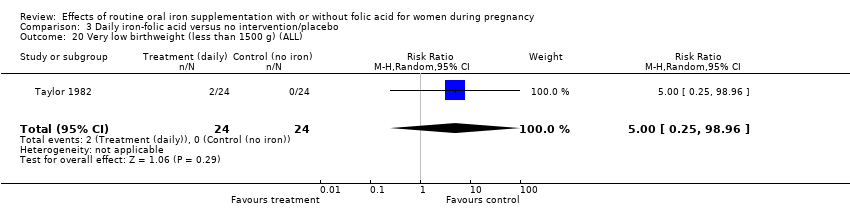
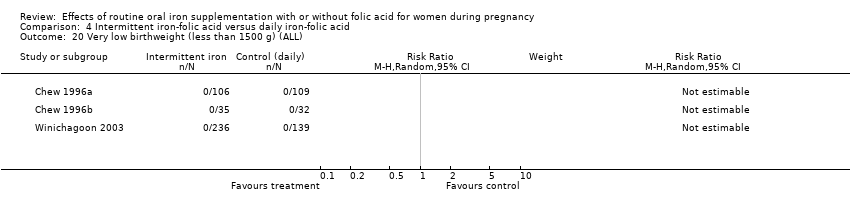
| 20 Very low birthweight (less than 1500 g) (ALL) Show forest plot | 3 | 697 | Risk Ratio (M‐H, Random, 95% CI) | 0.55 [0.03, 9.07] |
|
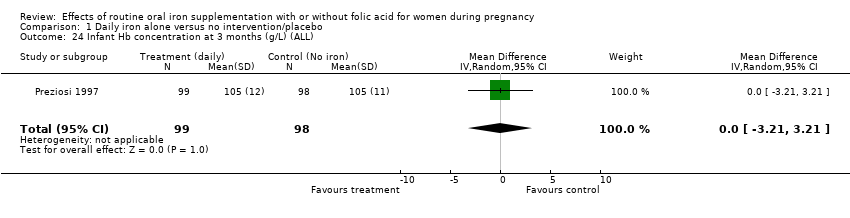
| 24 Infant Hb concentration at 3 months (g/L) (ALL) Show forest plot | 1 | 197 | Mean Difference (IV, Random, 95% CI) | 0.0 [‐3.21, 3.21] |
|
| 25 Infant serum ferritin concentration at 3 months (ug/L) (ALL) Show forest plot | 1 | 197 | Mean Difference (IV, Random, 95% CI) | 19.0 [2.75, 35.25] |
|
| 26 Infant Hb concentration at 6 months (g/L) (ALL) Show forest plot | 1 | 197 | Mean Difference (IV, Random, 95% CI) | ‐5.0 [‐9.11, ‐0.89] |
|
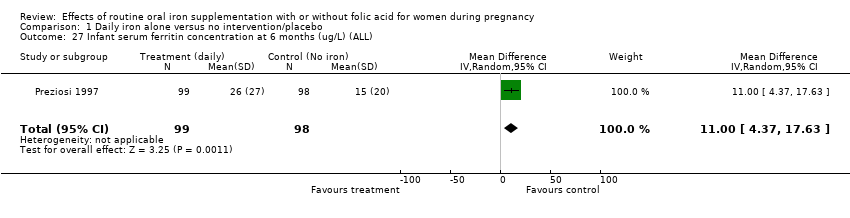
| 27 Infant serum ferritin concentration at 6 months (ug/L) (ALL) Show forest plot | 1 | 197 | Mean Difference (IV, Random, 95% CI) | 11.0 [4.37, 17.63] |
|
| 30 Very premature delivery (less than 34 weeks' gestation) (ALL) Show forest plot | 3 | 690 | Risk Ratio (M‐H, Random, 95% CI) | 0.32 [0.10, 1.09] |
|
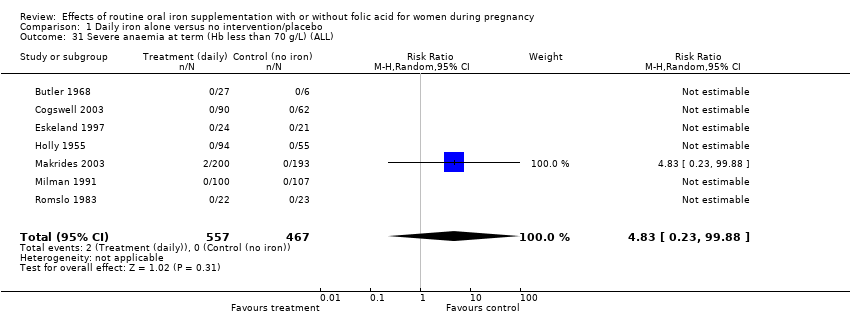
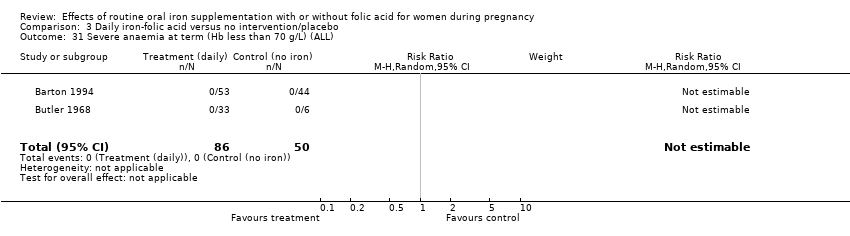
| 31 Severe anaemia at term (Hb less than 70 g/L) (ALL) Show forest plot | 7 | 1024 | Risk Ratio (M‐H, Random, 95% CI) | 4.83 [0.23, 99.88] |
|
| 32 Moderate anaemia at term (Hb more than 70 g/L and less than 90 g/L) (ALL) Show forest plot | 8 | 1141 | Risk Ratio (M‐H, Random, 95% CI) | 0.94 [0.55, 1.62] |
|
| 33 Severe anaemia at any time during second and third trimester (ALL) Show forest plot | 6 | 1075 | Risk Ratio (M‐H, Random, 95% CI) | 4.98 [0.24, 103.01] |
|
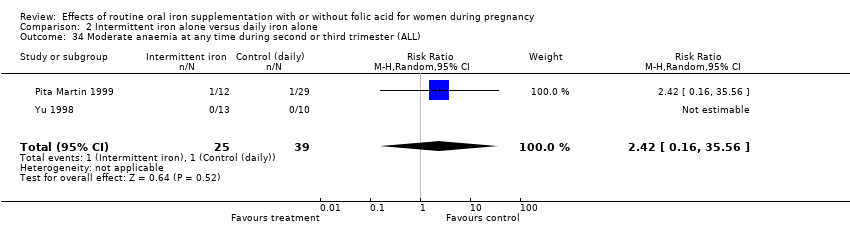
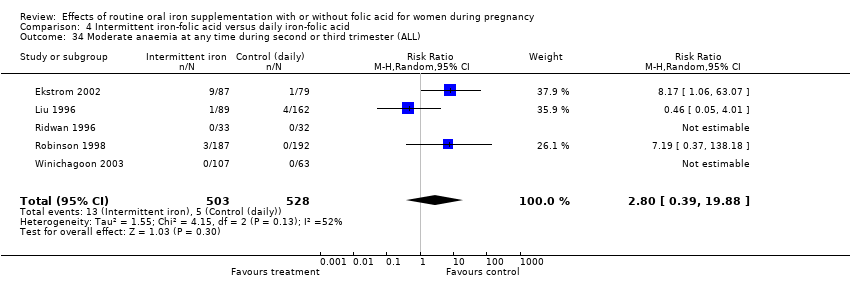
| 34 Moderate anaemia at any time during second or third trimester (ALL) Show forest plot | 7 | 1252 | Risk Ratio (M‐H, Random, 95% CI) | 0.59 [0.35, 1.01] |
|
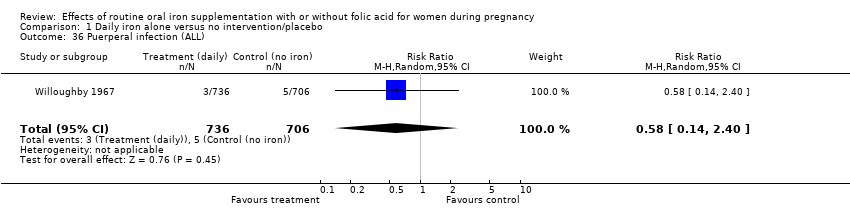
| 36 Puerperal infection (ALL) Show forest plot | 1 | 1442 | Risk Ratio (M‐H, Random, 95% CI) | 0.58 [0.14, 2.40] |
|
| 37 Antepartum haemorraghe (ALL) Show forest plot | 1 | 430 | Risk Ratio (M‐H, Random, 95% CI) | 2.97 [0.12, 72.56] |
|
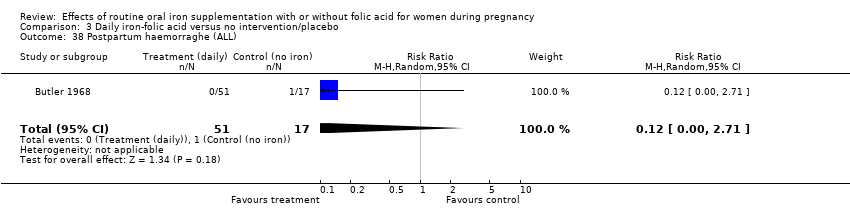
| 38 Postpartum haemorraghe (ALL) Show forest plot | 3 | 583 | Risk Ratio (M‐H, Random, 95% CI) | 0.77 [0.47, 1.27] |
|
| 39 Transfusion provided (ALL) Show forest plot | 1 | 32 | Risk Ratio (M‐H, Random, 95% CI) | 0.33 [0.01, 7.62] |
|
| 40 Haemoglobin concentration within one month postpartum (ALL) Show forest plot | 4 | 833 | Mean Difference (IV, Random, 95% CI) | 6.10 [3.70, 8.49] |
|
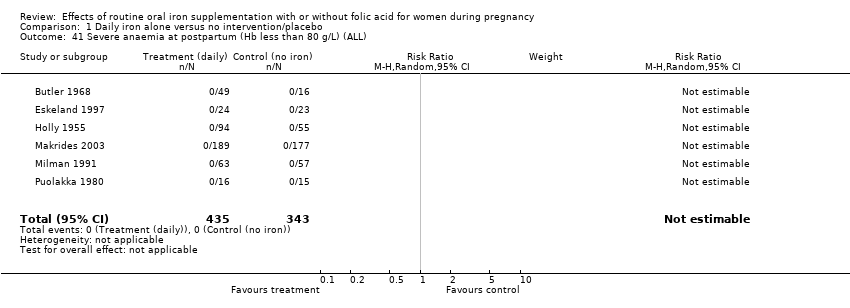
| 41 Severe anaemia at postpartum (Hb less than 80 g/L) (ALL) Show forest plot | 6 | 778 | Risk Ratio (M‐H, Random, 95% CI) | 0.0 [0.0, 0.0] |
|
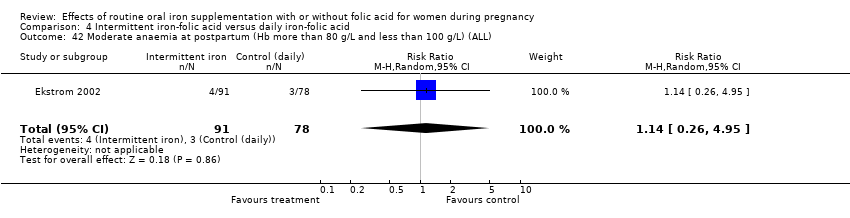
| 42 Moderate anaemia at postpartum (Hb more than 80 g/L and less than 100 g/L) (ALL) Show forest plot | 3 | 478 | Risk Ratio (M‐H, Random, 95% CI) | 2.81 [0.12, 68.54] |
|
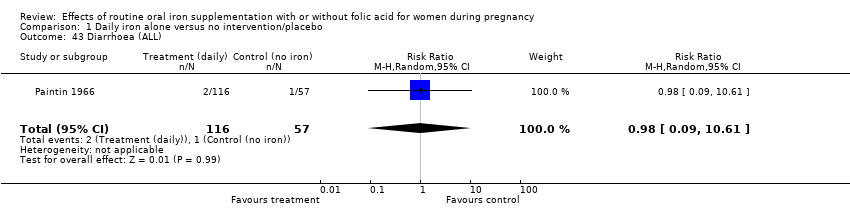
| 43 Diarrhoea (ALL) Show forest plot | 1 | 173 | Risk Ratio (M‐H, Random, 95% CI) | 0.98 [0.09, 10.61] |
|
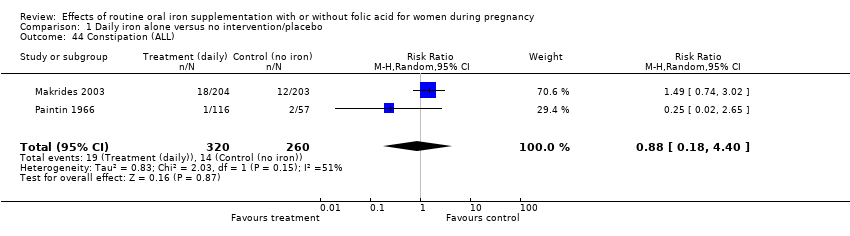
| 44 Constipation (ALL) Show forest plot | 2 | 580 | Risk Ratio (M‐H, Random, 95% CI) | 0.88 [0.18, 4.40] |
|
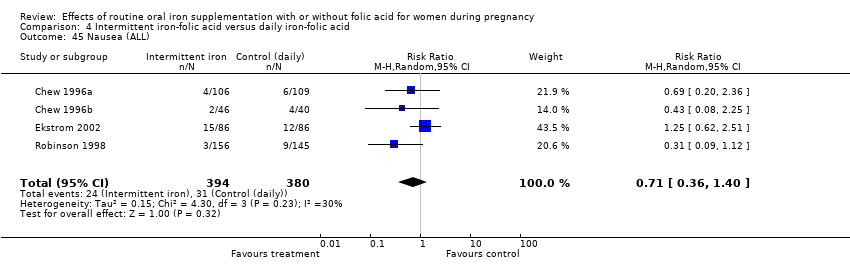
| 45 Nausea (ALL) Show forest plot | 3 | 650 | Risk Ratio (M‐H, Random, 95% CI) | 2.38 [0.49, 11.52] |
|
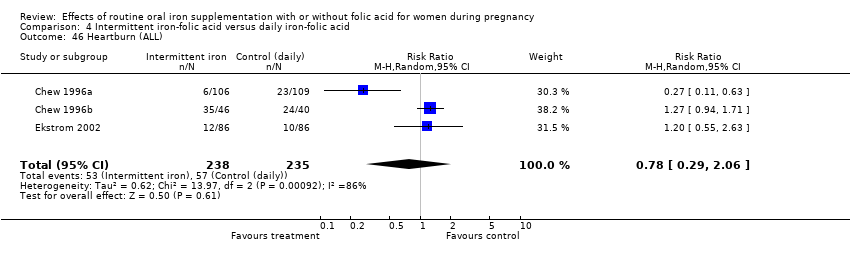
| 46 Heartburn (ALL) Show forest plot | 1 | 408 | Risk Ratio (M‐H, Random, 95% CI) | 1.0 [0.82, 1.22] |
|
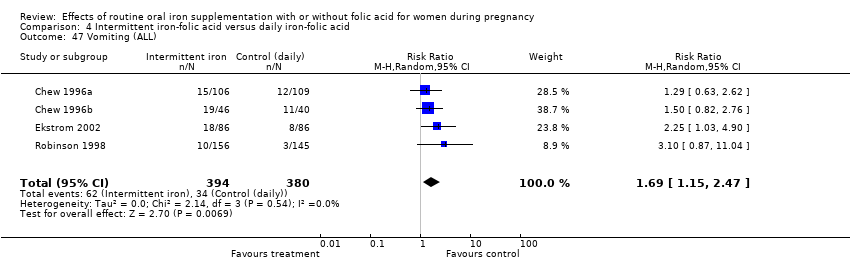
| 47 Vomiting (ALL) Show forest plot | 2 | 477 | Risk Ratio (M‐H, Random, 95% CI) | 0.88 [0.38, 2.07] |
|
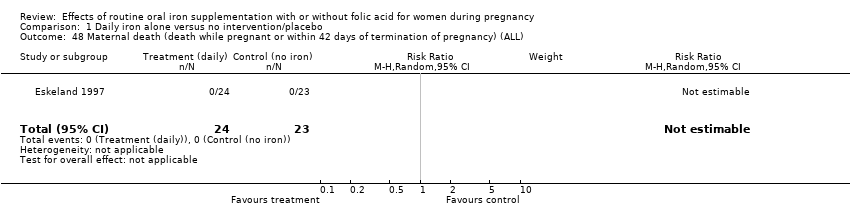
| 48 Maternal death (death while pregnant or within 42 days of termination of pregnancy) (ALL) Show forest plot | 1 | 47 | Risk Ratio (M‐H, Random, 95% CI) | 0.0 [0.0, 0.0] |
|
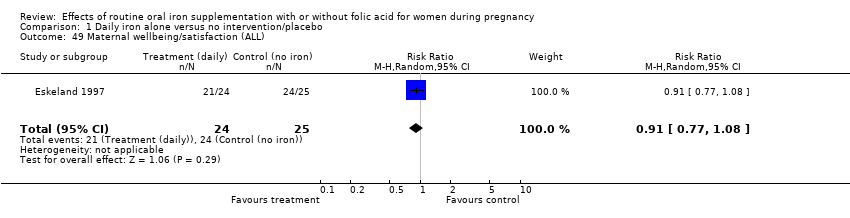
| 49 Maternal wellbeing/satisfaction (ALL) Show forest plot | 1 | 49 | Risk Ratio (M‐H, Random, 95% CI) | 0.91 [0.77, 1.08] |
|
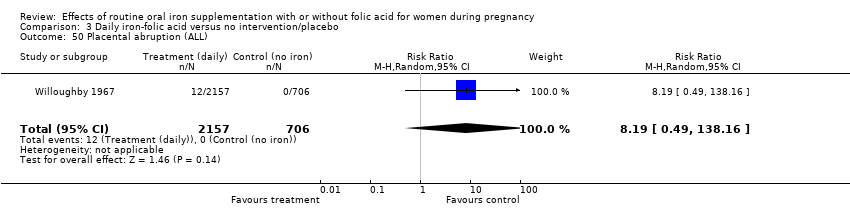
| 50 Placental abruption (ALL) Show forest plot | 1 | 1442 | Risk Ratio (M‐H, Random, 95% CI) | 2.88 [0.12, 70.53] |
|
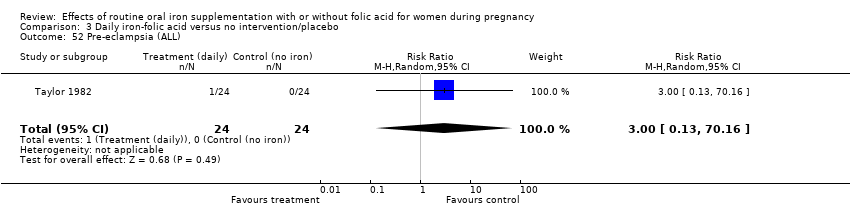
| 52 Pre‐eclampsia (ALL) Show forest plot | 1 | 47 | Risk Ratio (M‐H, Random, 95% CI) | 0.96 [0.06, 14.43] |
|
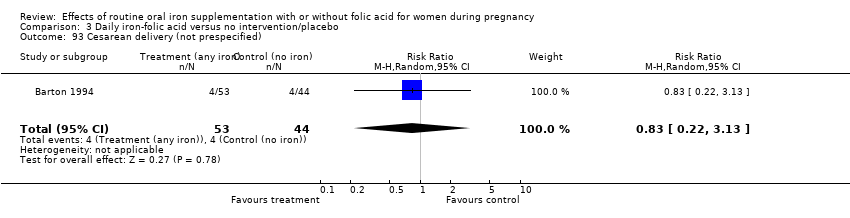
| 93 Cesarean delivery (not prespecified) Show forest plot | 3 | 508 | Risk Ratio (M‐H, Random, 95% CI) | 1.06 [0.75, 1.50] |
|
| 94 Birth length in cm (not prespecified) Show forest plot | 4 | 877 | Mean Difference (IV, Random, 95% CI) | 0.24 [‐0.17, 0.65] |
|
| 95 Forceps or vacuum delivery (not prespecified) Show forest plot | 2 | 477 | Odds Ratio (M‐H, Random, 95% CI) | 1.59 [0.93, 2.74] |
|
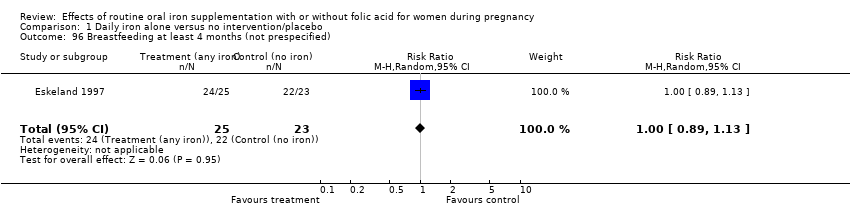
| 96 Breastfeeding at least 4 months (not prespecified) Show forest plot | 1 | 48 | Risk Ratio (M‐H, Random, 95% CI) | 1.00 [0.89, 1.13] |
|
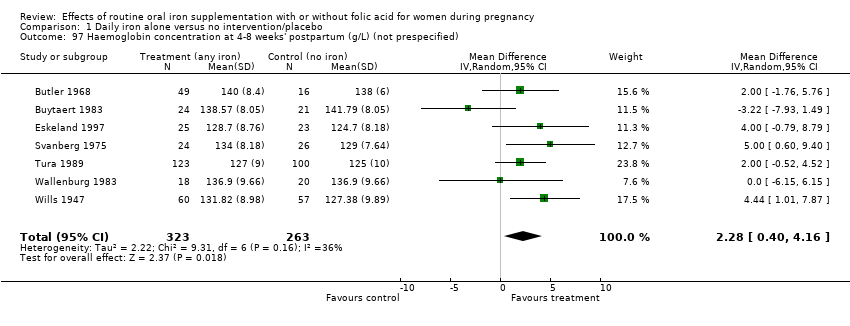
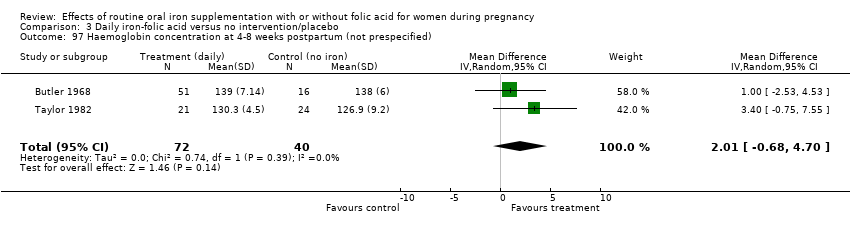
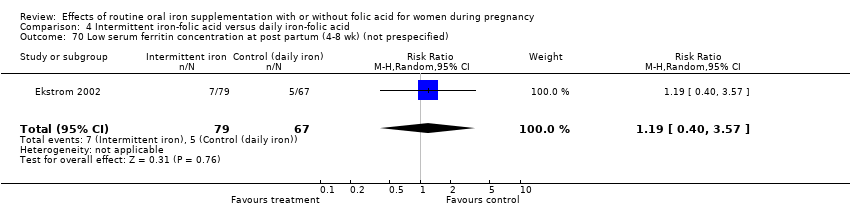
| 97 Haemoglobin concentration at 4‐8 weeks' postpartum (g/L) (not prespecified) Show forest plot | 7 | 586 | Mean Difference (IV, Random, 95% CI) | 2.28 [0.40, 4.16] |
|
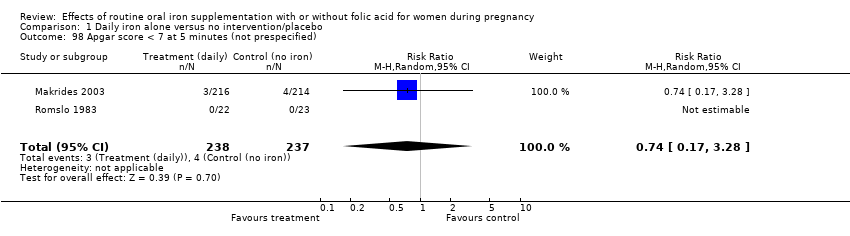
| 98 Apgar score < 7 at 5 minutes (not prespecified) Show forest plot | 2 | 475 | Risk Ratio (M‐H, Random, 95% CI) | 0.74 [0.17, 3.28] |
|
| 99 Apgar Score at 5 min (not prespecified) Show forest plot | 2 | 228 | Mean Difference (IV, Random, 95% CI) | 0.27 [‐0.07, 0.62] |
|