Parto temprano programado versus conducta expectante para mujeres con rotura prematura de membranas antes del trabajo de parto prematuro antes de las 37 semanas de gestación para mejorar el resultado del embarazo
Información
- DOI:
- https://doi.org/10.1002/14651858.CD004735.pub4Copiar DOI

- Base de datos:
-
- Cochrane Database of Systematic Reviews
- Versión publicada:
-
- 03 marzo 2017see what's new
- Tipo:
-
- Intervention
- Etapa:
-
- Review
- Grupo Editorial Cochrane:
-
Grupo Cochrane de Embarazo y parto
- Copyright:
-
- Copyright © 2017 The Cochrane Collaboration. Published by John Wiley & Sons, Ltd.
Cifras del artículo
Altmetric:
Citado por:
Autores
Contributions of authors
Dr Sarah Buchanan wrote the first draft of the initial review. Diana Bond was responsible for this update. Professor Jonathan Morris and Dr Kate Levett assisted with evaluation of trials for inclusion and independently extracting data. Dr Kate Levett assisted with independent assessment of bias. All authors commented on and edited the final version of the review.
Sources of support
Internal sources
-
The University of Sydney, Discipline of Obstetrics and Gynaecology, Australia.
-
The University of Adelaide, Discipline of Obstetrics and Gynaecology, Australia.
-
The Liggins Institute, University of Auckland, New Zealand.
-
ARCH: Australian Research Centre for Health of Women and Babies, Robinson Research Institute, The University of Adelaide, Australia.
External sources
-
Department of Health and Ageing, Australia.
-
National Institute for Health Research (NIHR), UK NIHR Cochrane Programme Grant Project: 13/89/05 – Pregnancy and childbirth systematic reviews to support clinical guidelines, UK.
-
National Health and Medical Research Council, Australia Funding for the PCG Australian and New Zealand Satellite, Australia.
Declarations of interest
Diana M Bond: I was employed as the Multi‐Center Trial Co‐ordinator for the NHMRC funded PPROMT trial which is included in this review. The NHMRC has had no input or influence regarding the publication of this review.
Philippa Middleton: none known.
Kate M Levett: acted as a trial co‐ordinator for the NHMRC (National Health and Medical Research Council) funded PPROMT trial, one of the included trials.
David P van der Ham: was Chief Investigator and first author of the PPROMEXIL trials. Jonathan Morris and Diana Bond were responsible for data extraction and assessment of all these trial reports.
Caroline A Crowther: was involved in the planning of the PPROMPT trial.
Sarah L Buchanan: was involved in the planning of the PPROMPT trial.
Jonathan Morris: was the Chief Investigator and first author for the NHMRC‐ (National Health and Medical Research Council) funded PPROMT trial.
Acknowledgements
As part of the pre‐publication editorial process, this review was commented on by three peers (an editor and two referees who are external to the editorial team), a member of the Pregnancy and Childbirth Group's international panel of consumers and the Group's statistical adviser.
This project was supported by the National Institute for Health Research, via Cochrane Programme Grant funding to Cochrane Pregnancy and Childbirth. The views and opinions expressed therein are those of the authors and do not necessarily reflect those of the Systematic Reviews Programme, NIHR, NHS or the Department of Health.
Version history
| Published | Title | Stage | Authors | Version |
| 2017 Mar 03 | Planned early birth versus expectant management for women with preterm prelabour rupture of membranes prior to 37 weeks' gestation for improving pregnancy outcome | Review | Diana M Bond, Philippa Middleton, Kate M Levett, David P van der Ham, Caroline A Crowther, Sarah L Buchanan, Jonathan Morris | |
| 2010 Mar 17 | Planned early birth versus expectant management for women with preterm prelabour rupture of membranes prior to 37 weeks' gestation for improving pregnancy outcome | Review | Sarah L Buchanan, Caroline A Crowther, Kate M Levett, Philippa Middleton, Jonathan Morris | |
| 2008 Apr 23 | Planned early birth versus expectant management for women with preterm prelabour rupture of membranes prior to 37 weeks' gestation for improving pregnancy outcome | Protocol | Sarah L Buchanan, Caroline A Crowther, Kate M Levett, Philippa Middleton, Jonathan Morris | |
| 2004 Apr 19 | Planned early birth versus expectant management for women with preterm prelabour rupture of membranes at 34 to 37 weeks' gestation for improving pregnancy outcome | Protocol | Sarah L Buchanan, Caroline A Crowther, Jonathan Morris | |
Differences between protocol and review
The methods section has been updated.
We removed the following specifier from our inclusion criteria: studies that planned early birth should be within 24 hours of randomisation. We left the definition of planned early birth to be specified by the authors of the included trials. We did, however, perform a subgroup analysis of those trials in which early birth was specified to be less than 24 hours from randomisation versus those trials in which this was not specified. This analysis was important as the trials were very heterogeneous with respect to the time at which birth was planned. By increasing the duration of time from randomisation to planned birth, the anticipated observed differences in outcomes between the early birth and the expectant management group would be less apparent.
It was not possible to extract data on early onset neonatal sepsis as initially specified in the protocol. Therefore, we further categorised neonatal sepsis into subgroups of: neonatal sepsis proven with positive blood culture (and included those trials that specified their sepsis outcome was defined by a positive culture); presumed sepsis; and neonatal treatment with antibiotics.
We included a new subgroup analysis for timing of intervention of early birth with a cutoff of 24 hours.
The protocol specified that there would be a subgroup analysis by gestational age at randomisation with three groups:
-
less than 30 weeks' gestation;
-
30 to 33 weeks' plus six days' gestation;
-
34 to 37 weeks' gestation.
However, seven of the trials included women that were able to be included in more than one gestational age group. As individual participant data were not available for assessment, we performed subgroup analysis to assess gestational age in five trials that randomised women greater than 34 weeks' gestation and in five trials that randomised women less than 34 weeks' gestation.
Vaginal birth was removed from the list of maternal outcomes in the subgroup analysis as this was just mirrored data in relation to caesarean section.
For subgroup analyses of antibiotic and corticosteroid usage, an additional subgroup was added to each category to include those trials where only some women received the intervention.
In this update, 2016, we used the GRADE approach to assess the quality of the body of evidence and produced a 'Summary of findings' table.
Keywords
MeSH
Medical Subject Headings (MeSH) Keywords
- Cesarean Section [statistics & numerical data];
- Chorioamnionitis [epidemiology];
- Delivery, Obstetric [*methods];
- Fetal Death;
- *Fetal Membranes, Premature Rupture;
- Gestational Age;
- Intensive Care Units, Neonatal [statistics & numerical data];
- Labor Onset;
- Length of Stay [statistics & numerical data];
- Perinatal Mortality;
- Premature Birth;
- Randomized Controlled Trials as Topic;
- Respiration, Artificial [statistics & numerical data];
- Respiratory Distress Syndrome, Newborn [epidemiology, prevention & control];
- Sepsis [epidemiology, prevention & control];
- *Watchful Waiting;
Medical Subject Headings Check Words
Female; Humans; Infant, Newborn; Pregnancy;
PICO

Study flow diagram
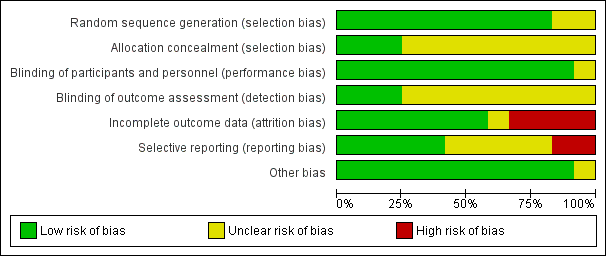
Risk of bias graph: review authors' judgements about each risk of bias item presented as percentages across all included studies

Risk of bias summary: review authors' judgements about each risk of bias item for each included study
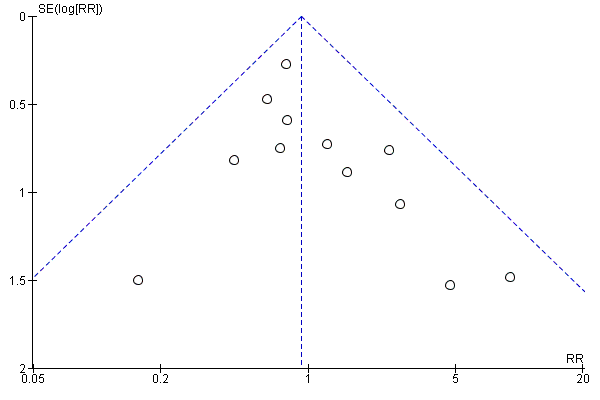
Funnel plot of comparison: 1 Any planned birth versus expectant management: by type, outcome: 1.1 Neonatal infection/sepsis

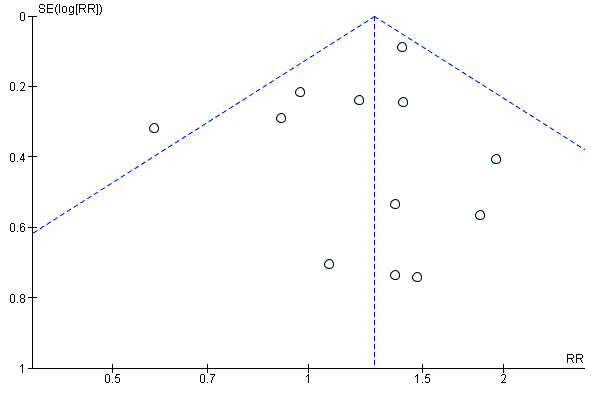
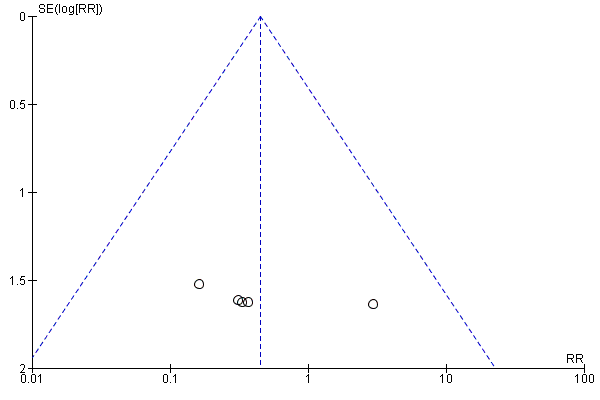
Funnel plot of comparison: 1 Any planned birth versus expectant management: by type, outcome: 1.3 Respiratory distress syndrome
Funnel plot of comparison: 1 Any planned birth versus expectant management: by type, outcome: 1.4 Caesarean section
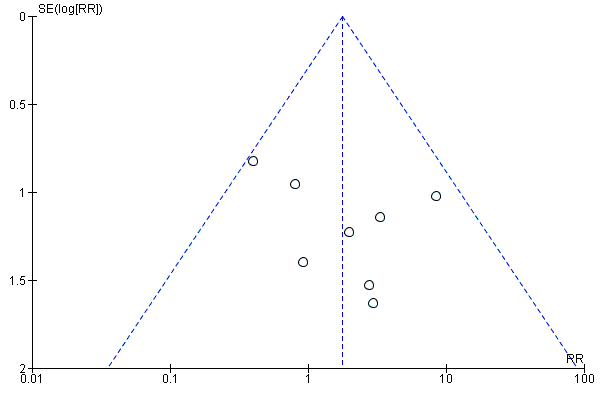
Funnel plot of comparison: 1 Any planned birth versus expectant management: by type, outcome: 1.5 Perinatal mortality
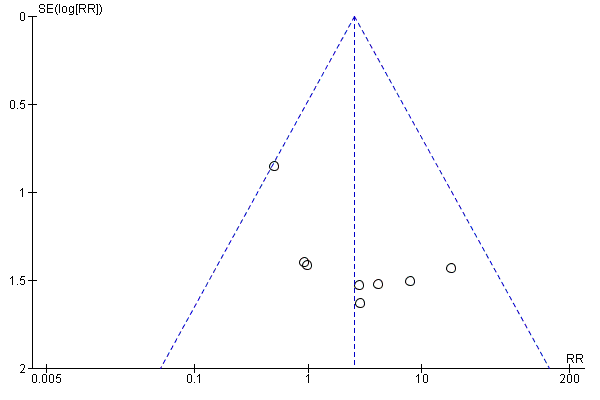
Funnel plot of comparison: 1 Any planned birth versus expectant management: by type, outcome: 1.6 Intrauterine death
Funnel plot of comparison: 1 Any planned birth versus expectant management: by type, outcome: 1.9 Neonatal death

Funnel plot of comparison: 1 Any planned birth versus expectant management: by type, outcome: 1.15 Birthweight (g)

Funnel plot of comparison: 1 Any planned birth versus expectant management: by type, outcome: 1.31 Vaginal birth

Comparison 1 Any planned birth versus expectant management: by type, Outcome 1 Neonatal infection/sepsis.

Comparison 1 Any planned birth versus expectant management: by type, Outcome 2 Neonatal infection confirmed with positive blood culture.
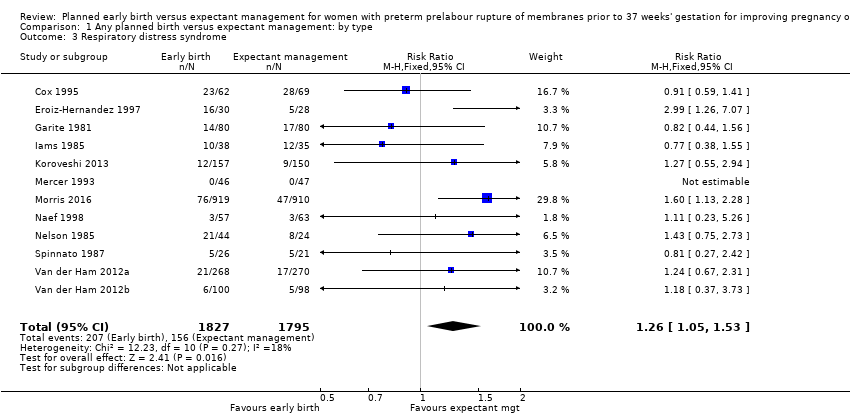
Comparison 1 Any planned birth versus expectant management: by type, Outcome 3 Respiratory distress syndrome.

Comparison 1 Any planned birth versus expectant management: by type, Outcome 4 Caesarean section.

Comparison 1 Any planned birth versus expectant management: by type, Outcome 5 Perinatal mortality.
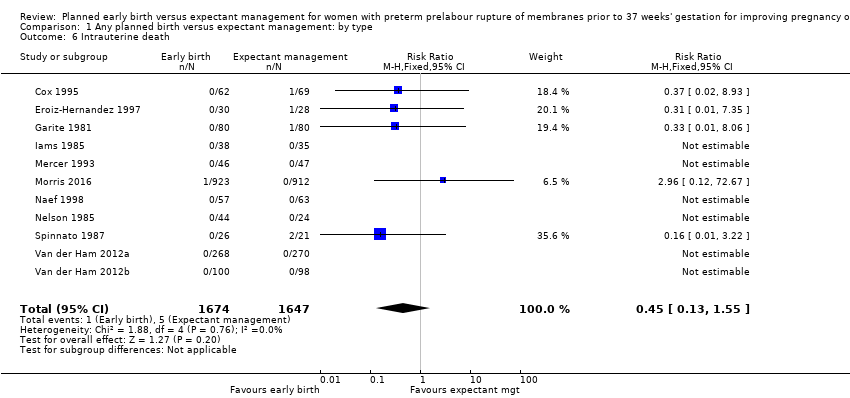
Comparison 1 Any planned birth versus expectant management: by type, Outcome 6 Intrauterine death.

Comparison 1 Any planned birth versus expectant management: by type, Outcome 7 Cord prolapse.

Comparison 1 Any planned birth versus expectant management: by type, Outcome 8 Gestational age at birth (weeks).

Comparison 1 Any planned birth versus expectant management: by type, Outcome 9 Neonatal death.

Comparison 1 Any planned birth versus expectant management: by type, Outcome 10 Suspected neonatal infection.

Comparison 1 Any planned birth versus expectant management: by type, Outcome 11 Neonatal treatment with antibiotics.

Comparison 1 Any planned birth versus expectant management: by type, Outcome 12 Need for ventilation.

Comparison 1 Any planned birth versus expectant management: by type, Outcome 13 Duration of oxygen therapy (days).

Comparison 1 Any planned birth versus expectant management: by type, Outcome 14 Umbilical cord arterial pH.

Comparison 1 Any planned birth versus expectant management: by type, Outcome 15 Birthweight (g).

Comparison 1 Any planned birth versus expectant management: by type, Outcome 16 Apgar score less than 7 at 5 minutes.
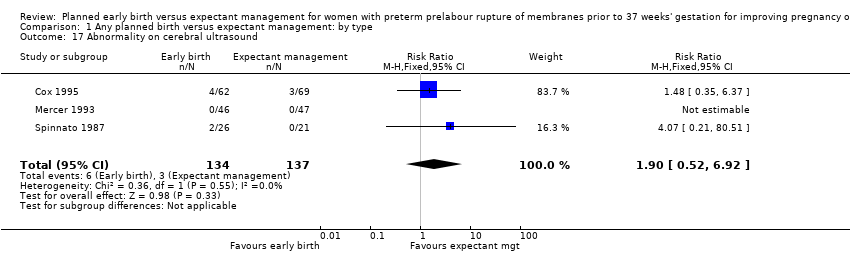
Comparison 1 Any planned birth versus expectant management: by type, Outcome 17 Abnormality on cerebral ultrasound.

Comparison 1 Any planned birth versus expectant management: by type, Outcome 18 Periventricular leukomalacia.
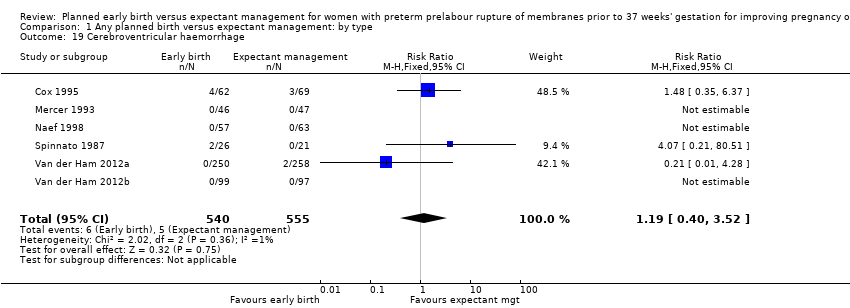
Comparison 1 Any planned birth versus expectant management: by type, Outcome 19 Cerebroventricular haemorrhage.

Comparison 1 Any planned birth versus expectant management: by type, Outcome 20 Necrotising enterocolitis.

Comparison 1 Any planned birth versus expectant management: by type, Outcome 21 Severe respiratory distress.

Comparison 1 Any planned birth versus expectant management: by type, Outcome 22 Admission to neonatal intensive care unit.

Comparison 1 Any planned birth versus expectant management: by type, Outcome 23 Length of stay in neonatal intensive care unit (days).

Comparison 1 Any planned birth versus expectant management: by type, Outcome 24 Duration (days) from birth to neonatal hospital discharge.

Comparison 1 Any planned birth versus expectant management: by type, Outcome 25 Chorioamnionitis.

Comparison 1 Any planned birth versus expectant management: by type, Outcome 26 Endometritis.

Comparison 1 Any planned birth versus expectant management: by type, Outcome 27 Postpartum fever.

Comparison 1 Any planned birth versus expectant management: by type, Outcome 28 Placental abruption.
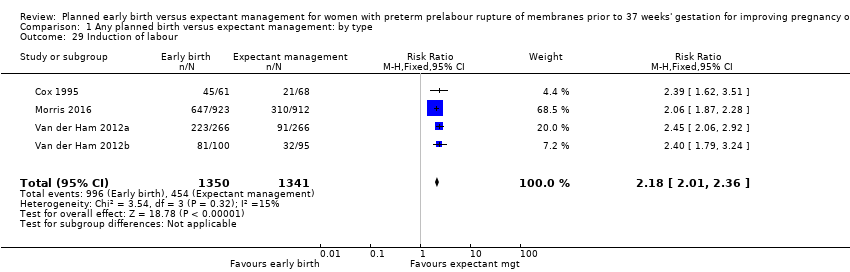
Comparison 1 Any planned birth versus expectant management: by type, Outcome 29 Induction of labour.

Comparison 1 Any planned birth versus expectant management: by type, Outcome 30 Use of epidural/spinal anaesthesia.
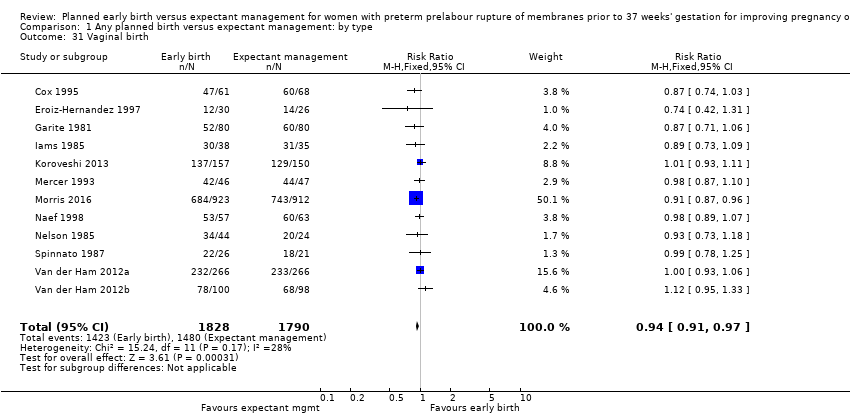
Comparison 1 Any planned birth versus expectant management: by type, Outcome 31 Vaginal birth.

Comparison 1 Any planned birth versus expectant management: by type, Outcome 32 Operative vaginal birth.
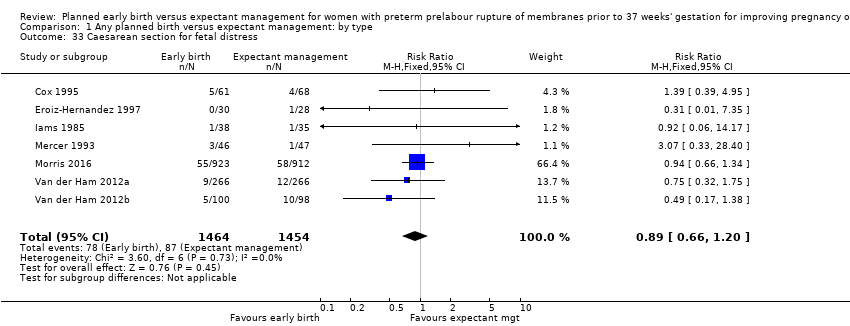
Comparison 1 Any planned birth versus expectant management: by type, Outcome 33 Caesarean section for fetal distress.
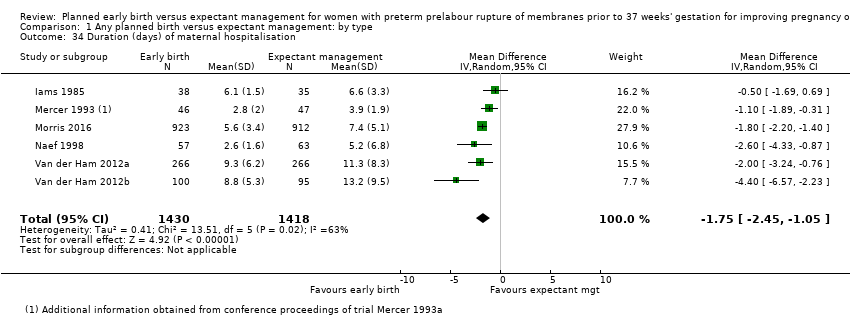
Comparison 1 Any planned birth versus expectant management: by type, Outcome 34 Duration (days) of maternal hospitalisation.

Comparison 1 Any planned birth versus expectant management: by type, Outcome 35 Duration (days) of antenatal hospitalisation.

Comparison 1 Any planned birth versus expectant management: by type, Outcome 36 Duration (days) of maternal hospitalisation (excluding trials with antenatal discharge).

Comparison 1 Any planned birth versus expectant management: by type, Outcome 37 Time (hours) from randomisation to birth.

Comparison 1 Any planned birth versus expectant management: by type, Outcome 38 Disability at 2 years, abnormal CBCL.
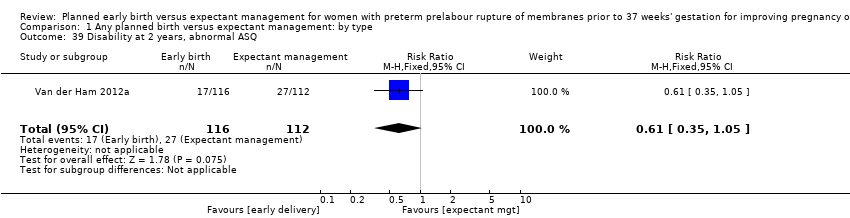
Comparison 1 Any planned birth versus expectant management: by type, Outcome 39 Disability at 2 years, abnormal ASQ.

Comparison 1 Any planned birth versus expectant management: by type, Outcome 40 Maternal satisfaction.
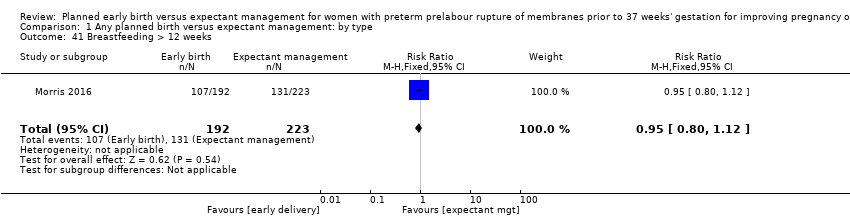
Comparison 1 Any planned birth versus expectant management: by type, Outcome 41 Breastfeeding > 12 weeks.
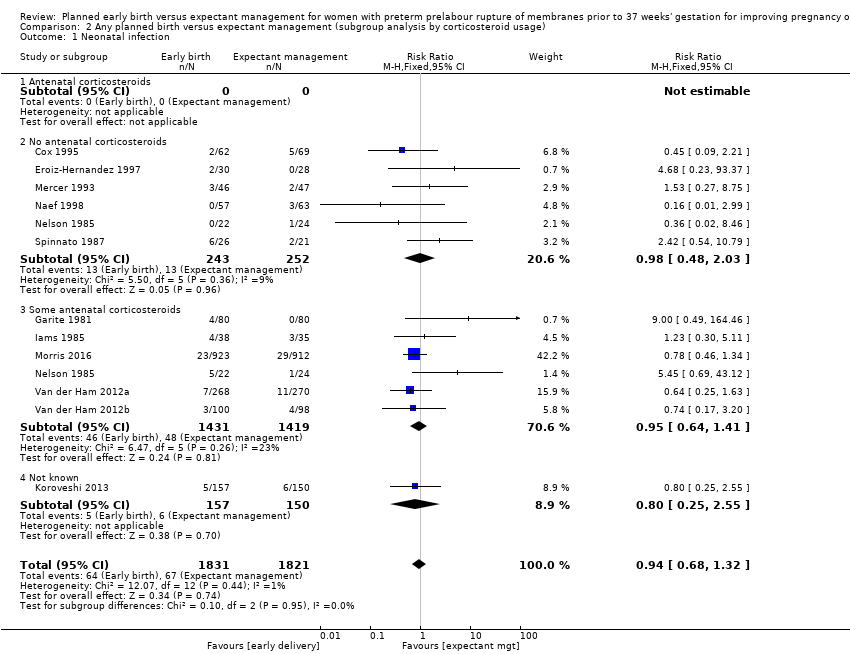
Comparison 2 Any planned birth versus expectant management (subgroup analysis by corticosteroid usage), Outcome 1 Neonatal infection.

Comparison 2 Any planned birth versus expectant management (subgroup analysis by corticosteroid usage), Outcome 2 Neonatal infection confirmed with positive culture.
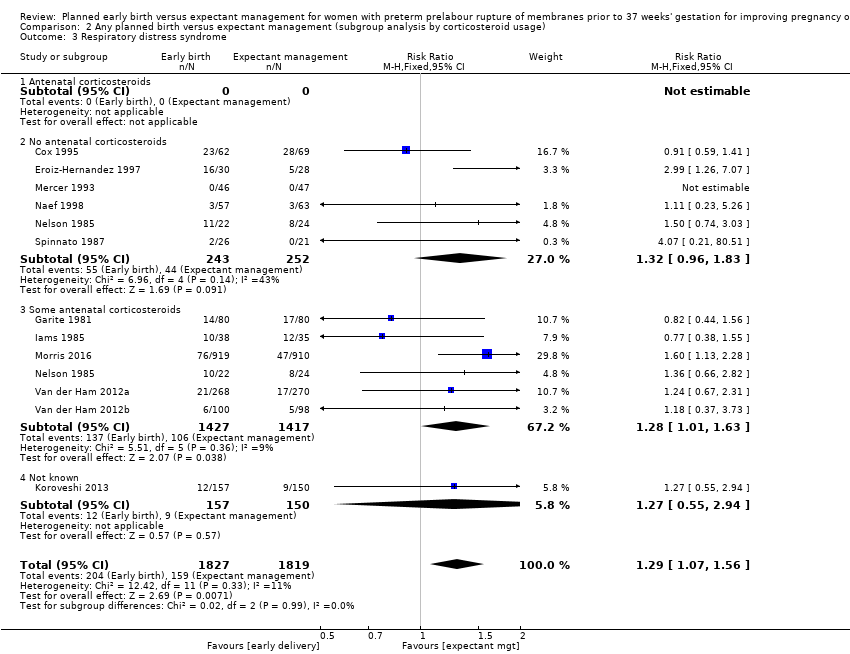
Comparison 2 Any planned birth versus expectant management (subgroup analysis by corticosteroid usage), Outcome 3 Respiratory distress syndrome.

Comparison 2 Any planned birth versus expectant management (subgroup analysis by corticosteroid usage), Outcome 4 Caesarean section.

Comparison 2 Any planned birth versus expectant management (subgroup analysis by corticosteroid usage), Outcome 5 Chorioamnionitis.

Comparison 2 Any planned birth versus expectant management (subgroup analysis by corticosteroid usage), Outcome 6 Endometritis.

Comparison 3 Any planned birth versus expectant management (subgroup analysis by gestational age for inclusion in trial), Outcome 1 Neonatal infection.
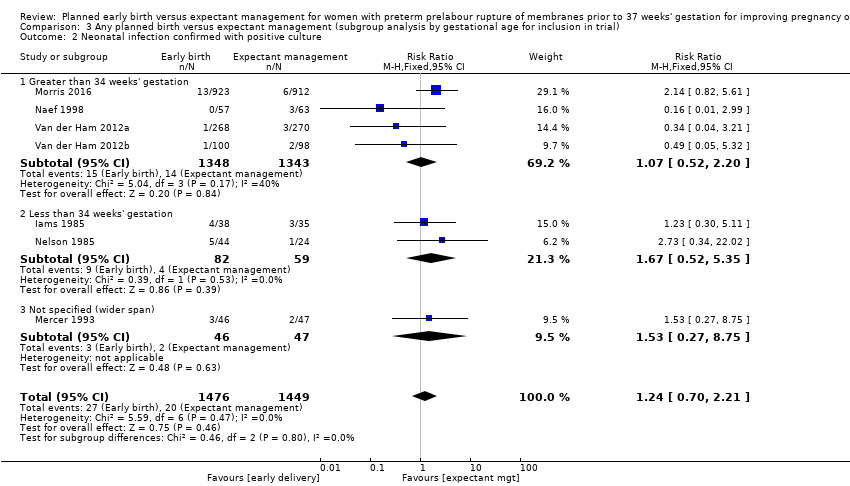
Comparison 3 Any planned birth versus expectant management (subgroup analysis by gestational age for inclusion in trial), Outcome 2 Neonatal infection confirmed with positive culture.

Comparison 3 Any planned birth versus expectant management (subgroup analysis by gestational age for inclusion in trial), Outcome 3 Respiratory distress syndrome.

Comparison 3 Any planned birth versus expectant management (subgroup analysis by gestational age for inclusion in trial), Outcome 4 Caesarean section.

Comparison 3 Any planned birth versus expectant management (subgroup analysis by gestational age for inclusion in trial), Outcome 5 Chorioamnionitis.

Comparison 3 Any planned birth versus expectant management (subgroup analysis by gestational age for inclusion in trial), Outcome 6 Endometritis.

Comparison 4 Any planned birth versus expectant management (subgroup analysis by antibiotic use), Outcome 1 Neonatal infection.

Comparison 4 Any planned birth versus expectant management (subgroup analysis by antibiotic use), Outcome 2 Neonatal infection confirmed with positive culture.

Comparison 4 Any planned birth versus expectant management (subgroup analysis by antibiotic use), Outcome 3 Respiratory distress syndrome.

Comparison 4 Any planned birth versus expectant management (subgroup analysis by antibiotic use), Outcome 4 Caesarean section.
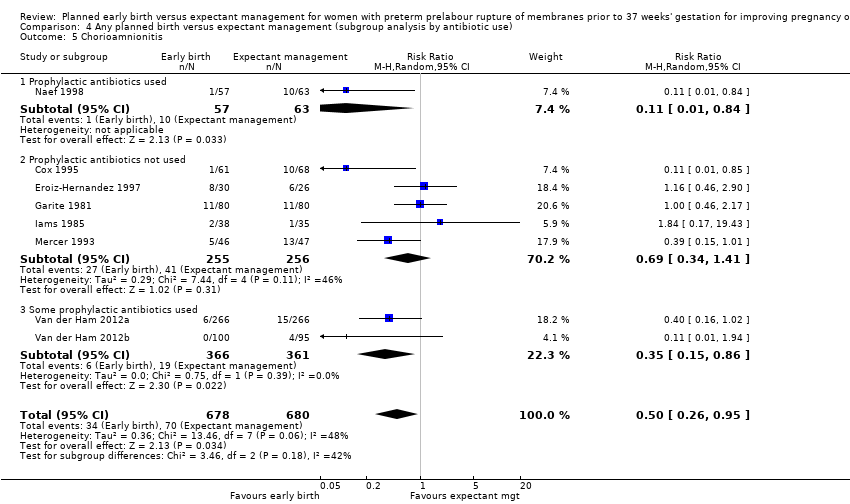
Comparison 4 Any planned birth versus expectant management (subgroup analysis by antibiotic use), Outcome 5 Chorioamnionitis.
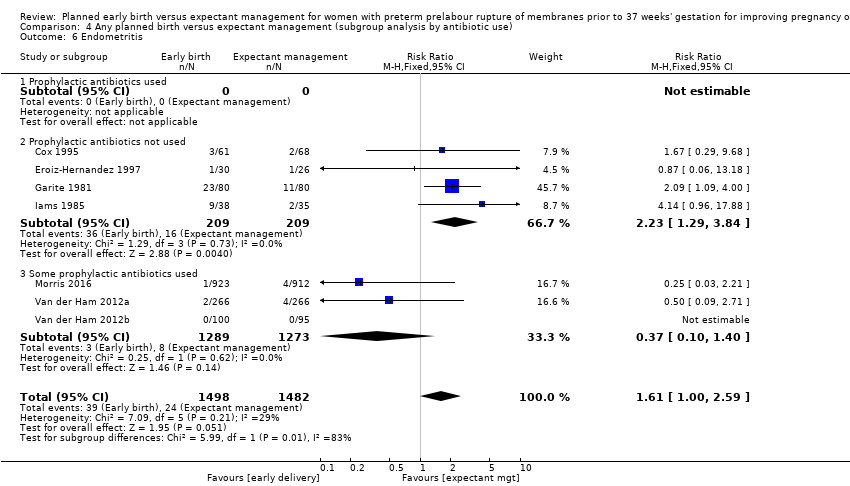
Comparison 4 Any planned birth versus expectant management (subgroup analysis by antibiotic use), Outcome 6 Endometritis.

Comparison 5 Any planned birth versus expectant management (subgroup analysis by timing of early delivery), Outcome 1 Neonatal infection.

Comparison 5 Any planned birth versus expectant management (subgroup analysis by timing of early delivery), Outcome 2 Neonatal infection confirmed with positive culture.

Comparison 5 Any planned birth versus expectant management (subgroup analysis by timing of early delivery), Outcome 3 Respiratory distress syndrome.

Comparison 5 Any planned birth versus expectant management (subgroup analysis by timing of early delivery), Outcome 4 Caesarean section.

Comparison 5 Any planned birth versus expectant management (subgroup analysis by timing of early delivery), Outcome 5 Chorioamnionitis.
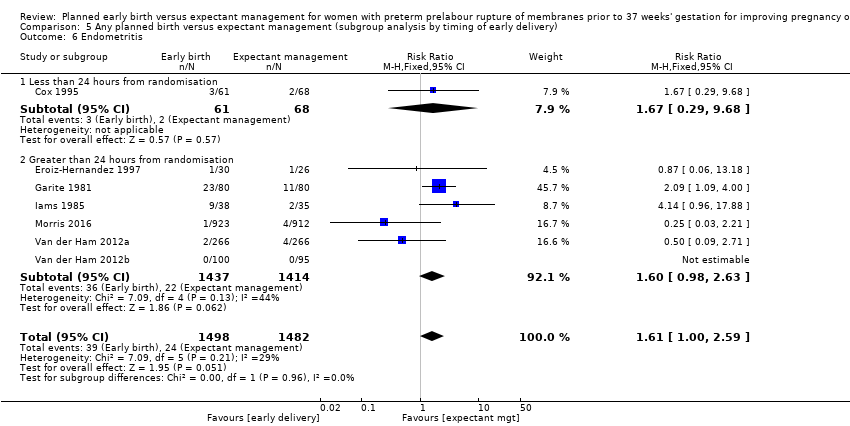
Comparison 5 Any planned birth versus expectant management (subgroup analysis by timing of early delivery), Outcome 6 Endometritis.
| Planned early birth compared to expectant management for preterm prelabour rupture of membranes prior to 37 weeks' gestation | ||||||
| Patient or population: women with preterm prelabour rupture of membranes prior to 37 weeks' gestation | ||||||
| Outcomes | Illustrative comparative risks* (95% CI) | Relative effect | No of participants | Quality of the evidence | Comments | |
| Assumed risk | Corresponding risk | |||||
| Expectant management | Planned early birth | |||||
| Neonatal infection/sepsis | Study population | RR 0.93 | 3628 | ⊕⊕⊕⊝ | ||
| 37 per 1000 | 34 per 1000 | |||||
| Neonatal respiratory distress syndrome | Study population | RR 1.26 | 3622 | ⊕⊕⊕⊕ | ||
| 84 per 1000 | 109 per 1000 | |||||
| Need for ventilation | Study population | RR 1.27 | 2895 | ⊕⊕⊕⊕ | ||
| 86 per 1000 | 110 per 1000 | |||||
| Admission to neonatal intensive care | Study population | RR 1.16 | 2691 | ⊕⊕⊕⊝ | ||
| 428 per 1000 | 497 per 1000 | |||||
| Caesarean section | Study population | RR 1.26 | 3620 | ⊕⊕⊕⊕ | ||
| 172 per 1000 | 217 per 1000 | |||||
| Chorioamnionitis | Study population | RR 0.50 | 1358 | ⊕⊕⊕⊝ | ||
| 103 per 1000 | 51 per 1000 | |||||
| Length of hospital stay (maternal) | The mean length of hospital stay (maternal) in the expectant group was | The mean length of hospital stay (maternal) in the early birth group was 1.75 days lower | MD ‐1.75 (‐2.45 to ‐1.05) | 2848 | ⊕⊕⊕⊝ | |
| *The basis for the assumed risk (e.g. the median control group risk across studies) is provided in footnotes. The corresponding risk (and its 95% confidence interval) is based on the assumed risk in the comparison group and the relative effect of the intervention (and its 95% CI). | ||||||
| GRADE Working Group grades of evidence | ||||||
| 1Wide confidence interval crossing the line of no effect, and the lines of appreciable benefit and harm. | ||||||
| Trial | Sample size | Gestational age for inclusion (weeks) | Co‐interventions | Fetal lung maturity tested |
| 129 (131 babies) 61 ED (62 babies) 68 EM (69 babies) | 30 to 34 |
| No | |
| 58 30 ED 28 EM | 28 to 34 |
| Yes, if positive excluded from randomisation | |
| 160 80 ED 80 EM | 28 to 34 |
| Yes: if L/S mature excluded from randomisation and delivered | |
| 73 38 ED 35 EM | 28 to 34 |
| Yes: if mature L/S excluded from randomisation and delivered | |
| 307 157 ED 150 EM | 34 to 37 |
| No | |
| 93 46 ED 47 EM | 32 to 36+ 6 |
| Yes: included if mature L/S | |
| 1835 923 ED 912 EM | 34 to 36+ 6 |
| No | |
| 120 57 ED 63 EM | 34 to 36+ 6 |
| No | |
| 68 22 ED and steroids 22 ED and no steroids 24 EM | 28 to 34 |
| No | |
| 47 26 to ED 21 to EM | 25 to 36 |
| Yes: included if mature L/S | |
| 532 (538 babies) 266 ED (268 babies) 266 EM (270 babies) | 34 to 36+6 |
| No | |
| 195 (198 babies) 100 ED (100 babies) 95 EM (98 babies) | 34 to 36+6 |
| No | |
| ED: early delivery | ||||
| Outcome or subgroup title | No. of studies | No. of participants | Statistical method | Effect size |
| 1 Neonatal infection/sepsis Show forest plot | 12 | 3628 | Risk Ratio (M‐H, Fixed, 95% CI) | 0.93 [0.66, 1.30] |
| 2 Neonatal infection confirmed with positive blood culture Show forest plot | 7 | 2925 | Risk Ratio (M‐H, Fixed, 95% CI) | 1.24 [0.70, 2.21] |
| 3 Respiratory distress syndrome Show forest plot | 12 | 3622 | Risk Ratio (M‐H, Fixed, 95% CI) | 1.26 [1.05, 1.53] |
| 4 Caesarean section Show forest plot | 12 | 3620 | Risk Ratio (M‐H, Fixed, 95% CI) | 1.26 [1.11, 1.44] |
| 5 Perinatal mortality Show forest plot | 11 | 3319 | Risk Ratio (M‐H, Fixed, 95% CI) | 1.76 [0.89, 3.50] |
| 6 Intrauterine death Show forest plot | 11 | 3321 | Risk Ratio (M‐H, Fixed, 95% CI) | 0.45 [0.13, 1.55] |
| 7 Cord prolapse Show forest plot | 4 | 2722 | Risk Ratio (M‐H, Fixed, 95% CI) | 1.24 [0.33, 4.61] |
| 8 Gestational age at birth (weeks) Show forest plot | 8 | 3139 | Mean Difference (IV, Fixed, 95% CI) | ‐0.48 [‐0.57, ‐0.39] |
| 9 Neonatal death Show forest plot | 11 | 3316 | Risk Ratio (M‐H, Fixed, 95% CI) | 2.55 [1.17, 5.56] |
| 10 Suspected neonatal infection Show forest plot | 3 | 829 | Risk Ratio (M‐H, Fixed, 95% CI) | 0.56 [0.36, 0.88] |
| 11 Neonatal treatment with antibiotics Show forest plot | 4 | 2638 | Risk Ratio (M‐H, Random, 95% CI) | 0.86 [0.63, 1.19] |
| 12 Need for ventilation Show forest plot | 7 | 2895 | Risk Ratio (M‐H, Fixed, 95% CI) | 1.27 [1.02, 1.58] |
| 13 Duration of oxygen therapy (days) Show forest plot | 1 | 73 | Mean Difference (IV, Fixed, 95% CI) | ‐3.05 [‐6.92, 0.82] |
| 14 Umbilical cord arterial pH Show forest plot | 1 | 120 | Mean Difference (IV, Fixed, 95% CI) | 0.09 [0.07, 0.11] |
| 15 Birthweight (g) Show forest plot | 10 | 3263 | Mean Difference (IV, Random, 95% CI) | ‐47.10 [‐96.00, 1.80] |
| 16 Apgar score less than 7 at 5 minutes Show forest plot | 5 | 2700 | Risk Ratio (M‐H, Fixed, 95% CI) | 0.96 [0.54, 1.69] |
| 17 Abnormality on cerebral ultrasound Show forest plot | 3 | 271 | Risk Ratio (M‐H, Fixed, 95% CI) | 1.90 [0.52, 6.92] |
| 18 Periventricular leukomalacia Show forest plot | 2 | 707 | Risk Ratio (M‐H, Fixed, 95% CI) | 1.00 [0.14, 6.99] |
| 19 Cerebroventricular haemorrhage Show forest plot | 6 | 1095 | Risk Ratio (M‐H, Fixed, 95% CI) | 1.19 [0.40, 3.52] |
| 20 Necrotising enterocolitis Show forest plot | 6 | 2842 | Risk Ratio (M‐H, Fixed, 95% CI) | 0.81 [0.25, 2.62] |
| 21 Severe respiratory distress Show forest plot | 3 | 321 | Risk Ratio (M‐H, Fixed, 95% CI) | 1.54 [0.80, 2.97] |
| 22 Admission to neonatal intensive care unit Show forest plot | 4 | 2691 | Risk Ratio (M‐H, Fixed, 95% CI) | 1.16 [1.08, 1.24] |
| 23 Length of stay in neonatal intensive care unit (days) Show forest plot | 4 | 2121 | Mean Difference (IV, Random, 95% CI) | ‐0.17 [‐1.62, 1.27] |
| 24 Duration (days) from birth to neonatal hospital discharge Show forest plot | 6 | 2832 | Mean Difference (IV, Random, 95% CI) | 0.67 [‐0.28, 1.61] |
| 25 Chorioamnionitis Show forest plot | 8 | 1358 | Risk Ratio (M‐H, Random, 95% CI) | 0.50 [0.26, 0.95] |
| 26 Endometritis Show forest plot | 7 | 2980 | Risk Ratio (M‐H, Fixed, 95% CI) | 1.61 [1.00, 2.59] |
| 27 Postpartum fever Show forest plot | 1 | 1835 | Risk Ratio (M‐H, Fixed, 95% CI) | 0.52 [0.26, 1.03] |
| 28 Placental abruption Show forest plot | 1 | 1835 | Risk Ratio (M‐H, Fixed, 95% CI) | 1.19 [0.36, 3.87] |
| 29 Induction of labour Show forest plot | 4 | 2691 | Risk Ratio (M‐H, Fixed, 95% CI) | 2.18 [2.01, 2.36] |
| 30 Use of epidural/spinal anaesthesia Show forest plot | 3 | 2562 | Risk Ratio (M‐H, Random, 95% CI) | 1.28 [0.99, 1.65] |
| 31 Vaginal birth Show forest plot | 12 | 3618 | Risk Ratio (M‐H, Fixed, 95% CI) | 0.94 [0.91, 0.97] |
| 32 Operative vaginal birth Show forest plot | 4 | 2685 | Risk Ratio (M‐H, Fixed, 95% CI) | 0.85 [0.67, 1.10] |
| 33 Caesarean section for fetal distress Show forest plot | 7 | 2918 | Risk Ratio (M‐H, Fixed, 95% CI) | 0.89 [0.66, 1.20] |
| 34 Duration (days) of maternal hospitalisation Show forest plot | 6 | 2848 | Mean Difference (IV, Random, 95% CI) | ‐1.75 [‐2.45, ‐1.05] |
| 35 Duration (days) of antenatal hospitalisation Show forest plot | 1 | 73 | Mean Difference (IV, Fixed, 95% CI) | ‐6.30 [‐9.67, ‐2.93] |
| 36 Duration (days) of maternal hospitalisation (excluding trials with antenatal discharge) Show forest plot | 2 | 213 | Mean Difference (IV, Random, 95% CI) | ‐1.64 [‐3.06, ‐0.23] |
| 37 Time (hours) from randomisation to birth Show forest plot | 3 | 2571 | Mean Difference (IV, Fixed, 95% CI) | ‐79.48 [‐88.27, ‐70.69] |
| 38 Disability at 2 years, abnormal CBCL Show forest plot | 1 | 199 | Risk Ratio (M‐H, Fixed, 95% CI) | 0.64 [0.26, 1.59] |
| 39 Disability at 2 years, abnormal ASQ Show forest plot | 1 | 228 | Risk Ratio (M‐H, Fixed, 95% CI) | 0.61 [0.35, 1.05] |
| 40 Maternal satisfaction Show forest plot | 1 | 493 | Risk Ratio (M‐H, Fixed, 95% CI) | 0.99 [0.86, 1.13] |
| 41 Breastfeeding > 12 weeks Show forest plot | 1 | 415 | Risk Ratio (M‐H, Fixed, 95% CI) | 0.95 [0.80, 1.12] |
| Outcome or subgroup title | No. of studies | No. of participants | Statistical method | Effect size |
| 1 Neonatal infection Show forest plot | 12 | 3652 | Risk Ratio (M‐H, Fixed, 95% CI) | 0.94 [0.68, 1.32] |
| 1.1 Antenatal corticosteroids | 0 | 0 | Risk Ratio (M‐H, Fixed, 95% CI) | 0.0 [0.0, 0.0] |
| 1.2 No antenatal corticosteroids | 6 | 495 | Risk Ratio (M‐H, Fixed, 95% CI) | 0.98 [0.48, 2.03] |
| 1.3 Some antenatal corticosteroids | 6 | 2850 | Risk Ratio (M‐H, Fixed, 95% CI) | 0.95 [0.64, 1.41] |
| 1.4 Not known | 1 | 307 | Risk Ratio (M‐H, Fixed, 95% CI) | 0.80 [0.25, 2.55] |
| 2 Neonatal infection confirmed with positive culture Show forest plot | 7 | 2939 | Risk Ratio (M‐H, Fixed, 95% CI) | 1.29 [0.74, 2.23] |
| 2.1 Antenatal corticosteroids | 0 | 0 | Risk Ratio (M‐H, Fixed, 95% CI) | 0.0 [0.0, 0.0] |
| 2.2 No antenatal corticosteroids | 3 | 259 | Risk Ratio (M‐H, Fixed, 95% CI) | 0.60 [0.18, 2.04] |
| 2.3 Some antenatal corticosteroids | 5 | 2680 | Risk Ratio (M‐H, Fixed, 95% CI) | 1.59 [0.85, 3.00] |
| 3 Respiratory distress syndrome Show forest plot | 12 | 3646 | Risk Ratio (M‐H, Fixed, 95% CI) | 1.29 [1.07, 1.56] |
| 3.1 Antenatal corticosteroids | 0 | 0 | Risk Ratio (M‐H, Fixed, 95% CI) | 0.0 [0.0, 0.0] |
| 3.2 No antenatal corticosteroids | 6 | 495 | Risk Ratio (M‐H, Fixed, 95% CI) | 1.32 [0.96, 1.83] |
| 3.3 Some antenatal corticosteroids | 6 | 2844 | Risk Ratio (M‐H, Fixed, 95% CI) | 1.28 [1.01, 1.63] |
| 3.4 Not known | 1 | 307 | Risk Ratio (M‐H, Fixed, 95% CI) | 1.27 [0.55, 2.94] |
| 4 Caesarean section Show forest plot | 12 | 3644 | Risk Ratio (M‐H, Fixed, 95% CI) | 1.26 [1.11, 1.44] |
| 4.1 Antenatal corticosteroids | 0 | 0 | Risk Ratio (M‐H, Fixed, 95% CI) | 0.0 [0.0, 0.0] |
| 4.2 No antenatal corticosteroids | 6 | 493 | Risk Ratio (M‐H, Fixed, 95% CI) | 1.43 [1.00, 2.06] |
| 4.3 Some antenatal corticosteroids | 6 | 2844 | Risk Ratio (M‐H, Fixed, 95% CI) | 1.27 [1.10, 1.47] |
| 4.4 Not known | 1 | 307 | Risk Ratio (M‐H, Fixed, 95% CI) | 0.91 [0.51, 1.61] |
| 5 Chorioamnionitis Show forest plot | 8 | 1358 | Risk Ratio (M‐H, Fixed, 95% CI) | 0.49 [0.33, 0.72] |
| 5.1 Antenatal corticosteroids | 0 | 0 | Risk Ratio (M‐H, Fixed, 95% CI) | 0.0 [0.0, 0.0] |
| 5.2 No antenatal corticosteroids | 4 | 398 | Risk Ratio (M‐H, Fixed, 95% CI) | 0.38 [0.22, 0.67] |
| 5.3 Some antenatal corticosteroids | 4 | 960 | Risk Ratio (M‐H, Fixed, 95% CI) | 0.61 [0.36, 1.06] |
| 6 Endometritis Show forest plot | 7 | 2980 | Risk Ratio (M‐H, Fixed, 95% CI) | 1.61 [1.00, 2.59] |
| 6.1 Antenatal corticosteroids | 0 | 0 | Risk Ratio (M‐H, Fixed, 95% CI) | 0.0 [0.0, 0.0] |
| 6.2 No antenatal corticosteroids | 2 | 185 | Risk Ratio (M‐H, Fixed, 95% CI) | 1.38 [0.32, 5.94] |
| 6.3 Some antenatal corticosteroids | 5 | 2795 | Risk Ratio (M‐H, Fixed, 95% CI) | 1.64 [0.99, 2.72] |
| Outcome or subgroup title | No. of studies | No. of participants | Statistical method | Effect size |
| 1 Neonatal infection Show forest plot | 12 | 3628 | Risk Ratio (M‐H, Fixed, 95% CI) | 0.93 [0.66, 1.30] |
| 1.1 Greater than 34 weeks' gestation | 5 | 2998 | Risk Ratio (M‐H, Fixed, 95% CI) | 0.71 [0.47, 1.07] |
| 1.2 Less than 34 weeks' gestation | 5 | 490 | Risk Ratio (M‐H, Fixed, 95% CI) | 1.61 [0.74, 3.50] |
| 1.3 Not specified (wider span) | 2 | 140 | Risk Ratio (M‐H, Fixed, 95% CI) | 2.00 [0.65, 6.18] |
| 2 Neonatal infection confirmed with positive culture Show forest plot | 7 | 2925 | Risk Ratio (M‐H, Fixed, 95% CI) | 1.24 [0.70, 2.21] |
| 2.1 Greater than 34 weeks' gestation | 4 | 2691 | Risk Ratio (M‐H, Fixed, 95% CI) | 1.07 [0.52, 2.20] |
| 2.2 Less than 34 weeks' gestation | 2 | 141 | Risk Ratio (M‐H, Fixed, 95% CI) | 1.67 [0.52, 5.35] |
| 2.3 Not specified (wider span) | 1 | 93 | Risk Ratio (M‐H, Fixed, 95% CI) | 1.53 [0.27, 8.75] |
| 3 Respiratory distress syndrome Show forest plot | 12 | 3622 | Risk Ratio (M‐H, Fixed, 95% CI) | 1.26 [1.05, 1.53] |
| 3.1 Greater than 34 weeks' gestation | 5 | 2992 | Risk Ratio (M‐H, Fixed, 95% CI) | 1.45 [1.10, 1.90] |
| 3.2 Less than 34 weeks' gestation | 5 | 490 | Risk Ratio (M‐H, Fixed, 95% CI) | 1.09 [0.84, 1.43] |
| 3.3 Not specified (wider span) | 2 | 140 | Risk Ratio (M‐H, Fixed, 95% CI) | 0.81 [0.27, 2.42] |
| 4 Caesarean section Show forest plot | 12 | 3620 | Risk Ratio (M‐H, Fixed, 95% CI) | 1.26 [1.11, 1.44] |
| 4.1 Greater than 34 weeks' gestation | 5 | 2992 | Risk Ratio (M‐H, Fixed, 95% CI) | 1.22 [1.05, 1.42] |
| 4.2 Less than 34 weeks' gestation | 5 | 488 | Risk Ratio (M‐H, Fixed, 95% CI) | 1.46 [1.08, 1.96] |
| 4.3 Not specified (wider span) | 2 | 140 | Risk Ratio (M‐H, Fixed, 95% CI) | 1.21 [0.45, 3.28] |
| 5 Chorioamnionitis Show forest plot | 8 | 1358 | Risk Ratio (M‐H, Fixed, 95% CI) | 0.49 [0.33, 0.72] |
| 5.1 Greater than 34 weeks' gestation | 3 | 847 | Risk Ratio (M‐H, Fixed, 95% CI) | 0.26 [0.12, 0.57] |
| 5.2 Less than 34 weeks' gestation | 4 | 418 | Risk Ratio (M‐H, Fixed, 95% CI) | 0.77 [0.45, 1.30] |
| 5.3 Not specified (wider span) | 1 | 93 | Risk Ratio (M‐H, Fixed, 95% CI) | 0.39 [0.15, 1.01] |
| 6 Endometritis Show forest plot | 7 | 2980 | Risk Ratio (M‐H, Fixed, 95% CI) | 1.61 [1.00, 2.59] |
| 6.1 Greater than 34 weeks' gestation | 3 | 2562 | Risk Ratio (M‐H, Fixed, 95% CI) | 0.37 [0.10, 1.40] |
| 6.2 Less than 34 weeks' gestation | 4 | 418 | Risk Ratio (M‐H, Fixed, 95% CI) | 2.23 [1.29, 3.84] |
| Outcome or subgroup title | No. of studies | No. of participants | Statistical method | Effect size |
| 1 Neonatal infection Show forest plot | 12 | 3625 | Risk Ratio (M‐H, Fixed, 95% CI) | 0.93 [0.66, 1.30] |
| 1.1 Prophylactic antibiotics used | 2 | 1702 | Risk Ratio (M‐H, Fixed, 95% CI) | 0.74 [0.42, 1.31] |
| 1.2 Prophylactic antibiotics not used | 8 | 880 | Risk Ratio (M‐H, Fixed, 95% CI) | 1.42 [0.81, 2.51] |
| 1.3 Some prophylactic antibiotics used | 2 | 736 | Risk Ratio (M‐H, Fixed, 95% CI) | 0.67 [0.30, 1.46] |
| 1.4 Not specified | 1 | 307 | Risk Ratio (M‐H, Fixed, 95% CI) | 0.80 [0.25, 2.55] |
| 2 Neonatal infection confirmed with positive culture Show forest plot | 7 | 2925 | Risk Ratio (M‐H, Fixed, 95% CI) | 1.24 [0.70, 2.21] |
| 2.1 Prophylactic antibiotics used | 1 | 120 | Risk Ratio (M‐H, Fixed, 95% CI) | 0.16 [0.01, 2.99] |
| 2.2 Prophylactic antibiotics not used | 3 | 234 | Risk Ratio (M‐H, Fixed, 95% CI) | 1.63 [0.62, 4.28] |
| 2.3 Some prophylactic antibiotics used | 3 | 2571 | Risk Ratio (M‐H, Fixed, 95% CI) | 1.35 [0.62, 2.93] |
| 3 Respiratory distress syndrome Show forest plot | 12 | 3622 | Risk Ratio (M‐H, Fixed, 95% CI) | 1.29 [1.06, 1.56] |
| 3.1 Prophylactic antibiotics used | 1 | 120 | Risk Ratio (M‐H, Fixed, 95% CI) | 1.11 [0.23, 5.26] |
| 3.2 Prophylactic antibiotics not used | 7 | 630 | Risk Ratio (M‐H, Fixed, 95% CI) | 1.11 [0.85, 1.45] |
| 3.3 Some prophylactic antibiotics used | 3 | 2565 | Risk Ratio (M‐H, Fixed, 95% CI) | 1.48 [1.10, 1.99] |
| 3.4 Not specified | 1 | 307 | Risk Ratio (M‐H, Fixed, 95% CI) | 1.27 [0.55, 2.94] |
| 4 Caesarean section Show forest plot | 12 | 3620 | Risk Ratio (M‐H, Fixed, 95% CI) | 1.30 [1.14, 1.49] |
| 4.1 Prophylactic antibiotics used | 1 | 120 | Risk Ratio (M‐H, Fixed, 95% CI) | 1.47 [0.34, 6.30] |
| 4.2 Prophylactic antibiotics not used | 7 | 628 | Risk Ratio (M‐H, Fixed, 95% CI) | 1.43 [1.08, 1.90] |
| 4.3 Some prophylactic antibiotics used | 3 | 2565 | Risk Ratio (M‐H, Fixed, 95% CI) | 1.31 [1.12, 1.53] |
| 4.4 Not specified | 1 | 307 | Risk Ratio (M‐H, Fixed, 95% CI) | 0.91 [0.51, 1.61] |
| 5 Chorioamnionitis Show forest plot | 8 | 1358 | Risk Ratio (M‐H, Random, 95% CI) | 0.50 [0.26, 0.95] |
| 5.1 Prophylactic antibiotics used | 1 | 120 | Risk Ratio (M‐H, Random, 95% CI) | 0.11 [0.01, 0.84] |
| 5.2 Prophylactic antibiotics not used | 5 | 511 | Risk Ratio (M‐H, Random, 95% CI) | 0.69 [0.34, 1.41] |
| 5.3 Some prophylactic antibiotics used | 2 | 727 | Risk Ratio (M‐H, Random, 95% CI) | 0.35 [0.15, 0.86] |
| 6 Endometritis Show forest plot | 7 | 2980 | Risk Ratio (M‐H, Fixed, 95% CI) | 1.61 [1.00, 2.59] |
| 6.1 Prophylactic antibiotics used | 0 | 0 | Risk Ratio (M‐H, Fixed, 95% CI) | 0.0 [0.0, 0.0] |
| 6.2 Prophylactic antibiotics not used | 4 | 418 | Risk Ratio (M‐H, Fixed, 95% CI) | 2.23 [1.29, 3.84] |
| 6.3 Some prophylactic antibiotics used | 3 | 2562 | Risk Ratio (M‐H, Fixed, 95% CI) | 0.37 [0.10, 1.40] |
| Outcome or subgroup title | No. of studies | No. of participants | Statistical method | Effect size |
| 1 Neonatal infection Show forest plot | 12 | 3628 | Risk Ratio (M‐H, Fixed, 95% CI) | 0.93 [0.66, 1.30] |
| 1.1 Less than 24 hours from randomisation | 4 | 391 | Risk Ratio (M‐H, Fixed, 95% CI) | 0.90 [0.41, 1.99] |
| 1.2 Greater than 24 hours from randomisation | 7 | 2930 | Risk Ratio (M‐H, Fixed, 95% CI) | 0.95 [0.64, 1.41] |
| 1.3 Not known | 1 | 307 | Risk Ratio (M‐H, Fixed, 95% CI) | 0.80 [0.25, 2.55] |
| 2 Neonatal infection confirmed with positive culture Show forest plot | 7 | 2925 | Risk Ratio (M‐H, Fixed, 95% CI) | 1.24 [0.70, 2.21] |
| 2.1 Less than 24 hours from randomisation | 2 | 213 | Risk Ratio (M‐H, Fixed, 95% CI) | 0.67 [0.18, 2.53] |
| 2.2 Greater than 24 hours from randomisation | 5 | 2712 | Risk Ratio (M‐H, Fixed, 95% CI) | 1.44 [0.76, 2.75] |
| 3 Respiratory distress syndrome Show forest plot | 12 | 3622 | Risk Ratio (M‐H, Fixed, 95% CI) | 1.29 [1.06, 1.56] |
| 3.1 Less than 24 hours from randomisation | 4 | 391 | Risk Ratio (M‐H, Fixed, 95% CI) | 0.99 [0.65, 1.50] |
| 3.2 Greater than 24 hours from randomisation | 7 | 2924 | Risk Ratio (M‐H, Fixed, 95% CI) | 1.37 [1.10, 1.71] |
| 3.3 Not known | 1 | 307 | Risk Ratio (M‐H, Fixed, 95% CI) | 1.27 [0.55, 2.94] |
| 4 Caesarean section Show forest plot | 12 | 3620 | Risk Ratio (M‐H, Fixed, 95% CI) | 1.26 [1.11, 1.44] |
| 4.1 Less than 24 hours from randomisation | 4 | 389 | Risk Ratio (M‐H, Fixed, 95% CI) | 1.59 [0.90, 2.81] |
| 4.2 Greater than 24 hours from randomisation | 7 | 2924 | Risk Ratio (M‐H, Fixed, 95% CI) | 1.27 [1.10, 1.46] |
| 4.3 Not known | 1 | 307 | Risk Ratio (M‐H, Fixed, 95% CI) | 0.91 [0.51, 1.61] |
| 5 Chorioamnionitis Show forest plot | 8 | 1358 | Risk Ratio (M‐H, Random, 95% CI) | 0.50 [0.26, 0.95] |
| 5.1 Less than 24 hours from randomisation | 3 | 342 | Risk Ratio (M‐H, Random, 95% CI) | 0.25 [0.10, 0.61] |
| 5.2 Greater than 24 hours from randomisation | 5 | 1016 | Risk Ratio (M‐H, Random, 95% CI) | 0.76 [0.41, 1.42] |
| 6 Endometritis Show forest plot | 7 | 2980 | Risk Ratio (M‐H, Fixed, 95% CI) | 1.61 [1.00, 2.59] |
| 6.1 Less than 24 hours from randomisation | 1 | 129 | Risk Ratio (M‐H, Fixed, 95% CI) | 1.67 [0.29, 9.68] |
| 6.2 Greater than 24 hours from randomisation | 6 | 2851 | Risk Ratio (M‐H, Fixed, 95% CI) | 1.60 [0.98, 2.63] |