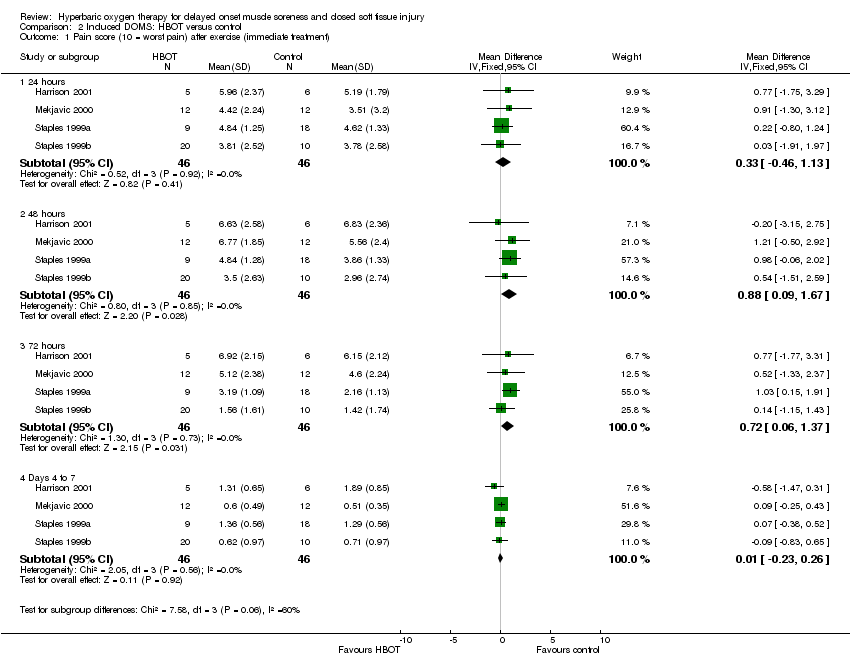
| 1 Pain score (10 = worst pain) after exercise (immediate treatment) Show forest plot | 4 | | Mean Difference (IV, Fixed, 95% CI) | Subtotals only |
|
| 1.1 24 hours | 4 | 92 | Mean Difference (IV, Fixed, 95% CI) | 0.33 [‐0.46, 1.13] |
| 1.2 48 hours | 4 | 92 | Mean Difference (IV, Fixed, 95% CI) | 0.88 [0.09, 1.67] |
| 1.3 72 hours | 4 | 92 | Mean Difference (IV, Fixed, 95% CI) | 0.72 [0.06, 1.37] |
| 1.4 Days 4 to 7 | 4 | 92 | Mean Difference (IV, Fixed, 95% CI) | 0.01 [‐0.23, 0.26] |
| 2 Pain score (10 = worst pain) after exercise (immediate treatment) by muscle group at 48 hours Show forest plot | 4 | 92 | Mean Difference (IV, Fixed, 95% CI) | 0.88 [0.09, 1.67] |
|
| 2.1 Quadriceps muscles | 2 | 57 | Mean Difference (IV, Fixed, 95% CI) | 0.89 [‐0.04, 1.82] |
| 2.2 Forearm muscles | 2 | 35 | Mean Difference (IV, Fixed, 95% CI) | 0.85 [‐0.63, 2.34] |
| 3 Pain score (10 = worst pain) after exercise (delayed treatment) Show forest plot | 2 | | Mean Difference (IV, Fixed, 95% CI) | Subtotals only |
|
| 3.1 24 hours | 2 | 40 | Mean Difference (IV, Fixed, 95% CI) | 0.26 [‐0.66, 1.17] |
| 3.2 48 hours | 2 | 40 | Mean Difference (IV, Fixed, 95% CI) | 0.69 [‐0.25, 1.63] |
| 3.3 72 hours | 2 | 40 | Mean Difference (IV, Fixed, 95% CI) | 0.85 [0.06, 1.64] |
| 3.4 Days 4 or 7 | 2 | 40 | Mean Difference (IV, Fixed, 95% CI) | ‐0.10 [‐0.60, 0.41] |
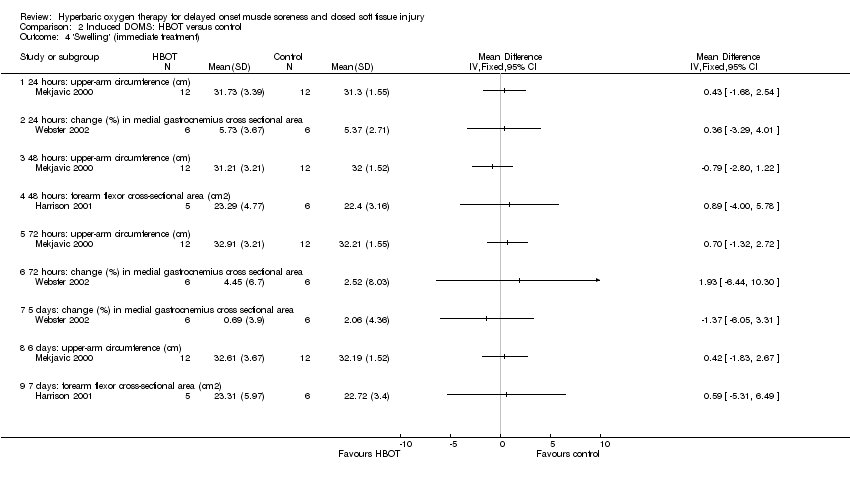
| 4 'Swelling' (immediate treatment) Show forest plot | 3 | | Mean Difference (IV, Fixed, 95% CI) | Totals not selected |
|
| 4.1 24 hours: upper‐arm circumference (cm) | 1 | | Mean Difference (IV, Fixed, 95% CI) | 0.0 [0.0, 0.0] |
| 4.2 24 hours: change (%) in medial gastrocnemius cross sectional area | 1 | | Mean Difference (IV, Fixed, 95% CI) | 0.0 [0.0, 0.0] |
| 4.3 48 hours: upper‐arm circumference (cm) | 1 | | Mean Difference (IV, Fixed, 95% CI) | 0.0 [0.0, 0.0] |
| 4.4 48 hours: forearm flexor cross‐sectional area (cm2) | 1 | | Mean Difference (IV, Fixed, 95% CI) | 0.0 [0.0, 0.0] |
| 4.5 72 hours: upper‐arm circumference (cm) | 1 | | Mean Difference (IV, Fixed, 95% CI) | 0.0 [0.0, 0.0] |
| 4.6 72 hours: change (%) in medial gastrocnemius cross sectional area | 1 | | Mean Difference (IV, Fixed, 95% CI) | 0.0 [0.0, 0.0] |
| 4.7 5 days: change (%) in medial gastrocnemius cross sectional area | 1 | | Mean Difference (IV, Fixed, 95% CI) | 0.0 [0.0, 0.0] |
| 4.8 6 days: upper‐arm circumference (cm) | 1 | | Mean Difference (IV, Fixed, 95% CI) | 0.0 [0.0, 0.0] |
| 4.9 7 days: forearm flexor cross‐sectional area (cm2) | 1 | | Mean Difference (IV, Fixed, 95% CI) | 0.0 [0.0, 0.0] |
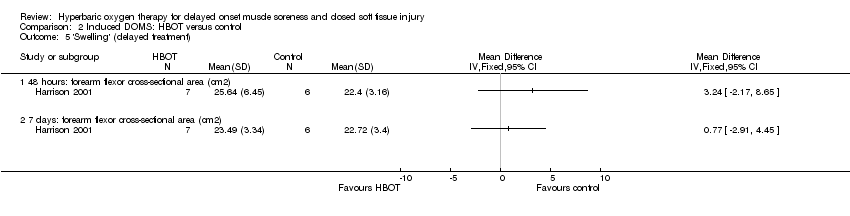
| 5 'Swelling' (delayed treatment) Show forest plot | 1 | | Mean Difference (IV, Fixed, 95% CI) | Totals not selected |
|
| 5.1 48 hours: forearm flexor cross‐sectional area (cm2) | 1 | | Mean Difference (IV, Fixed, 95% CI) | 0.0 [0.0, 0.0] |
| 5.2 7 days: forearm flexor cross‐sectional area (cm2) | 1 | | Mean Difference (IV, Fixed, 95% CI) | 0.0 [0.0, 0.0] |
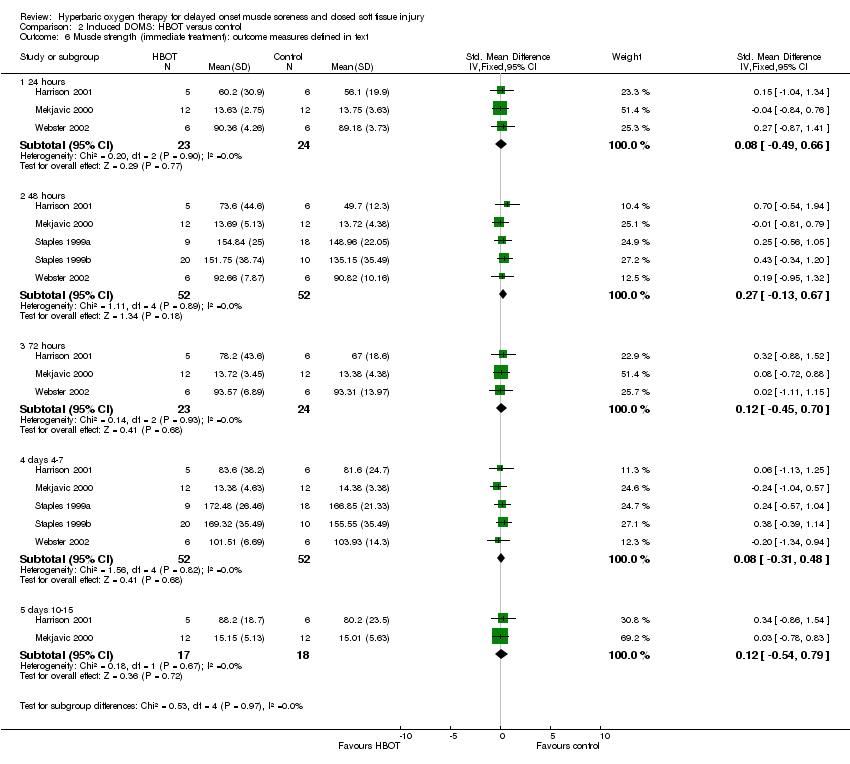
| 6 Muscle strength (immediate treatment): outcome measures defined in text Show forest plot | 5 | | Std. Mean Difference (IV, Fixed, 95% CI) | Subtotals only |
|
| 6.1 24 hours | 3 | 47 | Std. Mean Difference (IV, Fixed, 95% CI) | 0.08 [‐0.49, 0.66] |
| 6.2 48 hours | 5 | 104 | Std. Mean Difference (IV, Fixed, 95% CI) | 0.27 [‐0.13, 0.67] |
| 6.3 72 hours | 3 | 47 | Std. Mean Difference (IV, Fixed, 95% CI) | 0.12 [‐0.45, 0.70] |
| 6.4 days 4‐7 | 5 | 104 | Std. Mean Difference (IV, Fixed, 95% CI) | 0.08 [‐0.31, 0.48] |
| 6.5 days 10‐15 | 2 | 35 | Std. Mean Difference (IV, Fixed, 95% CI) | 0.12 [‐0.54, 0.79] |
| 7 Muscle strength (delayed treatment): outcome measures defined in text Show forest plot | 2 | | Std. Mean Difference (IV, Fixed, 95% CI) | Subtotals only |
|
| 7.1 24 hours | 1 | 13 | Std. Mean Difference (IV, Fixed, 95% CI) | ‐0.85 [‐2.01, 0.31] |
| 7.2 48 hours | 2 | 40 | Std. Mean Difference (IV, Fixed, 95% CI) | 0.18 [‐0.47, 0.83] |
| 7.3 72 hours | 1 | 13 | Std. Mean Difference (IV, Fixed, 95% CI) | ‐0.66 [‐1.79, 0.47] |
| 7.4 96 hours | 2 | 40 | Std. Mean Difference (IV, Fixed, 95% CI) | 0.13 [‐0.53, 0.79] |
| 7.5 Day 15 | 1 | 13 | Std. Mean Difference (IV, Fixed, 95% CI) | ‐0.03 [‐1.12, 1.06] |