نقش شیمیدرمانی کمکی (پس از جراحی) در درمان سرطان اپیتلیال تخمدان در مرحله اولیه
Referencias
منابع مطالعات واردشده در این مرور
منابع مطالعات خارجشده از این مرور
منابع اضافی
منابع دیگر نسخههای منتشرشده این مرور
Characteristics of studies
Characteristics of included studies [ordered by study ID]
Ir a:
| Methods | Multicentre RCT | |
| Participants | 448 FIGO Ia‐Ib G2/3, FIGO Ic‐IIa, FIGO I‐IIa clear cell Stage 1 a‐1c (93%), IIa (7%) G1 (12%), G2 (51%), G3 (35%) | |
| Interventions | Immediate platinum‐based chemotherapy versus treatment on progression | |
| Outcomes | DFS and OS Adverse events not reported Median follow‐up: 5.5 years | |
| Notes | Subgroup analysis examined impact of staging adequacy | |
| Risk of bias | ||
| Bias | Authors' judgement | Support for judgement |
| Random sequence generation (selection bias) | Low risk | Based on minimisation. |
| Allocation concealment (selection bias) | Low risk | Minimisation performed by central co‐ordinating centres. |
| Incomplete outcome data (attrition bias) | Low risk | T: 6/224 (2%) C: 3/224 (1%) |
| Blinding of outcome assessors (detection bias) | High risk | No blinding |
| Selective reporting (reporting bias) | Unclear risk | Intention‐to‐treat (ITT) analysis; all pre‐specified outcomes reported. DSS appears to be preferentially reported over OS in the 10‐year follow‐up report of subgroup data according to the adequacy of surgical staging, and is not consistent with the RFS data. |
| Methods | RCT | |
| Participants | 85 FIGO (1976) IA‐IB Grade 2 and 3 | |
| Interventions | Cisplatin 50 mg/m² x 6 cycles Q 28/7 versus observation | |
| Outcomes | DFS 83% versus 64% Adverse events in adjuvant chemotherapy arm: nausea and vomiting in more than 2/3 of patients; but in severe form in less than 10% of courses; leukopenia and thrombocytopenia in 14% of patients but ≥ Grade 3 in only 1% of patients; no episodes of febrile infection Adverse events in no adjuvant chemotherapy arm: not reported | |
| Notes | Patients with residual disease in both arms | |
| Risk of bias | ||
| Bias | Authors' judgement | Support for judgement |
| Random sequence generation (selection bias) | Low risk | |
| Allocation concealment (selection bias) | Low risk | |
| Incomplete outcome data (attrition bias) | Low risk | |
| Blinding of outcome assessors (detection bias) | Unclear risk | Not reported. |
| Methods | Multicentre RCT | |
| Participants | 447 FIGO I‐III Low‐risk defined as stage Ia, G1 (13%); intermediate risk defined as stage Ia, G2 and stage Ib/Ic G1 (38%); high risk defined as stage Ib/Ic grade 2/3 or any stage I grade 3 or clear cell histology (47%) | |
| Interventions | Immediate platinum‐based chemotherapy versus treatment on progression | |
| Outcomes | DFS and OS Adverse events in adjuvant chemotherapy arm: 63/241 (26%) experienced toxicity sufficient to require modification of treatment Median follow‐up of surviving women: 51 months (Colombo 2003) Median follow‐up: 10 years (Collinson 2014) | |
| Notes | Long‐term follow‐up examined subgroup differences according to risk. Low‐ and intermediate‐risk data were combined due to a lack of power "without reference to outcomes". The risk groups were pre‐specified "before the data set lock for analyses". We were unable to obtain clarification from the trial authors regarding the effect of combining low risk with intermediate risk on the estimates. | |
| Risk of bias | ||
| Bias | Authors' judgement | Support for judgement |
| Random sequence generation (selection bias) | Low risk | |
| Allocation concealment (selection bias) | Low risk | |
| Incomplete outcome data (attrition bias) | Low risk | |
| Blinding of outcome assessors (detection bias) | High risk | |
| Methods | RCT | |
| Participants | 162 high risk | |
| Interventions | Carboplatin 6 cycles Q28/7 AUC = 7 versus treatment at progression | |
| Outcomes | DFS and OS Adverse events not reported Median follow‐up: 46 months | |
| Notes | ||
| Risk of bias | ||
| Bias | Authors' judgement | Support for judgement |
| Random sequence generation (selection bias) | Low risk | |
| Allocation concealment (selection bias) | Low risk | |
| Incomplete outcome data (attrition bias) | Low risk | |
| Methods | RCT | |
| Participants | 92 FIGO stage I | |
| Interventions | Melphalan chemotherapy versus treatment on progression | |
| Outcomes | DFS and OS Adverse events in adjuvant chemotherapy arm: 79% had some degree of myelosuppression; 7 patients (16%) had severe myelosuppression; 5 patients (12%) had platelet count nadirs under 50,000 platelets/mm³; 4 patients (9%) had platelet count nadirs under 2000 platelets/mm³; no infectious complications related to leukopenia; no bleeding episodes related to thrombocytopenia induced by chemotherapy. Eleven patients (26%) reported mild‐to‐moderate gastric gastrointestinal side effects. No other adverse effects were reported. One patient died 6 years after completing treatment, with a diagnosis of aplastic anaemia; no other myeloprolific disorders or second cancers were seen after > 250 person‐years follow‐up. Adverse events in no adjuvant chemotherapy arm: not reported Median follow‐up of surviving women: 6 years | |
| Notes | Melphalan produced severe myelosuppression | |
| Risk of bias | ||
| Bias | Authors' judgement | Support for judgement |
| Random sequence generation (selection bias) | Low risk | Based on computer‐generated random numbers. |
| Allocation concealment (selection bias) | Low risk | Central randomisation by telephone call to co‐ordinating centre. |
| Incomplete outcome data (attrition bias) | Low risk | Deemed ineligible after randomisation: Did not report whether any further loss to follow‐up occurred |
| Blinding of outcome assessors (detection bias) | Unclear risk | Not reported. |
| Selective reporting (reporting bias) | Unclear risk | ITT analysis; adverse events in 'no adjuvant chemotherapy' arm not reported. |
Abbreviations: AUC = area under curve; C = control; DFS = disease‐free survival; ITT = intention‐to‐treat; OS = overall survival; T = treatment: DSS = Disease‐specific survival; RFS = recurrence‐free survival
Characteristics of excluded studies [ordered by study ID]
Ir a:
| Study | Reason for exclusion |
| Not a RCT. | |
| Not a RCT. | |
| Not a RCT. | |
| Not a RCT. | |
| This RCT compared whole abdominal radiotherapy (WAR) versus cyclophosphamide, adriamycin, and cisplatin (CAP) chemotherapy. | |
| Not a RCT. | |
| Not a RCT. | |
| A RCT of radiotherapy versus radiotherapy plus chlorambucil. | |
| Not a RCT. | |
| Not a RCT. | |
| Quasi‐randomised trial (by birth month) comparing single or combined chemotherapy agents with radiotherapy or surgery alone in women with epithelial ovarian cancer stages I to IV. Included 150 women with stage I/II epithelial ovarian cancer randomised to 3 groups (surgery only, surgery + chemotherapy (CT), or surgery + radiotherapy (RT)). Followed up for 3 years. | |
| This trial compared chemotherapy against radiotherapy and no further treatment. It did not specify the method of randomisation and a prognostic balance was not achieved in the different trial arms. | |
| This trial compared 3 different adjuvant treatments all given after pelvic radiotherapy: melphalan, whole abdominal radiotherapy, and intraperitoneal radio‐isotope therapy. | |
| This trial compared adjuvant whole abdominal radiotherapy with CAP. | |
| This was a trial comparing systematic lymphadenectomy with lymph node sampling in apparent early stage ovarian cancer; it was not a trial of adjuvant treatment. | |
| A randomised trial of maintenance low‐dose paclitaxel for 24 weeks versus observation, in completely resected early‐stage ovarian cancer patients receiving 3 cycles of chemotherapy (CP). The trial is also known as GOG 175. | |
| This trial compared whole abdominal radiotherapy to a combination of pelvic radiotherapy and cyclophosphamide. Additionally the block randomisation method did not achieve prognostic balance between the 2 trial arms. | |
| This was a trial of adjuvant radiotherapy versus adjuvant chemo‐irradiation in women with early stage ovarian cancer. | |
| This trial compared melphalan chemotherapy to observation for mucinous stage Ia and Ib tumours, chemotherapy versus radiotherapy compared for non‐mucinous stage Ia and Ib, and radiotherapy versus chemo‐radiotherapy in stage Ic to IIc. There was a stratified quasi‐randomisation which did not achieve prognostic balance between the various trial arms. | |
| This trial compared melphalan chemotherapy versus whole abdominal radiotherapy; the method of randomisation was unspecified and more patients with stage 1 disease were in the chemotherapy arm. | |
| This was a methodologically good trial with central computerised randomisation; it compared chemotherapy with intraperitoneal radio‐isotope therapy. | |
| A RCT of adjuvant chemotherapy in women with advanced (stage III) ovarian cancer. | |
| The comparison was between 3 and 6 cycles of platinum‐based adjuvant chemotherapy. | |
| This trial compared intraperitoneal radio‐isotope therapy with cyclophosphamide and cisplatin chemotherapy after surgery in early stage disease; there was no control arm on observation only. |
Abbreviations: CAP = cyclophosphamide, adriamycin and cisplatin; CT = chemotherapy; RCT = randomised controlled trial; RT = radiotherapy.
Data and analyses
| Outcome or subgroup title | No. of studies | No. of participants | Statistical method | Effect size |
| 1 Overall survival (5 yr) Show forest plot | 3 | 1008 | Hazard Ratio (Random, 95% CI) | 0.71 [0.53, 0.93] |
| Analysis 1.1  Comparison 1 Adjuvant chemotherapy versus observation, Outcome 1 Overall survival (5 yr). | ||||
| 2 Deaths total (5 yr) Show forest plot | 4 | 1089 | Risk Ratio (M‐H, Random, 95% CI) | 0.72 [0.56, 0.93] |
| Analysis 1.2  Comparison 1 Adjuvant chemotherapy versus observation, Outcome 2 Deaths total (5 yr). | ||||
| 3 Overall survival (10 yr) Show forest plot | 2 | 925 | Hazard Ratio (Random, 95% CI) | 0.72 [0.57, 0.92] |
| Analysis 1.3  Comparison 1 Adjuvant chemotherapy versus observation, Outcome 3 Overall survival (10 yr). | ||||
| 4 Death total (10 yr) Show forest plot | 2 | 923 | Risk Ratio (M‐H, Random, 95% CI) | 0.76 [0.62, 0.94] |
| Analysis 1.4  Comparison 1 Adjuvant chemotherapy versus observation, Outcome 4 Death total (10 yr). | ||||
| 5 Progression‐free survival (5 yr) Show forest plot | 4 | 1170 | Hazard Ratio (Random, 95% CI) | 0.67 [0.53, 0.84] |
| Analysis 1.5  Comparison 1 Adjuvant chemotherapy versus observation, Outcome 5 Progression‐free survival (5 yr). | ||||
| 6 Progression total (5 yr) Show forest plot | 4 | 1089 | Risk Ratio (M‐H, Random, 95% CI) | 0.69 [0.57, 0.84] |
| Analysis 1.6  Comparison 1 Adjuvant chemotherapy versus observation, Outcome 6 Progression total (5 yr). | ||||
| 7 Progression‐free survival (10 yr) Show forest plot | 2 | 925 | Hazard Ratio (Random, 95% CI) | 0.67 [0.53, 0.83] |
| Analysis 1.7  Comparison 1 Adjuvant chemotherapy versus observation, Outcome 7 Progression‐free survival (10 yr). | ||||
| 8 Progression total (10 yr) Show forest plot | 2 | 925 | Risk Ratio (M‐H, Random, 95% CI) | 0.72 [0.60, 0.87] |
| Analysis 1.8  Comparison 1 Adjuvant chemotherapy versus observation, Outcome 8 Progression total (10 yr). | ||||
| 9 Disease‐specific survival (5 yr) Show forest plot | 1 | Hazard Ratio (Random, 95% CI) | Subtotals only | |
| Analysis 1.9  Comparison 1 Adjuvant chemotherapy versus observation, Outcome 9 Disease‐specific survival (5 yr). | ||||
| 10 Disease‐specific survival (10 yr) Show forest plot | 1 | Hazard Ratio (Random, 95% CI) | Subtotals only | |
| Analysis 1.10  Comparison 1 Adjuvant chemotherapy versus observation, Outcome 10 Disease‐specific survival (10 yr). | ||||
| 11 Subgroup analysis by staging: 5‐yr OS Show forest plot | 3 | Hazard Ratio (Random, 95% CI) | Subtotals only | |
| Analysis 1.11  Comparison 1 Adjuvant chemotherapy versus observation, Outcome 11 Subgroup analysis by staging: 5‐yr OS. | ||||
| 11.1 Optimal staging | 2 | 234 | Hazard Ratio (Random, 95% CI) | 1.22 [0.63, 2.37] |
| 11.2 Suboptimal staging | 2 | 772 | Hazard Ratio (Random, 95% CI) | 0.63 [0.46, 0.85] |
| 12 Subgroup analysis by staging: 10 yr DSS Show forest plot | 1 | Hazard Ratio (Random, 95% CI) | Subtotals only | |
| Analysis 1.12  Comparison 1 Adjuvant chemotherapy versus observation, Outcome 12 Subgroup analysis by staging: 10 yr DSS. | ||||
| 12.1 Optimal staging | 1 | 151 | Hazard Ratio (Random, 95% CI) | 1.58 [0.61, 4.09] |
| 12.2 Suboptimal staging | 1 | 295 | Hazard Ratio (Random, 95% CI) | 0.58 [0.35, 0.96] |
| 13 Subgroup analysis by staging: death from ovarian cancer (10 years) Show forest plot | 2 | 923 | Risk Ratio (M‐H, Random, 95% CI) | 0.78 [0.54, 1.12] |
| Analysis 1.13  Comparison 1 Adjuvant chemotherapy versus observation, Outcome 13 Subgroup analysis by staging: death from ovarian cancer (10 years). | ||||
| 13.1 Optimal staging | 1 | 151 | Risk Ratio (M‐H, Random, 95% CI) | 1.55 [0.64, 3.79] |
| 13.2 Suboptimal staging | 2 | 772 | Risk Ratio (M‐H, Random, 95% CI) | 0.70 [0.54, 0.92] |
| 14 Subgroup analysis by staging: 5‐yr PFS Show forest plot | 4 | 1168 | Hazard Ratio (Random, 95% CI) | 0.64 [0.52, 0.78] |
| Analysis 1.14  Comparison 1 Adjuvant chemotherapy versus observation, Outcome 14 Subgroup analysis by staging: 5‐yr PFS. | ||||
| 14.1 Optimal staging | 2 | 234 | Hazard Ratio (Random, 95% CI) | 0.67 [0.36, 1.22] |
| 14.2 Suboptimal staging | 3 | 934 | Hazard Ratio (Random, 95% CI) | 0.64 [0.50, 0.82] |
| 15 Subgroup analysis by staging: 10‐yr PFS Show forest plot | 2 | 923 | Hazard Ratio (Random, 95% CI) | 0.66 [0.53, 0.83] |
| Analysis 1.15  Comparison 1 Adjuvant chemotherapy versus observation, Outcome 15 Subgroup analysis by staging: 10‐yr PFS. | ||||
| 15.1 Optimal staging | 1 | 151 | Hazard Ratio (Random, 95% CI) | 0.73 [0.38, 1.42] |
| 15.2 Suboptimal staging | 2 | 772 | Hazard Ratio (Random, 95% CI) | 0.65 [0.52, 0.83] |
| 16 Subgroup analysis by staging: progression of ovarian cancer (10 years) Show forest plot | 2 | 923 | Risk Ratio (M‐H, Random, 95% CI) | 0.71 [0.58, 0.87] |
| Analysis 1.16  Comparison 1 Adjuvant chemotherapy versus observation, Outcome 16 Subgroup analysis by staging: progression of ovarian cancer (10 years). | ||||
| 16.1 Optimal staging | 1 | 151 | Risk Ratio (M‐H, Random, 95% CI) | 0.70 [0.39, 1.26] |
| 16.2 Suboptimal staging | 2 | 772 | Risk Ratio (M‐H, Random, 95% CI) | 0.71 [0.58, 0.88] |
| 17 Subgroup analysis by risk: 10‐yr OS Show forest plot | 1 | 414 | Hazard Ratio (Random, 95% CI) | 0.66 [0.38, 1.13] |
| Analysis 1.17  Comparison 1 Adjuvant chemotherapy versus observation, Outcome 17 Subgroup analysis by risk: 10‐yr OS. | ||||
| 17.1 Low/intermediate risk | 1 | 198 | Hazard Ratio (Random, 95% CI) | 0.91 [0.49, 1.69] |
| 17.2 High risk | 1 | 216 | Hazard Ratio (Random, 95% CI) | 0.52 [0.33, 0.81] |
| 18 Subgroup analysis by risk: 10‐yr PFS Show forest plot | 1 | 414 | Hazard Ratio (Random, 95% CI) | 0.64 [0.34, 1.21] |
| Analysis 1.18  Comparison 1 Adjuvant chemotherapy versus observation, Outcome 18 Subgroup analysis by risk: 10‐yr PFS. | ||||
| 18.1 Low/medium | 1 | 198 | Hazard Ratio (Random, 95% CI) | 0.92 [0.52, 1.64] |
| 18.2 High | 1 | 216 | Hazard Ratio (Random, 95% CI) | 0.48 [0.32, 0.73] |
| 19 Subgroup analysis by risk: progression at 10 yrs Show forest plot | 1 | 414 | Risk Ratio (M‐H, Random, 95% CI) | 0.71 [0.53, 0.95] |
| Analysis 1.19  Comparison 1 Adjuvant chemotherapy versus observation, Outcome 19 Subgroup analysis by risk: progression at 10 yrs. | ||||
| 19.1 Low/intermediate risk | 1 | 198 | Risk Ratio (M‐H, Random, 95% CI) | 0.88 [0.53, 1.46] |
| 19.2 High risk | 1 | 216 | Risk Ratio (M‐H, Random, 95% CI) | 0.64 [0.46, 0.90] |
| 20 Subgroup analysis by risk: deaths by 10 yrs Show forest plot | 1 | 414 | Risk Ratio (M‐H, Random, 95% CI) | 0.72 [0.53, 0.98] |
| Analysis 1.20  Comparison 1 Adjuvant chemotherapy versus observation, Outcome 20 Subgroup analysis by risk: deaths by 10 yrs. | ||||
| 20.1 Low/intermediate risk | 1 | 198 | Risk Ratio (M‐H, Random, 95% CI) | 0.87 [0.50, 1.51] |
| 20.2 High risk | 1 | 216 | Risk Ratio (M‐H, Random, 95% CI) | 0.67 [0.47, 0.96] |
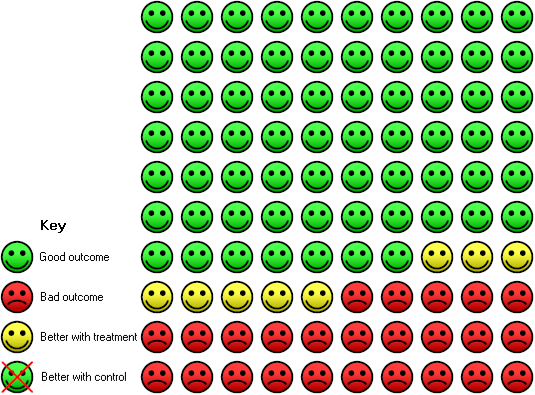
Risk of death in the 10 years after surgery for women with early stage ovarian cancer treated with adjuvant chemotherapy: In the control group 33 women had died compared to 25 (20 to 31) out of 100 in the active treatment group.

Risk of cancer progression/recurrence in the 10 years after surgery for women with early stage ovarian cancer treated with adjuvant chemotherapy: in the control group 39 women had progressive disease compared to 28 (23 to 34) out of 100 in the active treatment group.

Risk of death in the 10 years after surgery for women with high risk early stage ovarian cancer treated with adjuvant chemotherapy: in the control group 44 people out of 100 died, compared to 32 (95% CI 23 to 43) out of 100 for the active treatment group.
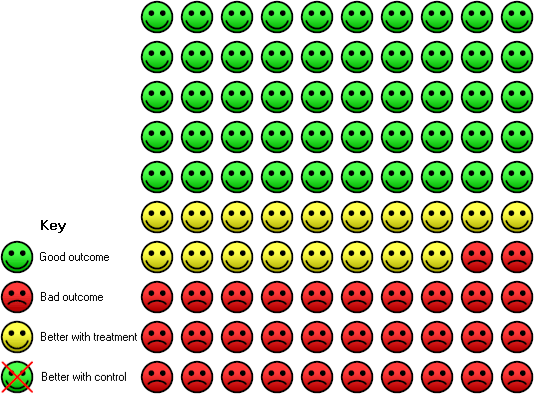
Risk of cancer progression/recurrence in the 10 years after surgery for women with high risk early stage ovarian cancer treated with adjuvant chemotherapy: in the control group 50 women had progressive disease compared to 32 (23 to 45) out of 100 in the active treatment group.
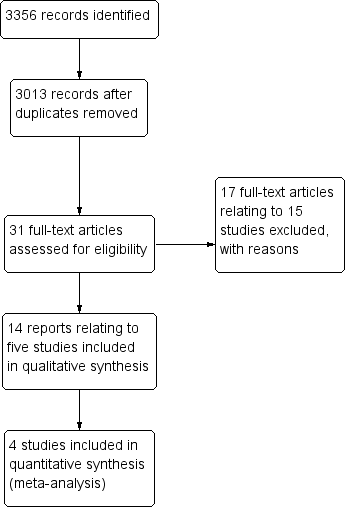
Study flow diagram of search results (up to August 2011).
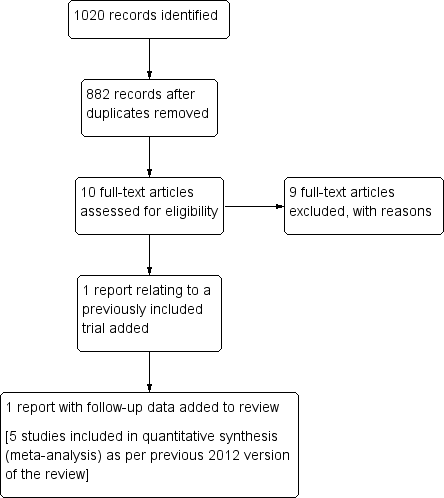
Study flow diagram of the literature search results (24 March 2015).
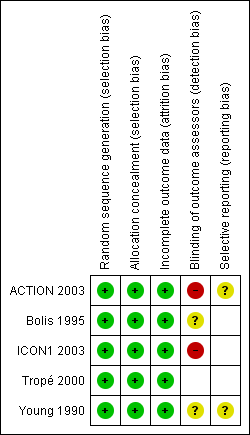
'Risk of bias' summary: review authors' judgements about each 'Risk of bias' item for each included study.
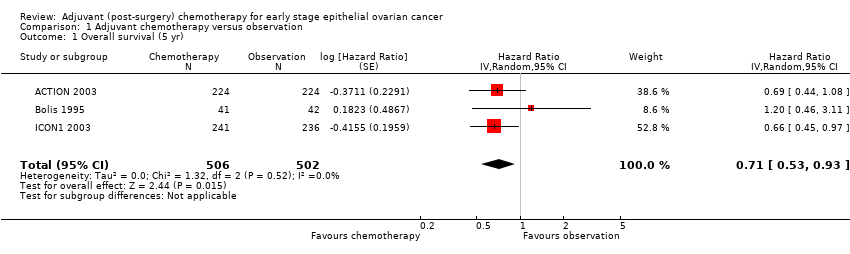
Comparison 1 Adjuvant chemotherapy versus observation, Outcome 1 Overall survival (5 yr).

Comparison 1 Adjuvant chemotherapy versus observation, Outcome 2 Deaths total (5 yr).

Comparison 1 Adjuvant chemotherapy versus observation, Outcome 3 Overall survival (10 yr).

Comparison 1 Adjuvant chemotherapy versus observation, Outcome 4 Death total (10 yr).

Comparison 1 Adjuvant chemotherapy versus observation, Outcome 5 Progression‐free survival (5 yr).

Comparison 1 Adjuvant chemotherapy versus observation, Outcome 6 Progression total (5 yr).
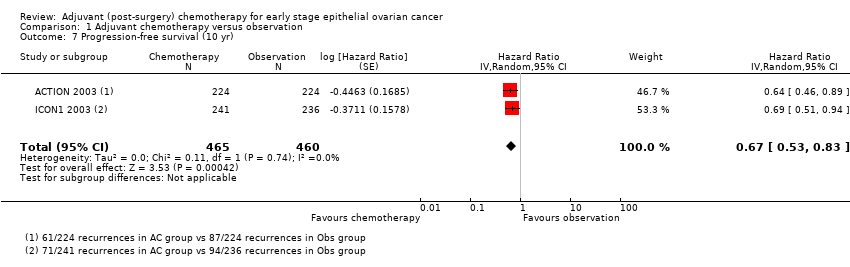
Comparison 1 Adjuvant chemotherapy versus observation, Outcome 7 Progression‐free survival (10 yr).

Comparison 1 Adjuvant chemotherapy versus observation, Outcome 8 Progression total (10 yr).
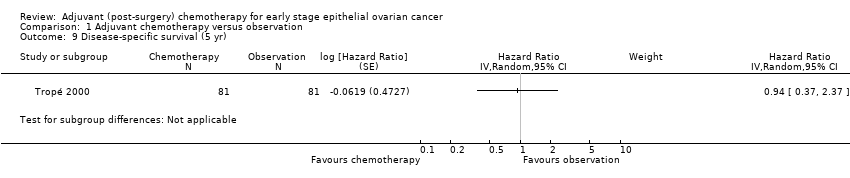
Comparison 1 Adjuvant chemotherapy versus observation, Outcome 9 Disease‐specific survival (5 yr).
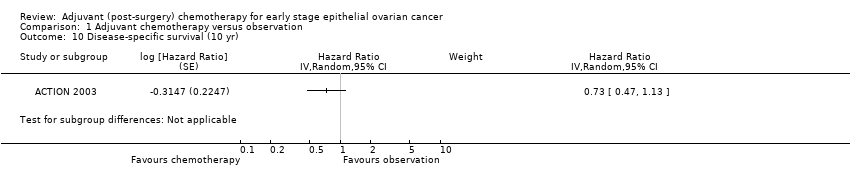
Comparison 1 Adjuvant chemotherapy versus observation, Outcome 10 Disease‐specific survival (10 yr).
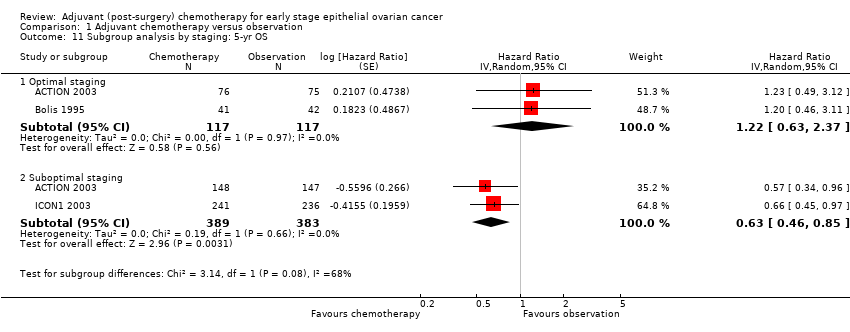
Comparison 1 Adjuvant chemotherapy versus observation, Outcome 11 Subgroup analysis by staging: 5‐yr OS.
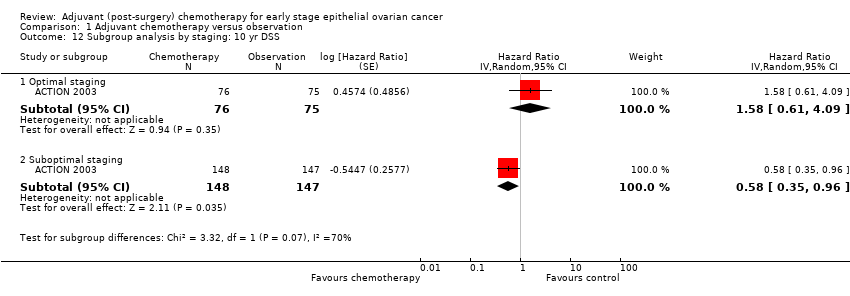
Comparison 1 Adjuvant chemotherapy versus observation, Outcome 12 Subgroup analysis by staging: 10 yr DSS.
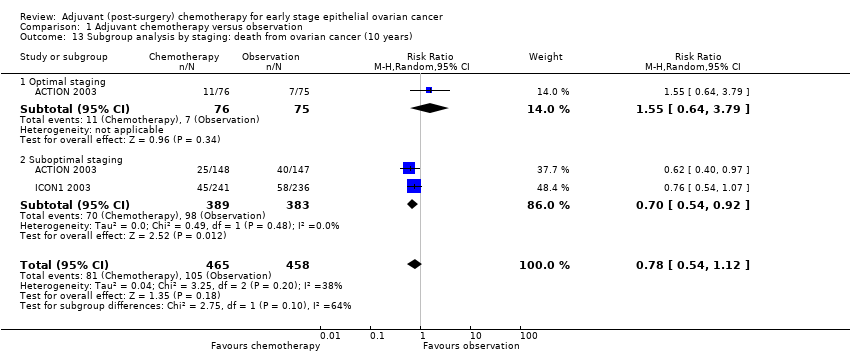
Comparison 1 Adjuvant chemotherapy versus observation, Outcome 13 Subgroup analysis by staging: death from ovarian cancer (10 years).
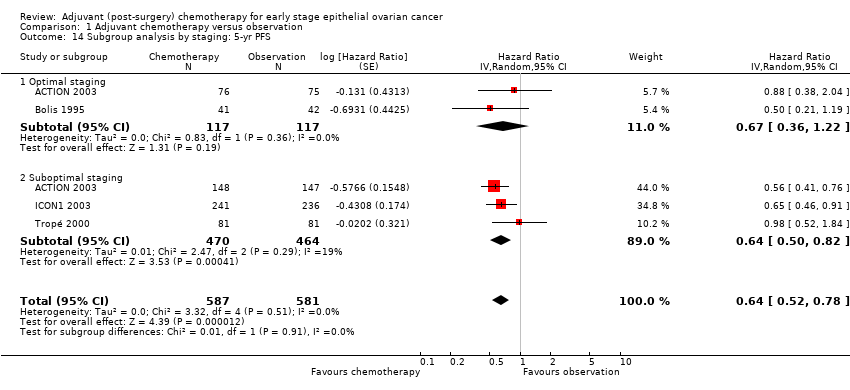
Comparison 1 Adjuvant chemotherapy versus observation, Outcome 14 Subgroup analysis by staging: 5‐yr PFS.

Comparison 1 Adjuvant chemotherapy versus observation, Outcome 15 Subgroup analysis by staging: 10‐yr PFS.

Comparison 1 Adjuvant chemotherapy versus observation, Outcome 16 Subgroup analysis by staging: progression of ovarian cancer (10 years).

Comparison 1 Adjuvant chemotherapy versus observation, Outcome 17 Subgroup analysis by risk: 10‐yr OS.

Comparison 1 Adjuvant chemotherapy versus observation, Outcome 18 Subgroup analysis by risk: 10‐yr PFS.

Comparison 1 Adjuvant chemotherapy versus observation, Outcome 19 Subgroup analysis by risk: progression at 10 yrs.
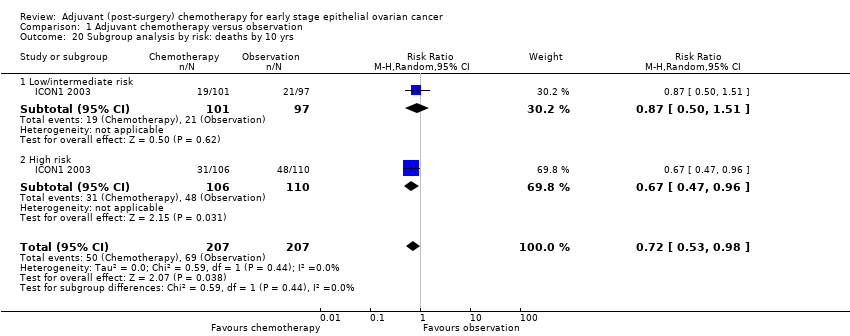
Comparison 1 Adjuvant chemotherapy versus observation, Outcome 20 Subgroup analysis by risk: deaths by 10 yrs.
| Adjuvant chemotherapy compared with observation for early stage ovarian cancer (primary review outcomes) | ||||||
| Patient or population: women with stage I/II epithelial ovarian cancer Settings: hospital and outpatient Intervention: chemotherapy following surgery Comparison: observation following surgery | ||||||
| Outcomes | Illustrative comparative risks | HR Chemotherapy versus observation | Number of participants | Quality of the evidence | Comments | |
| Assumed risk (Observation) | Corresponding risk (Chemotherapy) | |||||
| Overall 5‐year survival1 | 22 deaths out of 100 women | 16 out of 100 women (12 to 20) | HR 0.71 (0.53 to 0.93) | 1008 women | ⊕⊕⊕⊕ | I² statistic = 0% P = 0.01 HR < 1 indicates a clinical advantage for adjuvant chemotherapy |
| Progression‐free 5‐year survival2 | 32 women with progressive disease out of 100 women | 22 women with progressive disease out of 100 women (18 to 27) | HR 0.67 (0.53 to 0.84) | 1170 women (four studies) | ⊕⊕⊕⊕ | I² statistic = 0% P = 0.0005 HR < 1 indicates a clinical advantage for adjuvant chemotherapy |
| Overall 10‐year3 survival | 33 deaths out of 100 women | 25 deaths out of 100 women (20 to 31) | HR 0.72 (0.57 to 0.92) | 925 women (two studies) | ⊕⊕⊕⊕ | I² statistic = 0% P = 0.007 HR < 1 indicates a clinical advantage for adjuvant chemotherapy |
| Progression‐free 10‐year survival4 | 39 women with progressive disease out of 100 women | 28 women with progressive disease out of 100 women (23 to 34) | HR 0.67 (0.53 to 0.83) | 925 women (two studies) | ⊕⊕⊕⊕ | I² statistic = 0% P = 0.0004 HR < 1 indicates a clinical advantage for adjuvant chemotherapy |
| Adverse events | Not estimable. Trials did not report comparative rates of adverse events. | |||||
| Abbreviations; CI: confidence interval; HR: hazard ratio; RR: risk ratio. | ||||||
| GRADE Working Group grades of evidence | ||||||
| 1The illustrative assumed and corresponding 5‐year risks were based on the RR (dichotomous data) from Analysis 1.2 (RR 0.72, 95% CI 0.56 to 0.93; 1089 participants; 4 studies; I² statistic = 0%), where the assumed risk was the mean observation group risk. | ||||||
| Stage | Description |
| Ia | Disease confined to one ovary with no capsular involvement. Peritoneal washings/cytology negative. |
| Ib | Disease confined to both ovaries with no capsular involvement. Peritoneal washings/cytology negative. |
| Ic | Disease confined to the ovary/ovaries but ovarian capsulae involved or cyst rupture |
| IIa | Extension to uterus or fallopian tubes |
| IIb | Extension to other pelvic tissues |
| IIc | As for IIa or IIb but one or both ovaries have ruptured capsule or surface tumour; malignant ascites or positive peritoneal washings |
| IIIa | Histologically confirmed microscopic seeding of abdominal peritoneal surfaces and negative retroperitoneal lymph nodes |
| IIIb | Histologically confirmed implants of abdominal peritoneal surfaces less than 2 cm and negative retroperitoneal lymph nodes |
| IIIc | Histologically confirmed implants of abdominal peritoneal surfaces greater than 2 cm or positive retroperitoneal lymph nodes |
| IV | Distant metastases (including liver parenchyma/positive pleural fluid cytology) |
| Study ID | Recruitment period | Staging | Comparison | Randomisation | Intention to treat | 5‐year follow‐up |
| 1969 to 1974 | No | CT versus RT | Unspecified | No | Incomplete | |
| 1971 to 1975 | No | RT versus RT+CT | Stratified | No | Median 52 months | |
| 1971 to 1978 | No | CT versus RT versus NA | Unspecified | No | No | |
| 1975 to 1978 | No | NT versus CT, RT versus CT or (RT + CT) | Stratified, quasi‐randomised | No | Yes | |
| 1980 to 1985 | Yes complete in 60.5% | NA versus RT versus (RT + CT) | Unspecified | No | Median 42 months | |
| 1976 to 1978 | No | NA versus RT and NA versus CT | Randomised by birth month (quasi‐randomisation) | No | 3‐year follow‐up | |
| 1975 to 1984 | No | CT versus RT versus IPR | Central telephone | Yes | Median 8 years | |
| 1981 to 1987 | Complete | RT versus (RT + CT) | Block randomisation | Yes | 4 years | |
| 1976 | Complete | CT versus NA or IPR | Central, computer stratified | Yes | > 6 years | |
| Complete | 3 x CT versus 6 x CT | Central, computerised | Yes | > 6 years | ||
| Complete | CT versus IPR | Central, computerised | Yes | |||
| 1982 to 1988 | Complete | CT versus IPR | Central, computer stratified | Yes | Median 62 months | |
| 1985 to 1989 | Complete in 87% | CT versus RT | Central, computerised | Yes | ||
| 1983 to 1990 | Complete | CT versus NA or IPR | Central, random generated numbers | Yes | Yes | |
| 1992 to 1997 | Complete | CT versus NA | Central, computerised | Yes | Median 46 months | |
| 1990 to 1996 | Complete | CT versus RT | Method not explicit | Yes | Yes | |
| 1990 to 2001 | Incomplete | CT versus NA | Central computerised | Yes | Median 51 months | |
| 1990 to 2000 | Complete | CT versus NA | Central, computerised | Yes | Median 66 months | |
| (GOG 175) | Complete | CT + maintenance versus CT alone | Central, computerised | Yes | Yes | |
| Abbreviations: CT: chemotherapy; RT: radiotherapy; IPR: intra‐peritoneal radio‐isotope therapy; NA: no additional treatment. | ||||||
| Study ID | Participants | Intervention | 5‐year survival rates | 5‐year survival/statistics | 10‐year survival rates | Adverse effects | Comments |
| 447 FIGO I‐III 93% FIGO stage 1 | Immediate adjuvant platinum‐based chemotherapy versus treatment on progression | OS 79% (adjuvant arm) versus70% ( no treatment) | HRs | OS 73% (adjuvant arm) versus 64% (no treatment) | Not reported | Survival improvement with adjuvant therapy | |
| 448 FIGO Ia‐Ib grade II‐III FIGO Ic‐IIa FIGO I‐IIa clear cell | Immediate adjuvant platinum‐based chemotherapy versus treatment on progression | OS 85% (adjuvant arm) versus 78% (no treatment) | HRs | OS 77% (adjuvant arm) versus 70% (no treatment) | Not reported | Subgroup analysis showed that non‐optimally staged patients in observation arm had significantly worse survival | |
| 162 high risk stage I 36% patients had low‐volume residual disease | Carboplatin 6 cycles Q28/7 AUC = 7 versus chemo at progression | No difference between arms DFS 70% versus 71%, OS 86% versus 85% | Log rank test | NR | HRs DFS: HR 0.98; 95% CI 0.52 to 1.83 DSS: HR 0.94; 95% CI 0.37 to 2.36 | Not reported | |
| 48 treatment 44 observation | Melphalan versus no further treat | DFS 91% versus 98% OS 94% versus 98% | Log rank test | NR | Melphalan: 16% had severe myelosuppression. 26% had gastrointestinal side effects.One death: myeloproliferative disorder aplastic anaemia 6 years after completing treatment. | Trial under powered to show any real differences | |
| 85 FIGO (1976) I A‐I B Grade 2 and 3 | Cisplatin 50 mg/m² × 6 cycles Q28/7 versus no further treatment | DFS 83% versus 64% OS 88% versus 82% | HRs DFS: HR 0.50; 95% | NR | Nausea and vomiting in more than two‐thirds of patients in cisplatin arm. Severe in less than 10%. | There were patients with residual disease in both arms | |
| Abbreviations; CI: confidence interval; DFS: disease‐free survival; HR: hazard ratio; OS: overall survival; RFS: recurrence‐free survival; AUC: area under the concentration curve; NR: not reported. | |||||||
| 10 year survival outcomes for women with early stage ovarian cancer | Adjuvant chemotherapy | Observation | P value | ||
| n/N | % | n/N | % | ||
| Risk of death (all early stage disease)1 | 118/465 | 25% | 152/460 | 33% | 0.009 |
| Risk of progression or death (all early stage disease)1 | 132/465 | 28% | 181/460 | 39% | 0.0005 |
| Risk of death (low/intermediate risk disease)2 | 19/101 | 19% | 21/97 | 22% | NS |
| Risk of progression or death (low/intermediate risk disease)2 | 22/101 | 22% | 24/97 | 25% | NS |
| Risk of death (high risk disease)2 | 31/106 | 29% | 48/110 | 44% | 0.03 |
| Risk of progression or death (high risk disease)2 | 34/106 | 32% | 55/110 | 50% | 0.009 |
| 1Based on ACTION 2003 and ICON1 2003 10‐year follow‐up data. | |||||
| Outcome or subgroup title | No. of studies | No. of participants | Statistical method | Effect size |
| 1 Overall survival (5 yr) Show forest plot | 3 | 1008 | Hazard Ratio (Random, 95% CI) | 0.71 [0.53, 0.93] |
| 2 Deaths total (5 yr) Show forest plot | 4 | 1089 | Risk Ratio (M‐H, Random, 95% CI) | 0.72 [0.56, 0.93] |
| 3 Overall survival (10 yr) Show forest plot | 2 | 925 | Hazard Ratio (Random, 95% CI) | 0.72 [0.57, 0.92] |
| 4 Death total (10 yr) Show forest plot | 2 | 923 | Risk Ratio (M‐H, Random, 95% CI) | 0.76 [0.62, 0.94] |
| 5 Progression‐free survival (5 yr) Show forest plot | 4 | 1170 | Hazard Ratio (Random, 95% CI) | 0.67 [0.53, 0.84] |
| 6 Progression total (5 yr) Show forest plot | 4 | 1089 | Risk Ratio (M‐H, Random, 95% CI) | 0.69 [0.57, 0.84] |
| 7 Progression‐free survival (10 yr) Show forest plot | 2 | 925 | Hazard Ratio (Random, 95% CI) | 0.67 [0.53, 0.83] |
| 8 Progression total (10 yr) Show forest plot | 2 | 925 | Risk Ratio (M‐H, Random, 95% CI) | 0.72 [0.60, 0.87] |
| 9 Disease‐specific survival (5 yr) Show forest plot | 1 | Hazard Ratio (Random, 95% CI) | Subtotals only | |
| 10 Disease‐specific survival (10 yr) Show forest plot | 1 | Hazard Ratio (Random, 95% CI) | Subtotals only | |
| 11 Subgroup analysis by staging: 5‐yr OS Show forest plot | 3 | Hazard Ratio (Random, 95% CI) | Subtotals only | |
| 11.1 Optimal staging | 2 | 234 | Hazard Ratio (Random, 95% CI) | 1.22 [0.63, 2.37] |
| 11.2 Suboptimal staging | 2 | 772 | Hazard Ratio (Random, 95% CI) | 0.63 [0.46, 0.85] |
| 12 Subgroup analysis by staging: 10 yr DSS Show forest plot | 1 | Hazard Ratio (Random, 95% CI) | Subtotals only | |
| 12.1 Optimal staging | 1 | 151 | Hazard Ratio (Random, 95% CI) | 1.58 [0.61, 4.09] |
| 12.2 Suboptimal staging | 1 | 295 | Hazard Ratio (Random, 95% CI) | 0.58 [0.35, 0.96] |
| 13 Subgroup analysis by staging: death from ovarian cancer (10 years) Show forest plot | 2 | 923 | Risk Ratio (M‐H, Random, 95% CI) | 0.78 [0.54, 1.12] |
| 13.1 Optimal staging | 1 | 151 | Risk Ratio (M‐H, Random, 95% CI) | 1.55 [0.64, 3.79] |
| 13.2 Suboptimal staging | 2 | 772 | Risk Ratio (M‐H, Random, 95% CI) | 0.70 [0.54, 0.92] |
| 14 Subgroup analysis by staging: 5‐yr PFS Show forest plot | 4 | 1168 | Hazard Ratio (Random, 95% CI) | 0.64 [0.52, 0.78] |
| 14.1 Optimal staging | 2 | 234 | Hazard Ratio (Random, 95% CI) | 0.67 [0.36, 1.22] |
| 14.2 Suboptimal staging | 3 | 934 | Hazard Ratio (Random, 95% CI) | 0.64 [0.50, 0.82] |
| 15 Subgroup analysis by staging: 10‐yr PFS Show forest plot | 2 | 923 | Hazard Ratio (Random, 95% CI) | 0.66 [0.53, 0.83] |
| 15.1 Optimal staging | 1 | 151 | Hazard Ratio (Random, 95% CI) | 0.73 [0.38, 1.42] |
| 15.2 Suboptimal staging | 2 | 772 | Hazard Ratio (Random, 95% CI) | 0.65 [0.52, 0.83] |
| 16 Subgroup analysis by staging: progression of ovarian cancer (10 years) Show forest plot | 2 | 923 | Risk Ratio (M‐H, Random, 95% CI) | 0.71 [0.58, 0.87] |
| 16.1 Optimal staging | 1 | 151 | Risk Ratio (M‐H, Random, 95% CI) | 0.70 [0.39, 1.26] |
| 16.2 Suboptimal staging | 2 | 772 | Risk Ratio (M‐H, Random, 95% CI) | 0.71 [0.58, 0.88] |
| 17 Subgroup analysis by risk: 10‐yr OS Show forest plot | 1 | 414 | Hazard Ratio (Random, 95% CI) | 0.66 [0.38, 1.13] |
| 17.1 Low/intermediate risk | 1 | 198 | Hazard Ratio (Random, 95% CI) | 0.91 [0.49, 1.69] |
| 17.2 High risk | 1 | 216 | Hazard Ratio (Random, 95% CI) | 0.52 [0.33, 0.81] |
| 18 Subgroup analysis by risk: 10‐yr PFS Show forest plot | 1 | 414 | Hazard Ratio (Random, 95% CI) | 0.64 [0.34, 1.21] |
| 18.1 Low/medium | 1 | 198 | Hazard Ratio (Random, 95% CI) | 0.92 [0.52, 1.64] |
| 18.2 High | 1 | 216 | Hazard Ratio (Random, 95% CI) | 0.48 [0.32, 0.73] |
| 19 Subgroup analysis by risk: progression at 10 yrs Show forest plot | 1 | 414 | Risk Ratio (M‐H, Random, 95% CI) | 0.71 [0.53, 0.95] |
| 19.1 Low/intermediate risk | 1 | 198 | Risk Ratio (M‐H, Random, 95% CI) | 0.88 [0.53, 1.46] |
| 19.2 High risk | 1 | 216 | Risk Ratio (M‐H, Random, 95% CI) | 0.64 [0.46, 0.90] |
| 20 Subgroup analysis by risk: deaths by 10 yrs Show forest plot | 1 | 414 | Risk Ratio (M‐H, Random, 95% CI) | 0.72 [0.53, 0.98] |
| 20.1 Low/intermediate risk | 1 | 198 | Risk Ratio (M‐H, Random, 95% CI) | 0.87 [0.50, 1.51] |
| 20.2 High risk | 1 | 216 | Risk Ratio (M‐H, Random, 95% CI) | 0.67 [0.47, 0.96] |