Intervensi media massa untuk pemberhentian merokok dalam kalangan dewasa
Referencias
References to studies included in this review
References to studies excluded from this review
Additional references
Characteristics of studies
Characteristics of included studies [ordered by study ID]
Ir a:
| Methods | Country: USA. | |
| Participants | Population of study sites: CA 1999 ‒ 23,788,205; rest of US ‒ not provided. | |
| Interventions | Theoretical basis: social diffusion model. Yr started: 1989. Duration of media campaign: April 1990 to June 1991; then funding reduced, campaign restarted October 1992 to May 1993; funding decreased till mid‐1996; campaign restored January 1997 to June 1998, then funding reduced again. (i) statewide media campaign disseminating anti‐tobacco messages; (ii) local tobacco control initiatives, policy development and public education programmes; (iii) school‐based tobacco prevention programmes, activities and policies. Media campaign includes paid commercials and PSAs for TV, radio, outdoor advertisements, newspaper ads and public relations activities, in English, Spanish, Cantonese, Mandarin, Vietnamese, Korean, Laotian, Cambodian, Japanese, Hmong. Messages were designed to de‐glamorise smoking for young people, show the dishonesty of the tobacco industry, encourage smokers to quit, publicize the health risks of exposure to environmental tobacco smoke. | |
| Outcomes | Smoking prevalence, quit ratio (% of ever‐smokers now ex‐smokers), per capita cigarette consumption (based on aggregated sales data). | |
| Notes | Intermediate measures: health beliefs, health‐enhancing attitude score, percentage of smokers thinking about quitting, attempts to quit, support for further increase in tax on tobacco with funds devoted to tobacco control, support for ban on tobacco advertising and tobacco company sponsorship, support for smoking restrictions in public place, smokefree worksites, home smoking bans, nonsmokers exposed to ETS at work. media weight, campaign awareness/reach, expenditures and cost effectiveness. The evaluation of the campaign continues with California Smokers' Cohort (CSC), but without comparison to control group. | |
| Risk of bias | ||
| Bias | Authors' judgement | Support for judgement |
| Random sequence generation (selection bias) | High risk | Not RCT: the results of the programme were compared with the smoking prevalence of the rest of the USA in interrupted time series study design using data from national and California population survey. |
| Allocation concealment (selection bias) | High risk | Not RCT: the results of the programme were compared with the smoking prevalence of the rest of the USA in interrupted time series study design using data from national and California population survey. |
| Blinding of participants and personnel (performance bias) | High risk | Not done due to the nature of the intervention, making people aware of the programme. |
| Blinding of outcome assessment (detection bias) | High risk | Self‐reported cigarette consumption from population‐based surveys. |
| Incomplete outcome data (attrition bias) | High risk | Cross‐sectional surveys, no cohort follow‐up; response rates 71% to 99%. |
| Selective reporting (reporting bias) | Low risk | Outcomes presented as prespecified in Methods section. |
| Other bias | Unclear risk | Insufficient information: ITS assessment (Pierce 1998) — clearly defined point in time when the intervention occurred DONE At least three data points before and three after the intervention DONE The intervention is independent of other changes NOT CLEAR There are sufficient data points to enable reliable statistical inference NOT CLEAR Formal test for trend NOT CLEAR Intervention unlikely to affect data collection DONE Blinded assessment of primary outcome NOT DONE Completeness of data set NOT CLEAR Reliable primary outcome NOT CLEAR ITS assessment (Siegel 2000) — Clearly defined point in time when the intervention occurred DONE At least three data points before and three after the intervention DONE The intervention is independent of other changes NOT CLEAR There are sufficient data points to enable reliable statistical inference NOT CLEAR Formal test for trend NOT CLEAR Intervention unlikely to affect data collection DONE Blinded assessment of primary outcome NOT DONE Completeness of data set NOT CLEAR Reliable primary outcome NOT CLEAR |
| Methods | Country: South Africa. | |
| Participants | Population of study sites: 1980 census estimate Swellenden 6176 (low‐intensity mass media intervention), Riversdale 6049 (control). | |
| Interventions | Theoretical basis: not specified. Year started: baseline survey 1979, mass media intervention 1980. Duration: 4 yrs. | |
| Outcomes | Smoking prevalence, cigarette consumption, quit rate; smoking behaviour was measured in cross‐sectional surveys at baseline and at 4 yrs, in cohort identified at baseline. Additional follow‐up survey at 12 yrs from baseline. | |
| Notes | Intermediate measures: 43‐item questionnaire on knowledge of risk factors, diet and attitudes at baseline, but only knowledge score was reported. | |
| Risk of bias | ||
| Bias | Authors' judgement | Support for judgement |
| Random sequence generation (selection bias) | High risk | Quasi‐experimental with two intervention towns, Robertson receiving a mass media intervention and a community‐based intervention, Swellenden receiving a similar mass media intervention alone, and Riversdale acting as the comparison town. ONLY COMPARISON SWELLENDEN AND RIVERSDALE INCLUDED IN THE ANALYSIS |
| Allocation concealment (selection bias) | High risk | Quasi‐experimental, no randomisation attempt |
| Blinding of participants and personnel (performance bias) | High risk | Not done due to the nature of the intervention. |
| Blinding of outcome assessment (detection bias) | High risk | Self‐reported cigarette consumption. |
| Incomplete outcome data (attrition bias) | High risk | Cross‐sectional surveys in the whole population, 56% of participants re‐surveyed after 4 yrs (cohort follow‐up); response rates for cross‐sectional surveys 62% to 74%. |
| Selective reporting (reporting bias) | Low risk | Outcomes presented as prespecified in methods section. |
| Other bias | Low risk | No other bias identified. |
| Methods | Country: USA. | |
| Participants | Age: 18+, Vietnamese‒American male current smokers (smoked a cigarette during prior week). | |
| Interventions | Theoretical basis: not specified. Yr started: 1990; Duration: 2yrs. 15 m uncontrolled pilot campaign. Then (i) Newspaper and magazine articles in Vietnamese language, a videotape broadcast ×2 on Vietnamese‐language TV, calendar, bumper stickers, lapel buttons, 3 posters, 2 brochures and self‐help 'quit kit'. | |
| Outcomes | Smoking prevalence, cigarette consumption, quit rates. | |
| Notes | Intermediate measures: motivation to quit, self‐efficacy, quit attempts assessed at baseline and follow‐up. | |
| Risk of bias | ||
| Bias | Authors' judgement | Support for judgement |
| Random sequence generation (selection bias) | High risk | Quasi‐experimental, with SF and Alameda County chosen as the intervention area and Houston, Texas as the comparison area. |
| Allocation concealment (selection bias) | High risk | Quasi‐experimental, with SF and Alameda County chosen as the intervention area and Houston, Texas as the comparison area. |
| Blinding of participants and personnel (performance bias) | High risk | Not done due to the nature of the intervention. |
| Blinding of outcome assessment (detection bias) | Unclear risk | Self‐reported smoking ‒ telephone interview, not clear if interviewers were aware of the intervention received. |
| Incomplete outcome data (attrition bias) | High risk | cross‐sectional surveys, no cohort follow up, response rates 82% to 94%. |
| Selective reporting (reporting bias) | Low risk | Outcomes presented as prespecified in Methods section. |
| Other bias | Low risk | No other bias identified. |
| Methods | Country: USA. | |
| Participants | Population of study sites: not given. | |
| Interventions | Theoretical basis: social diffusion theory. Year started: baseline measures 1989, intervention 1993; Duration: still ongoing but with very low funding. (i) high‐profile statewide media campaign, targeting adult smokers, youth and general audience; (ii) programme to establish community‐based tobacco control efforts; (iii) statewide initiatives. Mass media campaign started in October 1993, still ongoing, with100+ ads for TV, radio, billboards, newspapers and public relations events. Two aims: Public Education Media Campaign, focused on general population, raising awareness and explaining tobacco control issues; and Strategic and Targeted Marketing (tailored messages for selected populations). The intention of messages was to de‐glamorise smoking among young people, show the dishonesty of the tobacco industry, encourage smokers to quit, inform about the health risks of exposure to ETS. Media ads were translated into Spanish, Portuguese, Chinese and Vietnamese. | |
| Outcomes | Smoking prevalence, per capita cigarette consumption (based on aggregated sales data). | |
| Notes | Intermediate measures: attitudes and health beliefs about smoking, support for further increase in tax on tobacco with funds devoted to tobacco control, support for ban on vending machines, support for ban on sponsorship of sports and cultural events by tobacco companies, smokefree worksites, homes with smoking ban, ETS at work, support for restricting smoking in public buildings, and for some form of restriction on smoking in restaurants, social pressure to quit. Tobacco control efforts ongoing, information about smoking and quitting in Massachusetts is available from BRFSS surveys, no control group, no evaluation. | |
| Risk of bias | ||
| Bias | Authors' judgement | Support for judgement |
| Random sequence generation (selection bias) | High risk | Not RCT: the results of the programme were compared with the smoking prevalence of the rest of the USA in interrupted time series study design using data from national and California population survey. |
| Allocation concealment (selection bias) | High risk | Not RCT: the results of the programme were compared with the smoking prevalence of the rest of the USA in interrupted time series study design using data from national and California population survey |
| Blinding of participants and personnel (performance bias) | High risk | Not done due to the nature of the intervention, making people aware of the programme. |
| Blinding of outcome assessment (detection bias) | Unclear risk | Self‐reported cigarette consumption from population based surveys. |
| Incomplete outcome data (attrition bias) | Unclear risk | Cross‐sectional surveys, no cohort follow up; response rates 43% to 84%. |
| Selective reporting (reporting bias) | Low risk | Outcomes presented as prespecified in Methods section. |
| Other bias | Unclear risk | Insufficient information: ITS assessment: Clearly defined point in time when the intervention occurred DONE At least three data points before and three after the intervention DONE The intervention is independent of other changes NOT CLEAR There are sufficient data points to enable reliable statistical inference NOT CLEAR Formal test for trend NOT CLEAR Intervention unlikely to affect data collection DONE Blinded assessment of primary outcome NOT DONE Completeness of data set NOT CLEAR Reliable primary outcome NOT CLEAR ITS assessment: Clearly defined point in time when the intervention occurred DONE At least three data points before and three after the intervention DONE The intervention is independent of other changes NOT CLEAR There are sufficient data points to enable reliable statistical inference NOT CLEAR Formal test for trend NOT CLEAR Intervention unlikely to affect data collection DONE Blinded assessment of primary outcome NOT DONE Completeness of data set NOT CLEAR Reliable primary outcome NOT CLEAR |
| Methods | Country: USA. | |
| Participants | Population of study sites: exact number not given, all treatment areas had populations of over 100,000. | |
| Interventions | Theoretical basis: social learning theory, the transtheoretical model, modelling, social reinforcement for behaviour change, emotional arousal. Year conducted: 2000. Duration: 7 m. TV, radio, newspapers, billboards, posters. Ads were created in English, Spanish and Vietnamese. TV ads and radio spots included 2 developed by the CDC, one of which was also printed in local newspapers. All ads promoted the American Cancer Society Smokers' Quitline; radio and print ads encouraged smokers to seek doctor's or pharmacist's help in quitting. 10‐second PSAs promoting the Quitline were broadcast during morning drive times. | |
| Outcomes | Point prevalence of daily smoking. | |
| Notes | Process measures: awareness/reach was measured by 3 questions about frequency of being exposed to media messages through TV, radio and newspaper ads over past 30 days. Answer choices were never, 1 to 3 times, 1 to 3 times per week, daily or almost daily, more than once a day. | |
| Risk of bias | ||
| Bias | Authors' judgement | Support for judgement |
| Random sequence generation (selection bias) | High risk | A quasi‐experimental cross‐sectional study. |
| Allocation concealment (selection bias) | High risk | A quasi‐experimental cross‐sectional study. |
| Blinding of participants and personnel (performance bias) | High risk | Not done due to the nature of the intervention. |
| Blinding of outcome assessment (detection bias) | Low risk | Data collection was done by independent contractors, the interviewers were blinded to the intervention received by the respondent. |
| Incomplete outcome data (attrition bias) | High risk | Cross‐sectional surveys, no cohort follow‐up, a panel of smokers followed (58% to 65% followed up), reasons for attrition described. |
| Selective reporting (reporting bias) | High risk | Outcomes presented combined, not as specified in Methods section. |
| Other bias | Low risk | No other bias identified. |
| Methods | Country: USA. | |
| Participants | Population of study sites: Santa Clara County ‒ 54,212 Vietnamese (18,770 men 18+); Houston ‒ 33035 Vietnamese (11878 men 18+). | |
| Interventions | Theoretical basis: not specified. In 1989 ran a 15 m pilot media programme in San Francisco. This trial started: Nov 1990. Duration: 2 yrs. (i) 35 print articles in Vietnamese‐language newspapers and magazines; videotape broadcast ×2 on Vietnamese‐language TV, interviews with smokers, physicians and quitters, health education materials, e.g. calendar, bumper stickers, lapel buttons, 3 posters, 2 brochures (one for male smokers ‒ effects of smoking and quitting; 1 for female smokers ‒ effects of ETS) and self‐help 'quit kit'. | |
| Outcomes | Smoking prevalence, cigarette consumption, quit rates. | |
| Notes | Intermediate measures: motivation to quit, self‐efficacy, quit attempts assessed at baseline and follow up. | |
| Risk of bias | ||
| Bias | Authors' judgement | Support for judgement |
| Random sequence generation (selection bias) | High risk | Quasi‐experimental, with Santa Clara County chosen as the intervention area and Houston, Texas as the comparison area. |
| Allocation concealment (selection bias) | High risk | Quasi‐experimental, with Santa Clara County chosen as the intervention area and Houston, Texas as the comparison area. |
| Blinding of participants and personnel (performance bias) | High risk | Not done due to the nature of the intervention. |
| Blinding of outcome assessment (detection bias) | Unclear risk | Self‐reported smoking ‒ telephone interview, not clear if interviewers were aware of the intervention received. |
| Incomplete outcome data (attrition bias) | High risk | Cross‐sectional surveys, no cohort follow up, response rates 81% to 88% |
| Selective reporting (reporting bias) | Low risk | Outcomes presented as prespecified in Methods section. |
| Other bias | Low risk | No other bias identified. |
| Methods | Country: England. | |
| Participants | Population of study sites: inhabitants of Central, Granada, Tyne Tees and Yorkshire TV regions, overall numbers not given; chosen for higher prevalence of smoking. | |
| Interventions | Theoretical basis: not specified. Year started: 1992. Duration: 18 m. (i) paid TV anti‐smoking ads aimed at current smokers and those who had already given up. In the ads morbid or 'black' humour, macabre or bizarre scenarios were used, featuring John Cleese (well‐known English comic actor). Each ad ended with a 'Quitline' number for further information and advice. Ads were screened in 2 phases over 18 m, at varying intensity during 1st phase (10 ads, each 30 to 40 secs, Dec 1992 to March 1993). Granada received single weight advertising, and Tyne Tees and Yorkshire double weight. In 2nd phase (9 ads (4 new) December 1993 to March 1994) all 3 regions received double weight advertising. | |
| Outcomes | Quit rate, relapse rate, abstinence rate; smoking/not smoking at 18 m. | |
| Notes | Intermediate measures: attitudes at baseline, no follow‐up results. | |
| Risk of bias | ||
| Bias | Authors' judgement | Support for judgement |
| Random sequence generation (selection bias) | High risk | Quasi‐experimental, 3 intervention regions: Granada, Tyne Tees and a region of Yorkshire (TV advertising), 1 control region: Central TV, not random by practical and ethical considerations. |
| Allocation concealment (selection bias) | High risk | Quasi‐experimental, 3 intervention regions: Granada, Tyne Tees and a region of Yorkshire (TV advertising), 1 control region: Central TV. |
| Blinding of participants and personnel (performance bias) | Low risk | Interviewers and respondents were unaware of the forthcoming TV campaign or of the intention to conduct follow‐up interviews; the follow‐up interviews were conducted by a different group of field workers who were unaware of the pre‐campaign responses or the relationship between the interviews and the interventions. |
| Blinding of outcome assessment (detection bias) | Low risk | Interviewers and respondents were unaware of the forthcoming TV campaign or of the intention to conduct follow‐up interviews; the follow‐up interviews were conducted by a different group of field workers who were unaware of the pre‐campaign responses or the relationship between the interviews and the interventions. |
| Incomplete outcome data (attrition bias) | High risk | Response rate not reported, cohort follow‐up ‒ just number of sampled at baseline and followed at 6 and 18 months provided; 39% to 52% of those sampled at baseline followed, lost to follow‐up not counted as eligible at follow‐up, reasons provided |
| Selective reporting (reporting bias) | Low risk | Outcomes presented as prespecified in methods section. |
| Other bias | Low risk | No other bias identified. |
| Methods | Country: USA. | |
| Participants | Total participants: 311 clinic enrolments, 66 mailed quit kit recipients. | |
| Interventions | Theoretical basis: for clinic treatment, behavioural model of Best (Best 1978a; Best 1978b). Study period: Nov 1980 to May 1981; 2nd phase July 1981 to December 1981. TV and radio spots ‒ testimonial vignettes selected from interviews with quitters about benefits of quitting. 1 × 60 sec main ad (aired 60 times) and 2 × 30 sec variations (aired 106 times) made for TV and modified audio version for radio, all ending with the sentence 'Life is better without a cigarette; if you are smoke‐free, stay free'. Campaign aired on 2 most popular TV stations and 2 most popular radio stations in the WRJ region. | |
| Outcomes | Abstinence rate. | |
| Notes | Intermediate measures: at baseline: attitudes and beliefs on smoking, TV viewing habits. | |
| Risk of bias | ||
| Bias | Authors' judgement | Support for judgement |
| Random sequence generation (selection bias) | High risk | Quasi‐experimental: in one of the hospitals mass media intervention, no mass media in another hospital. |
| Allocation concealment (selection bias) | High risk | Quasi‐experimental: in one of the hospitals mass media intervention, no mass media in another hospital. |
| Blinding of participants and personnel (performance bias) | Unclear risk | Not done due to the nature of the intervention. |
| Blinding of outcome assessment (detection bias) | Low risk | No blinding; biochemical validation of smoking cessation, lack of blinding has no influence. |
| Incomplete outcome data (attrition bias) | High risk | Cohort follow‐up, 52% to 54% follow‐up, loss to follow‐up not reported for mailed control group. |
| Selective reporting (reporting bias) | Low risk | Outcomes presented as prespecified in Methods section. |
| Other bias | Low risk | No other bias identified. |
| Methods | Country: Australia. | |
| Participants | Population of study sites: Lismore 22,083, Coffs Harbour 12,197, Tamworth 27,280. | |
| Interventions | Theoretical basis: communication theory and social marketing. Year started: 1978. Duration: 2 yrs. (i) newspaper (Lismore: 1 paid local daily; Coffs Harbour: 1 paid local tri‐weekly newspaper and weekly free paper); (ii) radio (Lismore: a local station; Coffs Harbour: a relay station) (iii) TV (Lismore and Coffs Harbour a shared station) (iv) stickers, posters, T‐shirts, balloons, and self‐help quit kits. First part of mass media intervention was part of 9‐week healthy lifestyle campaign and focused on general awareness. Second part was providing information, 3rd part was aimed to create 'a positive effect'. Parts 2 and 3 lasted 31 weeks. Ads in media were paid, with equal time also donated free by stations. Other media included editorial space, features, radio interviews, TV appearances, weekly programmes, retail ads and pictorial spreads. All ads were professionally created, entertaining and controversial; (see Notes). | |
| Outcomes | Smoking prevalence. | |
| Notes | All printed ads were withdrawn 4 m after the start of campaign (Oct 1979) for 15 weeks because of complaints to the Media Council of Australia by 3 major tobacco companies. National publicity about the suspended ads reached the control town, and may have contaminated the comparison. | |
| Risk of bias | ||
| Bias | Authors' judgement | Support for judgement |
| Random sequence generation (selection bias) | High risk | Quasi‐experimental, no randomisation attempted, intervention and control sites chosen due to practical reasons. |
| Allocation concealment (selection bias) | High risk | Quasi‐experimental, no randomisation attempted. |
| Blinding of participants and personnel (performance bias) | High risk | No blinding due to the nature of the intervention. |
| Blinding of outcome assessment (detection bias) | High risk | Self‐reported smoking behaviour, interview carried out by trained interviewer at a central screening centre; only 5% subsample biochemical validation. |
| Incomplete outcome data (attrition bias) | High risk | Cross‐sectional surveys, no cohort follow‐up, response rates 71% to 74%. |
| Selective reporting (reporting bias) | Low risk | Outcomes presented as prespecified in Methods section. |
| Other bias | Low risk | No other bias identified. |
| Methods | Country: USA. | |
| Participants | Population of study sites: Watsonville 14,569, Gilroy 12,665, Tracy 14,724. | |
| Interventions | Theoretical basis: social marketing, social learning theory and communication theory. Year started: 1972. Duration 3 yrs (3rd yr results for high‐risk group only). (i) mass media campaigns in English and Spanish, with 3 hrs of TV programmes and 50 TV spots, several hrs of radio programmes and about 100 radio spots, weekly newspaper columns, newspaper and advertisement stories, billboards, printed materials sent via direct mail to participants, posters in buses, stores and worksites. Campaigns were conducted in both intervention towns for 9 m in 1973 and 9 m in 1974. | |
| Outcomes | Cigarette consumption, smoking prevalence within high‐risk group. Both reduction and cessation were study outcomes. | |
| Notes | Intermediate measures: 25‐item behavioural interview concerning participants' knowledge about risk factors (3 questions on smoking). | |
| Risk of bias | ||
| Bias | Authors' judgement | Support for judgement |
| Random sequence generation (selection bias) | High risk | Quasi‐experimental, no randomisation, study sites chosen due to practical reasons. |
| Allocation concealment (selection bias) | High risk | Quasi‐experimental, no randomisation. |
| Blinding of participants and personnel (performance bias) | High risk | No blinding due to the nature of the intervention. |
| Blinding of outcome assessment (detection bias) | Unclear risk | In‐person interview at survey centres in each community ‒ surveys of behavioural knowledge and medical examination, not clear if interviewers aware of the intervention in the group; thiocyanate measurement mentioned, but not clear in how many people measured. |
| Incomplete outcome data (attrition bias) | Unclear risk | cross‐sectional surveys with response rate of 60% (Australia ‐wide) and cohort follow up with response rate of 73% to 76% at baseline and 63% of original sample at follow up |
| Selective reporting (reporting bias) | Low risk | Outcomes presented as prespecified in Methods section. |
| Other bias | Low risk | No other bias identified. |
| Methods | Country: Australia. | |
| Participants | Population of study sites: Sydney 3.25 million; Melbourne, rest of Australia, not stated. | |
| Interventions | Theoretical basis: none reported. Year started: 1983 (Sydney), 1984 (Melbourne). Duration: 4 yrs. (i) media‐based campaign, with prime‐time ads on TV and radio, ads in newspapers and posters in public places. All ads ended with a 'Quitline' 24‐hr phone number (message encouraging to quit, information about 'Quit centre in Sydney Hospital' (choice of 6 standard anti‐smoking treatments for AUD 5) and a 'Quit Kit' self‐help booklet and audiocassette tape); billboards with simple message from TV spots, ads in newspapers included normal large ads and in Sydney a section covering smoking‐related events and issues; radio ads with anti‐smoking skits by major personalities. The campaign generated substantial news coverage in all mass media, and used strong visual images of the health consequences of smoking. Coverage alternated in 2‐week phases between heavy and nothing for 1st 3 m, + follow‐up ad campaign of half the intensity after 5 m. | |
| Outcomes | Smoking prevalence, tobacco consumption. | |
| Notes | Intermediate measures: health beliefs and social influences assessed at baseline and at long‐term follow‐up; failed quit attempts assessed in a cohort of smokers in Sydney and Melbourne; information‐seeking behaviour of the population; number of calls to quitline, enrolments in 'Quit centre' stop‐smoking programmes, number of quit kits sold. | |
| Risk of bias | ||
| Bias | Authors' judgement | Support for judgement |
| Random sequence generation (selection bias) | High risk | Quasi‐experimental, study sites chosen due to the practical reasons. |
| Allocation concealment (selection bias) | High risk | Quasi‐experimental design did not allow for allocation concealment. |
| Blinding of participants and personnel (performance bias) | High risk | No blinding. |
| Blinding of outcome assessment (detection bias) | Unclear risk | Saliva cotinine in subsamples, self‐reported smoking behaviour, in‐person interview, not clear if interviewers were aware of the intervention. |
| Incomplete outcome data (attrition bias) | High risk | cohort study ‐ 61% to 63% followed up, cross‐sectional surveys response rates 60%. |
| Selective reporting (reporting bias) | Low risk | Outcomes presented as prespecified in Methods section. |
| Other bias | Low risk | no other bias identified |
ad: advertisement
BRFSS: Behavior Risk Factor Surveillance System
CDC: Centers for Disease Control
CI: confidence interval
CME: continuous medical education
CO: carbon monoxide
cpd: cigarettes per day
CPS: Current Population Surveys
ETS: environmental tobacco smoke
F: female
ITS: interrupted time series
LTCN: local tobacco control network
m: month(s)
M: male
MTS: Massachusetts Tobacco Surveys
NHIS: National Health Interview Survey
OR: odds ratio
PSA: public service announcement
TTM: Trans‐Theoretical Model (stages of change)
TV: television
yr: year
Characteristics of excluded studies [ordered by study ID]
Ir a:
| Study | Reason for exclusion |
| Community intervention, multicomponent, smoking and other risk factors; health education, mass media and an intensive programme of individual face‐to‐face and telephone counselling. Each mass media group received face‐to‐face contact. | |
| Arizona statewide tobacco control program; description of the programme design; no baseline measurement, no control, no smoking‐related outcomes. | |
| Demonstration project in 17 states of policy interventions, media interventions and smoking cessation activities. No description of mass media component, effectiveness measured in print coverage, not possible to separate out the effects of the mass media component. | |
| Australia's media campaign against drug abuse; no non‐exposed control group, 1 measurement before and 1 immediately after the campaign. | |
| RCT, randomising 14 media markets; targeting African Americans communication campaign utilizing radio and TV advertisements in combination with community outreach encouraging to call Cancer Information Service for smoking cessation information and materials; Outcome was volume of calls rather than changes to smoking behaviour. | |
| The Bootheel Heart Health Project; quasi‐experimental; smoking as a part of the community programmes and coalition development; mass media (newspaper column) within community programmes, no separate results for mass media component alone. | |
| Mass media cessation series accompanying self‐help smoking manual and in some counselling for supported groups of adults at health maintenance organisations or worksites. Surveys immediately after the campaign, 3 months, 1 year, no concurrent nonexposed control group. | |
| Mass media cessation series accompanying self‐help smoking manual and group counselling in some participants; no control group without mass media exposure. | |
| Multicomponent health promotion campaign including posters, street theatre, mimicry, rally and community presentation; not possible to assess mass media (posters) component alone. | |
| Coeur en sante St‐Henri, Montreal, Canada, mass media component was included in a multicomponent communitywide intervention targeting women. No results for mass media component alone. | |
| Multicomponent community intervention, involved face‐to face contact, mass media included news and stories in newspapers, on radio and television, posters and billboards, mailings; not possible to assess effects of mass media separately. | |
| Newspaper series and 1 survey after, no control group. | |
| Media markets randomised; mass media used to encourage women with young children to call for information on quitting; mass media as a recruiting tool; the smoking intervention was the counselling they received when they called the NCI phone line. | |
| Televised smoking cessation programme shown as a part of local news in Los Angeles area, no baseline measurement, registrants to the programme compared with cross‐sectional sample, all exposed to the programme | |
| Unable to assess as reprint unobtainable. | |
| 'Give it away for a day' ‐ Australia smoke‐free day; mass media, events, competitions and community interventions used for awareness, call to action, encouraging commitment to quit, no control group. | |
| Nationwide anti‐smoking campaign in Greece, mostly TV and radio, tobacco advertising ban; no control group; outcomes measured ‐ aggregated data on tobacco consumption, annual increase. | |
| Televised stop smoking clinic; no control group, no baseline measurement. | |
| Survey on impact of 'Smokers' Luck' TV programme on smokers' attitudes and behaviour, no control group. | |
| National survey on impact of TV programmes 'Dying for a Fag' and 'Licence to Kill' on cigarette smokers' attitudes and behaviour ‐ one before and 2 after the programme, no control group. | |
| Poster campaign; controlled before‐after study, follow‐up too short | |
| Booklet sent; RCT, follow‐up too short | |
| Mass media campaign; no non‐exposed control group | |
| Nationwide No Smoking Day ‐ panel survey, no control group, 1 before and 2 after measurements. | |
| Great American Smokeout; mass media for recruitment; before and after surveys, 2 months follow up only, no control group. | |
| National information campaign on smoking in Austria with 'stop now' programme, no control group, 1 survey after the campaign. | |
| Multicomponent intervention including mass media, self‐help materials, stop smoking groups and smoking cessation counselling. Smoking cessation not a reported outcome, only daily smoking and cigarettes per day. | |
| Health Education Board for Scotland's anti‐smoking campaign involving mass media, phone line and booklet. No control group, 1 measurement of callers to quit line before and 3 after. | |
| National tobacco campaign, no control group, one baseline measurement. | |
| Multicomponent community‐wide intervention targeted at minorities, including use of the mass media; description of the design of campaign and implementation, no smoking‐related results given. | |
| Multicomponent community intervention, mass media public education (TV, newspapers, radio) supported several community programmes; not possible to assess effects of mass media separately. | |
| Televised smoking cessation programme combined with self‐help manual, supportive phone calls and group meetings led by community member and psychology graduate student; control group potentially exposed to TV programme. | |
| New Zealand's tobacco control programme involving mass media use, census data 1 before the programme and 2 after the beginning, no control group, country case study. | |
| National against tobacco campaign involving mass media, no control group, 1 survey before and 1 after the campaign. | |
| RCT, mass media used as recruitment tool, the intervention was posted leaflet targeted at those recruited. | |
| Quit line, smoking kit ‐ a letter explaining the programme, booklet, media clinic broadcast as a part of TV show and radio programme ‐ the format of talk show; comparison group exposed to the media programmes; follow up 3 months. | |
| RCT cross‐over trial of 1346 households, randomised to self‐help video information/no video and telephone counselling/no counselling. Interventions not counted as mass media, since only participating homes received videos, and outcomes were cessation rates and imposition of domestic smoking bans. | |
| Comprehensive community and media programme in Beaumont/Port Arthur, measuring prevalence compared with other parts of Texas. Cannot separate effects of media from co‐interventions. | |
| Minnesota Heart Health Programme ‐ comprehensive community intervention to reduce smoking, high cholesterol, high blood pressure and sedentary lifestyles; health education, policy intervention and mass media use. No separate results for the mass media component alone. | |
| Community‐based smoking cessation programme led by self‐help booklet as primary quitting aid and complemented by 3‐part TV series. Major design problems and confounders ‐ cigarette prices rose sharply in the control city in the 6 months post‐intervention, and thus confounded or nullified the effect of the comparison ‐ the quit rates were higher in control city than in experimental city. | |
| Statewide mass media campaign; only 1 measurement point before campaign | |
| Multi‐component community‐wide smoking cessation intervention involving local mass media (newspaper, radio and TV), posters and leaflets, a local quit line, and self‐help materials, smoking cessation groups, and individual telephone counselling. Mass media primarily used to recruit to self‐help or group support rather than to disseminate tobacco control messages. Control community may have been 'contaminated' by national campaigns and national smoking ban. | |
| Mass media‐led smoking cessation campaign, no control group, 1 measurement before and 2 after the campaign. | |
| Both groups exposed to mass media campaign, designed to promote readiness to quit smoking; active vs passive intervention ‐ community+mass media vs mass media alone (to raise awareness). | |
| Statewide mass media campaign; only 1 measurement point pre‐campaign | |
| Comprehensive community‐based programme to reduce major cardiovascular risk factors; education and health services, community involvement, mass media, screening, appropriate practical skills training, social support for behaviour change and environmental modification. No separate results for the mass media component alone. | |
| Oregon's Tobacco Prevention and Education Program, description of programme design, development and implementation; result concerning aggregate data on tobacco sales in Oregon compared to other states (tobacco boxes taxed before and after tax increase). | |
| Mix of community and mass media interventions (including smoking cessation programmes). Planned as community‐based cardiovascular disease prevention project, but the authors state that 'it almost ended up being pure mass media awareness'. Doubtful design and quality, under‐resourced and poorly executed. | |
| RCT, 6 months follow up, not smoking cessation mass media intervention; mass media used for recruitment and identification. | |
| Intervention ‐ posters‐public places intervention (another review); study does not provide information about cessation or smoking or the change in smoking due to intervention; not possible to assess the effects of the intervention, as counting of butts and visible smokers may be a subjective and naive assessment of efficacy; although the study lasted for 26 weeks, smoking status of the patients was not recorded up to week 12 of the study. | |
| Programa Latino para Dejar de Fumar; multi‐component, including mass media, community‐wide smoking cessation intervention for Spanish‐speaking Hispanics; 2 pre and 2 post intervention measurements, no control group. | |
| No control group, monthly sales of all smoking cessation products before and after marketing a new nicotine patch. | |
| Multicomponent community campaign involving mass media use. No separate results for mass media component alone. | |
| Mass media‐based health education campaign 'Heart for Life', no control group, post‐campaign survey only. | |
| Multicomponent community‐wide cardiovascular disease risk factor reduction programme, including smoking prevention and cessation campaign. The intervention was implemented through the use of the media ‐ TV, radio, newspapers and direct face‐to‐face education in classes, contests and correspondence courses and school based programmes. Not possible to separate effect of mass media. | |
| Economic evaluation of mass media‐based community smoking cessation intervention aimed at the Turkish community; no control group, before‐and‐after panel survey in Turkish population. | |
| Self‐help media‐enhanced smoking cessation programme which had been aired in 7 cities in California. Subjects had been randomly assigned to be prompted or not prompted to view the mass media smoking cessation broadcast. 3 months follow up; control group potentially exposed to the programme, no smoking related outcomes. | |
| Mass media smoking cessation intervention, the evaluation carried out in the workplace during BBC broadcasting of 'So You Want to Stop Smoking' programme; smokers at the workplaces were shown the 2 series of the programme and encouraged to watch the remaining four parts on TV. Control groups were shown film about political and economic aspects of smoking; no non‐exposed control group. | |
| Not specific campaign; no non‐exposed control group | |
| Randomised field trial comparing standard dose of mass media campaign (national campaign TIPS) and higher dose mass media campaign (additional). Follow up was too short ‐ tobacco related outcomes were assessed on average 55 days after the end of campaign. | |
| National TV smoking programmes in Finland based on North Karelia experience; National TV smoking cessation campaign in 1978, 'Keys to Health' in 1980,82, 84‐85, 'Quit Smoking 86'; North Karelia (community interventions) vs the rest of Finland or one city/county of Finland with no community activities; no non‐exposed control group. | |
| Community cable TV smoking cessation programme; time series design to assess effectiveness, 1 measurement before and 3 after, no control group. | |
| Multicomponent community project; community agencies and associations, local government, public events, newsprint, posters, pamphlets, mailings, stop smoking self‐help manuals and smoking cessation groups. No separate results for mass media component alone. | |
| Booklet vs booklet RCT; no non‐exposed control group | |
| Mass media smoking cessation campaign; no control group, first survey after the campaign. | |
| Community‐wide smoking cessation campaign using self‐help manual and TV coverage. No control group, first survey after campaign. |
Data and analyses
| Outcome or subgroup title | No. of studies | No. of participants | Statistical method | Effect size | |||||||||||||||||||||||||||||||||||||||||||||||||||||||||||||||||
| 1 Response and retention rates Show forest plot | Other data | No numeric data | |||||||||||||||||||||||||||||||||||||||||||||||||||||||||||||||||||
| Analysis 1.1
Comparison 1 Mass media versus no mass media, Outcome 1 Response and retention rates. | |||||||||||||||||||||||||||||||||||||||||||||||||||||||||||||||||||||
| 2 Intermediate measures Show forest plot | Other data | No numeric data | |||||||||||||||||||||||||||||||||||||||||||||||||||||||||||||||||||
| Analysis 1.2
Comparison 1 Mass media versus no mass media, Outcome 2 Intermediate measures. | |||||||||||||||||||||||||||||||||||||||||||||||||||||||||||||||||||||
| 3 Primary measures of smoking behaviour Show forest plot | Other data | No numeric data | |||||||||||||||||||||||||||||||||||||||||||||||||||||||||||||||||||
| Analysis 1.3
Comparison 1 Mass media versus no mass media, Outcome 3 Primary measures of smoking behaviour. | |||||||||||||||||||||||||||||||||||||||||||||||||||||||||||||||||||||
| 4 Study summary by type of outcome Show forest plot | Other data | No numeric data | |||||||||||||||||||||||||||||||||||||||||||||||||||||||||||||||||||
| Analysis 1.4
Comparison 1 Mass media versus no mass media, Outcome 4 Study summary by type of outcome. | |||||||||||||||||||||||||||||||||||||||||||||||||||||||||||||||||||||
| 5 Baseline differences and possible confounding Show forest plot | Other data | No numeric data | |||||||||||||||||||||||||||||||||||||||||||||||||||||||||||||||||||
| Analysis 1.5
Comparison 1 Mass media versus no mass media, Outcome 5 Baseline differences and possible confounding. | |||||||||||||||||||||||||||||||||||||||||||||||||||||||||||||||||||||

Prisma flow diagram of search results
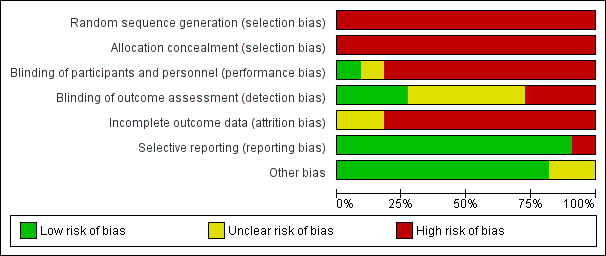
Risk of bias graph: review authors' judgements about each risk of bias item presented as percentages across all included studies.
| Study | Design | Intervention | Control |
| California TCP 2003 | Nested cross‐sectional | 1990‐1 75.1%1 (CA only) | NHIS, BRFSS and CPS rates apply. |
| CORIS 1997 | Nested cross‐sectional | 69.5% at baseline, 67.5% at resurvey | 64% at baseline, 63% at resurvey |
| Jenkins 1997 | Nested cross‐sectional | Pretest: 84%, post‐test: 94% | Pretest: 82%, post‐test: 88% |
| Massachusetts 2003 | Nested cross‐sectional | Median (1995): 60.4%, median (1999): 42.7%6 | Median (1995): 68.4%, median (1999): 55.2% |
| McAlister 2004 | Nested cross‐sectional | Baseline survey 9407, 7m follow‐up 8974; response rate approximately 60%. | Not reported separately |
| McPhee 1995 | Nested cross‐sectional | Pretest: 81%, post‐test: 82% | Pretest: 85%, post‐test: 88% |
| McVey 2000 | Nested cohort | Smokers: 6m: 73%, 18m: 70% | Smokers: 6m: 74%, 18m: 66% |
| Mogielnicki 1986 | Randomized cohort | Mail: Yr2 follow‐up: 17% | Mail: Yr2 follow‐up: 15% |
| North Coast QFL 1983 | Nested cross‐sectional | Baseline: 71% | Baseline: 72% |
| Stanford 3 City 1977 | Nested cross‐sectional | Gilroy 116 at baseline. | Tracy 115 at baseline. |
| Sydney QFL 1986 | Nested cross‐sectional | Sydney: 66% | Australia‐wide: 60% |
Comparison 1 Mass media versus no mass media, Outcome 1 Response and retention rates.
| Study | Intermediate measure | Process measures |
| California TCP 2003 | Between 1996 and 1999 slight increases in agreements that smoking causes cancer (82.2% and 83.3%) and that passive smoking harms children's health (93.2% and 94%). Between 1992 and 2002 increases in agreement that passive smoking causes cancer in nonsmokers (1992: 62.4%, 1996: 66.8%, 1999: 68.9%, 2002: 72.1%) and that smoking harms children's health (1992: 85.5%, 1996: 87.7%, 1999: 90.1%, 2002: 90.9%). In 2008, 67.2% of daily smokers, 80.2% of non‐daily smokers, and 85.8% of nonsmokers perceived secondhand smoke (SHS) as a cause of cancer and 88.6% of daily smokers, 94.1% of non‐daily smokers and 94.7% of non‐smokers believed that SHS can harm the health of children and babies. Further increase in % of smokers thinking about quitting between 1994 and 2005, in the next 30 days (1994: 30.9, 2000:37.8%, 2005: 43.9%) and in the next 6 months (1994: 65.6%, 2000: 74%, 2005: 75%). In 2008, 95.2% of smokers and 96.6% of nonsmokers report having a completely smoke‐free workplace. Between 1992 and 2008 increase in % of homes with smoking ban (1992: 48.1, 1993: 50.9%, 1996: 64.5%, 1999: 72.8%, 2002: 76.9%, 2005: 78.4%, 2008: 80.8%). Between 1992 and 2008 increase in % of smokers with a total home ban on smoking (1992: 19.4 ± 1.6%, 2008: 59.3 ± 2.6%; increase of 204.9%). Between 1990 and 2008 decrease in % of nonsmokers exposed to ETS at work (1990: 29%, 1993: 22.4%, 1996: 11.8%, 1999: 15.6%, 2002: 12.0%, 2005: 13.9%, 2008: 13.5%). Increases in: support for further increase in tax on tobacco (1992: 74%, 1993: 78%; 2008: 78%), support for ban on tobacco advertising (1990: 52%, 1996: 65% [read from the graph]), support for ban on tobacco sponsorships (1998: 56%, 2000: 60%), % of adults preferring non‐smoking bars (1996: 75%, 2000: 81%), support for banning smoking outside the entrance of buildings (2002: 62.8%, 2008: 72.1%) and in restaurant outdoor patios (2002: 62.4%, 2008: 75%), outdoor public places (2002: 52.3%, 2008: 60.4%), Indian casinos (2002: 59.9%, 2008: 66.5%), inside cars when children are in them (2005: 92.3%, 2008: 95.2%). | Systematic monitoring of the campaign and independent evaluations of the programme. Media weight: 1990/1: 50+ TV spots, 50 radio spots (69 radio stations), 20 outdoor ads (775 outdoor venues), 40 newspaper ads (130 newspapers); 1992/3: 40 spots (20 TV, 12 radio, 8 in outdoor locations), 44% focused on reducing ETS, 34% on countering pro‐tobacco influences, 20% smoking cessation and 2% on reducing youth access. 1990/4: local health departments conducted 10,000+ multi‐session programmes focusing on prevention (61%), cessation (37%) and ETS (2%). July 1995 ‐ Dec 1996: 19 ads (11 TV, 4 radio, 4 outdoor); 1997 ‐ 1998: 40 general audience ads for distribution (20 TV, 12 radio, 8 outdoor); July 1998 ‐ Aug 1999: 50 general audience anti‐tobacco ads (22 TV, 13 radio, 15 print ‐ mostly billboards). In 1996, 67% of adults reported seeing antismoking message on TV, 44% hearing on radio, 41% seeing antismoking billboard. In 1998 80% of adults were exposed to tobacco control programme through two or more components. In 2011 in CSC 28% to 61% recalled anti‐tobacco commercials. 2011 recall of any of anti‐tobacco spots was not related to quitting 1 yr later, recall of one specific spot ("Stages") was associated with higher quit attempts rate and quitting for more than 1 month, after 1 yr. The analysis on the basis of per capita consumption of cigarettes and average per capita media expenditures gave estimates of a fall of 3.9 packs per capita per year for each per capita USD spent on the media campaign. |
| CORIS 1997 | At baseline, knowledge scores higher in Swellenden than in Riversdale (both cross‐sectional and cohort surveys; no statistical comparisons given); at 4 yrs more increase in women in Swellenden (both cross‐sectional and cohort surveys; in cohort survey net change statistically significant); at 12 yrs increase in both communities and no difference. | Participation and reach of activities recorded in mass media and community intervention town (not included in this analysis). Media weight: Limited data. 1st yr: 6 different billboards, 6 posters, 8 mailings, frequent news items, health messages on electricity accounts, 1 special supplement in local newspaper. 2nd and 3rd yr frequency of billboards, posters and mailings about half of the initial rate, but news items frequent and annual special supplement in a local newspaper was added. Intervention costs: per capita costs given (USD 5 over 4 yrs in intervention community). |
| Jenkins 1997 | At baseline no differences in motivation to quit and self efficacy (SF/Houston: 29%/23%; 29%/25%). At follow‐up significant increase in motivation in both communities, but no difference (SF/Houston: 45%/ 44%), no significant change in self efficacy (SF/Houston: 33%/26%). | A 15‐month uncontrolled pilot anti‐tobacco campaign. Maintenance: no evidence found. Intervention costs: no evidence found. |
| Massachusetts 2003 | 1993 ‐ 2000: the majority of non‐smokers believed that second‐hand smoke (SHS) can harm children (96%) and can cause lung cancer (89%); increase in % of smokers believing that environmental tobacco smoke (ETS) can harm their children (1993: 78%, 1999: 91%, 2000: 93%) and can cause cancer (1993: 58%, 1999: 72%, 2000: 74%); 2007 ‐ 94.5% believe ETS is harmful. Decrease in: ETS exposure at work (1993: 44%, 2000: 29%), at home (1993: 28%, 2000: 18%) and in restaurants (1995: 64%, 2000: 39%, 2002: 37%), mean hours of ETS exposure during prior week at work (1993: 4.2, 1995: 2.3, P < 0.05, 1997: 2.2, 2001: 1.4), and at home (1993: 4.7, 2000: 3.3). Increase in: % of population covered by smoking restrictions in restaurants (1995: 26%, 2000: 69%, 2001: 78%); % of population living in a town with some form of smoking restrictions in public places (1993: 22%, 2000: 78%, 2001: 85%); % of smokers reporting that fewer than half their friends and relatives smoke (1993: 40.8%, 2000: 46.9%; P for trend = 0.03); most non‐smokers reported so both in 1993 and 2000 (1993: 90.1, 2000: 89.9). 2008 ‐ 80.7% voluntary tobacco‐free homes (vs 81.5% in 2007). 2009‐ 57% of schools with comprehensive smoking policies 2014 ‐ based BRFSS exposure for ETS decreased to 10% (vs 32% in 2002); only 16.4% of houses allow smoking. and exposure to ETS >1 hr/last wk decreased to 11% (vs 32% in 2002; 14.5% in 2008). Increase in support smoking ban in all personal spaces ‐ of people living in smoke‐free houses 87% and of those living in non smoke‐free houses 52%. | Messages were developed through formative research including focus groups. Systematic evaluation of the programme. Media weight: Oct 1993 ‐ Dec 1996: 66 spots aired; 35 TV ads (14,901 total gross rating points [GRP]), 27 radio spots (13,644 total GRP) on smoking cessation in adults; 38 TV (17,800 total GRP) and 22 radio (13,950 total GRP) ads targeted youth; 6 TV (17,727 total GRP) and 2 radio spots (6,308 total GRP) on ETS. Awareness/reach: 88% respondents saw any TV ads, among quitters ‐ 97%. On average 4.48 ads recognised. In 1995, 65% of the adult population were aware of the statewide anti‐tobacco campaign, and 76% recognised the tag line of the media campaign "It's time we made smoking history". Around 89% of adult smokers reported having heard, read or seen information about quitting smoking within the past year. Dose‐response: no evidence found. Maintenance: The campaign is ongoing. Intervention costs: On average USD13 million per year spent on anti‐tobacco advertising. About 48% expenditure (up to Dec 1996) spent on TV time (much prime time viewing hours). MTCP activities expenditures: 1st yr ‐ USD 43 million, 3rd yr ‐ USD 35 million. Mean per capita cost for media campaign was USD 2.42. |
| McAlister 2004 | Knowledge, attitudes, beliefs, intentions, brand preferences were assessed at baseline. Process of change variables were measured by rating by responders how much they agree or disagree (1 = strongly disagree, 5 = strongly agree) with the statements regarding attitudes to smoking and occurrence of behaviours associated with smoking cessation. At follow‐up, mean level of agreement was significantly higher among those who reported daily smoking cessation compared to those who maintained daily smoking with regard to having support for quitting and behaviours associated with smoking cessation and dealing with tension. Participants still smoking at follow‐up were significantly more likely to agree with the statements about attitudes and ability to quit . There are no follow‐up results in comparison with control group. | In message development community forums, focus groups and pre‐testing were used. No information regarding ongoing monitoring of media campaign was provided. Media weight: no evidence found. Awareness/reach: At follow‐up correlations between media exposures and process variables were calculated for all groups. No separate result for mass media were given. Dose‐response: Not given for mass media campaigns without community programmes separately. Maintenance: no evidence found. Intervention costs: per capita media spending reported, high level and low level media represented about USD 0.25 versus USD 1.00 per capita for media spending during the year of the campaign. |
| McPhee 1995 | Motivation to quit and self efficacy significantly more common in Santa Clara (SC) at baseline (SC/Houston: 36%/23%; 34%/ 25%). At follow‐up motivation to quit increased significantly in both communities, but did not differ (SC/Houston: 44%/ 44%), self efficacy did not change significantly and did not differ at follow‐up (SC/Houston: 32%/ 26%). 'Any household member smokes' responses similar at baseline (SC/Houston: 31%/29%) fell significantly in both communities (SC/Houston: 26%/24%). 'No friend smokes' responses not different at baseline (SC/Houston: 4%/3%) increased significantly in both communities (SC/Houston: 15%/13%). 'All or most friends smoke' responses similar at baseline (SC/Houston: 43%/46%) increased in Houston (SC/H: 44%/51%). Never‐smokers or former smokers advising family or friends to quit smoking increased from baseline in both communities (SC vs Houston: from 51% to 62% (P < 0.05) vs from 34% to 66% (P < 0.05)). Current or former smokers being advised to quit by family or friends increased from baseline in both communities (SC vs Houston: from 53% to 63% (P < 0.05) vs from 51% to 62% (P< 0.05)). | Media weight: newspaper articles ‐ 562,000 print media exposures, videotape copies distributed to 60+ Vietnamese doctors' offices and 20 community agencies in SC; nearly 42,000 brochures at 500+ location in SC, nearly 6000 self‐help quit kit copies at 250+ locations; 1140 signs with adhesive backings saying "Please do not smoke" in Vietnamese distributed; 50 copies of 3 billboards posted each month and printed in newspapers and magazines (8,000,000 print media exposures). Paid TV ads ‐13,000 secs of air time; short anti‐tobacco presentations at 30 community events. CME courses on smoking cessation ‐ 68 Vietnamese physicians. Awareness/reach: Participants were asked if they had ever read article or seen advertisement in Vietnamese language newspaper or seen television programme or billboard in Vietnamese or heard a speech at a Vietnamese community meeting. Significantly more respondents from SC reported exposure to anti‐smoking activities in Vietnamese language (except for newspaper articles and public speaking). Smokers and non‐smokers in SC recalled significantly more intervention elements (SC vs Houston: out of a possible 5: 3.0 vs 1.6, P < 0.01 and 2.8 vs 1.4, P < 0.01). In SC significantly more physicians reported using antismoking brochures in Vietnamese, providing self‐help quit kits and referring patients to smoking cessation programmes (SC vs Houston: 86.4% vs 32.5%, P = 0.001; 66.7% vs 43.2%, P = 0.03; 35.9% vs 13.5%, P = 0.02). Quality of health education materials assessed: at follow‐up 96.4% of physicians reported they were helpful. Dose‐response: no evidence found. Maintenance: no evidence found. Intervention costs: no evidence found. |
| McVey 2000 | Smoking and health‐related attitudes assessed at baseline, no follow‐up data given. | Qualitative pilot research studies using focus groups and in‐depth interviews with smokers and ex‐smokers were conducted before and during the campaign. Media weight: It was estimated that over the course of the campaign in the double‐weight regions each viewer could see at least 20 screenings, and in single‐weight regions about 15. Awareness/reach: no evidence found. Dose‐response: nearly 20,000 calls to the quit line during the campaign. No evidence of an effect of intensity of ads measured at 6 month follow‐up found. Maintenance: After study completion the TV advertisements were shown nationally in all TV regions in England. Intervention costs: evidence not found. |
| Mogielnicki 1986 | Attitudes and beliefs regarding cigarette smoking were assessed on enrolment on a 5‐point rating scale (1 = disagree strongly, 5 = agree strongly). No separate results for 2nd yr follow‐up (mass media) given. | Surveys, interviews, copy tests among patients fulfilling study inclusion criteria but not included in the final study group. Media weight: One 60‐sec main commercial and 2 x 30‐sec variants used. A series of 3‐week 'flights'; main spot on TV was broadcast 40 times, and variants 106 times, radio spot ‐ 90 times. Each flight lasted 2 ‐ 3 weeks. Awareness/reach: Participants were asked about the recall of advertising campaign, clinic participants in media group (White River Jct): 61% did and 39% did not recall the advertising campaign at 6 month follow‐up. Dose‐response: Among those who recalled, 43.5% were abstinent at 6 months, while among those who did not 26.7% abstinent. Maintenance: no evidence found. Intervention costs: total costs of commercials development and production: USD 7480, broadcast time cost: USD15,150. |
| North Coast QFL 1983 | Attitudes to smoking and knowledge of the effects of smoking assessed in a questionnaire (6 questions each). No significant differences were found. Influences in decision to quit smoking reported ‐ the most common: health concerns (Coffs Harbour/Tamworth: 53%/ 59%), the least common: social pressure and media advertisement (Coffs Harbour/Tamworth: 1%/1%, 2%/1%), other were friends/family (Coffs Harbour/Tamworth: 15%/ 13%) and doctor's advice (Coffs Harbour/Tamworth: 7%/5%). Technique of quitting: most common ‐ 'cold turkey' (87% in both towns), quitting with help was rare (Coffs Harbour: self‐help kits 2%, group programme 1%, hypnosis 2%). | Focus groups and spot surveys were used to assess the effectiveness of the intervention techniques used. Media weight: Information collected only on community programme exposure. Awareness/reach: no evidence found. Dose‐response: no evidence found. Maintenance: no evidence found. Intervention costs: no evidence found. |
| Stanford 3 City 1977 | 25‐item behavioural interview on participants' knowledge about risk factors (diet, weight, exercise and smoking ‐ 3 items). Significant increases in knowledge scores in intervention cities compared to control city after 2 yrs. | Mass media campaign was monitored and revised; instructional content, development, pretesting, application and reformulation co‐ordinated by study staff. Media weight: limited data; TV programming ‐ 3 hours, 50 TV spots, 100 radio spots, several hours of radio programming, weekly newspaper columns, no details about newspaper and ads stories, billboards, printed materials sent via direct mail to participants, posters in buses, stores and work sites. Awareness/reach: no evidence found. Dose‐response: increases in risk factor knowledge related to increases in intervention intensity, even in Watsonville‐reconstituted group (mass media only, but a group in community received intensive face‐to‐face counselling) the gains were bigger than in Gilroy (mass media only group) and in both intervention communities the gains were bigger than in Tracy. Maintenance: After intensive 2 yrs, 1 yr reduced level campaign. Intervention costs: no evidence found. |
| Sydney QFL 1986 | Additional random samples of Sydney and Melbourne smoker populations surveyed in 1983 and 1986 (Sydney/Melbourne: 1983: 271/217; 1986: 557/ 550). Health beliefs and social influences increased between 1983 and 1986 (Sydney/Melbourne: 40+ years old: males 10% to 29%/21% to 29%; females 12% to 27%/22% to 32%; < 40: males 34% to 53%/30% to 43%, females 30% to 44%/31% to 41%). | Formative research on messages' effectiveness among target audience. Media weight: 1983: 389 primetime ads spots (3 commercials used) ‐ the intensity alternated in 2‐wk phases: between heavy and nothing for 1st 3 months, follow‐up ad campaign of half the intensity after 5 months. After 1st year spots during prime or fringe time for approx 4 wks at the start of the campaign yr ‐ each yr nearly 40 spots/wk. Awareness/reach: During 1st yr each month 750 people in Sydney and 200 in Melbourne interviewed on recall of campaign messages and response to the question on likelihood of giving up smoking in the next 12 months. The recall rates for the commercial most frequently shown were 87% in smokers, 82% in non‐smokers and 85% in ex‐smokers, the second in the frequency: 73%, 69% and 67% respectively. The third commercial recall rates were: smokers: 39%, non‐smokers: 31%, ex‐smokers: 33%. During campaign more smokers in Sydney indicated they were likely to quit smoking, especially after 4 months (difference: 18.6%); the difference disappeared by the end of the campaign. Long‐term assessment: TV ads recall measured each yr in separate random samples of the population of at least 1000 persons higher in Sydney (Sydney/Melbourne: 1984: males: 72%/70%, females: 80%/67%; 1986: males: 92%/68, females: 94%/67%). Dose‐response: number of calls to quitline was measured as a direct relationship to the number of TV spots aired (presented on the graph); peak response ‐ 11,000 calls in wk 8; 50,000+ calls to the quitline in the 1st 3 months. 'Quit centre' stop smoking programmes enrolments: almost 3000 in 1983 (previous yr 500); in wk 8 with peak quitline calls number ‐ 352. 19,196 quit kits sold. Maintenance: Since 1984 the campaigns continued in both Sydney and Melbourne till 1986, ads shown on primetime TV for 6 ‐ 8 weeks during winter months. Intervention costs: The budget for the campaign given (AUD 620,000), most of which was used for purchase of newspaper space and radio and TV time (AUD 500,000). |
Comparison 1 Mass media versus no mass media, Outcome 2 Intermediate measures.
| Study | Study population | Smoking prevalence | Tobacco consumption | Other outcomes |
| California TCP 2003 | Selection: population‐based surveys conducted nationally and in California (CA): National Health Interview Surveys (NHIS) 1978 ‐ 1994: household survey of a stratified, multistage, probability sample of the US population administered to all adults 18+ yrs; Behavioral Risk Factor Surveillance System (BRFSS) 1984 ‐ 1994: state surveillance of behavioural risk factors among adults, data collected through random digit dial telephone interviews (with multistage cluster sampling method); with California Adult Tobacco Survey from 1994, data up to 2008. Current Population Surveys (CPS) 1985, 1989, 1992/3 ‐ 1996: national survey of the US household population 15+ yrs, interviews in person; data up to 2008 California Tobacco Survey 1990‐2008 response rate 79.5% to 87.8%; CA, rest of US: from 1112 to 5747, from 9205 to 39,203; BRFSS 1984 ‐ 1994, response rate from 77% to 84%: from 1081 to 3959; with CATS from 1994 over 10,000 in CA and 80,000 to 400,000 in the rest of US. CPS 1985 ‐ 1996: response rate from 86% to 89%: CA, rest of US: from 4076 to 8272, from 70,164 to 97,856; CPS 1992/3 to 2006/7, CA, rest of US: from 16,000 to 24,000, from 210,000 to 290,000; CTS, CA only between 44,000 and 93,000 respondents per survey. | Final data (From 1990 programme start to 2008): All surveys (CTS, CPS and BRFSS pooled analysis years 1990 ‐ 2008, decline of smoking prevalence: CA 0.32% points per year, rest of US 0.24% points per year. 2008 smoking prevalence: CA 13.1%, rest of US: 19% Interim reported data: According to the analysis of the results of NHIS, adult smoking prevalence decreased more rapidly from 1985 to 1990 than from 1978 to 1985 in CA and in the rest of USA . Increase in rate of decline between 2 periods in CA was 0.62% points per year (95% CI ‐1.27 to ‐0.03), and in rest of USA 0.43 (‐0.70 to ‐0.16). Adult smoking prevalence decreased less rapidly from 1990 to 1994 than from 1985 to 1990 in CA (0.39% points per year) and in the rest of USA (0.05%, non‐sig different from zero). Between 1978 and 1994 adult smoking prevalence was 2 ‐ 5 percentage points lower in CA than in the rest of USA, but the estimated rate of decline in smoking prevalence was no‐sig different from that of the rest of USA during any of the 3 time periods. ‐0.6 (95% CI ‐0.79 to ‐0.40) vs ‐0.5 (‐0.67 to ‐0.33); All surveys combined analysis: CA, rest of US rate of decline % (SE) ‐ smoking prevalence %: | Final data (1970 ‐ 2008), per capita taxable sales: 1970 per capita sales similar in CA and rest of US. In 1989, CA sales 26.1% lower than sales for the rest of the US (108.8 versus 147.2 packs per year). Faster rate of decline in CA vs rest of the US. 2002 CA vs rest of the US lower sales (48 versus 101 packs per capita per year). From 2002 slower rate of decline in CA vs rest of the US (from 44.6 to 40.4 packs per year, a decline of 9.4%), but still lower sales than in the rest of the US. 2008: 40 versus 77 packs per capita per year, or 3.37 versus 6.42 packs per capita per month). 1989/90 to 2006/7, per capita consumption greater decline in CA vs rest of the US: 60.8% vs 41.0% (40 vs 92 packs per person per year). Per capita consumption based on aggregated sales data declined faster in CA in the early period of the campaign than before it started, and the decline was significantly greater than in the rest of USA. During late programme the decline slowed but remained greater than in the rest of USA. In another analysis presenting the results up to 1999 the rate of decline of tobacco consumption (tobacco consumption pack/month), CA/rest of US: Baseline 1/1983 ‐ 12/1988: ‐0.46 (9.5)/ ‐0.35 (12.4); In analysis presenting the results for tobacco consumption up to 2002, CA,/rest of US packs/month * CA vs rest of US P < 0.01. | Quit ratio, defined as % of ever‐smokers (current and former) who were former smokers in a given year, accelerated non‐sig in CA and in the rest of US between 1985 and 1990. 1990 to 1994, rate of increase in quit ratio decreased, with no significant changes in CA and in the rest of US compared to the period of 1985 to 1990. % of smokers who are currently quit for 3+ months did not change significantly (1990: 8.5 ± 1.0%, 1999: 5.4 ± 0.5%, 2008: 8.0 ± 2.5%) % of recent smokers currently in a quit attempt of 6+ months did not change significantly (1990: 5.6 ± 0.7%, 1999: 4.2 ± 0.5%, 2008: 6.4 ± 2.5%) |
| CORIS 1997 | Selection: Total population included in baseline and 4‐yr follow‐up surveys (15 ‐ 64 yrs at baseline and 15 ‐ 68 at 4‐yr follow‐up). | In total population % of smokers was lower in men and women in intervention compared to control city (non‐sig difference). | In total population tobacco consumption was lower in men and women in intervention compared to control city (non‐sig difference). | In women quit rates were significantly lower in intervention compared to control city. *significant difference compared to control; **significant compared with heavy smokers. |
| Jenkins 1997 | Selection: Phone surveys of randomly selected Vietnamese men, with numbers chosen randomly from 23 most common Vietnamese surnames listed in area phone books. After enumerating all men aged 18+ living in the household and speaking Vietnamese, subjects for interview were selected according to random age rankings in the household. | Smoking prevalence did not differ significantly at baseline. Post‐intervention, smoking prevalence fell significantly (P = 0.004) in SF and increased in Houston. Current smokers % among Vietnamese men: SF/Houston: | Significant difference in cpd at baseline (Houston higher), significant decrease in Houston, but not in SF. At follow‐up mean cpd was significantly higher in Houston. | Significant increase in quit rate in SF compared to Houston (P = 0.017). |
| Massachusetts 2003 | Selection: population‐based survey in Massachusetts (MA) and in the rest of USA (excluding CA) ‐ Behavioral Risk Factor Surveillance System (BRFSS): annual, state‐based, standardised, random digit dialled telephone survey of non‐institutionalised US adults aged 18+; 42 states including MA and CA participated consistently in BRFSS between 1989 and 1998; MA tobacco surveys conducted since 1993‐4 (baseline) in adults, and every month since March 1995, estimates of adult smoking prevalence are derived from household screening interviews with an adult informant who reported on smoking status for all adult members of the household. | According to the analysis based on BRFSS 1989 to 1998 and MA Tobacco Surveys 1993 to 1999 the slope of smoking prevalence after 1992 was significantly different from zero and from the slope for the rest of USA. Based only on BRFSS 1990 ‐ 1999 controlling for age, sex, race, and education there was a greater decline in current smoking between 1990 and 1999 among MA men than among MA women, and the decline was greater in MA than in the rest of the USA for men and for both sexes combined. | Annual per capita tobacco consumption based on aggregated sales data: | Quit ratio: not reported. |
| McAlister 2004 | Selection: telephone surveys of randomly selected (random digit dialing) adults from Texas (including individuals not resident in treatment areas); respondent in each household with the most recent birthday aged 18+ selected. Cohort of smokers identified in baseline cross‐sectional sample was followed. | Not reported ‐ only levels of daily smoking given (15.7 at baseline, 17.5 at follow up).. | Not reported. | Complete cessation achieved by approx 2% of panel of daily smokers. |
| McPhee 1995 | Selection: Phone surveys of randomly selected Vietnamese men, chosen randomly from 23 most common Vietnamese surnames in area telephone books. After enumerating all men aged 18+ living in the household and speaking Vietnamese, subjects for interview were selected according to modified Kish procedure. | At baseline smoking prevalence in SC differed significantly from Houston (control community). It slightly increased in control area and remained unchanged in intervention area ‐ there was no intervention effect. Current smokers among Vietnamese men, SC/ Houston: Baseline 1990: 36%/40%; | At baseline SC cig consumption differed significantly from Houston. It fell significantly in the control area , but there was no significant intervention effect. Mean cpd among smokers: SC/Houston: Baseline 1990: 9.9/13.2; | Quit rates in past 2 yrs differed significantly at baseline, but there was no significant intervention effect. |
| McVey 2000 | Selection: In each TV region a random sample of enumeration districts were selected (1 in 40) and within each district a random sample of households (1 in 20) using computer‐generated lists. Selected households were visited by interviewers and a resident member was selected for the sample with the use of pseudo‐random Kish‐grid method. Only adults at least 16 yrs were sampled. Only smokers and ex‐smokers were included in the study. Attempts were made to re‐interview the same respondents 6m and 18m later with similar structured questionnaire. | Not reported other than varying in different target regions. | Not reported. | By 18m, more successfully followed smokers in TV media group gave up smoking than in control group (non‐sig). Quit rates in smokers (TV media/control): 9.7%/8.7%; OR: 1.27 (95% CI 0.77 to 2.08), adjusted for predictors of giving up cigarettes: sex, age, manual/non‐manual job, daily cig consumption, "want to reduce smoking" and sex by manual/non‐manual work interaction. More ex‐smokers not relapsing were observed in TV media than in control group (significant): 96.3% vs 94.5%, adjusted OR: 2.21 (95% CI 1.11 to 4.40, P = 0.025); adjusted for predictors of remaining off cigs: number of cpd before stopping, length of time since stopping, whether persuaded to stop smoking by somebody else. TV media compared to no intervention was estimated to have increased the odds of not smoking. |
| Mogielnicki 1986 | Selection: reception clerks asked all patients registering for clinic visits about smoking and interest in stopping. | Not reported. | Not reported. | In clinic participants, number abstinent was higher in group receiving mass media compared to group not receiving mass media (calculated for all participants included in the study at baseline). In the mailing group in both media and no‐media groups no participant was abstinent and no number of participants included in the study at baseline was given. |
| North Coast QFL 1983 | Selection: systematic random sample of men and women 18+ from each town, up to 2 adults per household. | Significant effect of the intervention was found. | Not reported. | Quit rates not reported. |
| Stanford 3 City 1977 | Selection: in each city random multistage probability sample of men and women 35 ‐ 59 yrs old. | Reported only for high‐risk group (baseline/1st /2nd /3rd year follow‐ups): | Per capita cig consumption for adults 35 ‐ 59 yrs (baseline/% change 1973/1974): | Quit rates not reported. |
| Sydney QFL 1986 | Selection: random weekly selection from list of all Australian electoral subdivisions. Selected 10 separate households starting from randomly selected address from each electoral subdivision (clockwise direction around the residential block). Within household youngest person 14+ or 16+ interviewed. | At 1st cross‐sectional surveys prevalence decreased in Sydney compared to the rest of Australia (non‐sig). | Cross‐sectional studies after 1st issue of the campaign found decrease in cpd in Sydney compared to the rest of Australia (non‐sig). | Significantly larger proportion of Sydney smokers compared to Melbourne smokers quit smoking or cut down on cigs. Relapse rate and initiation rate were similar in both cities. * P < 0.05. |
Comparison 1 Mass media versus no mass media, Outcome 3 Primary measures of smoking behaviour.
| Study | Type of outcome | Orientation | Cost | Effect |
| California TCP 2003 | Prevalence | Social diffusion theory, with social marketing and social policy change | April 1990 ‐ June 1993 USD 26m for media campaign. | Pre‐programme prevalence 23.3 in CA vs 26.2 in rest of USA. By 1993 down to 18.0 in CA, 23.3 rest of USA; By 1996, prevalence still 18.0 in CA vs 22.4 in rest of USA. Final data (2008): CA 13.1%, rest of US: 19% Rate of decline % (SE): CA: Pre‐TCP: ‐0.74 (0.12) > early period : ‐1.06 (0.17) [P < 0.05 CA vs USA, P < 0.001 change from pre‐TCP] > late period 0.01 (0.21) P < 0.05 CA vs USA. Final data (up to 2008): CA 0.32% points per year, rest of US 0.24% points per year. Media campaign alone (without other Prop 99 components) led to decline in cig consumption of 12.2% between April 1990 and March 1991. Final data (1970 ‐ 2008), per capita taxable sales: CA sales 26.1% lower than sales for the rest of the US (108.8 versus 147.2 packs per year). Faster decline in CA vs rest of the US. 2002 48 versus 101 pc per yr 2008: 40 versus 77 pc per yr, |
| CORIS 1997 | Prevalence | Not reported | pc cost of USD 5 over 4 yrs in media‐only intervention town. | After 4 yrs, Intervention (Control) prevalence in men dropped from 49.5 (45.7) to 40.4 (38.1) , and in women from 17.6 (16.1) to 14.0 (15.6) . Data contains paired and unpaired observations, in total population. |
| Jenkins 1997 | Prevalence | Not reported | Not reported | At 2 yrs, San Francisco (int) prevalence down from 36.1 to 33.9 (P ≤ 0.01), and Houston (control) up from 39.6 to 40.9. Net change was ‐3.5 % points (P = 0.004). |
| Massachusetts 2003 | Prevalence | Social diffusion theory, with social marketing and social policy change | USD 39m pa for whole programme. | 1990 ‐ 9: MA prevalence declined from 23.5 (CI 21.0 to 26.1) to 19.4 (CI 18.0 to 20.8). |
| McAlister 2004 | Prevalence | Social learning theory, transtheoretical model. using modelling, social reinforcement for behaviour change, and emotional arousal. | USD 9m pa | Prevalence of daily smoking increased from 15.7 to 17.5. |
| McPhee 1995 | Prevalence | Not reported | Not reported | No change in prevalence in Intervention community from baseline to 2 yrs: 36.0, while controls increased (non‐sig) from 40 to 41. |
| McVey 2000 | Quit and relapse rates. | No formal attributing, but 'morbid humour' used. | Not reported | At 18m, 9.8% of intervention smokers vs 8.7% of control had quit, and 4.3% of intervention ex‐smokers vs 3.7% controls had relapsed. Pooled OR of not smoking was 1.53 (CI 1.02 to 2.29, P = 0.04). |
| Mogielnicki 1986 | Cessation rates | Mass marketing techniques (situation analysis, objective definition, copy development, media plan, campaign launch) combined with traditional clinical trial approach. | Copy development and production: USD 7480, Air time: USD 15,150 (1980 USD) | Per protocol clinic cessation at 2nd year: |
| North Coast QFL 1983 | Prevalence | Social marketing and communication theory | Not reported | Mean declines in prevalence in Intervention community of 9.5% from baseline to Yr 3, and in controls of 4.4%. |
| Stanford 3 City 1977 | Prevalence | Social marketing, social learning and communication theory | Not reported | All participants: Baseline: Intervention 65.5, Control 55.6. |
Comparison 1 Mass media versus no mass media, Outcome 4 Study summary by type of outcome.
| Study | Differences | Possible confounders | Adjusted effects |
| Jenkins 1997 | San Francisco (Int) respondents significantly less proficient in English, of lower education, lower income, less likely to be employed and more recent year of immigration than Houston (control) respondents. | All these factors were included in multivariate analyses. | Unadjusted ORs not reported. Strongest predictor of quitting was being a student (adjusted OR 2.19, 95% CI 1.45 to 3.33); at least high school education (OR 1.33: CI 1.04 to 1.70); more recent year of immigration (OR 1.03: CI 1.00 to 1.05); each + yr of age (OR 1.03: CI 1.02 to 1.04). |
| Massachusetts 2003 | MA respondents were more likely to be white non‐Hispanic and more likely to be college graduates than the respondents from the rest of USA. | Age, sex, race and education were treated as confounders. | Unadjusted OR for current smoking in MA in 1999 vs 1990 was 0.78 (CI 0.66 to 0.92, P trend 0.01). |
| McAlister 2004 | Responders and non‐responders to follow‐up survey differed significantly by age, race and gender. | Daily smoking rate "adjusted for age, gender and educational level". No OR reported. | |
| McPhee 1995 | Small but significant differences in mean age, educational level, English language proficiency, mean year of immigration, between SC and Houston and/or between pre‐ and post‐test samples. Larger differences in employment (8% unemployed in SC vs 6% in Houston pre‐test) and income (32% below poverty level in SC vs 26% in Houston post‐test). | Analyses controlled for site, time, (pre‐, post‐test), intervention term (site x time), age, education, English language proficiency, year of immigration, employment status, income. | Differences in prevalence between SC and Houston did not persist after controlling for sociodemographic characteristics. Strongest predictor of current non‐smoking was age 65+. Age 18 ‐ 24, immigration before 1977, college education and English fluency all predicted non‐smoking, but employment and income did not. Adjusted OR for intervention term was 1.1 (95% CI 0.9 to 1.4). Adjusted OR for recent quitting 1.1 (95% CI 0.7 to 1.7). |
| North Coast QFL 1983 | Age and sex differences across towns and years. | To counter known confounding, an AGE*SEX*TOWN term was constructed for the regression model, and a TOWN*YEAR factor. | |
| Sydney QFL 1986 | Location of interview (Sydney vs Melbourne) was significant predictor of quitting (P < 0.05). | Sex, age, education, marital status, SES did not predict quitting or act as confounders. | No ORs reported. |
Comparison 1 Mass media versus no mass media, Outcome 5 Baseline differences and possible confounding.
| Mass media smoking cessation intervention compared with no intervention for smoking cessation | ||||
| Patient or population: Adults who smoke Settings: Community Intervention: Mass media Comparison: No mass media | ||||
| Outcomes | Impact | No of | Quality of the evidence | Comments |
| Smoking prevalence (follow up from 6 months to 18 years) | The 2 state‐wide programmes, in which mass media campaigns were part of comprehensive tobacco control programmes, observed greater declines in smoking prevalence than in the rest of the USA. Of the 5 community‐based studies, 2 found significant decreases in smoking prevalence, 1 did not detect a significant effect, and of 2 studies conducted among Vietnamese‐American men, one detected a statistically significant decrease in smoking prevalence at 2 years, while the other did not. | 7 (n = 1,965,478)1 | ⊕⊝⊝⊝ | 2 studies were interrupted time series; and 5 were quasi experimental |
| Tobacco consumption (follow up from 2 to 18 years) | In the 2 state‐wide campaigns cigarette consumption was measured on the basis of aggregated sales data. In 1, a statistically significant decline was observed compared with the rest of the USA. In the other, declines in consumption were reported, but without statistical comparisons. Of the five community‐based studies, 1 study detected a significant reduction in cigarette or tobacco consumption for a high‐risk group, who also received counselling, but not in the media‐only intervention community compared with controls. The remaining 4 studies did not detect significant differences. | 7 (n = 1,964,292)1 | ⊕⊝⊝⊝ | 2 studies were interrupted time series and 5 were quasi experimental |
| Abstinence or quit rates (follow up from 6 months to 18 years) | Among the 8 studies presenting abstinence or quit rates, 4 showed some positive effect. 1 state‐wide campaign presented the quit ratio (i.e. the percentage of ever‐smokers (current and former) who were ex‐smokers in a given year), finding a statistically significant difference in favour of the intervention. The other 7 studies were community based; of these, 4 detected a statistically significant effect in favour of the intervention across the study population, 1 found statistically significant differences only in women, 1 study reported a non‐statistically significant difference in point prevalence of daily smoking, and 1 detected no significant differences. | 8 (n = 987,800)1 | ⊕⊝⊝⊝ | 1 study was quasi RCT and 7 were quasi experimental |
| Quit attempts (follow‐up from 7 months to 18 years) | Of the 5 studies that assessed quit attempts, 3 were community‐based studies, and 2 were state‐wide campaigns. 2 community‐based studies among Vietnamese‐American men found no significant differences between the intervention and control communities. A third study only assessed quit attempts among participants still smoking at follow‐up, of whom 27.3% had made quit attempt. 2 state‐wide campaigns assessed quit attempts only in the intervention community. In 1 they increased in line with campaign duration but not to a statistically significant extent, in the other the percentage of smokers with a quit attempt in the last year increased over the duration of the study, but without statistical comparisons. | 5 (n=1,947,674)1 | ⊕⊝⊝⊝ | 2 studies were interrupted time series and 3 studies were quasi experimental |
| GRADE Working Group grades of evidence | ||||
| 1 Estimated participant numbers based on the number of respondents to surveys and the number of participants at follow up in the quasi‐experimental studies. 2 GRADE rating started at 'low': none of the studies were RCTs. One was a quasi‐RCT, two were interrupted time series and eight were quasi‐experimental. 3 Downgraded one level for inconsistency: included studies varied in design, intervention, comparator and population, and results were not homogenous. | ||||
| Outcome or subgroup title | No. of studies | No. of participants | Statistical method | Effect size |
| 1 Response and retention rates Show forest plot | Other data | No numeric data | ||
| 2 Intermediate measures Show forest plot | Other data | No numeric data | ||
| 3 Primary measures of smoking behaviour Show forest plot | Other data | No numeric data | ||
| 4 Study summary by type of outcome Show forest plot | Other data | No numeric data | ||
| 5 Baseline differences and possible confounding Show forest plot | Other data | No numeric data | ||