Formula yang diperkayakan dengan nutrien berbanding formula bayi yang standard untuk bayi pramatang selepas discaj dari hospital.
Referencias
References to studies included in this review
References to studies excluded from this review
References to studies awaiting assessment
Additional references
References to other published versions of this review
Characteristics of studies
Characteristics of included studies [ordered by study ID]
| Methods | Randomised controlled trial | |
| Participants | 121 formula milk‐fed VLBW (< 1500 g) infants | |
| Interventions | Preterm formula (energy content 80 kcal/100 mL, protein content 2.4 g/100 mL, calcium and phosphorus content 100 mg/100 mL and 50 mg/100 mL, respectively) (N = 69) or standard term formula (energy content 70 kcal/100 mL, protein content 1.7 g/100 mL) (N = 52). The intention was for the allocated formula to be the only milk source from 40 weeks until 55 weeks postmenstrual age (PMA) | |
| Outcomes | Growth parameters and Griffiths Developmental Scale at 40 weeks, 55 weeks PMA and 6 and 12 months' corrected age | |
| Notes | Setting: multi‐centre trial in Italy (2001) Research supported by Milupa (formula milk manufacturing company) Numerical growth data obtained from primary investigators (June 2011) | |
| Risk of bias | ||
| Bias | Authors' judgement | Support for judgement |
| Random sequence generation (selection bias) | Unclear risk | Report states simply that infants were "randomised" to study groups. |
| Allocation concealment (selection bias) | Unclear risk | Randomisation method was not mentioned. |
| Incomplete outcome data (attrition bias) | High risk | Loss to follow‐up was 34% at 6 months and 66% at 12 months. |
| Blinding of participants and personnel (performance bias) | High risk | Families and caregivers were aware of which formula milk infants received. |
| Blinding of outcome assessment (detection bias) | Low risk | Outcome assessors were unlikely to have been aware of which formula milk infants received. |
| Methods | Randomised controlled trial | |
| Participants | 70 formula milk‐fed preterm infants of birth weight < 1800 g and 'appropriate for gestational age' | |
| Interventions | Postdischarge formula (energy content 74 kcal/100 mL, protein content 1.8 g/100 mL) (N = 34) vs standard term formula (N = 36) for 12 months post discharge | |
| Outcomes | Growth parameters at 6, 9 and 12 months' corrected age | |
| Notes | Published in abstract form only. Additional information and data courtesy of Dr Stephanie Atkinson | |
| Risk of bias | ||
| Bias | Authors' judgement | Support for judgement |
| Random sequence generation (selection bias) | Low risk | Random sequence was independently generated. |
| Allocation concealment (selection bias) | Low risk | Allocation was drawn from sequential sealed opaque envelopes. |
| Incomplete outcome data (attrition bias) | High risk | Growth outcome data to 12 months were available for 24 (71%) intervention group and 29 (81%) control group infants. |
| Blinding of participants and personnel (performance bias) | Low risk | Families and caregivers were unaware of which formula milk infants received. |
| Blinding of outcome assessment (detection bias) | Low risk | Outcome assessors were not aware of which formula milk infants received. |
| Methods | Randomised controlled trial | |
| Participants | 53 formula milk‐fed preterm 'small for gestational age' infants | |
| Interventions | Postdischarge formula (energy content 74 kcal/100 mL, protein content 1.8 g/100 mL) (N = 24) vs standard term formula (Ross Similac With Fe) (N = 29) for 12 months post discharge | |
| Outcomes | Growth parameters at 6, 9 and 12 months' corrected age | |
| Notes | Published in abstract form only. Additional information and data courtesy of Dr Stephanie Atkinson | |
| Risk of bias | ||
| Bias | Authors' judgement | Support for judgement |
| Random sequence generation (selection bias) | Low risk | Random sequence was independently generated. |
| Allocation concealment (selection bias) | Low risk | Allocation was drawn from sequential sealed opaque envelopes. |
| Incomplete outcome data (attrition bias) | Low risk | Follow‐up growth parameter outcome assessments were completed. |
| Blinding of participants and personnel (performance bias) | Low risk | Families and caregivers were unaware of which formula milk infants received. |
| Blinding of outcome assessment (detection bias) | Low risk | Outcomes assessors were not aware of which formula milk infants received. |
| Methods | Randomised controlled trial | |
| Participants | 125 preterm infants (birth weight < 1800 g or gestation < 37 weeks). Infants with severe bronchopulmonary dysplasia or cardiac, respiratory, gastrointestinal or other systemic diseases at time of discharge were not eligible to participate. | |
| Interventions | Postdischarge formula (energy content 74 kcal/100 mL, protein content 1.9 g/100 mL, calcium and phosphorus content 78 mg/100 mL and 46 mg/100 mL, respectively) (N = 67) or standard term formula (energy content 68 kcal/100 mL, protein content 1.5 g/100 mL) (N = 56). The intention was for the allocated formula to be the main milk source from hospital discharge until 12 months' corrected age. | |
| Outcomes | Growth parameters assessed at intervals until the end of the 12‐month study period | |
| Notes | Setting: multi‐centre ‐ 6 perinatal centres in North America | |
| Risk of bias | ||
| Bias | Authors' judgement | Support for judgement |
| Random sequence generation (selection bias) | Low risk | Method used to generate random sequence was not described. |
| Allocation concealment (selection bias) | Unclear risk | No information on randomisation method was provided. |
| Incomplete outcome data (attrition bias) | High risk | 31 of 67 in postdischarge formula group and 26 of 56 in standard term formula group left the study early (plus 2 other infants, who were randomised but did not take part in the study). Total loss of follow‐up for growth parameters assessed at 12 months was 60% in the intervention group and 52% in the control group. Infants exited the study early (without growth parameters measured) for a variety of reasons, including study non‐compliance (not defined or described), gastrointestinal upset and "illness unrelated to the study feedings" (not defined or described). |
| Blinding of participants and personnel (performance bias) | Low risk | Families and caregivers were unaware of which formula milk infants received. |
| Blinding of outcome assessment (detection bias) | Low risk | Outcome assessors were not aware of which formula milk infants received. |
| Methods | Randomised controlled trial | |
| Participants | 103 preterm infants (birth weight < 1750 g or gestation < 35 weeks). Only infants who were 'growing normally' (rate of weight gain > 25 g/kg/d) at the time of discharge were eligible to participate. | |
| Interventions | Preterm formula (energy content 80 kcal/100 mL, protein content 2.2 g/100 mL, calcium and phosphorus content 108 mg/100 mL and 54 mg/100 mL, respectively) (N = 49) or standard term formula (energy content 66 kcal/100 mL, protein content 1.4 g/100 mL) (N = 54) from hospital discharge until 6 months' corrected age | |
| Outcomes | Anthropometric and developmental parameters (including Bayley Scales of Infant Development II), measures of bone mineralisation | |
| Notes | Setting: Royal Victoria Hospital, Newcastle upon Tyne, UK Research supported by Nutricia (formula milk manufacturer) | |
| Risk of bias | ||
| Bias | Authors' judgement | Support for judgement |
| Random sequence generation (selection bias) | Low risk | Random sequence was centrally generated. |
| Allocation concealment (selection bias) | Low risk | Sealed opaque envelopes were used. |
| Incomplete outcome data (attrition bias) | Low risk | Follow‐up was near complete (> 80%). |
| Blinding of participants and personnel (performance bias) | Low risk | Families and caregivers were unaware of which formula milk infants received. |
| Blinding of outcome assessment (detection bias) | Low risk | Outcome assessors were not aware of which formula milk infants received. |
| Methods | Randomised controlled trial | |
| Participants | 33 formula milk‐fed preterm infants (birth weight < 1750 g or gestation < 35 weeks) | |
| Interventions | Postdischarge formula (energy content 74 kcal/100 mL, protein content 1.8 g/100 mL, calcium and phosphorus content 80 mg/100 mL and 40 mg/100 mL, respectively) (N = 16) or standard term formula (energy content 66 kcal/100 mL, protein content 1.4 g/100 mL) (N = 17) from hospital discharge until 2 months' corrected age | |
| Outcomes | Growth parameters and bone mineralisation measured by dual‐energy X‐ray absorptiometry at the end of the 2‐month study period | |
| Notes | Setting: Department of Pediatrics, University of Liege, Belgium | |
| Risk of bias | ||
| Bias | Authors' judgement | Support for judgement |
| Random sequence generation (selection bias) | Unclear risk | Method used to generate random sequence was not described. |
| Allocation concealment (selection bias) | Unclear risk | No information on randomisation method was provided. |
| Incomplete outcome data (attrition bias) | Low risk | Follow‐up was near complete (> 90%). |
| Blinding of participants and personnel (performance bias) | Low risk | Families and caregivers were unaware of which formula milk infants received. |
| Blinding of outcome assessment (detection bias) | Low risk | Outcome assessors were not aware of which formula milk infants received. |
| Methods | Randomised controlled trial | |
| Participants | 59 preterm very low birth weight infants | |
| Interventions | Preterm formula (energy content 80 kcal/100 mL, protein content 2.3 g/100 mL, calcium and phosphorus content 128 mg/100 mL and 64 mg/100 mL, respectively) (N = 34) or standard term formula (energy content 67 kcal/100 mL, protein content 1.6 g/100 mL) (N = 34) from hospital discharge until 3 months post term, then both groups continued with standard term formula until at least 6 months post term | |
| Outcomes | Growth parameters at 3‐monthly intervals until 18 months post term, Bayley Scales of Infant Development II at 18 months' corrected age | |
| Notes | Setting: multi‐centre trial in 4 hospitals in South Korea Research supported by Maeli Dairy Industry Co. Ltd. (formula milk manufacturer) Initially, 3 groups were randomly allocated to receive (1) standard term formula, (2) preterm formula for 3 months or (3) preterm formula for 6 months. However, results showed substantial and significant between‐group differences in baseline demographic characteristics, especially between group (3) and the other groups. Group (3) infants had statistically significantly lower birth weight and were more likely to be small for gestational age. We therefore chose to discard data from this arm and to restrict comparison of outcomes to group (1) vs group (3). | |
| Risk of bias | ||
| Bias | Authors' judgement | Support for judgement |
| Random sequence generation (selection bias) | Unclear risk | Method used to generate random sequence was not described. |
| Allocation concealment (selection bias) | Unclear risk | No information on randomisation method was provided. |
| Incomplete outcome data (attrition bias) | Low risk | Growth outcome data to 18 months were available for 30 (88%) intervention group and 29 (85%) control group infants. |
| Blinding of participants and personnel (performance bias) | High risk | Families and caregivers were likely to have been aware of which formula milk infants received. |
| Blinding of outcome assessment (detection bias) | Unclear risk | Outcome assessors may have been aware of which formula milk infants received. |
| Methods | Randomised controlled trial | |
| Participants | 89 preterm infants ready for hospital discharge (gestational age at birth < 35 weeks). Infants with major congenital malformation, previous gastrointestinal surgery or abnormal suck and swallow actions were not eligible to participate. | |
| Interventions | Nutrient‐enriched formula (energy content 74 kcal/100 mL, protein content 1.9 g/100 mL, calcium and phosphorus content 78 mg/100 mL and 46 mg/100 mL, respectively) (N = 44) or standard term formula (energy content 67 kcal/100 mL, protein content 1.5 g/100 mL) (N = 45). The intention was for the allocated formula to be fed ad libitum until 12 months after discharge. | |
| Outcomes | Growth parameters and bone mineral content at intervals until the end of the 12‐month study period | |
| Notes | Setting: Department of Pediatrics, Wayne State University, and Hutzel Hospital, Detroit, Michigan, USA Research supported by Ross Products Division, Abbott Laboratories (formula milk manufacturer) | |
| Risk of bias | ||
| Bias | Authors' judgement | Support for judgement |
| Random sequence generation (selection bias) | Unclear risk | Method used to generate random sequence was not described. |
| Allocation concealment (selection bias) | Low risk | Allocation was drawn from sequential sealed opaque envelopes. |
| Incomplete outcome data (attrition bias) | High risk | Growth outcome data to 12 months were available for 31 (70%) intervention group and 36 (80%) control group infants. |
| Blinding of participants and personnel (performance bias) | Low risk | Families and caregivers were unaware of which formula milk infants received. |
| Blinding of outcome assessment (detection bias) | Low risk | Outcome assessors were not aware of which formula milk infants received. |
| Methods | Randomised controlled trial | |
| Participants | 20 healthy very low birth weight infants at hospital discharge | |
| Interventions | Nutrient‐enriched formula (energy content 74 kcal/100 mL, protein content 1.9 g/100 mL) (N = 10) or standard term formula (energy content 67 kcal/100 mL, protein content 1.5 g/100 mL) (N = 10) after hospital discharge. Formula was intended to provide sole milk intake up to 6 months' corrected age. | |
| Outcomes | Weight, length, head circumference and measures of bone mineralisation at term and at 6 months' corrected age | |
| Notes | Setting: Meir General Hospital, Kfar‐saba, Israel | |
| Risk of bias | ||
| Bias | Authors' judgement | Support for judgement |
| Random sequence generation (selection bias) | Unclear risk | Method used to generate random sequence was not described. |
| Allocation concealment (selection bias) | Unclear risk | No information on randomisation method was provided. |
| Incomplete outcome data (attrition bias) | Low risk | Follow‐up was near complete (> 80%). |
| Blinding of participants and personnel (performance bias) | Unclear risk | No information was provided on whether families and caregivers were aware of which formula milk infants received. |
| Blinding of outcome assessment (detection bias) | Unclear risk | No information was provided on whether outcome assessors were aware of which formula milk infants received. |
| Methods | Randomised controlled trial | |
| Participants | 32 exclusively formula milk‐fed preterm infants, birth weight < 1850 g, weight < 3000 g at hospital discharge | |
| Interventions | Nutrient‐enriched formula (energy content 72 kcal/100 mL, protein content 1.8 g/100 mL, calcium and phosphorus content 70 mg/100 mL and 35 mg/100 mL, respectively) (N = 16) or standard term formula (energy content 68 kcal/100 mL, protein content 1.4 g/100 mL) (N = 16) after hospital discharge. Formula was intended to provide sole milk intake up to 9 months' corrected age. | |
| Outcomes | Measures of growth (weight, crown‐heel length and head circumference), feed tolerance, bone mineralisation during trial period | |
| Notes | Setting: Department of Paediatrics, Rosie Maternity Hospital, Cambridge Research supported by Farley Health Products (formula milk company) Data were presented graphically. We extracted numerical data (mean and SD) from the graphs to calculate mean differences. | |
| Risk of bias | ||
| Bias | Authors' judgement | Support for judgement |
| Random sequence generation (selection bias) | Unclear risk | Method used to generate random sequence was not described. |
| Allocation concealment (selection bias) | Unclear risk | No information on randomisation method was provided. |
| Incomplete outcome data (attrition bias) | Low risk | Follow‐up was near complete (1 infant from the standard term formula group was withdrawn). |
| Blinding of participants and personnel (performance bias) | Low risk | It is likely that families and caregivers were unaware of which formula milk infants received. |
| Blinding of outcome assessment (detection bias) | Low risk | It is likely that outcome assessors were unaware of which formula milk infants received. |
| Methods | Randomised controlled trial | |
| Participants | 229 formula milk‐fed preterm infants, birth weight < 1750 g, weight < 3000 g at hospital discharge | |
| Interventions | Nutrient‐enriched formula (energy content 72 kcal/100 mL, protein content 1.85 g/100 mL, calcium and phosphorus content 70 mg/100 mL and 35 mg/100 mL, respectively) (N = 113) or standard term formula (energy content 68 kcal/100 mL, protein content 1.5 g/100 mL) (N = 116) from hospital discharge until 9 months post term | |
| Outcomes | Growth parameters up to 18 months post term, neurodevelopment (Bayley Scales) at 18 months' corrected age | |
| Notes | Setting: 5 neonatal centres in the UK (1993‐1995) Research supported by Farley Health Products (formula milk company) | |
| Risk of bias | ||
| Bias | Authors' judgement | Support for judgement |
| Random sequence generation (selection bias) | Low risk | A member of the clinical team not involved in the trial prepared randomisation assignments. |
| Allocation concealment (selection bias) | Low risk | Allocation was drawn from sequential sealed opaque envelopes. |
| Incomplete outcome data (attrition bias) | Low risk | Growth and developmental outcomes were assessed in > 80% of participating infants. |
| Blinding of participants and personnel (performance bias) | Low risk | Families and caregivers were unaware of which formula milk infants received. |
| Blinding of outcome assessment (detection bias) | Low risk | Outcome assessors were unaware of which formula milk infants received. |
| Methods | Randomised controlled trial | |
| Participants | 34 preterm infants with gestational age of ≤ 35 weeks and birth weight ≤ 1850 g | |
| Interventions | Nutrient‐enriched formula (energy content 81 kcal/100 mL, protein content 2.40 g/100 mL, calcium and phosphorus content 95 mg/100 mL and 53 mg/100 mL, respectively) (N = 19) or standard term formula (energy content 67.6 kcal/100 mL, protein content 1.4 g/100 mL) (N = 15) from hospital‐discharge until 6 months' corrected age | |
| Outcomes | Measures of growth (weight, crown‐heel length and head circumference), feed tolerance, bone mineralisation during trial period | |
| Notes | Setting: Mackay Memorial Hospital, Taipei, Taiwan Research supported by Mead Johnson (formula milk company) No differences were found between the 2 groups in weight, length or head circumference at baseline or on follow‐up. Infants fed premature formula had higher blood urea nitrogen and phosphorus at 3 months' corrected age. Those on the premature formula also had higher energy intake at 1 month corrected age. | |
| Risk of bias | ||
| Bias | Authors' judgement | Support for judgement |
| Random sequence generation (selection bias) | Unclear risk | Method used to generate random sequence was not described. |
| Allocation concealment (selection bias) | Unclear risk | No information on randomisation method was provided. |
| Incomplete outcome data (attrition bias) | High risk | Growth outcome data to 6 months were available for 29 of the 40 infants initially enrolled (73%). |
| Blinding of participants and personnel (performance bias) | High risk | Families and caregivers were likely to have been aware of which formula milk infants received, as parents were not blinded to infant assignment. |
| Blinding of outcome assessment (detection bias) | High risk | Outcome assessors may have been aware of which formula milk infants received, as physicians were not blinded to infant assignment. |
| Methods | Randomised controlled trial | |
| Participants | 49 formula milk‐fed preterm infants, birth weight < 1750 g or gestation at birth < 33 weeks | |
| Interventions | Preterm formula (energy content 81 kcal/100 mL, protein content 2.3 g/100 mL, calcium and phosphorus content 100 mg/100 mL and 53 mg/100 mL, respectively) (N = 23) or standard term formula (energy content 67 kcal/100 mL, protein content 1.7 g/100 mL) (N = 26) from hospital discharge until 2 months post term | |
| Outcomes | Growth parameters and measures of bone mineralisation up to 4 months' corrected age | |
| Notes | Setting: 2 tertiary care neonatal units in France (2001‐2004) Research supported by Nestlé France (formula milk manufacturer) From 2 months post discharge, both groups received standard term formula milk. | |
| Risk of bias | ||
| Bias | Authors' judgement | Support for judgement |
| Random sequence generation (selection bias) | Low risk | Clinical trials unit was generated. |
| Allocation concealment (selection bias) | Low risk | Pharmacy was coded. |
| Incomplete outcome data (attrition bias) | High risk | Loss to follow‐up by 12 months in the control group was substantial (35%) and was greater than in the intervention group (9%). |
| Blinding of participants and personnel (performance bias) | Low risk | Families and caregivers were unaware of which formula milk infants received. |
| Blinding of outcome assessment (detection bias) | Low risk | Outcome assessors were unaware of which formula milk infants received. |
| Methods | Randomised controlled trial | |
| Participants | 123 formula fed preterm infants who were 'appropriate (birth weight) for gestational age' | |
| Interventions | Postdischarge formula (energy content 75 kcal/100 mL, protein content 2.0 g/100 mL, calcium and phosphorus content 100 mg/100 mL and 56 mg/100 mL, respectively) (N = 59) or standard term formula (energy content 67 kcal/100 mL, protein content 1.4 g/100 mL) (N = 64) from hospital discharge until 6 months' corrected age | |
| Outcomes | Growth parameters and fat mass up to (at least) 12 months' corrected age | |
| Notes | Trial was registered with Current Controlled Trials (http://www.controlledtrials.com/ISRCTN30189842). | |
| Risk of bias | ||
| Bias | Authors' judgement | Support for judgement |
| Random sequence generation (selection bias) | Low risk | Randomisation was performed by an independent investigator using computer‐generated randomisation lists. |
| Allocation concealment (selection bias) | Low risk | Randomisation was performed by an independent investigator using computer‐generated randomisation lists. |
| Incomplete outcome data (attrition bias) | Unclear risk | Follow‐up until 12 months post term was complete. |
| Blinding of participants and personnel (performance bias) | Unclear risk | No information was provided. |
| Blinding of outcome assessment (detection bias) | Unclear risk | No information was provided. |
| Methods | Randomised controlled trial | |
| Participants | 84 formula milk‐fed preterm infants born 'small for gestational age' (< 10th percentile) | |
| Interventions | Postdischarge formula (energy content 75 kcal/100 mL, protein content 2.0 g/100 mL, calcium and phosphorus content 100 mg/100 mL and 56 mg/100 mL, respectively) (N = 40) or standard term formula (energy content 67 kcal/100 mL, protein content 1.4 g/100 mL) (N = 44) from hospital discharge until 6 months' corrected age | |
| Outcomes | Growth parameters and fat mass up to 6 months' corrected age | |
| Notes | Setting: Neonatal Intensive Care Unit, Department of Maternal and Paediatric Sciences, Milan, Italy (2008‐2010) | |
| Risk of bias | ||
| Bias | Authors' judgement | Support for judgement |
| Random sequence generation (selection bias) | Unclear risk | No information was provided. |
| Allocation concealment (selection bias) | Unclear risk | No information was provided. |
| Incomplete outcome data (attrition bias) | Low risk | Follow‐up until 6 months post term was complete. |
| Blinding of participants and personnel (performance bias) | Unclear risk | No information was provided. |
| Blinding of outcome assessment (detection bias) | Unclear risk | No information was provided. |
| Methods | Randomised controlled trial | |
| Participants | 27 formula milk‐fed preterm infants, birth weight < 1500 g or gestation at birth < 33 weeks, 'small for gestational age' (< 10th percentile) | |
| Interventions | Postdischarge formula (energy content 75 kcal/100 mL, protein content 2.0 g/100 mL, calcium and phosphorus content 100 mg/100 mL and 56 mg/100 mL, respectively) (N = 14) or standard term formula (energy content 67 kcal/100 mL, protein content 1.4 g/100 mL) (N = 13) from hospital discharge until 1 month corrected age | |
| Outcomes | Growth parameters and fat mass up to 1 month corrected age | |
| Notes | Setting: 4 Italian neonatal units (2008‐2009) | |
| Risk of bias | ||
| Bias | Authors' judgement | Support for judgement |
| Random sequence generation (selection bias) | Low risk | Random sequence was pre‐prepared. |
| Allocation concealment (selection bias) | Unclear risk | No information was provided. |
| Incomplete outcome data (attrition bias) | Low risk | Follow‐up until 1 month post term was complete. |
| Blinding of participants and personnel (performance bias) | Unclear risk | No information was provided. |
| Blinding of outcome assessment (detection bias) | Unclear risk | No information was provided. |
PMA: postmenstrual age.
RCT: randomised controlled trial.
VLBW: very low birth weight.
Characteristics of excluded studies [ordered by study ID]
| Study | Reason for exclusion |
| The protein content of both formula milks was ≤ 1.7 g/100 mL. | |
| The energy content of both formula milks was < 70 kcal/100 mL. | |
| The protein content of both formula milks was ≤ 1.7 g/100 mL. | |
| Both formula milks were calorie‐enriched (90 kcal/100 mL). | |
| The energy content of both formula milks was < 70 kcal/100 mL. | |
| The energy content of both formula milks was < 70 kcal/100 mL. | |
| The energy content of both formula milks was < 70 kcal/100 mL. | |
| Both formula milks were calorie‐enriched (81 kcal/100 mL) and protein‐enriched (> 2.0 g/100 mL). | |
| The energy content of both formula milks was < 70 kcal/100 mL. |
Characteristics of studies awaiting assessment [ordered by study ID]
| Methods | Randomised controlled trial |
| Participants | Preterm infants who had postconceptional age 35 to 36 weeks and weight 1.8 to 3 kg at hospital discharge |
| Interventions | Postdischarge formula vs high‐energy, high‐protein, medium‐chain triglyceride‐containing formula |
| Outcomes | Growth rate at days 28, 56 and 84 after hospital discharge |
| Notes | Abstract only; full‐text article not available (study authors contacted September 2016) |
Data and analyses
| Outcome or subgroup title | No. of studies | No. of participants | Statistical method | Effect size |
| 1 Growth rates during trial period Show forest plot | 1 | Mean Difference (IV, Fixed, 95% CI) | Subtotals only | |
| Analysis 1.1  Comparison 1 Postdischarge formula versus standard term formula, Outcome 1 Growth rates during trial period. | ||||
| 1.1 Weight gain (g/kg/d) | 1 | 33 | Mean Difference (IV, Fixed, 95% CI) | 0.0 [‐1.37, 1.37] |
| 1.2 Linear growth (mm/wk) | 1 | 33 | Mean Difference (IV, Fixed, 95% CI) | 0.0 [‐1.07, 1.07] |
| 1.3 Head circumference (mm/wk) | 1 | 33 | Mean Difference (IV, Fixed, 95% CI) | 0.0 [‐0.68, 0.68] |
| 2 Weight (grams) Show forest plot | 7 | Mean Difference (IV, Fixed, 95% CI) | Subtotals only | |
| Analysis 1.2 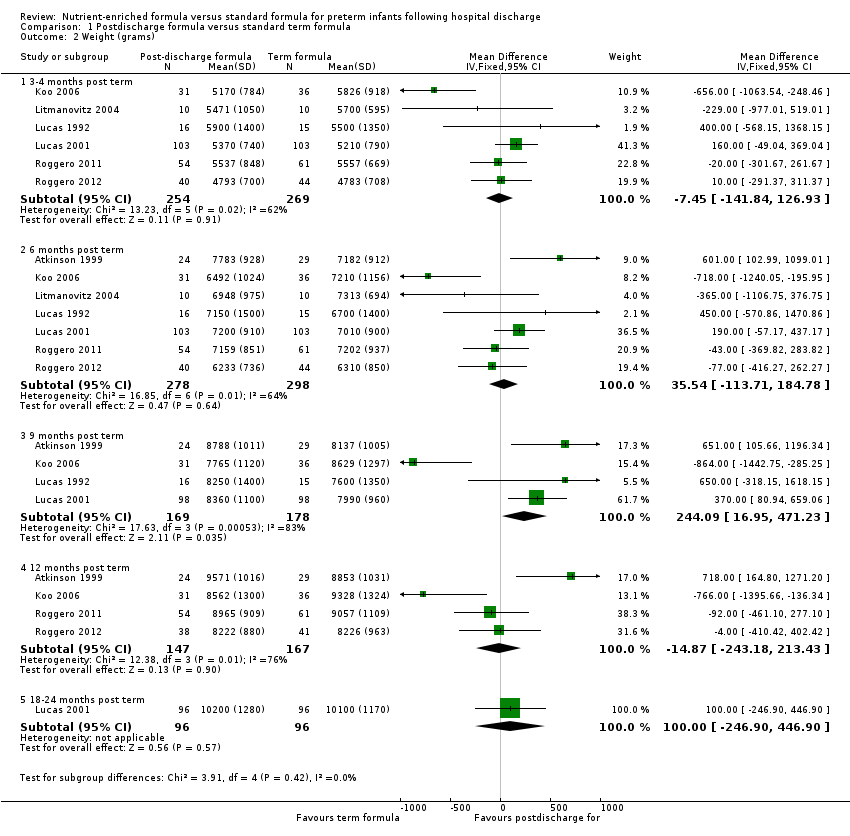 Comparison 1 Postdischarge formula versus standard term formula, Outcome 2 Weight (grams). | ||||
| 2.1 3‐4 months post term | 6 | 523 | Mean Difference (IV, Fixed, 95% CI) | ‐7.45 [‐141.84, 126.93] |
| 2.2 6 months post term | 7 | 576 | Mean Difference (IV, Fixed, 95% CI) | 35.54 [‐113.71, 184.78] |
| 2.3 9 months post term | 4 | 347 | Mean Difference (IV, Fixed, 95% CI) | 244.09 [16.95, 471.23] |
| 2.4 12 months post term | 4 | 314 | Mean Difference (IV, Fixed, 95% CI) | ‐14.87 [‐243.18, 213.43] |
| 2.5 18‐24 months post term | 1 | 192 | Mean Difference (IV, Fixed, 95% CI) | 100.0 [‐246.90, 446.90] |
| 3 Crown‐heel length (mm) Show forest plot | 7 | Mean Difference (IV, Fixed, 95% CI) | Subtotals only | |
| Analysis 1.3  Comparison 1 Postdischarge formula versus standard term formula, Outcome 3 Crown‐heel length (mm). | ||||
| 3.1 3‐4 months post term | 6 | 523 | Mean Difference (IV, Fixed, 95% CI) | 2.45 [‐2.01, 6.90] |
| 3.2 6 months post term | 7 | 576 | Mean Difference (IV, Fixed, 95% CI) | 2.12 [‐2.16, 6.41] |
| 3.3 9 months post term | 4 | 347 | Mean Difference (IV, Fixed, 95% CI) | 7.33 [1.80, 12.87] |
| 3.4 12 months post term | 4 | 314 | Mean Difference (IV, Fixed, 95% CI) | ‐0.66 [‐6.43, 5.10] |
| 3.5 18‐24 months post term | 1 | 192 | Mean Difference (IV, Fixed, 95% CI) | 9.0 [0.32, 17.68] |
| 4 Head circumference (mm) Show forest plot | 7 | Mean Difference (IV, Fixed, 95% CI) | Subtotals only | |
| Analysis 1.4  Comparison 1 Postdischarge formula versus standard term formula, Outcome 4 Head circumference (mm). | ||||
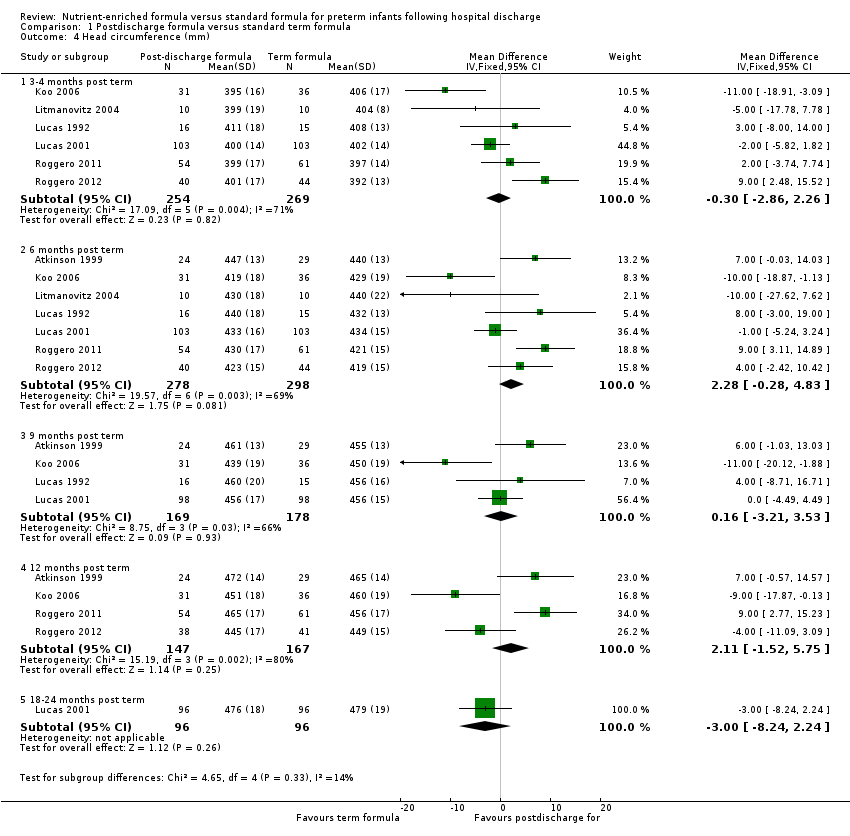
| 4.1 3‐4 months post term | 6 | 523 | Mean Difference (IV, Fixed, 95% CI) | ‐0.30 [‐2.86, 2.26] |
| 4.2 6 months post term | 7 | 576 | Mean Difference (IV, Fixed, 95% CI) | 2.28 [‐0.28, 4.83] |
| 4.3 9 months post term | 4 | 347 | Mean Difference (IV, Fixed, 95% CI) | 0.16 [‐3.21, 3.53] |
| 4.4 12 months post term | 4 | 314 | Mean Difference (IV, Fixed, 95% CI) | 2.11 [‐1.52, 5.75] |
| 4.5 18‐24 months post term | 1 | 192 | Mean Difference (IV, Fixed, 95% CI) | ‐3.0 [‐8.24, 2.24] |
| 5 Development Show forest plot | 1 | Mean Difference (IV, Fixed, 95% CI) | Subtotals only | |
| Analysis 1.5  Comparison 1 Postdischarge formula versus standard term formula, Outcome 5 Development. | ||||
| 5.1 Bayley Scales of Infant Development II: Mental Development Index | 1 | 184 | Mean Difference (IV, Fixed, 95% CI) | 0.90 [‐3.24, 5.04] |
| 5.2 Bayley Scales of Infant Development II: Psychomotor Development Index | 1 | 184 | Mean Difference (IV, Fixed, 95% CI) | 2.70 [‐1.28, 6.68] |
| 6 Bone mineralisation Show forest plot | 3 | Mean Difference (IV, Fixed, 95% CI) | Subtotals only | |
| Analysis 1.6 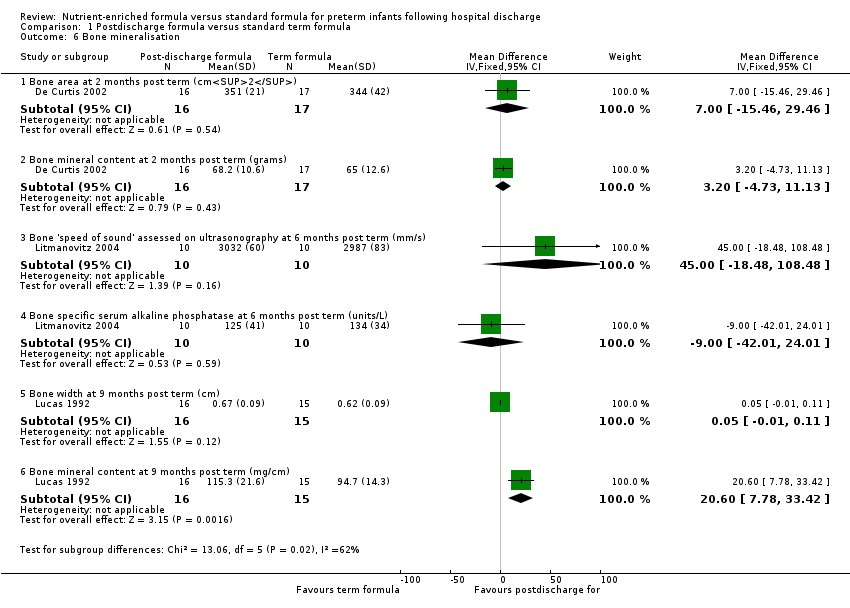 Comparison 1 Postdischarge formula versus standard term formula, Outcome 6 Bone mineralisation. | ||||
| 6.1 Bone area at 2 months post term (cm2) | 1 | 33 | Mean Difference (IV, Fixed, 95% CI) | 7.0 [‐15.46, 29.46] |
| 6.2 Bone mineral content at 2 months post term (grams) | 1 | 33 | Mean Difference (IV, Fixed, 95% CI) | 3.20 [‐4.73, 11.13] |
| 6.3 Bone 'speed of sound' assessed on ultrasonography at 6 months post term (mm/s) | 1 | 20 | Mean Difference (IV, Fixed, 95% CI) | 45.0 [‐18.48, 108.48] |
| 6.4 Bone specific serum alkaline phosphatase at 6 months post term (units/L) | 1 | 20 | Mean Difference (IV, Fixed, 95% CI) | ‐9.0 [‐42.01, 24.01] |
| 6.5 Bone width at 9 months post term (cm) | 1 | 31 | Mean Difference (IV, Fixed, 95% CI) | 0.05 [‐0.01, 0.11] |
| 6.6 Bone mineral content at 9 months post term (mg/cm) | 1 | 31 | Mean Difference (IV, Fixed, 95% CI) | 20.60 [7.78, 33.42] |
| Outcome or subgroup title | No. of studies | No. of participants | Statistical method | Effect size |
| 1 Growth rates during trial period Show forest plot | 1 | Mean Difference (IV, Fixed, 95% CI) | Subtotals only | |
| Analysis 2.1 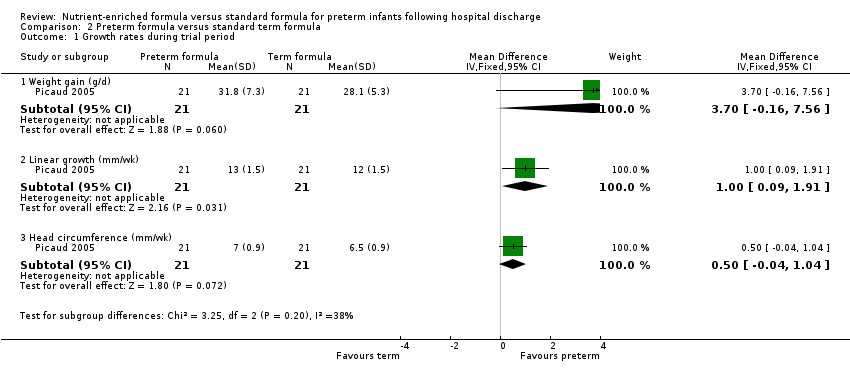 Comparison 2 Preterm formula versus standard term formula, Outcome 1 Growth rates during trial period. | ||||
| 1.1 Weight gain (g/d) | 1 | 42 | Mean Difference (IV, Fixed, 95% CI) | 3.70 [‐0.16, 7.56] |
| 1.2 Linear growth (mm/wk) | 1 | 42 | Mean Difference (IV, Fixed, 95% CI) | 1.0 [0.09, 1.91] |
| 1.3 Head circumference (mm/wk) | 1 | 42 | Mean Difference (IV, Fixed, 95% CI) | 0.5 [‐0.04, 1.04] |
| 2 Weight (grams) Show forest plot | 5 | Mean Difference (IV, Fixed, 95% CI) | Subtotals only | |
| Analysis 2.2  Comparison 2 Preterm formula versus standard term formula, Outcome 2 Weight (grams). | ||||
| 2.1 3‐4 months post term | 3 | 130 | Mean Difference (IV, Fixed, 95% CI) | 74.41 [‐267.10, 415.93] |
| 2.2 6 months post term | 4 | 273 | Mean Difference (IV, Fixed, 95% CI) | 74.60 [‐164.73, 313.92] |
| 2.3 9 months post term | 1 | 59 | Mean Difference (IV, Fixed, 95% CI) | 112.0 [‐482.69, 706.69] |
| 2.4 12 months post term | 4 | 265 | Mean Difference (IV, Fixed, 95% CI) | 539.48 [255.03, 823.92] |
| 2.5 18 months post term | 2 | 162 | Mean Difference (IV, Fixed, 95% CI) | 490.81 [142.19, 839.44] |
| 3 Crown‐heel length (mm) Show forest plot | 5 | Mean Difference (IV, Fixed, 95% CI) | Subtotals only | |
| Analysis 2.3  Comparison 2 Preterm formula versus standard term formula, Outcome 3 Crown‐heel length (mm). | ||||
| 3.1 3‐4 months post term | 3 | 130 | Mean Difference (IV, Fixed, 95% CI) | ‐2.27 [‐13.09, 8.56] |
| 3.2 6 months post term | 3 | 160 | Mean Difference (IV, Fixed, 95% CI) | 1.83 [‐6.25, 9.92] |
| 3.3 9 months post term | 1 | 59 | Mean Difference (IV, Fixed, 95% CI) | ‐3.0 [‐17.03, 11.03] |
| 3.4 12 months post term | 3 | 152 | Mean Difference (IV, Fixed, 95% CI) | 5.13 [‐4.23, 14.49] |
| 3.5 18 months post term | 2 | 162 | Mean Difference (IV, Fixed, 95% CI) | 11.00 [1.89, 20.11] |
| 4 Head circumference (mm) Show forest plot | 5 | Mean Difference (IV, Fixed, 95% CI) | Subtotals only | |
| Analysis 2.4  Comparison 2 Preterm formula versus standard term formula, Outcome 4 Head circumference (mm). | ||||
| 4.1 3‐4 months post term | 3 | 130 | Mean Difference (IV, Fixed, 95% CI) | 3.61 [‐2.09, 9.31] |
| 4.2 6 months post term | 3 | 160 | Mean Difference (IV, Fixed, 95% CI) | 5.82 [1.32, 10.32] |
| 4.3 9 months post term | 1 | 59 | Mean Difference (IV, Fixed, 95% CI) | 8.0 [0.85, 15.15] |
| 4.4 12 months post term | 3 | 152 | Mean Difference (IV, Fixed, 95% CI) | 6.07 [1.07, 11.06] |
| 4.5 18 months post term | 2 | 162 | Mean Difference (IV, Fixed, 95% CI) | 5.42 [0.69, 10.14] |
| 5 Development Show forest plot | 2 | Mean Difference (IV, Fixed, 95% CI) | Subtotals only | |
| Analysis 2.5 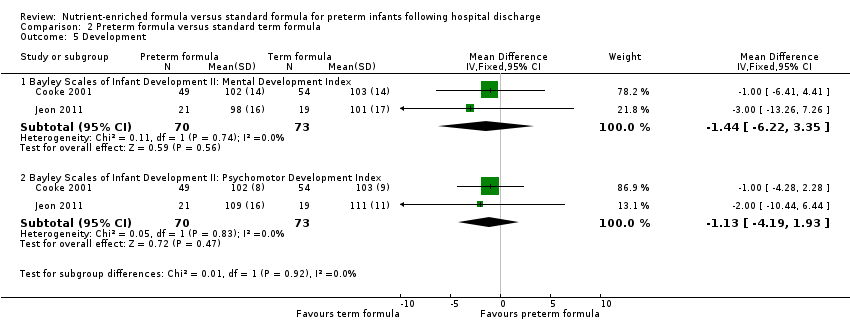 Comparison 2 Preterm formula versus standard term formula, Outcome 5 Development. | ||||
| 5.1 Bayley Scales of Infant Development II: Mental Development Index | 2 | 143 | Mean Difference (IV, Fixed, 95% CI) | ‐1.44 [‐6.22, 3.35] |
| 5.2 Bayley Scales of Infant Development II: Psychomotor Development Index | 2 | 143 | Mean Difference (IV, Fixed, 95% CI) | ‐1.13 [‐4.19, 1.93] |

Study flow diagram: review update.
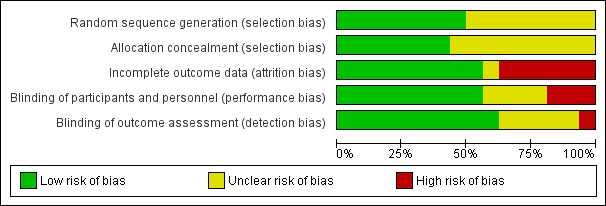
Risk of bias graph: review authors' judgements about each risk of bias item presented as percentages across all included studies.

Forest plot of comparison: 1 Postdischarge formula versus standard term formula, outcome: 1.2 Weight (grams).
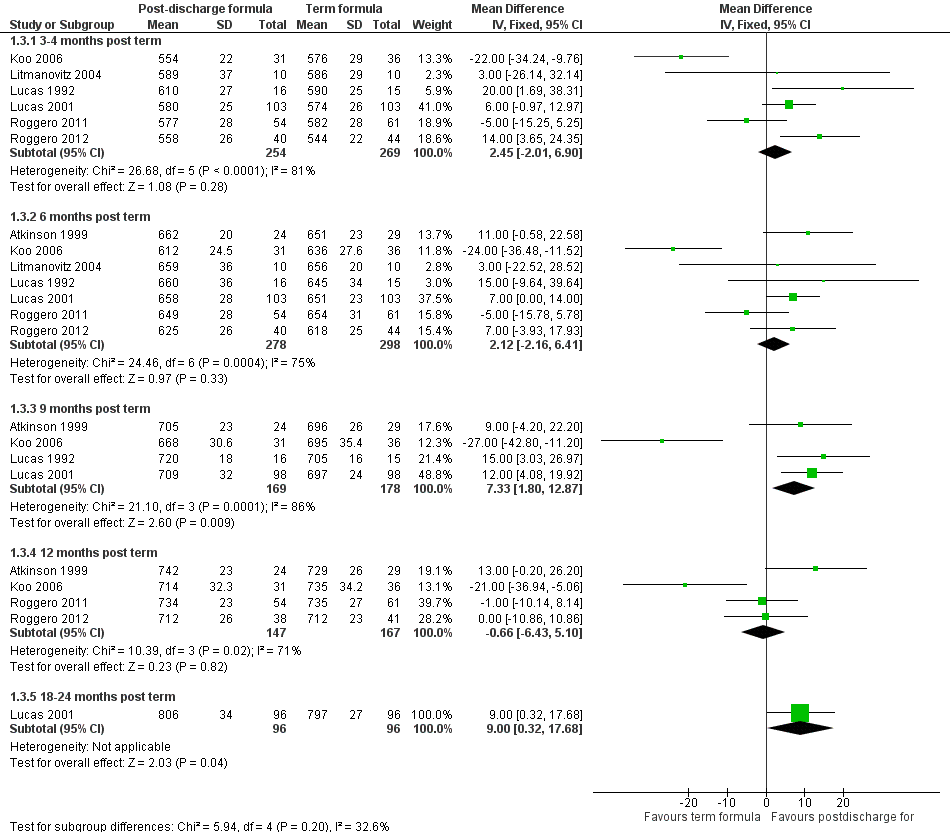
Forest plot of comparison: 1 Postdischarge formula versus standard term formula, outcome: 1.3 Crown‐heel length (mm).

Forest plot of comparison: 1 Postdischarge formula versus standard term formula, outcome: 1.4 Head circumference (mm).

Forest plot of comparison: 2 Preterm formula versus standard term formula, outcome: 2.2 Weight (grams).

Forest plot of comparison: 2 Preterm formula versus standard term formula, outcome: 2.3 Crown‐heel length (mm).

Forest plot of comparison: 2 Preterm formula versus standard term formula, outcome: 2.4 Head circumference (mm).
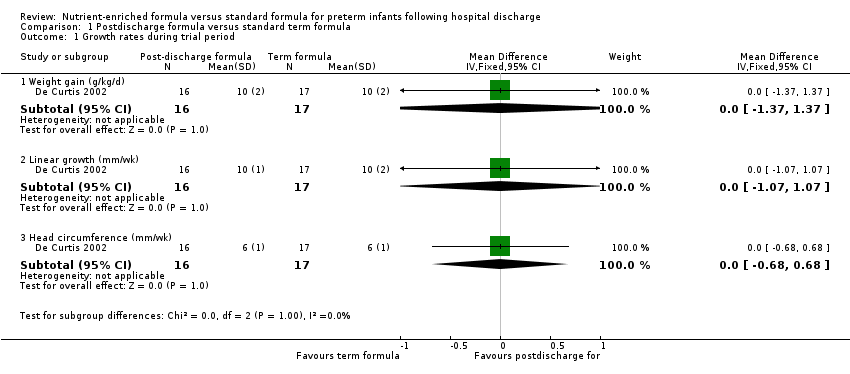
Comparison 1 Postdischarge formula versus standard term formula, Outcome 1 Growth rates during trial period.

Comparison 1 Postdischarge formula versus standard term formula, Outcome 2 Weight (grams).

Comparison 1 Postdischarge formula versus standard term formula, Outcome 3 Crown‐heel length (mm).
Comparison 1 Postdischarge formula versus standard term formula, Outcome 4 Head circumference (mm).

Comparison 1 Postdischarge formula versus standard term formula, Outcome 5 Development.

Comparison 1 Postdischarge formula versus standard term formula, Outcome 6 Bone mineralisation.

Comparison 2 Preterm formula versus standard term formula, Outcome 1 Growth rates during trial period.

Comparison 2 Preterm formula versus standard term formula, Outcome 2 Weight (grams).

Comparison 2 Preterm formula versus standard term formula, Outcome 3 Crown‐heel length (mm).

Comparison 2 Preterm formula versus standard term formula, Outcome 4 Head circumference (mm).

Comparison 2 Preterm formula versus standard term formula, Outcome 5 Development.
| Postdischarge formula compared with standard term formula for preterm infants after hospital discharge | ||||
| Patient or population: preterm infants after hospital discharge | ||||
| Outcomes | Anticipated absolute effects* (95% CI) | Number of participants | Quality of the evidence | Comments |
| Postdischarge formula vs standard term formula | ||||
| Weight (grams) 3‐4 months post term | MD 7.45 g lower | 523 | ⊕⊕⊕⊝ | Downgraded for moderate inconsistency (I² = 62%) |
| Weight (grams) 6 months post term | MD 35.54 g higher | 576 | ⊕⊕⊕⊝ | Downgraded for inconsistency moderate (I² = 64%). |
| Crown‐heel length (mm) 3‐4 months post term | MD 2.45 mm higher | 523 | ⊕⊕⊕⊝ | Downgraded for high inconsistency (I² = 81%) |
| Crown‐heel length (mm) 6 months post term | MD 2.12 mm higher | 576 | ⊕⊕⊕⊝ | Downgraded for moderate inconsistency (I² = 75%) |
| Head circumference (mm) 3‐4 months post term | MD 0.3 mm lower | 523 | ⊕⊕⊕⊝ | Downgraded for moderate inconsistency (I² = 71%) |
| Head circumference (mm) 6 months post term | MD 2.28 mm higher | 576 | ⊕⊕⊕⊝ | Downgraded for moderate inconsistency (I² = 69%) |
| Development ‐ Bayley Scales of Infant Development II: Mental Development Index | MD 0.9 higher | 184 | ⊕⊕⊕⊕ | |
| Preterm formula compared with standard term formula for preterm infants after hospital discharge | ||||
| Patient or population: preterm infants after hospital discharge | ||||
| Outcomes | Anticipated absolute effects* (95% CI) | Number of participants | Quality of the evidence | Comments |
| Preterm formula vs standard term formula | ||||
| Weight (grams) 3‐4 months post term | MD 74.41 g higher | 130 | ⊕⊕⊕⊝ | Downgraded for imprecision |
| Weight (grams) 6 months post term | MD 74.6 g higher | 273 | ⊕⊕⊕⊝ | Downgraded for imprecision |
| Crown‐heel length (mm) 3‐4 months post term | MD 2.27 mm lower | 130 | ⊕⊕⊕⊝ | Downgraded for imprecision |
| Crown‐heel length (mm) 6 months post term | MD 1.83 mm higher | 160 | ⊕⊕⊕⊝ | Downgraded for imprecision |
| Head circumference (mm) 3‐4 months post term | MD 3.61 mm higher | 130 | ⊕⊕⊕⊝ | Downgraded for imprecision |
| Head circumference (mm) 6 months post term | MD 5.82 mm higher | 160 | ⊕⊕⊕⊝ | Downgraded for imprecision |
| Development ‐ Bayley Scales of Infant Development II: Mental Development Index | MD 1.44 lower | 143 | ⊕⊕⊕⊕ | |
| Outcome or subgroup title | No. of studies | No. of participants | Statistical method | Effect size |
| 1 Growth rates during trial period Show forest plot | 1 | Mean Difference (IV, Fixed, 95% CI) | Subtotals only | |
| 1.1 Weight gain (g/kg/d) | 1 | 33 | Mean Difference (IV, Fixed, 95% CI) | 0.0 [‐1.37, 1.37] |
| 1.2 Linear growth (mm/wk) | 1 | 33 | Mean Difference (IV, Fixed, 95% CI) | 0.0 [‐1.07, 1.07] |
| 1.3 Head circumference (mm/wk) | 1 | 33 | Mean Difference (IV, Fixed, 95% CI) | 0.0 [‐0.68, 0.68] |
| 2 Weight (grams) Show forest plot | 7 | Mean Difference (IV, Fixed, 95% CI) | Subtotals only | |
| 2.1 3‐4 months post term | 6 | 523 | Mean Difference (IV, Fixed, 95% CI) | ‐7.45 [‐141.84, 126.93] |
| 2.2 6 months post term | 7 | 576 | Mean Difference (IV, Fixed, 95% CI) | 35.54 [‐113.71, 184.78] |
| 2.3 9 months post term | 4 | 347 | Mean Difference (IV, Fixed, 95% CI) | 244.09 [16.95, 471.23] |
| 2.4 12 months post term | 4 | 314 | Mean Difference (IV, Fixed, 95% CI) | ‐14.87 [‐243.18, 213.43] |
| 2.5 18‐24 months post term | 1 | 192 | Mean Difference (IV, Fixed, 95% CI) | 100.0 [‐246.90, 446.90] |
| 3 Crown‐heel length (mm) Show forest plot | 7 | Mean Difference (IV, Fixed, 95% CI) | Subtotals only | |
| 3.1 3‐4 months post term | 6 | 523 | Mean Difference (IV, Fixed, 95% CI) | 2.45 [‐2.01, 6.90] |
| 3.2 6 months post term | 7 | 576 | Mean Difference (IV, Fixed, 95% CI) | 2.12 [‐2.16, 6.41] |
| 3.3 9 months post term | 4 | 347 | Mean Difference (IV, Fixed, 95% CI) | 7.33 [1.80, 12.87] |
| 3.4 12 months post term | 4 | 314 | Mean Difference (IV, Fixed, 95% CI) | ‐0.66 [‐6.43, 5.10] |
| 3.5 18‐24 months post term | 1 | 192 | Mean Difference (IV, Fixed, 95% CI) | 9.0 [0.32, 17.68] |
| 4 Head circumference (mm) Show forest plot | 7 | Mean Difference (IV, Fixed, 95% CI) | Subtotals only | |
| 4.1 3‐4 months post term | 6 | 523 | Mean Difference (IV, Fixed, 95% CI) | ‐0.30 [‐2.86, 2.26] |
| 4.2 6 months post term | 7 | 576 | Mean Difference (IV, Fixed, 95% CI) | 2.28 [‐0.28, 4.83] |
| 4.3 9 months post term | 4 | 347 | Mean Difference (IV, Fixed, 95% CI) | 0.16 [‐3.21, 3.53] |
| 4.4 12 months post term | 4 | 314 | Mean Difference (IV, Fixed, 95% CI) | 2.11 [‐1.52, 5.75] |
| 4.5 18‐24 months post term | 1 | 192 | Mean Difference (IV, Fixed, 95% CI) | ‐3.0 [‐8.24, 2.24] |
| 5 Development Show forest plot | 1 | Mean Difference (IV, Fixed, 95% CI) | Subtotals only | |
| 5.1 Bayley Scales of Infant Development II: Mental Development Index | 1 | 184 | Mean Difference (IV, Fixed, 95% CI) | 0.90 [‐3.24, 5.04] |
| 5.2 Bayley Scales of Infant Development II: Psychomotor Development Index | 1 | 184 | Mean Difference (IV, Fixed, 95% CI) | 2.70 [‐1.28, 6.68] |
| 6 Bone mineralisation Show forest plot | 3 | Mean Difference (IV, Fixed, 95% CI) | Subtotals only | |
| 6.1 Bone area at 2 months post term (cm2) | 1 | 33 | Mean Difference (IV, Fixed, 95% CI) | 7.0 [‐15.46, 29.46] |
| 6.2 Bone mineral content at 2 months post term (grams) | 1 | 33 | Mean Difference (IV, Fixed, 95% CI) | 3.20 [‐4.73, 11.13] |
| 6.3 Bone 'speed of sound' assessed on ultrasonography at 6 months post term (mm/s) | 1 | 20 | Mean Difference (IV, Fixed, 95% CI) | 45.0 [‐18.48, 108.48] |
| 6.4 Bone specific serum alkaline phosphatase at 6 months post term (units/L) | 1 | 20 | Mean Difference (IV, Fixed, 95% CI) | ‐9.0 [‐42.01, 24.01] |
| 6.5 Bone width at 9 months post term (cm) | 1 | 31 | Mean Difference (IV, Fixed, 95% CI) | 0.05 [‐0.01, 0.11] |
| 6.6 Bone mineral content at 9 months post term (mg/cm) | 1 | 31 | Mean Difference (IV, Fixed, 95% CI) | 20.60 [7.78, 33.42] |
| Outcome or subgroup title | No. of studies | No. of participants | Statistical method | Effect size |
| 1 Growth rates during trial period Show forest plot | 1 | Mean Difference (IV, Fixed, 95% CI) | Subtotals only | |
| 1.1 Weight gain (g/d) | 1 | 42 | Mean Difference (IV, Fixed, 95% CI) | 3.70 [‐0.16, 7.56] |
| 1.2 Linear growth (mm/wk) | 1 | 42 | Mean Difference (IV, Fixed, 95% CI) | 1.0 [0.09, 1.91] |
| 1.3 Head circumference (mm/wk) | 1 | 42 | Mean Difference (IV, Fixed, 95% CI) | 0.5 [‐0.04, 1.04] |
| 2 Weight (grams) Show forest plot | 5 | Mean Difference (IV, Fixed, 95% CI) | Subtotals only | |
| 2.1 3‐4 months post term | 3 | 130 | Mean Difference (IV, Fixed, 95% CI) | 74.41 [‐267.10, 415.93] |
| 2.2 6 months post term | 4 | 273 | Mean Difference (IV, Fixed, 95% CI) | 74.60 [‐164.73, 313.92] |
| 2.3 9 months post term | 1 | 59 | Mean Difference (IV, Fixed, 95% CI) | 112.0 [‐482.69, 706.69] |
| 2.4 12 months post term | 4 | 265 | Mean Difference (IV, Fixed, 95% CI) | 539.48 [255.03, 823.92] |
| 2.5 18 months post term | 2 | 162 | Mean Difference (IV, Fixed, 95% CI) | 490.81 [142.19, 839.44] |
| 3 Crown‐heel length (mm) Show forest plot | 5 | Mean Difference (IV, Fixed, 95% CI) | Subtotals only | |
| 3.1 3‐4 months post term | 3 | 130 | Mean Difference (IV, Fixed, 95% CI) | ‐2.27 [‐13.09, 8.56] |
| 3.2 6 months post term | 3 | 160 | Mean Difference (IV, Fixed, 95% CI) | 1.83 [‐6.25, 9.92] |
| 3.3 9 months post term | 1 | 59 | Mean Difference (IV, Fixed, 95% CI) | ‐3.0 [‐17.03, 11.03] |
| 3.4 12 months post term | 3 | 152 | Mean Difference (IV, Fixed, 95% CI) | 5.13 [‐4.23, 14.49] |
| 3.5 18 months post term | 2 | 162 | Mean Difference (IV, Fixed, 95% CI) | 11.00 [1.89, 20.11] |
| 4 Head circumference (mm) Show forest plot | 5 | Mean Difference (IV, Fixed, 95% CI) | Subtotals only | |
| 4.1 3‐4 months post term | 3 | 130 | Mean Difference (IV, Fixed, 95% CI) | 3.61 [‐2.09, 9.31] |
| 4.2 6 months post term | 3 | 160 | Mean Difference (IV, Fixed, 95% CI) | 5.82 [1.32, 10.32] |
| 4.3 9 months post term | 1 | 59 | Mean Difference (IV, Fixed, 95% CI) | 8.0 [0.85, 15.15] |
| 4.4 12 months post term | 3 | 152 | Mean Difference (IV, Fixed, 95% CI) | 6.07 [1.07, 11.06] |
| 4.5 18 months post term | 2 | 162 | Mean Difference (IV, Fixed, 95% CI) | 5.42 [0.69, 10.14] |
| 5 Development Show forest plot | 2 | Mean Difference (IV, Fixed, 95% CI) | Subtotals only | |
| 5.1 Bayley Scales of Infant Development II: Mental Development Index | 2 | 143 | Mean Difference (IV, Fixed, 95% CI) | ‐1.44 [‐6.22, 3.35] |
| 5.2 Bayley Scales of Infant Development II: Psychomotor Development Index | 2 | 143 | Mean Difference (IV, Fixed, 95% CI) | ‐1.13 [‐4.19, 1.93] |