| 1 Reduction in general psychiatric symptoms: short‐term Show forest plot | 13 | 816 | Std. Mean Difference (IV, Random, 95% CI) | ‐0.71 [‐1.43, 0.00] |
|
| 1.1 anxiety disorders | 1 | 46 | Std. Mean Difference (IV, Random, 95% CI) | ‐0.37 [‐0.96, 0.21] |
| 1.2 depressive disorders | 0 | 0 | Std. Mean Difference (IV, Random, 95% CI) | 0.0 [0.0, 0.0] |
| 1.3 somatoform disorders | 4 | 311 | Std. Mean Difference (IV, Random, 95% CI) | ‐0.57 [‐3.03, 1.89] |
| 1.4 mixed disorders | 6 | 381 | Std. Mean Difference (IV, Random, 95% CI) | ‐0.56 [‐0.90, ‐0.21] |
| 1.5 personality disorders | 2 | 78 | Std. Mean Difference (IV, Random, 95% CI) | ‐1.32 [‐1.81, ‐0.82] |
| 2 Reduction in general psychiatric symptoms: medium‐term Show forest plot | 2 | 101 | Std. Mean Difference (IV, Random, 95% CI) | ‐0.62 [‐1.02, ‐0.22] |
|
| 2.1 anxiety disorders | 0 | 0 | Std. Mean Difference (IV, Random, 95% CI) | 0.0 [0.0, 0.0] |
| 2.2 depressive disorders | 0 | 0 | Std. Mean Difference (IV, Random, 95% CI) | 0.0 [0.0, 0.0] |
| 2.3 somatoform disorders | 1 | 40 | Std. Mean Difference (IV, Random, 95% CI) | ‐0.81 [‐1.45, ‐0.16] |
| 2.4 mixed disorders | 1 | 61 | Std. Mean Difference (IV, Random, 95% CI) | ‐0.50 [‐1.01, 0.01] |
| 2.5 personality disorders | 0 | 0 | Std. Mean Difference (IV, Random, 95% CI) | 0.0 [0.0, 0.0] |
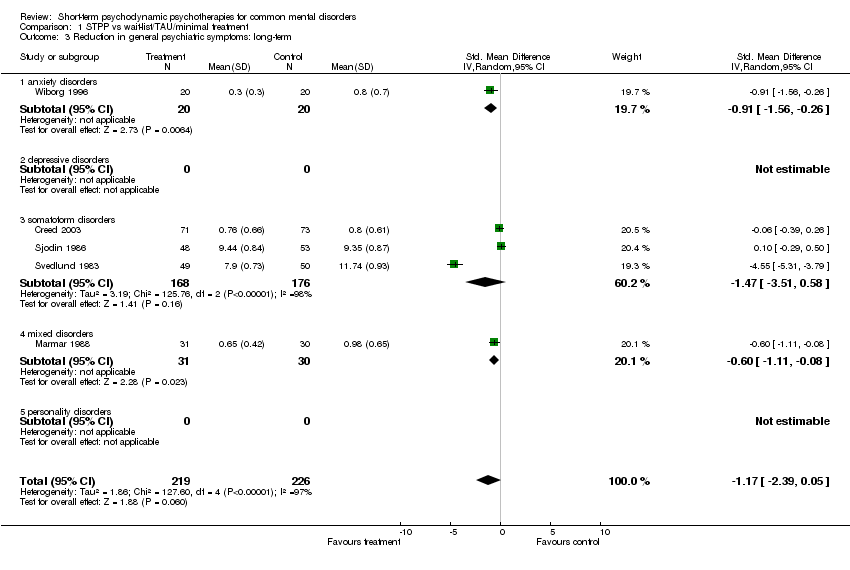
| 3 Reduction in general psychiatric symptoms: long‐term Show forest plot | 5 | 445 | Std. Mean Difference (IV, Random, 95% CI) | ‐1.17 [‐2.39, 0.05] |
|
| 3.1 anxiety disorders | 1 | 40 | Std. Mean Difference (IV, Random, 95% CI) | ‐0.91 [‐1.56, ‐0.26] |
| 3.2 depressive disorders | 0 | 0 | Std. Mean Difference (IV, Random, 95% CI) | 0.0 [0.0, 0.0] |
| 3.3 somatoform disorders | 3 | 344 | Std. Mean Difference (IV, Random, 95% CI) | ‐1.47 [‐3.51, 0.58] |
| 3.4 mixed disorders | 1 | 61 | Std. Mean Difference (IV, Random, 95% CI) | ‐0.60 [‐1.11, ‐0.08] |
| 3.5 personality disorders | 0 | 0 | Std. Mean Difference (IV, Random, 95% CI) | 0.0 [0.0, 0.0] |
| 4 Reduction in somatic symptoms: short‐term Show forest plot | 7 | 537 | Std. Mean Difference (IV, Random, 95% CI) | ‐0.86 [‐1.69, ‐0.02] |
|
| 4.1 anxiety disorders | 1 | 46 | Std. Mean Difference (IV, Random, 95% CI) | ‐0.34 [‐0.92, 0.25] |
| 4.2 depressive disorders | 0 | 0 | Std. Mean Difference (IV, Random, 95% CI) | 0.0 [0.0, 0.0] |
| 4.3 somatoform disorders | 6 | 491 | Std. Mean Difference (IV, Random, 95% CI) | ‐0.95 [‐1.91, 0.02] |
| 4.4 mixed disorders | 0 | 0 | Std. Mean Difference (IV, Random, 95% CI) | 0.0 [0.0, 0.0] |
| 4.5 personality disorders | 0 | 0 | Std. Mean Difference (IV, Random, 95% CI) | 0.0 [0.0, 0.0] |
| 5 Reduction in somatic symptoms: medium‐term Show forest plot | 2 | 72 | Std. Mean Difference (IV, Random, 95% CI) | ‐0.87 [‐1.37, ‐0.38] |
|
| 5.1 anxiety disorders | 0 | 0 | Std. Mean Difference (IV, Random, 95% CI) | 0.0 [0.0, 0.0] |
| 5.2 depressive disorders | 0 | 0 | Std. Mean Difference (IV, Random, 95% CI) | 0.0 [0.0, 0.0] |
| 5.3 somatoform disorders | 2 | 72 | Std. Mean Difference (IV, Random, 95% CI) | ‐0.87 [‐1.37, ‐0.38] |
| 5.4 mixed disorders | 0 | 0 | Std. Mean Difference (IV, Random, 95% CI) | 0.0 [0.0, 0.0] |
| 5.5 personality disorders | 0 | 0 | Std. Mean Difference (IV, Random, 95% CI) | 0.0 [0.0, 0.0] |
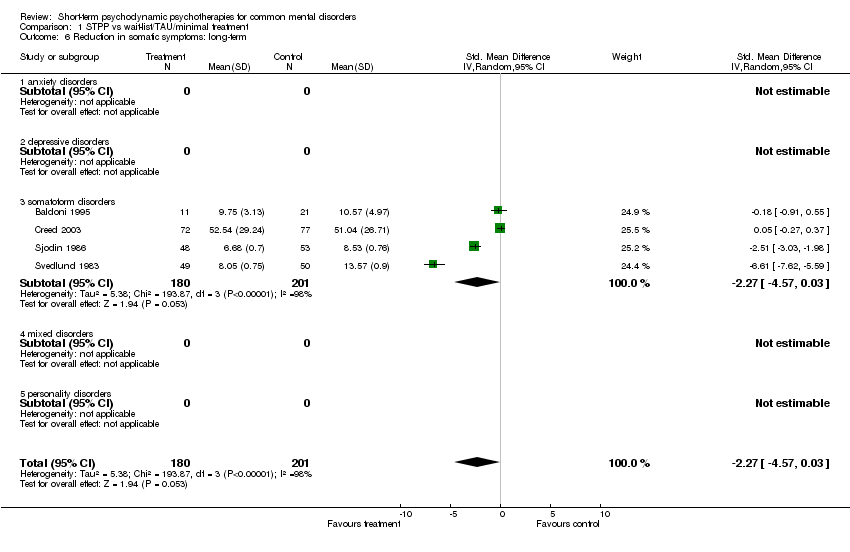
| 6 Reduction in somatic symptoms: long‐term Show forest plot | 4 | 381 | Std. Mean Difference (IV, Random, 95% CI) | ‐2.27 [‐4.57, 0.03] |
|
| 6.1 anxiety disorders | 0 | 0 | Std. Mean Difference (IV, Random, 95% CI) | 0.0 [0.0, 0.0] |
| 6.2 depressive disorders | 0 | 0 | Std. Mean Difference (IV, Random, 95% CI) | 0.0 [0.0, 0.0] |
| 6.3 somatoform disorders | 4 | 381 | Std. Mean Difference (IV, Random, 95% CI) | ‐2.27 [‐4.57, 0.03] |
| 6.4 mixed disorders | 0 | 0 | Std. Mean Difference (IV, Random, 95% CI) | 0.0 [0.0, 0.0] |
| 6.5 personality disorders | 0 | 0 | Std. Mean Difference (IV, Random, 95% CI) | 0.0 [0.0, 0.0] |
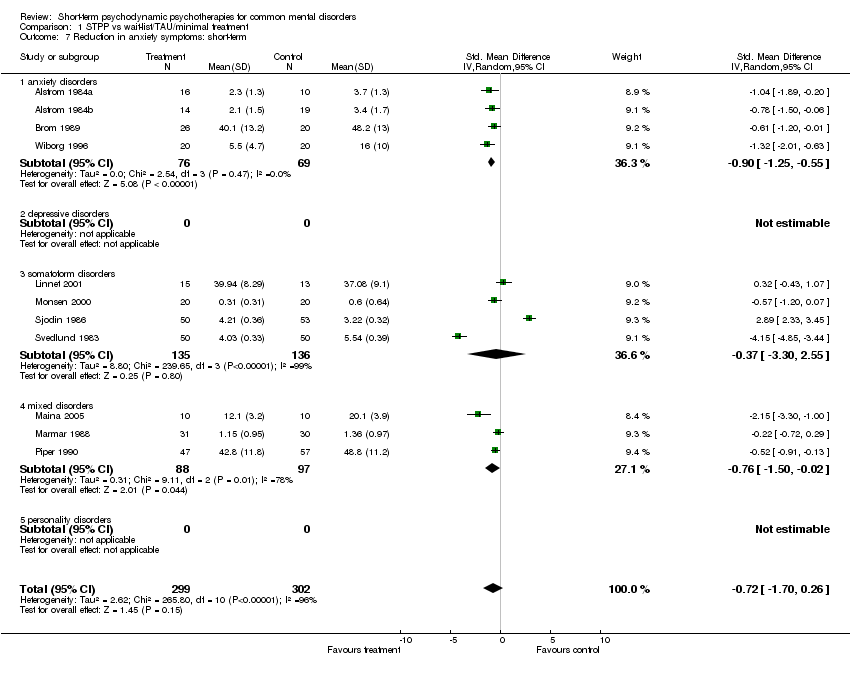
| 7 Reduction in anxiety symptoms: short‐term Show forest plot | 11 | 601 | Std. Mean Difference (IV, Random, 95% CI) | ‐0.72 [‐1.70, 0.26] |
|
| 7.1 anxiety disorders | 4 | 145 | Std. Mean Difference (IV, Random, 95% CI) | ‐0.90 [‐1.25, ‐0.55] |
| 7.2 depressive disorders | 0 | 0 | Std. Mean Difference (IV, Random, 95% CI) | 0.0 [0.0, 0.0] |
| 7.3 somatoform disorders | 4 | 271 | Std. Mean Difference (IV, Random, 95% CI) | ‐0.37 [‐3.30, 2.55] |
| 7.4 mixed disorders | 3 | 185 | Std. Mean Difference (IV, Random, 95% CI) | ‐0.76 [‐1.50, ‐0.02] |
| 7.5 personality disorders | 0 | 0 | Std. Mean Difference (IV, Random, 95% CI) | 0.0 [0.0, 0.0] |
| 8 Reduction in anxiety symptoms: medium‐term Show forest plot | 4 | 256 | Std. Mean Difference (IV, Random, 95% CI) | ‐0.96 [‐1.60, ‐0.31] |
|
| 8.1 anxiety disorders | 1 | 21 | Std. Mean Difference (IV, Random, 95% CI) | ‐1.07 [‐2.02, ‐0.12] |
| 8.2 depressive disorders | 0 | 0 | Std. Mean Difference (IV, Random, 95% CI) | 0.0 [0.0, 0.0] |
| 8.3 somatoform disorders | 2 | 174 | Std. Mean Difference (IV, Random, 95% CI) | ‐1.23 [‐2.10, ‐0.35] |
| 8.4 mixed disorders | 1 | 61 | Std. Mean Difference (IV, Random, 95% CI) | ‐0.36 [‐0.87, 0.15] |
| 8.5 personality disorders | 0 | 0 | Std. Mean Difference (IV, Random, 95% CI) | 0.0 [0.0, 0.0] |
| 9 Reduction in anxiety symptoms: long‐term Show forest plot | 5 | 333 | Std. Mean Difference (IV, Random, 95% CI) | ‐0.85 [‐2.36, 0.67] |
|
| 9.1 anxiety disorders | 1 | 40 | Std. Mean Difference (IV, Random, 95% CI) | ‐0.82 [‐1.47, ‐0.17] |
| 9.2 depressive disorders | 0 | 0 | Std. Mean Difference (IV, Random, 95% CI) | 0.0 [0.0, 0.0] |
| 9.3 somatoform disorders | 3 | 232 | Std. Mean Difference (IV, Random, 95% CI) | ‐0.97 [‐3.81, 1.86] |
| 9.4 mixed disorders | 1 | 61 | Std. Mean Difference (IV, Random, 95% CI) | ‐0.51 [‐1.02, ‐0.00] |
| 9.5 personality disorders | 0 | 0 | Std. Mean Difference (IV, Random, 95% CI) | 0.0 [0.0, 0.0] |
| 10 Reduction in depressive symptoms: short‐term Show forest plot | 11 | 927 | Std. Mean Difference (IV, Random, 95% CI) | ‐0.59 [‐1.13, ‐0.05] |
|
| 10.1 anxiety disorders | 1 | 40 | Std. Mean Difference (IV, Random, 95% CI) | ‐0.79 [‐1.44, ‐0.14] |
| 10.2 depressive disorders | 2 | 261 | Std. Mean Difference (IV, Random, 95% CI) | ‐0.61 [‐0.86, ‐0.36] |
| 10.3 somatoform disorders | 4 | 340 | Std. Mean Difference (IV, Random, 95% CI) | ‐0.64 [‐2.36, 1.07] |
| 10.4 mixed disorders | 4 | 286 | Std. Mean Difference (IV, Random, 95% CI) | ‐0.39 [‐0.62, ‐0.15] |
| 10.5 personality disorders | 0 | 0 | Std. Mean Difference (IV, Random, 95% CI) | 0.0 [0.0, 0.0] |
| 11 Reduction in depressive symptoms: medium‐term Show forest plot | 5 | 319 | Std. Mean Difference (IV, Random, 95% CI) | ‐0.41 [‐0.79, ‐0.03] |
|
| 11.1 anxiety disorders | 0 | 0 | Std. Mean Difference (IV, Random, 95% CI) | 0.0 [0.0, 0.0] |
| 11.2 depressive disorders | 2 | 186 | Std. Mean Difference (IV, Random, 95% CI) | ‐0.16 [‐0.58, 0.26] |
| 11.3 somatoform disorders | 2 | 72 | Std. Mean Difference (IV, Random, 95% CI) | ‐0.92 [‐1.79, ‐0.05] |
| 11.4 mixed disorders | 1 | 61 | Std. Mean Difference (IV, Random, 95% CI) | ‐0.29 [‐0.79, 0.22] |
| 11.5 personality disorders | 0 | 0 | Std. Mean Difference (IV, Random, 95% CI) | 0.0 [0.0, 0.0] |
| 12 Reduction in depressive symptoms: long‐term Show forest plot | 6 | 422 | Std. Mean Difference (IV, Random, 95% CI) | ‐0.98 [‐1.91, ‐0.04] |
|
| 12.1 anxiety disorders | 1 | 40 | Std. Mean Difference (IV, Random, 95% CI) | ‐0.65 [‐1.29, ‐0.01] |
| 12.2 depressive disorders | 1 | 89 | Std. Mean Difference (IV, Random, 95% CI) | 0.04 [‐0.38, 0.46] |
| 12.3 somatoform disorders | 3 | 232 | Std. Mean Difference (IV, Random, 95% CI) | ‐1.65 [‐3.47, 0.17] |
| 12.4 mixed disorders | 1 | 61 | Std. Mean Difference (IV, Random, 95% CI) | ‐0.35 [‐0.86, 0.16] |
| 12.5 personality disorders | 0 | 0 | Std. Mean Difference (IV, Random, 95% CI) | 0.0 [0.0, 0.0] |
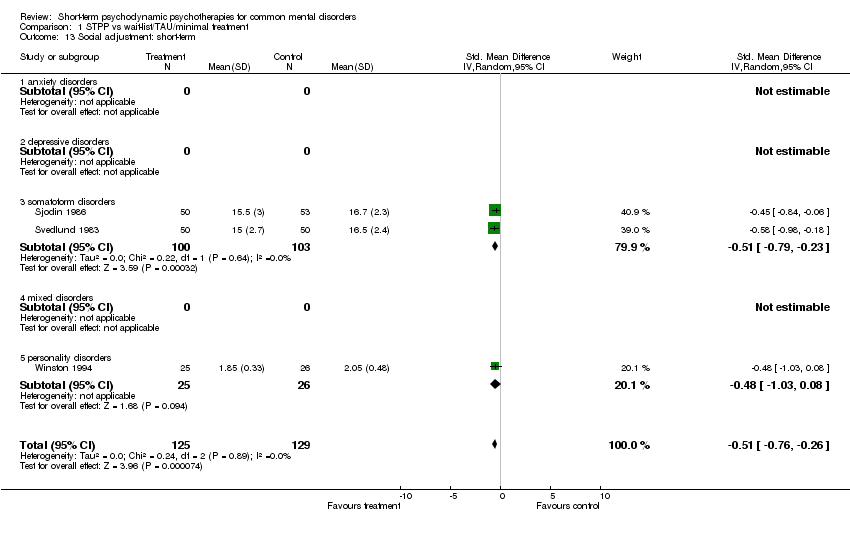
| 13 Social adjustment: short‐term Show forest plot | 3 | 254 | Std. Mean Difference (IV, Random, 95% CI) | ‐0.51 [‐0.76, ‐0.26] |
|
| 13.1 anxiety disorders | 0 | 0 | Std. Mean Difference (IV, Random, 95% CI) | 0.0 [0.0, 0.0] |
| 13.2 depressive disorders | 0 | 0 | Std. Mean Difference (IV, Random, 95% CI) | 0.0 [0.0, 0.0] |
| 13.3 somatoform disorders | 2 | 203 | Std. Mean Difference (IV, Random, 95% CI) | ‐0.51 [‐0.79, ‐0.23] |
| 13.4 mixed disorders | 0 | 0 | Std. Mean Difference (IV, Random, 95% CI) | 0.0 [0.0, 0.0] |
| 13.5 personality disorders | 1 | 51 | Std. Mean Difference (IV, Random, 95% CI) | ‐0.48 [‐1.03, 0.08] |
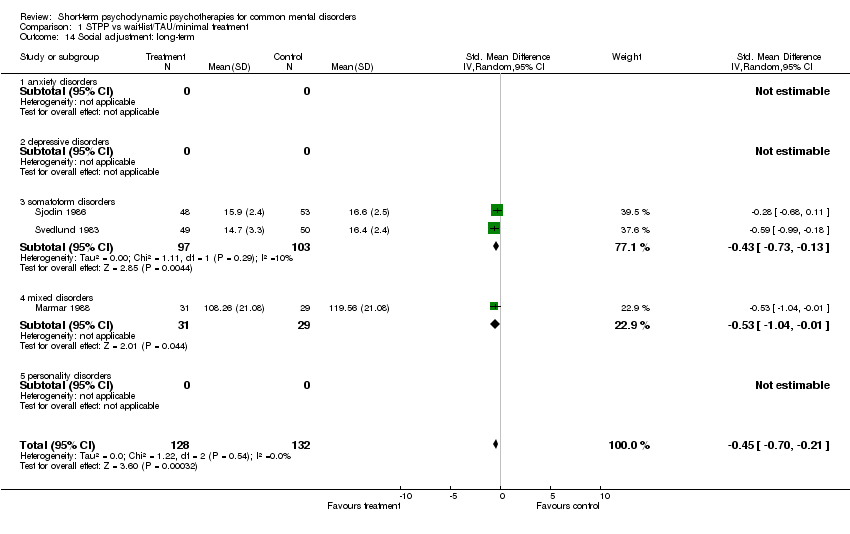
| 14 Social adjustment: long‐term Show forest plot | 3 | 260 | Std. Mean Difference (IV, Random, 95% CI) | ‐0.45 [‐0.70, ‐0.21] |
|
| 14.1 anxiety disorders | 0 | 0 | Std. Mean Difference (IV, Random, 95% CI) | 0.0 [0.0, 0.0] |
| 14.2 depressive disorders | 0 | 0 | Std. Mean Difference (IV, Random, 95% CI) | 0.0 [0.0, 0.0] |
| 14.3 somatoform disorders | 2 | 200 | Std. Mean Difference (IV, Random, 95% CI) | ‐0.43 [‐0.73, ‐0.13] |
| 14.4 mixed disorders | 1 | 60 | Std. Mean Difference (IV, Random, 95% CI) | ‐0.53 [‐1.04, ‐0.01] |
| 14.5 personality disorders | 0 | 0 | Std. Mean Difference (IV, Random, 95% CI) | 0.0 [0.0, 0.0] |