| Studies | Randomisation | Concealment | Blinded assessment | Loss to follow up | Sample size | Inclusion/exclusion | Type of fungi | Baseline | Funding |
| Cáceres‐Rios 2000 | Unclear | Unclear | Participants, clinicians and outcome assessors blinded | One drop‐out, group not stated | No | Yes | Yes | Adequate | Not mentioned |
| Dastghaib 2005 | Unclear | Unclear | Participants not blinded, investigators blinded. | Five participants discontinued therapy or were lost to follow up, group not stated | No | Yes | Yes | Adequate | Not mentioned |
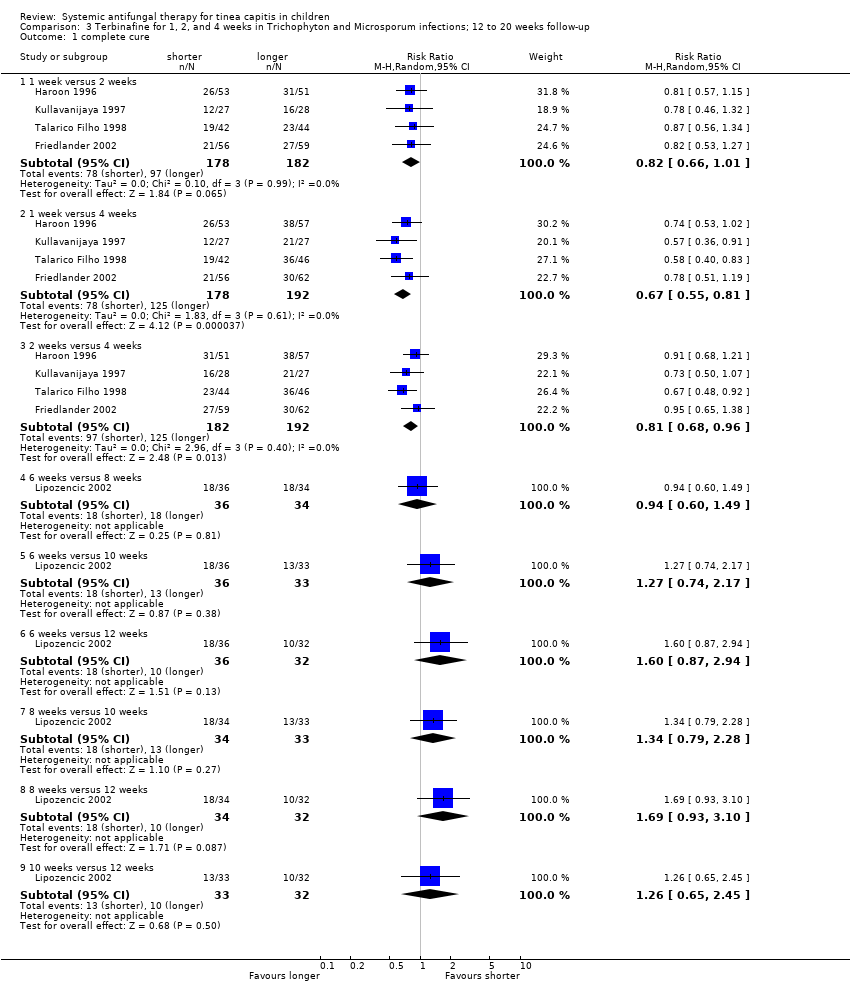
| Friedlander 2002 | Unclear | Unclear baseline comparability: conflict of interest: not mentioned | Participants, clinicians and outcome assessors blinded with respect to terbinafine treatment duration of each patient. | Terbinafine for 1 week group, post‐randomisation exclusions 14/56 (25%); terbinafine for 2 weeks group, post‐randomisation exclusions: 15/59 (25%); terbinafine for 4 weeks group, post‐randomisation exclusions: 12/62 (19%). | No | Yes | Yes | Adequate | Not mentioned |
| Fuller 2001 | Adequate (computer generated) | Unclear | Participants, clinicians and outcome assessors not blinded | Griseofulvin group, post‐randomisation exclusions 37/107 (35%), later losses 0, intention to treat 0 (only 45 completed the study); terbinafine group, post‐randomisation exclusions 26/103 (25%), later losses 0, intention to treat 0 (only 50 completed the study).
We are unaware of all the reasons for the drop‐outs in any of the groups, 68% discontinued because they were unable to attend clinic visits. | Yes | Yes | Yes | Adequate | Novartis |
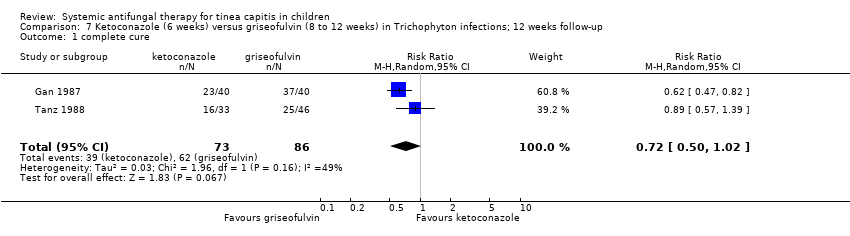
| Gan 1987 | Adequate (table of random numbers) | Unclear | Not blinded | Griseofulvin group, post‐randomisation exclusions: 11/40 (28%); ketoconazole group, post‐randomisation exclusions: 6/40 (15%). | No | Yes | Yes | Adequate | Not mentioned |
| Gupta 2001 | Unclear | Unclear | Participants not blinded, clinicians and outcome assessors blinded | Griseofulvin group, post‐randomisation exclusions: 4/50 (8%); terbinafine group, post‐randomisation exclusions: 2/50 (4%); itraconazole group, post‐randomisation exclusions: 4/50 (8%); fluconazole group, post‐randomisation exclusions: 4/50 (8%). | No | Yes | Yes | Adequate | Not mentioned |
| Hamm 1999 | Unclear | Unclear | Participants, clinicians and outcome assessors blinded | Any drop‐out mentioned | No | Yes | Yes | Not stated
Age: We are unaware of the mean age for each group
Sex: We are unaware of the number of females and males in each group.
Duration of complaint: Not stated | Novartis |
| Haroon 1995 | Unclear | Unclear | No mention of blinding | No drop‐out mentioned | No | Yes | Yes | Adequate | Sandoz |
| Haroon 1996 | Unclear | Unclear | Participants, clinicians and outcome assessors blinded | No drop‐out mentioned | No | Yes | Yes | Not stated | Sandoz |
| Jahangir 1998 | Unclear | Unclear | Participants, clinicians and outcome assessors blinded | No drop‐out mentioned | No | Yes | Yes | Adequate | Not mentioned |
| Kullavanijaya 1997 | Unclear | Unclear | Described as single blind and open trial study but no mention of which one (participants or observers) | Seven participants were lost to follow up and were excluded, but no further information is given. | No | The inclusion criteria are poorly stated and the exclusion criteria are not mentioned | Yes | Adequate | Sandoz |
| Lipozencic 2002 | Unclear | Unclear | Participants, clinicians and outcome assessors blinded. | Terbinafine for 6 weeks, post‐randomisation exclusions: 7/36 (19%); terbinafine for 8 weeks, post‐randomisation exclusions: 4/34 (12%); terbinafine for 10 weeks, post‐randomisation exclusion: 6/33 (18%); terbinafine for 12 weeks, post‐randomisation exclusion: 12/32 (38%); Griseofulvin group, post‐randomisation exclusions: 7/30 (23%). | Yes | Yes | Yes | Adequate | Novartis Pharma AG |
| López‐Gómez 1994 | Unclear | Unclear | Participants, clinicians and outcome assessors blinded. | Itraconazole group, post‐randomised exclusions: 1/18 (6%); griseofulvin group, post‐randomisation: 2/17 (12%). | No | Only inclusion criteria mentioned. | Yes | Adequate | Janssen |
| Martínez‐Roig 1988 | Adequate (computer generated random number table) | Unclear | Participants, clinicians and outcome assessors blinded | Very difficult to follow the drop‐outs as it mixes tinea corporis and tinea capitis, we do not know to which of the two groups they belong | No | No | Yes | Not stated | Laboratories Dr. Esteve |
| Memisoglu 1999 | Unclear | Unclear | Participants, clinicians and outcome assessors blinded | Griseofulvin group, post‐randomisation exclusions: 7/39 (18%), intention to treat: 32; terbinafine group, post‐randomisation exclusions: 4/39 (10%), intention to treat: 35. | No | Yes | Yes | Adequate | Not mentioned |
| Rademaker 1998 | Unclear | Unclear | Not blinded | No drop‐out mentioned | No | Only inclusion criteria mentioned | Yes | Not stated | Not mentioned |
| Solomon 1997 | Unclear | Unclear | Participants not blinded, clinicians and outcome assessors blinded | Fourteen were lost to follow up, but no further information was given. | No | Yes | Yes | Not stated | Not mentioned |
| Talarico Filho 1998 | Unclear | Unclear | Only participants blinded | Terbinafine for 1 week, post‐randomisation exclusions: 6/42 (14%); terbinafine for 2 weeks, post‐randomisation exclusion: 6/44 (14%); terbinafine for 4 weeks, post‐randomisation exclusions: 12/46 (26%). | No | Yes | Yes | Adequate | Sandoz |
| Tanz 1985 | Unclear | Unclear | Participants, clinicians and outcome assessors blinded | Griseofulvin group, post‐randomisation exclusions: 3/12 (25%); ketoconazole group, post‐randomisation: 5/10 (50%). | No | Yes | Yes | Adequate | Janssen |
| Tanz 1988 | Unclear | Unclear | Participants, clinicians and outcome assessors blinded | Griseofulvin group, post‐randomisation exclusions: 3/46 (7%), later losses: 17; ketoconazole group, post‐randomisation exclusions: 2/33 (6%), later losses: 9. | No | Yes | Yes | Adequate | Janssen |
| Ungpakorn 2004 | Unclear | Unclear | Participants, clinicians and outcome assessors blinded | Any drop‐out mentioned | Yes | Yes | Yes | Adequate | Institute of Dermatology Research Funds and Novartis (Thailand) |