Atención por comadronas versus otros modelos de atención para las pacientes durante el parto
Referencias
References to studies included in this review
References to studies excluded from this review
References to ongoing studies
Additional references
References to other published versions of this review
Characteristics of studies
Characteristics of included studies [ordered by study ID]
| Methods | Study design: RCT. Duration of study: 2004‐2007. | |
| Participants | Setting: Health Service Executive, Dublin North‐East, Republic of Ireland. | |
| Interventions | Experimental: women randomised to CLU received standard care: antenatal care provided by obstetricians supported by the midwifery and medical team; intrapartum and postpartum care (2 to 3 days in hospital) provided by midwives, overseen by consultants. Women were discharged into the care of Public Health Nurses. Control: women randomised to MLU received antenatal care from midwives and, if desired, from their GPs for some visits. Where complications arose, women were transferred to CLU based on agreed criteria. Intrapartum care was provided by midwives in a MLU with transfer to CLU if necessary. Postnatal care was by midwives in the MLU for up to 2 days, with transfer of women or neonates to CLU if necessary (and back, as appropriate). On discharge, MLU midwives visited at home, and/or provided telephone support, up to the seventh postpartum day. | |
| Outcomes | Outcomes considered in the review and reported in or extracted from the study: 5‐minute Apgar score below or equal to 7 Admission to special care nursery/NICU Amniotomy Antenatal hospitalisation Antepartum haemorrhage Augmentation/artificial oxytocin during labour Breastfeeding initiation Caesarean birth Duration of postnatal hospital stay (days) Episiotomy Fetal loss/neonatal death before 24 weeks Fetal loss/neonatal death equal to/after 24 weeks Induction of labour Instrumental vaginal birth (forceps/vacuum) Intact perineum Low birthweight (< 2500 g) Mean labour length Mean length of neonatal hospital stay (days) Neonatal convulsions (as defined by trial authors) No intrapartum analgesia/anaesthesia Opiate analgesia Overall fetal loss and neonatal death Perineal laceration requiring suturing Preterm birth (< 37 weeks) Postpartum haemorrhage (as defined by trial authors) Regional analgesia (epidural/spinal) Spontaneous vaginal birth (as defined by trial authors) | |
| Notes | Women were randomised to MLU or CLU in a 2:1 ratio. | |
| Risk of bias | ||
| Bias | Authors' judgement | Support for judgement |
| Random sequence generation (selection bias) | Low risk | ‘Random integers were obtained using a random number generator…’ |
| Allocation concealment (selection bias) | Low risk | ‘…an independent telephone randomisation service.’ |
| Blinding of participants and personnel (performance bias) | High risk | '...lack of blinding of participants and carers...' |
| Blinding of outcome assessment (detection bias) | High risk | 'Assessors for certain outcomes, such as laboratory tests, were blinded to study group.' |
| Incomplete outcome data (attrition bias) | Low risk | Loss to follow‐up = 5 midwife‐led care, 3 CLC. |
| Selective reporting (reporting bias) | Low risk | Outcome reporting: all outcomes stated in the methods section were adequately reported or explained in results. |
| Other bias | Low risk | No other bias identified. |
| Methods | Study design: RCT. Duration of study: 1996‐1998. | |
| Participants | Setting: public tertiary hospital, Monash Medical Centre, Melbourne, Australia. | |
| Interventions | Experimental: team of 7 full‐time midwives who provided antenatal, intrapartum, and some postnatal care in hospital in consultation with medical staff. Doctors and team midwife jointly saw women at 12‐16, 28, 36, 41 weeks. Women at high risk of complications had individual care plan. | |
| Outcomes | Outcomes considered in the review and reported in or extracted from the study: 5‐minute Apgar score below or equal to 7 Admission to special care nursery/NICU Attendance at birth by known midwife Augmentation/artificial oxytocin during labour Duration of postnatal hospital stay (days) Episiotomy Fetal loss/neonatal death before 24 weeks Fetal loss/neonatal death equal to/after 24 weeks Induction of labour Intact perineum Instrumental vaginal birth(forceps/vacuum) Mean length of neonatal hospital stay (days) No intrapartum analgesia/anaesthesia Overall fetal loss and neonatal death Perineal laceration requiring suturing Preterm birth (< 37 weeks) Regional analgesia (epidural/spinal) Spontaneous vaginal birth (as defined by trial authors) | |
| Notes | 2 groups similar at baseline. 80% of experimental group and 0.3% of standard group had previously met midwife attending labour. | |
| Risk of bias | ||
| Bias | Authors' judgement | Support for judgement |
| Random sequence generation (selection bias) | Low risk | 'Allocations were computer generated...' |
| Allocation concealment (selection bias) | Low risk | '...the research team member telephoned the medical records staff and asked them to select an envelope with the randomized treatment allocation.' |
| Blinding of participants and personnel (performance bias) | Unclear risk | Not stated but unlikely. |
| Blinding of outcome assessment (detection bias) | Unclear risk | Not stated but unlikely. |
| Incomplete outcome data (attrition bias) | Low risk | Loss to follow‐up = 14 team care, 18 standard care. |
| Selective reporting (reporting bias) | Low risk | Outcome reporting: all outcomes stated in the methods section were adequately reported in results. |
| Other bias | Low risk | No other bias identified. |
| Methods | Study design: RCT, Zelen design. Duration of study: 1983‐1985. | |
| Participants | Setting: tertiary hospital and community settings, St George's Hospital, London, UK. | |
| Interventions | Experimental: team of 4 midwives who provided antenatal, intrapartum and postnatal care in hospital, and postnatal care in the community for women in predefined geographic area. Obstetrician seen at 36 and 41 weeks as appropriate. | |
| Outcomes | Outcomes considered in the review and reported in or extracted from the study: 5‐minute Apgar score below or equal to 7 Admission to special care nursery/NICU Antenatal hospitalisation Augmentation/artificial oxytocin during labour Caesarean birth Episiotomy Fetal loss/neonatal death before 24 weeks Fetal loss/neonatal death equal to/after 24 weeks High perceptions of control during labour and childbirth Induction of labour Intact perineum Instrumental vaginal birth(forceps/vacuum) Low birthweight (< 2500 g) No intrapartum analgesia/anaesthesia Opiate analgesia Overall fetal loss and neonatal death Postpartum haemorrhage (as defined by trial authors) Regional analgesia (epidural/spinal) Spontaneous vaginal birth (as defined by trial authors) | |
| Notes | At baseline, more Asian women in control group (18% vs 10%) and more smokers in experimental group (30% vs 22%). | |
| Risk of bias | ||
| Bias | Authors' judgement | Support for judgement |
| Random sequence generation (selection bias) | Unclear risk | Not stated. |
| Allocation concealment (selection bias) | Unclear risk | '...randomised into two groups by pinning sealed envelopes on their notes containing either the motto KNOW YOUR MIDWIFE or CONTROL GROUP' (Does not state if envelopes were number consecutively.) |
| Blinding of participants and personnel (performance bias) | Unclear risk | Not stated but unlikely. |
| Blinding of outcome assessment (detection bias) | Unclear risk | Not stated but unlikely. |
| Incomplete outcome data (attrition bias) | Low risk | Loss to follow‐up = 15 team care, 19 standard care. |
| Selective reporting (reporting bias) | Low risk | Outcome reporting: all outcomes stated in the methods section were adequately reported in results. |
| Other bias | Low risk | No other bias identified. |
| Methods | Study design: RCT. Duration of study: 1992‐1994. | |
| Participants | Setting: range of city hospitals and community settings in Alberta, Canada. | |
| Interventions | Experimental: team of 7 nurse‐midwives who provided antenatal and intrapartum care in the hospital and postnatal care in the community. Obstetrician seen at booking and at 36 weeks. | |
| Outcomes | Outcomes considered in the review and reported in or extracted from the study:
5‐minute Apgar score below or equal to 7 Admission to special care nursery/NICU Amniotomy Antepartum haemorrhage Attendance at birth by known midwife Augmentation/artificial oxytocin during labour Caesarean birth Episiotomy Fetal loss/neonatal death before 24 weeks Induction of labour Instrumental vaginal birth (forceps/vacuum) Intact perineum Opiate analgesia Overall fetal loss and neonatal death Postpartum haemorrhage (as defined by trial authors) Regional analgesia (epidural/spinal) Spontaneous vaginal birth (as defined by trial author) | |
| Notes | At baseline, more women in experimental group had longer period in education (16 years vs 15.23 years). | |
| Risk of bias | ||
| Bias | Authors' judgement | Support for judgement |
| Random sequence generation (selection bias) | Low risk | '...computer‐generated random allocation.' |
| Allocation concealment (selection bias) | Low risk | '...using a series of consecutively numbered, sealed, opaque envelopes...' |
| Blinding of participants and personnel (performance bias) | Unclear risk | Not stated but unlikely. |
| Blinding of outcome assessment (detection bias) | Unclear risk | Not stated but unlikely. |
| Incomplete outcome data (attrition bias) | Low risk | Loss to follow‐up = 4 team care and 12 standard care. |
| Selective reporting (reporting bias) | Low risk | Outcome reporting: all outcomes stated in the methods section were adequately reported in results. |
| Other bias | Low risk | No other bias identified. |
| Methods | Study design: RCT. Duration of study: not stated. | |
| Participants | Setting: tertiary hospital and community, City not stated but UK. | |
| Interventions | Experimental: team of 8 midwives who provided antenatal, intrapartum and postnatal care 24 hours a day, 7 days a week in both hospital and community. The team was attached to a GP practice. Referral to obstetrician as necessary. | |
| Outcomes | Outcomes considered in the review and reported in or extracted from the study: Induction of labour Instrumental vaginal birth (forceps/vacuum) Intact perineum Opiate analgesia Overall fetal loss and neonatal death Postpartum haemorrhage (as defined by trial authors) Regional analgesia (epidural/spinal) Spontaneous vaginal birth (as defined by trial authors) | |
| Notes | 71% of experimental group and 14% of standard group had previously met midwife attending labour. | |
| Risk of bias | ||
| Bias | Authors' judgement | Support for judgement |
| Random sequence generation (selection bias) | Low risk | Envelopes '...had been shuffled previously by an individual not involved in the recruitment process, and then numbered consecutively.' |
| Allocation concealment (selection bias) | Low risk | 'Allocation was undertaken by giving each woman a sealed envelope containing one of the care options.' |
| Blinding of participants and personnel (performance bias) | Unclear risk | Not stated but unlikely. |
| Blinding of outcome assessment (detection bias) | Unclear risk | Not stated but unlikely. |
| Incomplete outcome data (attrition bias) | Low risk | Loss to follow‐up = 19 team care and 8 standard. Due to non‐response to questionnaires. |
| Selective reporting (reporting bias) | Low risk | Outcome reporting: all outcomes stated in the methods section were adequately reported in results. |
| Other bias | Low risk | No other bias identified. |
| Methods | Study design: RCT, Zelen method. Duration of study: 1997‐1998. | |
| Participants | Setting: public tertiary hospital and community, Sydney, Australia. | |
| Interventions | Experimental: 2 teams of 6 midwives sharing a caseload of 300 women a year/team. Antenatal care in outreach community‐based clinics. Intrapartum and postpartum hospital and community care. Obstetrician or obstetric registrar did not see women routinely, but acted as a consultant and reviewed women only as necessary. Women who developed complications during their pregnancy continued to receive care from the same group of carers. | |
| Outcomes | Outcomes considered in the review and reported in or extracted from the study:
5‐minute Apgar score below or equal to 7 Admission to special care nursery/NICU Antenatal hospitalisation Antepartum haemorrhage Attendance at birth by known midwife Augmentation/artificial oxytocin during labour Caesarean birth Episiotomy Fetal loss/neonatal death before 24 weeks Fetal loss/neonatal death equal to/after 24 weeks Induction of labour Instrumental vaginal birth (forceps/vacuum) Opiate analgesia Overall fetal loss and neonatal death Postpartum haemorrhage (as defined by trial authors) Regional analgesia (epidural/spinal) Spontaneous vaginal birth (as defined by trial authors) | |
| Notes | 63% of experimental group and 21% of standard group had previously met midwife attending labour. | |
| Risk of bias | ||
| Bias | Authors' judgement | Support for judgement |
| Random sequence generation (selection bias) | Low risk | '...computer‐generated random numbers...' |
| Allocation concealment (selection bias) | Low risk | '...group allocation was not revealed until the woman’s details were recorded by the administrative assistant.' |
| Blinding of participants and personnel (performance bias) | High risk | No (states 'unblinded'). |
| Blinding of outcome assessment (detection bias) | High risk | No (states 'unblinded'). |
| Incomplete outcome data (attrition bias) | Low risk | Loss to follow‐up: team care 46, standard care 42. |
| Selective reporting (reporting bias) | Low risk | Outcome reporting: all outcomes stated in the methods section were adequately reported in results. |
| Other bias | Low risk | No other bias identified. |
| Methods | Study design: RCT. Duration of study: 1992‐199. | |
| Participants | Setting: Westmead public hospital, NSW, Australia. | |
| Interventions | Experimental: team of 6.8 WTE midwives sharing a caseload. Provided antenatal and intrapartum care in hospital and postnatal care in hospital and community. Obstetrician saw all women at first visit and 32 weeks, and after 40 weeks, and as appropriate. Team midwife was on call for out‐of‐hours care. Control: low‐risk women seen in midwives' hospital antenatal clinics, and all other women seen by medical staff. Women received intrapartum care from delivery suite midwives, and postnatal care from midwives on postnatal ward and community postnatal care. | |
| Outcomes | Outcomes considered in the review and reported in or extracted from the study:
5‐minute Apgar score below or equal to 7 Admission to special care nursery/NICU Amniotomy Antenatal hospitalisation Attendance at birth by known midwife Augmentation/artificial oxytocin during labour Breastfeeding initiation Caesarean birth Episiotomy Fetal loss/neonatal death equal to/after 24 weeks Induction of labour Instrumental vaginal birth (forceps/vacuum) Intact perineum Mean labour length Mean number of antenatal visits No intrapartum analgesia/anaesthesia Opiate analgesia Overall fetal loss and neonatal death Perineal laceration requiring suturing Postpartum haemorrhage (as defined by trial authors) Regional analgesia (epidural/spinal) Spontaneous vaginal birth (as defined by trial authors) | |
| Notes | 96% of experimental group and 13% of standard group had previously met midwife attending labour. Randomisation before consent to participate. | |
| Risk of bias | ||
| Bias | Authors' judgement | Support for judgement |
| Random sequence generation (selection bias) | Unclear risk | '...allocated a numbered randomisation envelope (the number was recorded by the booking‐in midwife on a list of women booked in the session).' |
| Allocation concealment (selection bias) | Low risk | 'Allocated a numbered randomisation envelope (the number was recorded by the booking‐in midwife on a list of women booked in the session). When each woman returned for her first visit to the doctor at the antenatal clinic she was approached in the waiting room by a program midwife, reminded about the research and asked to sign a consent form. If the woman agreed to join the study, the randomisation envelope was opened and the woman informed of the type of care she was to receive and the appropriate future appointments made.' |
| Blinding of participants and personnel (performance bias) | Unclear risk | Not stated but unlikely. |
| Blinding of outcome assessment (detection bias) | Unclear risk | Not stated but unlikely. |
| Incomplete outcome data (attrition bias) | Low risk | Loss to follow‐up = 19 team care and 22 standard who either moved or had a miscarriage. |
| Selective reporting (reporting bias) | Low risk | Outcome reporting: all outcomes stated in the methods section were adequately reported in results. |
| Other bias | Low risk | No other bias identified. |
| Methods | Study design: RCT, Zelen method. Duration of study: 1989‐1991. | |
| Participants | Setting: tertiary hospital and community in Leicester, UK. | |
| Interventions | Experimental: team of 2 midwifery sisters assisted by 8 staff midwives provided hospital‐based antenatal, intrapartum (in hospital‐based 3 room home‐from‐home unit (no EFM or epidural) and hospital postnatal care only. All the staff were volunteers. Antenatal midwife‐led hospital clinic with scheduled visits at 26, 36 and 41 weeks' gestation. Intervening care shared with GPs and community midwives. Referral to obstetrician as appropriate. At 41 weeks mandatory referral to consultant. Postnatal care in community provided by community midwife and GP. | |
| Outcomes | Outcomes considered in the review and reported in or extracted from the study:
Admission to special care nursery/NICU Augmentation/artificial oxytocin during labour Caesarean birth Episiotomy Fetal loss/neonatal death before 24 weeks Fetal loss/neonatal death equal to/after 24 weeks Induction of labour Intact perineum Instrumental vaginal birth (forceps/vacuum) Low birthweight (< 2500 g) No intrapartum analgesia/anaesthesia Opiate analgesia Overall fetal loss and neonatal death Perineal laceration requiring suturing Postpartum haemorrhage(as defined by trial authors) Preterm birth (< 37 weeks) Regional analgesia (epidural/spinal) Spontaneous vaginal birth (as defined by trial authors) | |
| Notes | 2:1 randomisation ratio in favour of midwife‐led care. 189/2304 (8%) women opted out of team‐midwife care post‐randomisation. Analysis by intention‐to‐treat analysis. Level of continuity not reported. | |
| Risk of bias | ||
| Bias | Authors' judgement | Support for judgement |
| Random sequence generation (selection bias) | Low risk | '...by a random sequence...' |
| Allocation concealment (selection bias) | Low risk | ‘...sealed envelope...cards could not be read through the envelopes. Each envelope was numbered, and unused envelopes were not reallocated...’ |
| Blinding of participants and personnel (performance bias) | High risk | Not stated re participants but not possible to have achieved. Clinical staff were unaware whether a particular woman was in the control group or was not in the study. No information given re blinding of women in intervention arm. |
| Blinding of outcome assessment (detection bias) | Unclear risk | Not stated but unlikely. |
| Incomplete outcome data (attrition bias) | Unclear risk | No information given on losses to follow‐up. |
| Selective reporting (reporting bias) | Low risk | Outcome reporting: all outcomes stated in the methods section were adequately reported in results. |
| Other bias | Low risk | No other bias identified. |
| Methods | Study design: RCT. Duration of study: 2007‐2010. | |
| Participants | Setting: Royal Women’s Hospital (RWH), Melbourne, Australia. | |
| Interventions | Experimental: majority of care from a ‘primary’ caseload midwife at the hospital. The primary midwife collaborated with obstetricians and other health professionals and continued to provide caseload care if complications arose. Women saw an obstetrician at booking, at 36 weeks' gestation and postdates if required, and usually had 1 or 2 visits with a ‘back‐up’ midwife. Intrapartum care was provided in the hospital birthing suite. Where possible, primary midwife was on call for the woman’s labour and birth. The primary midwife (or a back‐up) attended the hospital on most days to provide some postnatal care and provided domiciliary care following discharge from hospital. Fulltime midwives had a caseload of 45 women per annum. During the trial there were 7.5 (at commencement) to 12 full‐time equivalent midwives employed in caseload care, equating to 10–14 midwives. Control: options included midwifery‐led care with varying levels of continuity, obstetric trainee care and community‐based care ‘shared’ between a general medical practitioner (GP) and the hospital, where the GP provided the majority of antenatal care. In the midwife and GP‐led models women saw an obstetrician at booking, 36 weeks' gestation and postdates if required, with other referral or consultation as necessary. In all standard‐ care options, women were cared for by whichever midwives and doctors were rostered for duty when they came into the hospital for labour, birth and postnatal care. | |
| Outcomes | Outcomes considered in the review and reported in or extracted from the study:
5‐minute Apgar score below or equal to 7 Admission to special care nursery/NICU Caesarean birth Duration of postnatal hospital stay (days) Episiotomy Fetal loss/neonatal death before 24 weeks Fetal loss/neonatal death equal to/after 24 weeks Induction of labour Instrumental vaginal birth (forceps/vacuum) Low birthweight (< 2500 g) Overall fetal loss and neonatal death Preterm birth (< 37 weeks) Postpartum haemorrhage (as defined by trial authors) Regional analgesia (epidural/spinal) Spontaneous vaginal birth (as defined by trial authors) | |
| Notes | '...around 90% of the women had a known carer in labour.' | |
| Risk of bias | ||
| Bias | Authors' judgement | Support for judgement |
| Random sequence generation (selection bias) | Low risk | '...using stratified permuted blocks of varying size.' |
| Allocation concealment (selection bias) | Low risk | 'Randomisation was undertaken using an interactive voice response system activated by telephone...' |
| Blinding of participants and personnel (performance bias) | Unclear risk | Not stated but unlikely. |
| Blinding of outcome assessment (detection bias) | Low risk | 'Obstetric and medical outcome data (including type of birth) were obtained directly from the electronic obstetric database, blinded to treatment allocation. Data not available this way (e.g. continuity of carer) were manually abstracted (unblinded) from the medical record.' |
| Incomplete outcome data (attrition bias) | Low risk | Loss to follow‐up = 6 caseload and 1 standard care. |
| Selective reporting (reporting bias) | Low risk | Outcome reporting: all outcomes stated in the methods section were adequately reported in results. |
| Other bias | Low risk | No other bias identified. |
| Methods | Study design: RCT, cluster randomisation. Duration of study: not stated. | |
| Participants | Setting: tertiary hospital and community, UK. | |
| Interventions | Experimental: caseload midwife‐led care. 3 geographic areas with 21 WTE midwives working in 3 practices offering a caseload model of care. Each midwife was attached to 2‐3 GP practices and cared for 35‐40 women. Midwives worked in pairs/threesomes. Caseload midwives were existing community midwives, plus new midwives recruited from community and hospital resulting in a mix of senior and junior staff. Monthly antenatal care in the community, intrapartum and postnatal care in hospital and postnatal care in the community provided. Control: shared care in the community between GPs, community midwives and obstetricians. Each community midwife cared for 100/150 women each. | |
| Outcomes | Outcomes considered in the review and reported in or extracted from the study:
5‐minute Apgar score below or equal to 7 Admission to special care nursery/NICU Attendance at birth by known midwife Augmentation/artificial oxytocin during labour Caesarean birth Episiotomy Fetal loss/neonatal death equal to/after 24 weeks Induction of labour Instrumental vaginal birth (forceps/vacuum) Intact perineum Low birthweight (< 2500 g) Overall fetal loss and neonatal death Perineal laceration requiring suturing Preterm birth (< 37 weeks) Regional analgesia (epidural/spinal) | |
| Notes | 95% of experimental group and 7% of standard group had previously met midwife attending labour. | |
| Risk of bias | ||
| Bias | Authors' judgement | Support for judgement |
| Random sequence generation (selection bias) | Unclear risk | 'Randomisation was undertaken by one of the principal investigators...who had no prior knowledge of the area or medical and midwifery staff involved.... three pairs, one of each...randomised to receive caseload care and the other to traditional care.' |
| Allocation concealment (selection bias) | High risk | No information given about allocation concealment. |
| Blinding of participants and personnel (performance bias) | High risk | 'It was not possible to mask allocation and both women and professionals were aware of the allocated type of midwifery care.' |
| Blinding of outcome assessment (detection bias) | Unclear risk | Not stated but unlikely. |
| Incomplete outcome data (attrition bias) | Low risk | Loss to follow‐up: not reported but appears complete. |
| Selective reporting (reporting bias) | Low risk | Outcome reporting: all outcomes stated in the methods section were adequately reported or explained in results. |
| Other bias | Low risk | No other bias identified. |
| Methods | Study design: RCT. Duration of study: 1991‐1992. | |
| Participants | Setting: John Hunter hospital, Newcastle, NSW, Australia. | |
| Interventions | Experimental: team of 6 experienced and newly graduated midwives provided antenatal care, intrapartum care, and postnatal care in hospital. Women at low risk had scheduled consultations with an obstetrician at 12‐16, 36, 41 weeks and additional consultations as needed. Women at high risk had consultations with an obstetrician at a frequency determined according to their needs. | |
| Outcomes | Outcomes considered in the review and reported in or extracted from the study:
5‐minute Apgar score below or equal to 7 Admission to special care nursery/NICU Antenatal hospitalisation Augmentation/artificial oxytocin during labour Caesarean birth Episiotomy Fetal loss/neonatal death before 24 weeks Fetal loss/neonatal death equal to/after 24 weeks Induction of labour Instrumental vaginal birth(forceps/vacuum) Low birthweight (< 2500 g) Opiate analgesia Overall fetal loss and neonatal death Perineal laceration requiring suturing Preterm birth (< 37 weeks) Regional analgesia(epidural/spinal) Spontaneous vaginal birth (as defined by trial authors)
| |
| Notes | Degree of continuity not reported. | |
| Risk of bias | ||
| Bias | Authors' judgement | Support for judgement |
| Random sequence generation (selection bias) | Low risk | 'Allocation to either team care or routine care was done by computer‐generated random assignments:' |
| Allocation concealment (selection bias) | Unclear risk | 'The women were allocated at random to team care or routine care....' |
| Blinding of participants and personnel (performance bias) | High risk | '...the unblinded nature of the study could have led to differences in practice and measurement of outcomes...' |
| Blinding of outcome assessment (detection bias) | High risk | '...the unblinded nature of the study could have led to differences in practice and measurement of outcomes...' |
| Incomplete outcome data (attrition bias) | Unclear risk | Loss to follow‐up not reported (appears minimal). |
| Selective reporting (reporting bias) | Low risk | Outcome reporting: all outcomes stated in the methods section were adequately reported or explained in result. |
| Other bias | Low risk | No other bias identified. |
| Methods | Study design: RCT. Duration of study: 1993‐1994. | |
| Participants | Setting: Glasgow Royal Maternity Hospital, Scotland, United Kingdom. | |
| Interventions | Experimental: caseload midwifery provided by 20 midwives who volunteered to join the MDU. Each pregnant woman had a named midwife whom she met at her first booking visit who aimed to provide the majority of care. When the named midwife was not available, care was provided by up to 3 associate midwives. Women were not seen by medical staff at booking. Antenatal care was provided at home, community‐based clinics or hospital clinics. Intrapartum care was in hospital (MDU ‐ 3 rooms with fewer monitors and homely surroundings) or main labour suite. Postnatal care was provided in designated 8‐bed MDU ward and community. A medical visit was scheduled where there was a deviation from normal. | |
| Outcomes | Outcomes considered in the review and reported in or extracted from the study:
5‐minute Apgar score below or equal to 7 Admission to special care nursery/NICU Antepartum haemorrhage Augmentation/artificial oxytocin during labour Caesarean birth Episiotomy Fetal loss/neonatal death before 24 weeks Fetal loss/neonatal death equal to/after 24 weeks Induction of labour Instrumental vaginal birth(forceps/vacuum) Intact perineum Low birthweight (< 2500 g) Mean labour length Neonatal convulsions (as defined by trial authors) No intrapartum analgesia/anaesthesia Opiate analgesia Overall fetal loss and neonatal death Perineal laceration requiring suturing Postpartum depression Postpartum haemorrhage (as defined by trial authors) Preterm birth (< 37 weeks) Regional analgesia (epidural/spinal) Spontaneous vaginal birth (as defined by trial authors) | |
| Notes | Women in the intervention group saw 7 fewer care providers across antenatal, labour and postnatal periods and 2 fewer providers during labour. | |
| Risk of bias | ||
| Bias | Authors' judgement | Support for judgement |
| Random sequence generation (selection bias) | Low risk | '...random number tables...' |
| Allocation concealment (selection bias) | Low risk | 'The research team telephoned a clerical officer in a separate office for care allocation for each woman.' |
| Blinding of participants and personnel (performance bias) | Unclear risk | Participants: not stated. Personnel: clinical staff were unaware whether a particular woman was in the control group or was not in the study. No information given for women in intervention arm. |
| Blinding of outcome assessment (detection bias) | Unclear risk | 'Clinical data were gathered through a retrospective review of records by the research team who were not involved in providing care.' |
| Incomplete outcome data (attrition bias) | Low risk | Loss to follow‐up: 5 team care and 16 shared care. |
| Selective reporting (reporting bias) | Low risk | Outcome reporting: all outcomes stated in the methods section were adequately reported or explained in result. |
| Other bias | Low risk | No other bias identified. |
| Methods | Study design: RCT. Duration of study: 1996‐1997. | |
| Participants | Setting: Royal Women's Hospital, Melbourne, Australia. | |
| Interventions | Experimental: team‐midwife care provided by team of 8 midwives who provided hospital‐based antenatal, intrapartum (delivery suite or family birth centre) and some postnatal care in collaboration with medical staff. Control: standard care included different options of care being provided mostly by doctors, care mainly by midwives in collaboration with doctors (midwives clinics), birth centres and shared care between general practitioners and hospital doctors. | |
| Outcomes | Outcomes considered in the review and reported in or extracted from the study:
5‐minute Apgar score below or equal to 7 Admission to special care nursery/NICU Antenatal hospitalisation Antepartum haemorrhage Attendance at birth by known midwife Augmentation/artificial oxytocin during labour Caesarean birth Duration of postnatal hospital stay(days) Episiotomy Fetal loss/neonatal death before 24 weeks Fetal loss/neonatal death equal to/after 24 weeks Induction of labour Instrumental vaginal birth (forceps/vacuum) Intact perineum Mean length of neonatal hospital stay (days) Opiate analgesia Overall fetal loss and neonatal death Perineal laceration requiring suturing Postpartum haemorrhage (as defined by trial authors) Preterm birth (< 37 weeks) Regional analgesia (epidural/spinal) Spontaneous vaginal birth (as defined by trial authors) | |
| Notes | 65% and 9% of experimental (team) and control (standard) group participants had previously met midwife attending labour. | |
| Risk of bias | ||
| Bias | Authors' judgement | Support for judgement |
| Random sequence generation (selection bias) | Unclear risk | No information given. |
| Allocation concealment (selection bias) | Low risk | 'The research midwife rang a clerk at the hospital's information desk who opened an opaque, numbered envelope that contained information about the allocated group.' |
| Blinding of participants and personnel (performance bias) | Unclear risk | Not stated but unlikely. |
| Blinding of outcome assessment (detection bias) | Unclear risk | Not stated but unlikely. |
| Incomplete outcome data (attrition bias) | Low risk | Lost to follow‐up: 11 team care and 9 standard‐care group. |
| Selective reporting (reporting bias) | Low risk | Outcome reporting: all outcomes stated in the methods section were adequately reported or explained in result. |
| Other bias | Low risk | No other bias identified. |
BMI: body mass index
CLC: consultant‐led care
CLU: consultant‐led unit
EFM: electronic fetal monitoring
GP: general practitioner
IUGR: intrauterine growth restriction
MDU: midwifery development unit
MLU: midwife‐led care
NICU: neonatal intensive care unit
PET: positron emissions tomography
RCT: randomised controlled trial
vs: versus
WTE: whole time equivalent
Characteristics of excluded studies [ordered by study ID]
| Study | Reason for exclusion |
| This study was a retrospective study comparing outcomes for 2 groups of women who gave birth in 1990 and 1992. | |
| This study compared risk assessment by physicians with midwives reporting new mothers to the doctor. It does not compare midwife‐led with other models of care. | |
| This study compared women giving birth in three different birth units: the special unit for high risk women; the normal unit; and the midwife‐led unit. It does not compare midwife‐led with other models of care throughout pregnancy and birth. | |
| Women admitted in labour were assigned to either midwife‐led or a resident physician and antenatal care was not part of the intervention. | |
| This study compares similar models of care occurring in 2 different birth environments rather than comparing 2 different models of care. The same group of community midwives cared for the women in both groups. Method of randomisation is not stated. | |
| The study compares 2 models of antenatal care, i.e. antenatal care by midwives and obstetricians or antenatal care by midwives only. Intrapartum and postpartum care are not part of the intervention. | |
| The study presents a randomised trial of nurse‐midwifery prenatal care to reduce low birthweight: intrapartum and postpartum care are not part of the intervention. | |
| The aim of the study was to determine women's interest in home birth and in‐hospital birth centre care in Sweden and to describe the characteristics of these women. It did not compare the models of care in these 2 settings. | |
| The main objective was to compare care and delivery of low‐risk women in a midwife‐managed delivery unit with care and delivery in the consultant‐led labour ward. It is not indicated if women in the birth centre group had antenatal midwifery‐led care. | |
| This study compared a schematic approach to antenatal care only and conventional shared care.There are no data available. | |
| Study protocol only, search strategy did not reveal any evidence that the trial was conducted and completed. | |
| The intervention involved the comparison of 2 birthing environments. | |
| In this study, the randomisation took place on the admission to labour ward, thus the study compared intrapartum care only. | |
| This study aimed to compare continuity of midwifery care with standard midwifery care in reducing postnatal depression in women with a past history of depression. Thus midwife‐led care is not being compared to another model of care. | |
| The primary reason for exclusion is the fact that the study did not compare a midwifery model of care to another model. The purpose of the investigation was to study the effectiveness or non‐effectiveness of nurse‐midwives in a supervised hospital environment. The population of the study comprised student nurse‐midwives and compared their services to those of MD residents in the same unit. Moreover, there are not enough comparable data. | |
| Large loss to follow‐up after randomisation. A total of 66.5% in the treatment group and 63.5% in the control group were excluded or lost to the study. | |
| The care was not midwifery‐led. Both groups received shared care. 1 group received most of their care at a satellite clinic in their neighbourhood, which was an inner‐city, socio‐economically deprived area. The other group received care at the hospital clinic. Women receiving satellite clinic care also had additional social support from link workers during pregnancy. It was a comparison of the same model of care at different settings. | |
| The study compares a shared care model vs a medical‐led model. The primary analyses are not included. | |
| This study compared birth centre care ‐ characterised by comprehensive antenatal, intrapartum and postpartum care, on the same premises with a home‐like environment and the same team of midwives ‐ to the standard obstetric care divided into antenatal care at neighbourhood antenatal clinics, intrapartum care in hospital delivery wards, and postpartum care in hospital postpartum wards. In the standard obstetric care, a woman usually meets with the same midwife, at the antenatal clinic, throughout pregnancy. In the delivery ward she meets a new staff team, and in the hospital postpartum ward, yet another staff team. Thus, the study compares continuous midwifery‐led caseload model of care to team midwifery‐led care. | |
| This study compared care provided by general physicians, obstetric nurses and professional midwives in a cluster RCT in Mexico. It does not compare midwife‐led with other models of care throughout pregnancy and birth. Abstract only available. |
RCT: randomised controlled trial
vs: versus
Characteristics of ongoing studies [ordered by study ID]
| Trial name or title | Continuity of midwifery care and gestational weight gain in obese women: a randomised controlled trial. |
| Methods | A 2‐arm unblinded randomised controlled trial. |
| Participants | Primigravid women with a BMI ≥ 30 who are less than 17 weeks' gestation, recruited from maternity services in Victoria, Australia. |
| Interventions | Women allocated to the intervention arm will be cared for in a midwifery continuity of care model and receive an informational leaflet on managing weight gain in pregnancy. Women allocated to the control group will receive routine care in addition to the same informational leaflet. |
| Outcomes | The primary outcome is the proportion of women with a gestational weight gain within IOM guidelines. Secondary outcomes: Provision of care in line with the standards within the UK guidelines, Women's satisfaction with care. |
| Starting date | Unclear. |
| Contact information | [email protected], School of Nursing and Midwifery, Deakin University, Geelong Waterfront campus, 1 Gheringhap St, Geelong Victoria, 3217, Australia. |
| Notes | Trial Registration: Australian New Zealand Clinical Trials Registry ACTRN12610001078044. |
| Trial name or title | The M@NGO Study (Midwives at New Group practice Options): A randomised controlled trial of caseload midwifery care. |
| Methods | 2‐arm unblinded randomised controlled trial. |
| Participants | Women at low risk (as defined by trial authors) over 18 years booking at the participating hospital at or less than 24 weeks pregnant with a single, live fetus. |
| Interventions | Caseload midwifery care compared with standard maternity care. |
| Outcomes | Primary outcome measures: caesarean section rates; instrumental birth rates; rates of admission to neonatal intensive care. |
| Starting date | |
| Contact information | Sally Tracy Sydney Nursing School, University of Sydney, Sydney [[email protected]] |
| Notes | NHRMC grant 510207 |
BMI: body mass index
IOM: Institute of Medicine
Data and analyses
| Outcome or subgroup title | No. of studies | No. of participants | Statistical method | Effect size |
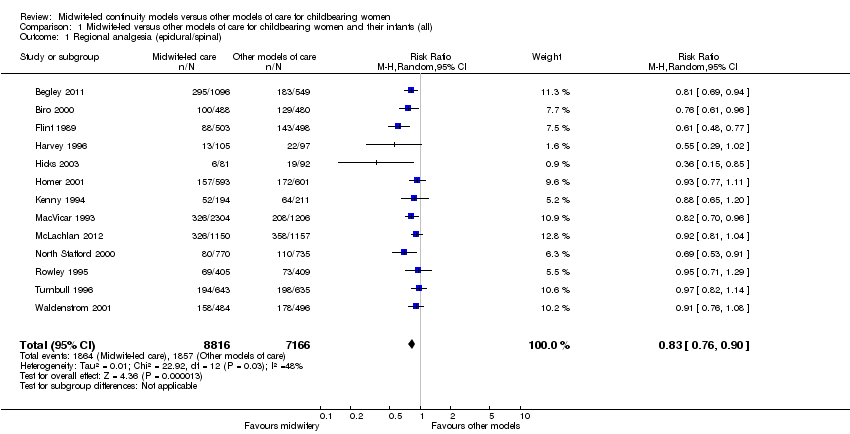
| 1 Regional analgesia (epidural/spinal) Show forest plot | 13 | 15982 | Risk Ratio (M‐H, Random, 95% CI) | 0.83 [0.76, 0.90] |
| Analysis 1.1  Comparison 1 Midwife‐led versus other models of care for childbearing women and their infants (all), Outcome 1 Regional analgesia (epidural/spinal). | ||||
| 2 Caesarean birth Show forest plot | 13 | 15982 | Risk Ratio (M‐H, Random, 95% CI) | 0.93 [0.84, 1.02] |
| Analysis 1.2  Comparison 1 Midwife‐led versus other models of care for childbearing women and their infants (all), Outcome 2 Caesarean birth. | ||||
| 3 Instrumental vaginal birth (forceps/vacuum) Show forest plot | 12 | 15809 | Risk Ratio (M‐H, Random, 95% CI) | 0.88 [0.81, 0.96] |
| Analysis 1.3  Comparison 1 Midwife‐led versus other models of care for childbearing women and their infants (all), Outcome 3 Instrumental vaginal birth (forceps/vacuum). | ||||
| 4 Spontaneous vaginal birth (as defined by trial authors) Show forest plot | 11 | 14995 | Risk Ratio (M‐H, Random, 95% CI) | 1.05 [1.03, 1.08] |
| Analysis 1.4 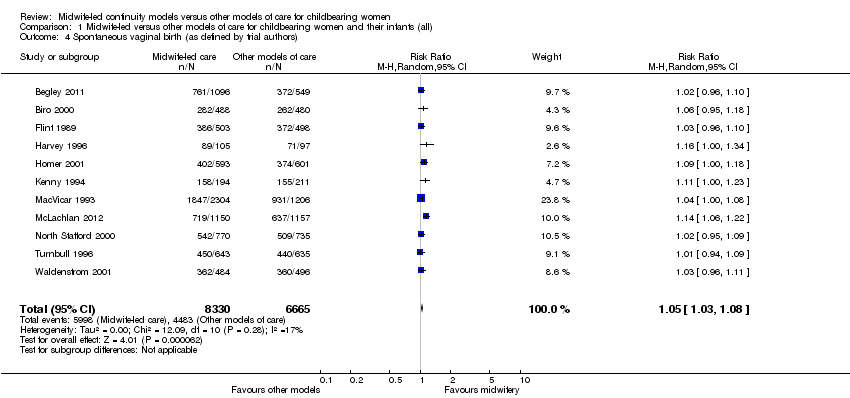 Comparison 1 Midwife‐led versus other models of care for childbearing women and their infants (all), Outcome 4 Spontaneous vaginal birth (as defined by trial authors). | ||||
| 5 Intact perineum Show forest plot | 9 | 11494 | Risk Ratio (M‐H, Random, 95% CI) | 1.03 [0.94, 1.13] |
| Analysis 1.5 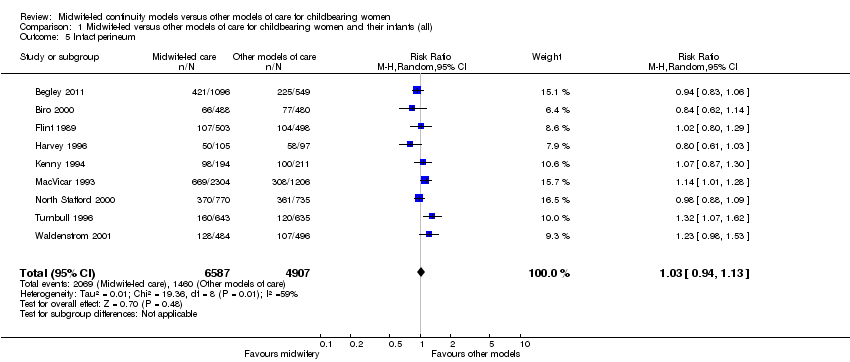 Comparison 1 Midwife‐led versus other models of care for childbearing women and their infants (all), Outcome 5 Intact perineum. | ||||
| 6 Preterm birth (< 37 weeks) Show forest plot | 7 | 11546 | Risk Ratio (M‐H, Random, 95% CI) | 0.77 [0.62, 0.94] |
| Analysis 1.6 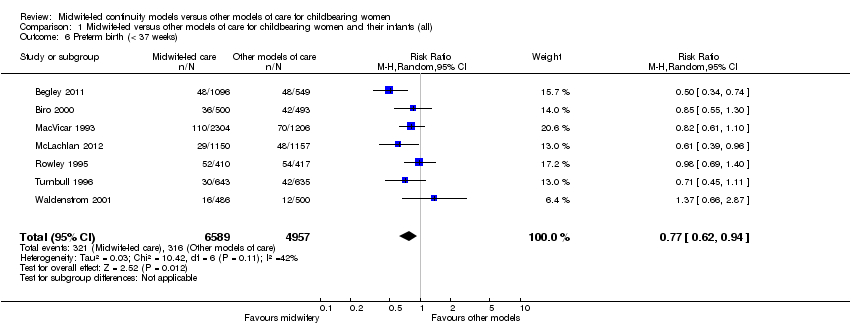 Comparison 1 Midwife‐led versus other models of care for childbearing women and their infants (all), Outcome 6 Preterm birth (< 37 weeks). | ||||
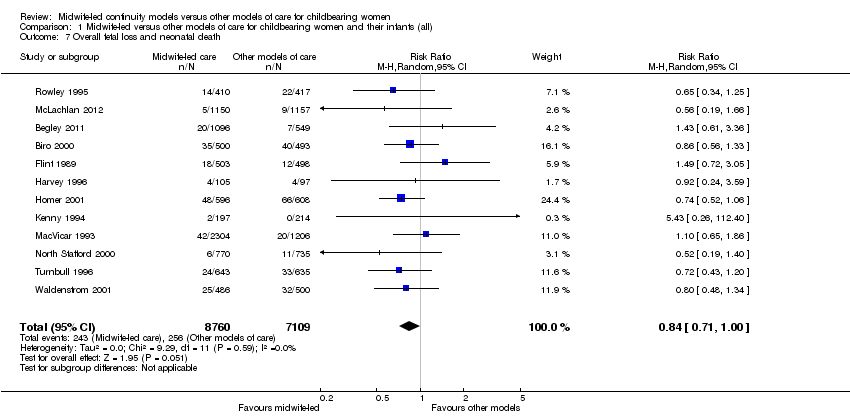
| 7 Overall fetal loss and neonatal death Show forest plot | 12 | 15869 | Risk Ratio (M‐H, Random, 95% CI) | 0.84 [0.71, 1.00] |
| Analysis 1.7  Comparison 1 Midwife‐led versus other models of care for childbearing women and their infants (all), Outcome 7 Overall fetal loss and neonatal death. | ||||
| 8 Antenatal hospitalisation Show forest plot | 6 | 6039 | Risk Ratio (M‐H, Random, 95% CI) | 0.93 [0.83, 1.05] |
| Analysis 1.8  Comparison 1 Midwife‐led versus other models of care for childbearing women and their infants (all), Outcome 8 Antenatal hospitalisation. | ||||
| 9 Antepartum haemorrhage Show forest plot | 4 | 3654 | Risk Ratio (M‐H, Random, 95% CI) | 0.89 [0.57, 1.40] |
| Analysis 1.9 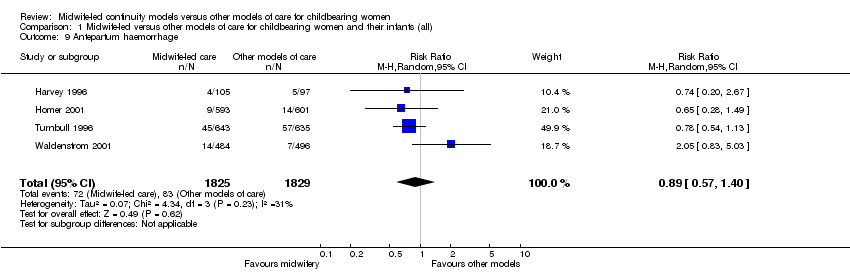 Comparison 1 Midwife‐led versus other models of care for childbearing women and their infants (all), Outcome 9 Antepartum haemorrhage. | ||||
| 10 Induction of labour Show forest plot | 12 | 15809 | Risk Ratio (M‐H, Random, 95% CI) | 0.95 [0.86, 1.03] |
| Analysis 1.10  Comparison 1 Midwife‐led versus other models of care for childbearing women and their infants (all), Outcome 10 Induction of labour. | ||||
| 11 Amniotomy Show forest plot | 4 | 3253 | Risk Ratio (M‐H, Random, 95% CI) | 0.80 [0.66, 0.98] |
| Analysis 1.11  Comparison 1 Midwife‐led versus other models of care for childbearing women and their infants (all), Outcome 11 Amniotomy. | ||||
| 12 Augmentation/artificial oxytocin during labour Show forest plot | 11 | 13502 | Risk Ratio (M‐H, Random, 95% CI) | 0.89 [0.79, 1.01] |
| Analysis 1.12  Comparison 1 Midwife‐led versus other models of care for childbearing women and their infants (all), Outcome 12 Augmentation/artificial oxytocin during labour. | ||||
| 13 No intrapartum analgesia/anaesthesia Show forest plot | 6 | 8807 | Risk Ratio (M‐H, Random, 95% CI) | 1.16 [1.04, 1.31] |
| Analysis 1.13  Comparison 1 Midwife‐led versus other models of care for childbearing women and their infants (all), Outcome 13 No intrapartum analgesia/anaesthesia. | ||||
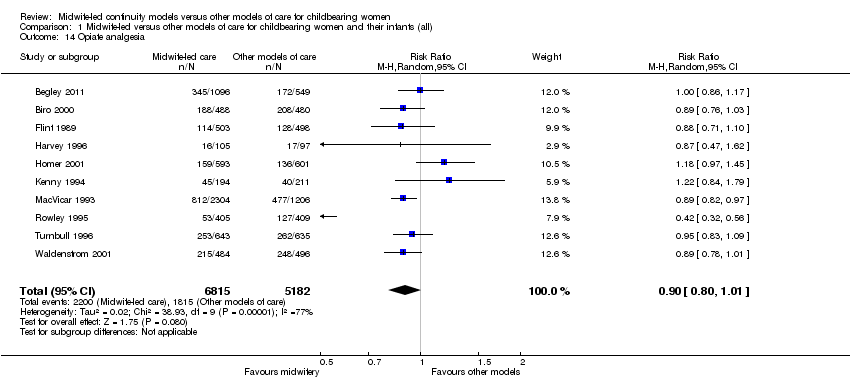
| 14 Opiate analgesia Show forest plot | 10 | 11997 | Risk Ratio (M‐H, Random, 95% CI) | 0.90 [0.80, 1.01] |
| Analysis 1.14  Comparison 1 Midwife‐led versus other models of care for childbearing women and their infants (all), Outcome 14 Opiate analgesia. | ||||
| 15 Attendance at birth by known midwife Show forest plot | 6 | 5225 | Risk Ratio (M‐H, Random, 95% CI) | 7.83 [4.15, 14.80] |
| Analysis 1.15 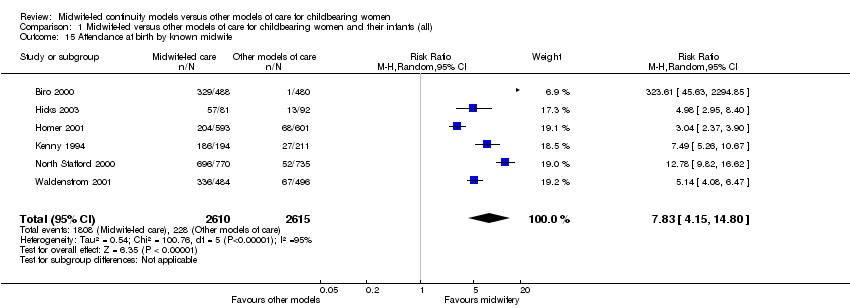 Comparison 1 Midwife‐led versus other models of care for childbearing women and their infants (all), Outcome 15 Attendance at birth by known midwife. | ||||
| 16 Episiotomy Show forest plot | 13 | 15982 | Risk Ratio (M‐H, Random, 95% CI) | 0.84 [0.76, 0.92] |
| Analysis 1.16  Comparison 1 Midwife‐led versus other models of care for childbearing women and their infants (all), Outcome 16 Episiotomy. | ||||
| 17 Perineal laceration requiring suturing Show forest plot | 9 | 13412 | Risk Ratio (M‐H, Random, 95% CI) | 1.02 [0.95, 1.10] |
| Analysis 1.17  Comparison 1 Midwife‐led versus other models of care for childbearing women and their infants (all), Outcome 17 Perineal laceration requiring suturing. | ||||
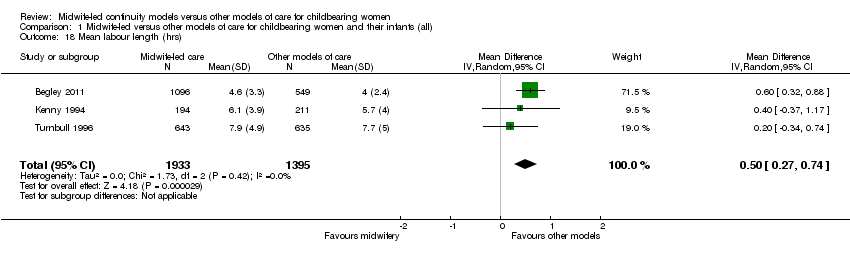
| 18 Mean labour length (hrs) Show forest plot | 3 | 3328 | Mean Difference (IV, Random, 95% CI) | 0.50 [0.27, 0.74] |
| Analysis 1.18  Comparison 1 Midwife‐led versus other models of care for childbearing women and their infants (all), Outcome 18 Mean labour length (hrs). | ||||
| 19 Postpartum haemorrhage (as defined by trial authors) Show forest plot | 9 | 12522 | Risk Ratio (M‐H, Random, 95% CI) | 0.97 [0.84, 1.11] |
| Analysis 1.19 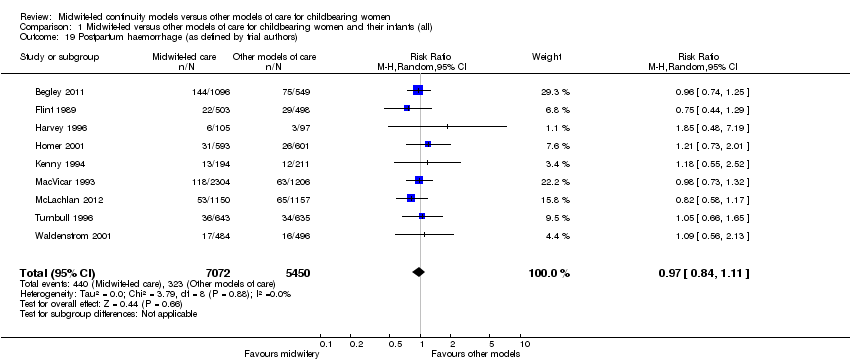 Comparison 1 Midwife‐led versus other models of care for childbearing women and their infants (all), Outcome 19 Postpartum haemorrhage (as defined by trial authors). | ||||
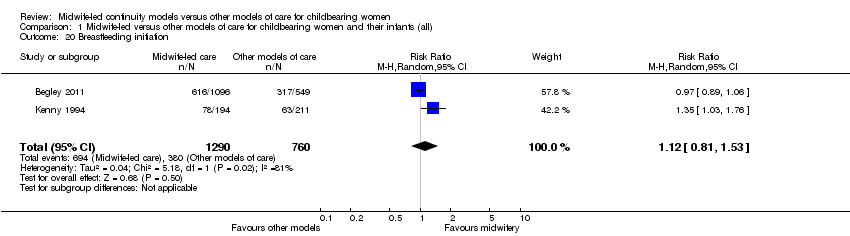
| 20 Breastfeeding initiation Show forest plot | 2 | 2050 | Risk Ratio (M‐H, Random, 95% CI) | 1.12 [0.81, 1.53] |
| Analysis 1.20  Comparison 1 Midwife‐led versus other models of care for childbearing women and their infants (all), Outcome 20 Breastfeeding initiation. | ||||
| 21 Duration of postnatal hospital stay (days) Show forest plot | 3 | 3593 | Mean Difference (IV, Random, 95% CI) | ‐0.10 [‐0.29, 0.09] |
| Analysis 1.21 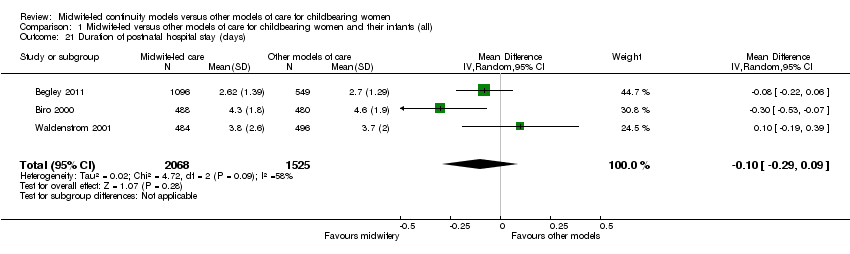 Comparison 1 Midwife‐led versus other models of care for childbearing women and their infants (all), Outcome 21 Duration of postnatal hospital stay (days). | ||||
| 22 Low birthweight (< 2500 g) Show forest plot | 6 | 9766 | Risk Ratio (M‐H, Random, 95% CI) | 0.98 [0.83, 1.16] |
| Analysis 1.22 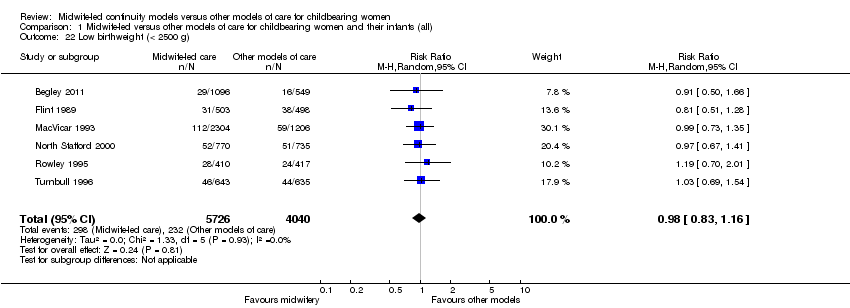 Comparison 1 Midwife‐led versus other models of care for childbearing women and their infants (all), Outcome 22 Low birthweight (< 2500 g). | ||||
| 23 5‐minute Apgar score below or equal to 7 Show forest plot | 10 | 10854 | Risk Ratio (M‐H, Random, 95% CI) | 0.99 [0.70, 1.41] |
| Analysis 1.23  Comparison 1 Midwife‐led versus other models of care for childbearing women and their infants (all), Outcome 23 5‐minute Apgar score below or equal to 7. | ||||
| 24 Neonatal convulsions (as defined by trial authors) Show forest plot | 2 | 2923 | Risk Ratio (M‐H, Random, 95% CI) | 0.91 [0.14, 5.74] |
| Analysis 1.24 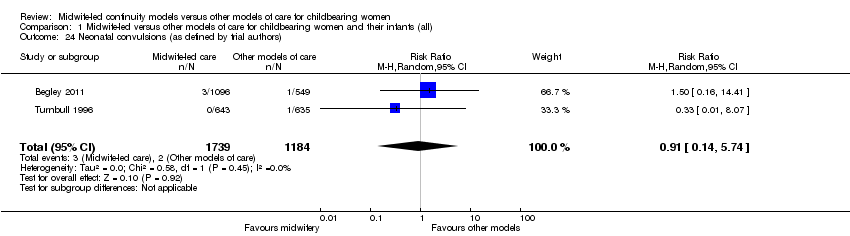 Comparison 1 Midwife‐led versus other models of care for childbearing women and their infants (all), Outcome 24 Neonatal convulsions (as defined by trial authors). | ||||
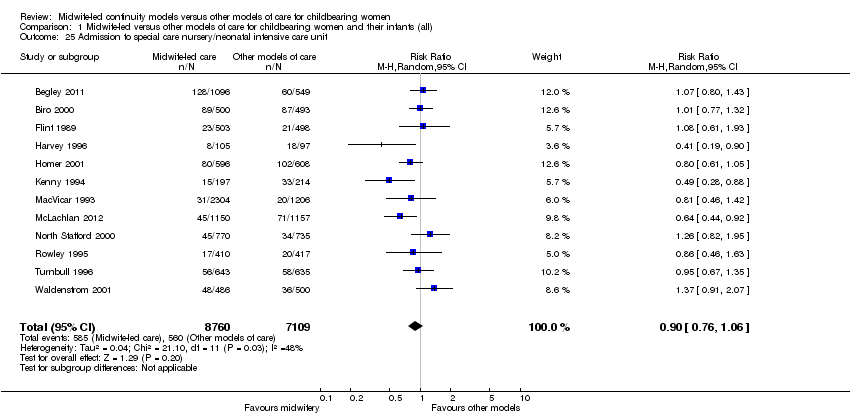
| 25 Admission to special care nursery/neonatal intensive care unit Show forest plot | 12 | 15869 | Risk Ratio (M‐H, Random, 95% CI) | 0.90 [0.76, 1.06] |
| Analysis 1.25  Comparison 1 Midwife‐led versus other models of care for childbearing women and their infants (all), Outcome 25 Admission to special care nursery/neonatal intensive care unit. | ||||
| 26 Mean length of neonatal hospital stay (days) Show forest plot | 2 | 1979 | Mean Difference (IV, Random, 95% CI) | ‐3.63 [‐7.57, 0.30] |
| Analysis 1.26 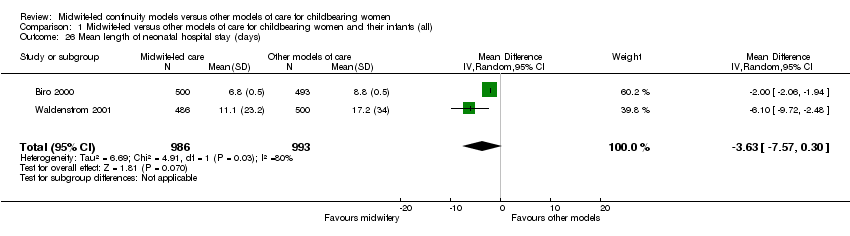 Comparison 1 Midwife‐led versus other models of care for childbearing women and their infants (all), Outcome 26 Mean length of neonatal hospital stay (days). | ||||
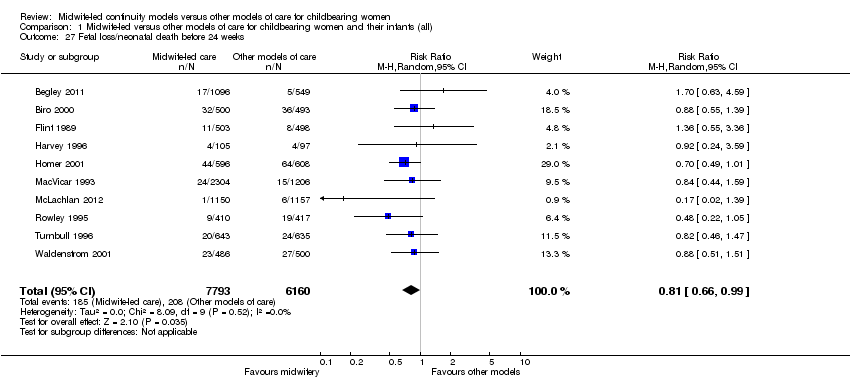
| 27 Fetal loss/neonatal death before 24 weeks Show forest plot | 10 | 13953 | Risk Ratio (M‐H, Random, 95% CI) | 0.81 [0.66, 0.99] |
| Analysis 1.27  Comparison 1 Midwife‐led versus other models of care for childbearing women and their infants (all), Outcome 27 Fetal loss/neonatal death before 24 weeks. | ||||
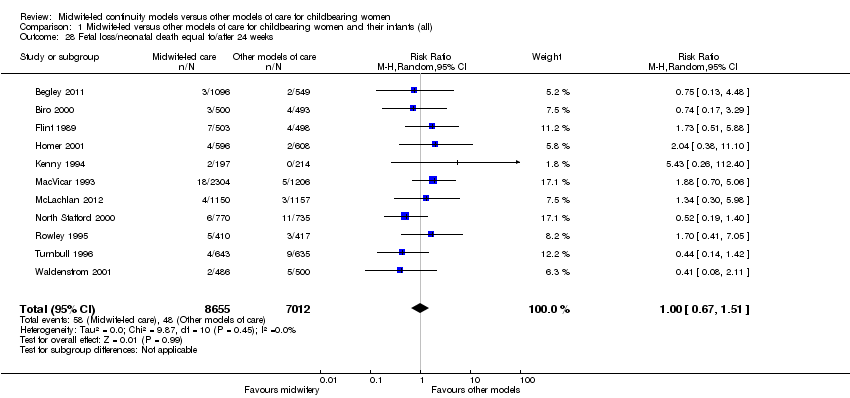
| 28 Fetal loss/neonatal death equal to/after 24 weeks Show forest plot | 11 | 15667 | Risk Ratio (M‐H, Random, 95% CI) | 1.00 [0.67, 1.51] |
| Analysis 1.28  Comparison 1 Midwife‐led versus other models of care for childbearing women and their infants (all), Outcome 28 Fetal loss/neonatal death equal to/after 24 weeks. | ||||
| Outcome or subgroup title | No. of studies | No. of participants | Statistical method | Effect size |
| 1 Regional analgesia (epidural/spinal) Show forest plot | 13 | 15982 | Risk Ratio (M‐H, Random, 95% CI) | 0.83 [0.76, 0.90] |
| Analysis 2.1 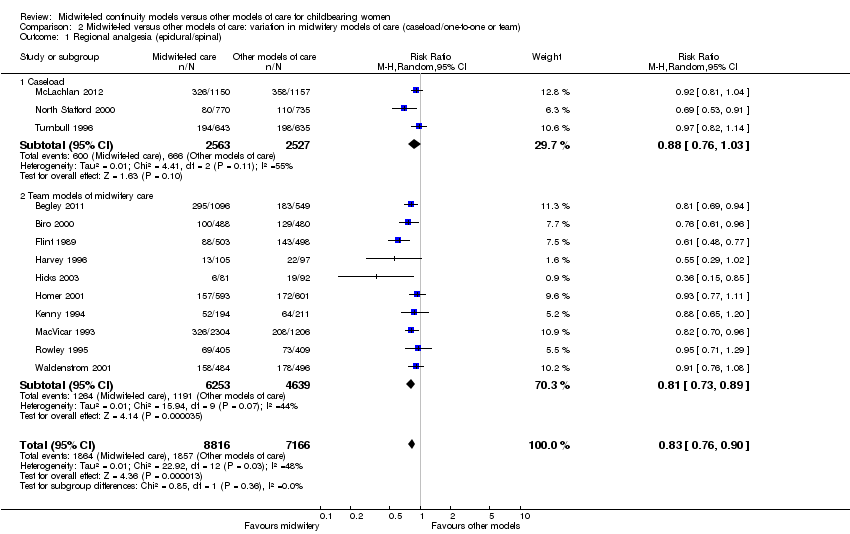 Comparison 2 Midwife‐led versus other models of care: variation in midwifery models of care (caseload/one‐to‐one or team), Outcome 1 Regional analgesia (epidural/spinal). | ||||
| 1.1 Caseload | 3 | 5090 | Risk Ratio (M‐H, Random, 95% CI) | 0.88 [0.76, 1.03] |
| 1.2 Team models of midwifery care | 10 | 10892 | Risk Ratio (M‐H, Random, 95% CI) | 0.81 [0.73, 0.89] |
| 2 Caesarean birth Show forest plot | 13 | 15966 | Risk Ratio (M‐H, Random, 95% CI) | 0.93 [0.84, 1.02] |
| Analysis 2.2  Comparison 2 Midwife‐led versus other models of care: variation in midwifery models of care (caseload/one‐to‐one or team), Outcome 2 Caesarean birth. | ||||
| 2.1 Caseload | 3 | 5090 | Risk Ratio (M‐H, Random, 95% CI) | 0.93 [0.75, 1.17] |
| 2.2 Team models of midwifery care | 10 | 10876 | Risk Ratio (M‐H, Random, 95% CI) | 0.94 [0.84, 1.05] |
| 3 Instrumental vaginal birth (forceps/vacuum) Show forest plot | 12 | 16273 | Risk Ratio (M‐H, Random, 95% CI) | 0.89 [0.82, 0.96] |
| Analysis 2.3  Comparison 2 Midwife‐led versus other models of care: variation in midwifery models of care (caseload/one‐to‐one or team), Outcome 3 Instrumental vaginal birth (forceps/vacuum). | ||||
| 3.1 Caseload | 3 | 5090 | Risk Ratio (M‐H, Random, 95% CI) | 0.91 [0.80, 1.04] |
| 3.2 Team models of midwifery care | 9 | 11183 | Risk Ratio (M‐H, Random, 95% CI) | 0.88 [0.79, 0.97] |
| 4 Spontaneous vaginal birth (as defined by trial authors) Show forest plot | 11 | 14995 | Risk Ratio (M‐H, Random, 95% CI) | 1.05 [1.03, 1.08] |
| Analysis 2.4 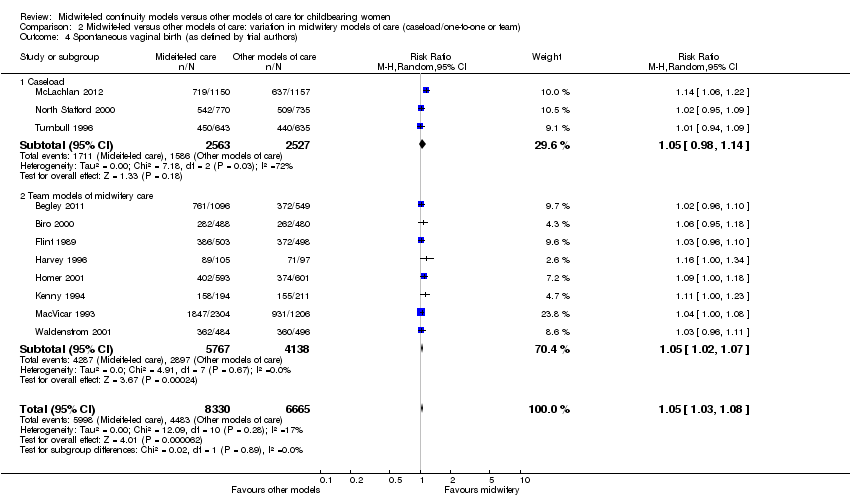 Comparison 2 Midwife‐led versus other models of care: variation in midwifery models of care (caseload/one‐to‐one or team), Outcome 4 Spontaneous vaginal birth (as defined by trial authors). | ||||
| 4.1 Caseload | 3 | 5090 | Risk Ratio (M‐H, Random, 95% CI) | 1.05 [0.98, 1.14] |
| 4.2 Team models of midwifery care | 8 | 9905 | Risk Ratio (M‐H, Random, 95% CI) | 1.05 [1.02, 1.07] |
| 5 Intact perineum Show forest plot | 9 | 11494 | Risk Ratio (M‐H, Random, 95% CI) | 1.03 [0.94, 1.13] |
| Analysis 2.5  Comparison 2 Midwife‐led versus other models of care: variation in midwifery models of care (caseload/one‐to‐one or team), Outcome 5 Intact perineum. | ||||
| 5.1 Caseload | 2 | 2783 | Risk Ratio (M‐H, Random, 95% CI) | 1.12 [0.83, 1.50] |
| 5.2 Team | 7 | 8711 | Risk Ratio (M‐H, Random, 95% CI) | 1.01 [0.91, 1.13] |
| 6 Preterm birth (< 37 weeks) Show forest plot | 7 | 11546 | Risk Ratio (M‐H, Random, 95% CI) | 0.77 [0.62, 0.94] |
| Analysis 2.6  Comparison 2 Midwife‐led versus other models of care: variation in midwifery models of care (caseload/one‐to‐one or team), Outcome 6 Preterm birth (< 37 weeks). | ||||
| 6.1 Caseload | 2 | 3585 | Risk Ratio (M‐H, Random, 95% CI) | 0.65 [0.47, 0.90] |
| 6.2 Team | 5 | 7961 | Risk Ratio (M‐H, Random, 95% CI) | 0.81 [0.62, 1.07] |
| 7 Overall fetal loss and neonatal death Show forest plot | 12 | 15835 | Risk Ratio (M‐H, Random, 95% CI) | 0.84 [0.70, 1.00] |
| Analysis 2.7  Comparison 2 Midwife‐led versus other models of care: variation in midwifery models of care (caseload/one‐to‐one or team), Outcome 7 Overall fetal loss and neonatal death. | ||||
| 7.1 Caseload | 3 | 5090 | Risk Ratio (M‐H, Random, 95% CI) | 0.65 [0.43, 0.99] |
| 7.2 Team | 9 | 10745 | Risk Ratio (M‐H, Random, 95% CI) | 0.89 [0.73, 1.07] |
| Outcome or subgroup title | No. of studies | No. of participants | Statistical method | Effect size |
| 1 Regional analgesia (epidural/spinal) Show forest plot | 13 | 15982 | Risk Ratio (M‐H, Random, 95% CI) | 0.83 [0.76, 0.90] |
| Analysis 3.1 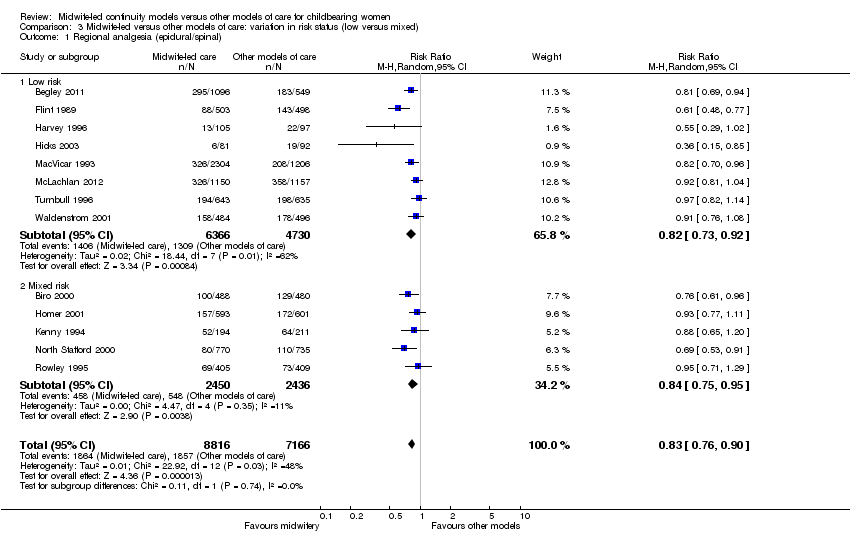 Comparison 3 Midwife‐led versus other models of care: variation in risk status (low versus mixed), Outcome 1 Regional analgesia (epidural/spinal). | ||||
| 1.1 Low risk | 8 | 11096 | Risk Ratio (M‐H, Random, 95% CI) | 0.82 [0.73, 0.92] |
| 1.2 Mixed risk | 5 | 4886 | Risk Ratio (M‐H, Random, 95% CI) | 0.84 [0.75, 0.95] |
| 2 Caesarean birth Show forest plot | 13 | 15982 | Risk Ratio (M‐H, Random, 95% CI) | 0.93 [0.84, 1.02] |
| Analysis 3.2  Comparison 3 Midwife‐led versus other models of care: variation in risk status (low versus mixed), Outcome 2 Caesarean birth. | ||||
| 2.1 Low risk | 8 | 11096 | Risk Ratio (M‐H, Random, 95% CI) | 0.91 [0.79, 1.06] |
| 2.2 Mixed risk | 5 | 4886 | Risk Ratio (M‐H, Random, 95% CI) | 0.96 [0.84, 1.09] |
| 3 Instrumental vaginal birth (forceps/vacuum) Show forest plot | 12 | 15809 | Risk Ratio (M‐H, Random, 95% CI) | 0.88 [0.81, 0.96] |
| Analysis 3.3  Comparison 3 Midwife‐led versus other models of care: variation in risk status (low versus mixed), Outcome 3 Instrumental vaginal birth (forceps/vacuum). | ||||
| 3.1 Low risk | 7 | 10923 | Risk Ratio (M‐H, Random, 95% CI) | 0.89 [0.81, 0.99] |
| 3.2 Mixed risk | 5 | 4886 | Risk Ratio (M‐H, Random, 95% CI) | 0.82 [0.65, 1.03] |
| 4 Spontaneous vaginal birth (as defined by trial authors) Show forest plot | 11 | 14995 | Risk Ratio (M‐H, Random, 95% CI) | 1.05 [1.03, 1.08] |
| Analysis 3.4  Comparison 3 Midwife‐led versus other models of care: variation in risk status (low versus mixed), Outcome 4 Spontaneous vaginal birth (as defined by trial authors). | ||||
| 4.1 Low risk | 7 | 10923 | Risk Ratio (M‐H, Random, 95% CI) | 1.05 [1.02, 1.08] |
| 4.2 Mixed risk | 4 | 4072 | Risk Ratio (M‐H, Random, 95% CI) | 1.06 [1.01, 1.10] |
| 5 Intact perineum Show forest plot | 9 | 11494 | Risk Ratio (M‐H, Random, 95% CI) | 1.03 [0.94, 1.13] |
| Analysis 3.5  Comparison 3 Midwife‐led versus other models of care: variation in risk status (low versus mixed), Outcome 5 Intact perineum. | ||||
| 5.1 Low risk | 6 | 8616 | Risk Ratio (M‐H, Random, 95% CI) | 1.06 [0.93, 1.21] |
| 5.2 Mixed risk | 3 | 2878 | Risk Ratio (M‐H, Random, 95% CI) | 0.98 [0.90, 1.07] |
| 6 Preterm birth (< 37 weeks) Show forest plot | 7 | 11546 | Risk Ratio (M‐H, Random, 95% CI) | 0.77 [0.62, 0.94] |
| Analysis 3.6 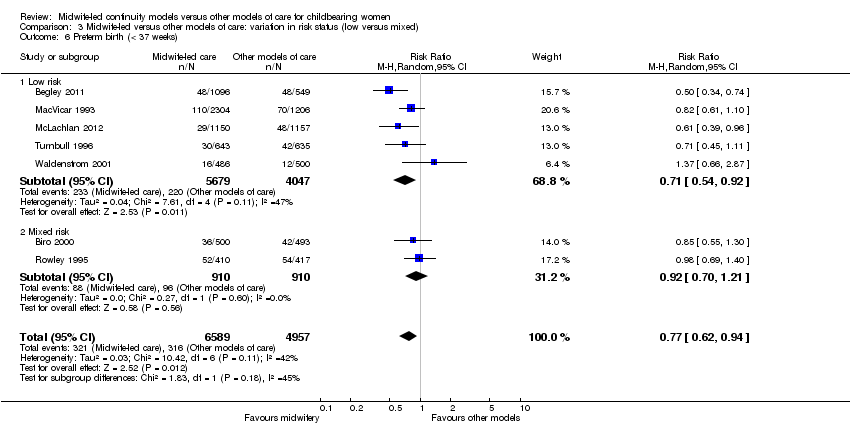 Comparison 3 Midwife‐led versus other models of care: variation in risk status (low versus mixed), Outcome 6 Preterm birth (< 37 weeks). | ||||
| 6.1 Low risk | 5 | 9726 | Risk Ratio (M‐H, Random, 95% CI) | 0.71 [0.54, 0.92] |
| 6.2 Mixed risk | 2 | 1820 | Risk Ratio (M‐H, Random, 95% CI) | 0.92 [0.70, 1.21] |
| 7 Overall fetal loss and neonatal death Show forest plot | 12 | 15835 | Risk Ratio (M‐H, Random, 95% CI) | 0.84 [0.70, 1.00] |
| Analysis 3.7  Comparison 3 Midwife‐led versus other models of care: variation in risk status (low versus mixed), Outcome 7 Overall fetal loss and neonatal death. | ||||
| 7.1 Low risk | 7 | 10895 | Risk Ratio (M‐H, Random, 95% CI) | 0.94 [0.73, 1.20] |
| 7.2 Mixed risk | 5 | 4940 | Risk Ratio (M‐H, Random, 95% CI) | 0.76 [0.59, 0.97] |

'Risk of bias' graph: review authors' judgements about each risk of bias item presented as percentages across all included studies.

'Risk of bias' summary: review authors' judgements about each risk of bias item for each included study.

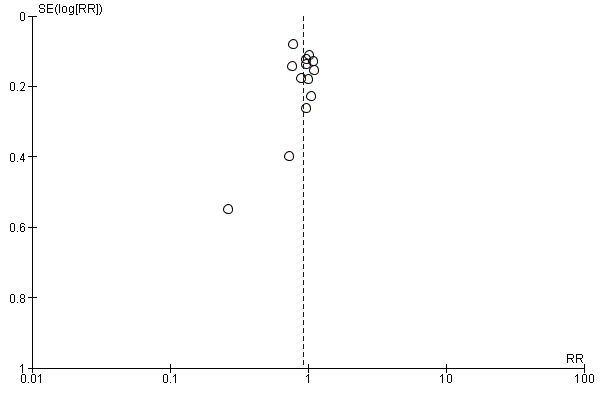
Funnel plot of comparison: 1 Midwife‐led versus other models of care for childbearing women and their infants (all), outcome: 1.1 Regional analgesia (epidural/spinal).
Funnel plot of comparison: 1 Midwife‐led versus other models of care for childbearing women and their infants (all), outcome: 1.2 Caesarean birth.
Funnel plot of comparison: 1 Midwife‐led versus other models of care for childbearing women and their infants (all), outcome: 1.16 Episiotomy.
Comparison 1 Midwife‐led versus other models of care for childbearing women and their infants (all), Outcome 1 Regional analgesia (epidural/spinal).

Comparison 1 Midwife‐led versus other models of care for childbearing women and their infants (all), Outcome 2 Caesarean birth.

Comparison 1 Midwife‐led versus other models of care for childbearing women and their infants (all), Outcome 3 Instrumental vaginal birth (forceps/vacuum).

Comparison 1 Midwife‐led versus other models of care for childbearing women and their infants (all), Outcome 4 Spontaneous vaginal birth (as defined by trial authors).

Comparison 1 Midwife‐led versus other models of care for childbearing women and their infants (all), Outcome 5 Intact perineum.

Comparison 1 Midwife‐led versus other models of care for childbearing women and their infants (all), Outcome 6 Preterm birth (< 37 weeks).
Comparison 1 Midwife‐led versus other models of care for childbearing women and their infants (all), Outcome 7 Overall fetal loss and neonatal death.

Comparison 1 Midwife‐led versus other models of care for childbearing women and their infants (all), Outcome 8 Antenatal hospitalisation.

Comparison 1 Midwife‐led versus other models of care for childbearing women and their infants (all), Outcome 9 Antepartum haemorrhage.

Comparison 1 Midwife‐led versus other models of care for childbearing women and their infants (all), Outcome 10 Induction of labour.

Comparison 1 Midwife‐led versus other models of care for childbearing women and their infants (all), Outcome 11 Amniotomy.

Comparison 1 Midwife‐led versus other models of care for childbearing women and their infants (all), Outcome 12 Augmentation/artificial oxytocin during labour.

Comparison 1 Midwife‐led versus other models of care for childbearing women and their infants (all), Outcome 13 No intrapartum analgesia/anaesthesia.
Comparison 1 Midwife‐led versus other models of care for childbearing women and their infants (all), Outcome 14 Opiate analgesia.

Comparison 1 Midwife‐led versus other models of care for childbearing women and their infants (all), Outcome 15 Attendance at birth by known midwife.

Comparison 1 Midwife‐led versus other models of care for childbearing women and their infants (all), Outcome 16 Episiotomy.

Comparison 1 Midwife‐led versus other models of care for childbearing women and their infants (all), Outcome 17 Perineal laceration requiring suturing.
Comparison 1 Midwife‐led versus other models of care for childbearing women and their infants (all), Outcome 18 Mean labour length (hrs).

Comparison 1 Midwife‐led versus other models of care for childbearing women and their infants (all), Outcome 19 Postpartum haemorrhage (as defined by trial authors).
Comparison 1 Midwife‐led versus other models of care for childbearing women and their infants (all), Outcome 20 Breastfeeding initiation.

Comparison 1 Midwife‐led versus other models of care for childbearing women and their infants (all), Outcome 21 Duration of postnatal hospital stay (days).

Comparison 1 Midwife‐led versus other models of care for childbearing women and their infants (all), Outcome 22 Low birthweight (< 2500 g).

Comparison 1 Midwife‐led versus other models of care for childbearing women and their infants (all), Outcome 23 5‐minute Apgar score below or equal to 7.

Comparison 1 Midwife‐led versus other models of care for childbearing women and their infants (all), Outcome 24 Neonatal convulsions (as defined by trial authors).
Comparison 1 Midwife‐led versus other models of care for childbearing women and their infants (all), Outcome 25 Admission to special care nursery/neonatal intensive care unit.

Comparison 1 Midwife‐led versus other models of care for childbearing women and their infants (all), Outcome 26 Mean length of neonatal hospital stay (days).
Comparison 1 Midwife‐led versus other models of care for childbearing women and their infants (all), Outcome 27 Fetal loss/neonatal death before 24 weeks.
Comparison 1 Midwife‐led versus other models of care for childbearing women and their infants (all), Outcome 28 Fetal loss/neonatal death equal to/after 24 weeks.

Comparison 2 Midwife‐led versus other models of care: variation in midwifery models of care (caseload/one‐to‐one or team), Outcome 1 Regional analgesia (epidural/spinal).

Comparison 2 Midwife‐led versus other models of care: variation in midwifery models of care (caseload/one‐to‐one or team), Outcome 2 Caesarean birth.

Comparison 2 Midwife‐led versus other models of care: variation in midwifery models of care (caseload/one‐to‐one or team), Outcome 3 Instrumental vaginal birth (forceps/vacuum).

Comparison 2 Midwife‐led versus other models of care: variation in midwifery models of care (caseload/one‐to‐one or team), Outcome 4 Spontaneous vaginal birth (as defined by trial authors).

Comparison 2 Midwife‐led versus other models of care: variation in midwifery models of care (caseload/one‐to‐one or team), Outcome 5 Intact perineum.
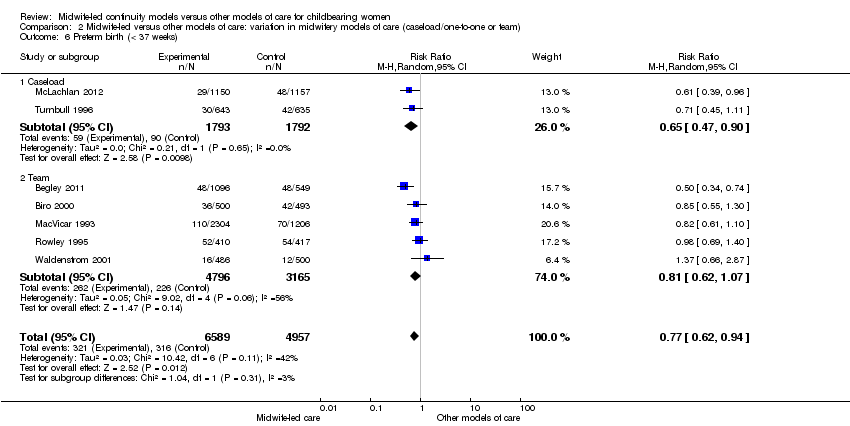
Comparison 2 Midwife‐led versus other models of care: variation in midwifery models of care (caseload/one‐to‐one or team), Outcome 6 Preterm birth (< 37 weeks).

Comparison 2 Midwife‐led versus other models of care: variation in midwifery models of care (caseload/one‐to‐one or team), Outcome 7 Overall fetal loss and neonatal death.

Comparison 3 Midwife‐led versus other models of care: variation in risk status (low versus mixed), Outcome 1 Regional analgesia (epidural/spinal).

Comparison 3 Midwife‐led versus other models of care: variation in risk status (low versus mixed), Outcome 2 Caesarean birth.

Comparison 3 Midwife‐led versus other models of care: variation in risk status (low versus mixed), Outcome 3 Instrumental vaginal birth (forceps/vacuum).

Comparison 3 Midwife‐led versus other models of care: variation in risk status (low versus mixed), Outcome 4 Spontaneous vaginal birth (as defined by trial authors).

Comparison 3 Midwife‐led versus other models of care: variation in risk status (low versus mixed), Outcome 5 Intact perineum.

Comparison 3 Midwife‐led versus other models of care: variation in risk status (low versus mixed), Outcome 6 Preterm birth (< 37 weeks).

Comparison 3 Midwife‐led versus other models of care: variation in risk status (low versus mixed), Outcome 7 Overall fetal loss and neonatal death.
| Satisfaction | Intervention (n/N) | Control (n/N) | Relative rate | 95% CI | Statistical test | P value |
| Staff in labour (very caring) | 252/275 (92%) | 208/256 (81%) | 1.1 | 1.0‐1.2 | ||
| Experience of labour (wonderful/enjoyable) | 104/246 (42%) | 72/223 (32%) | 1.3 | 1.0‐1.8 | ||
| Satisfaction with pain relief (very satisfied) | 121/209 (58%) | 104/205 (51%) | 1.1 | 0.9‐1.4 | ||
| Very well prepared for labour | 144/275 (52%) | 102/254 (40%) | 1.3 | 1.0‐1.7 | ||
| N = 1663 | N = 826 | Difference | ||||
| Very satisfied with antenatal care | 52% | 44% | 8.3% | 4.1‐12.5 | ||
| Very satisfied with care during labour | 73% | 60% | 12.9% | 9.1‐16.8 | ||
| N = 213 | N = 233 | |||||
| Carer skill, attitude and communication (antenatal care) | 57.1/60 | 47.7/60 | t = 12.4 | 0.0001 | ||
| Convenience and waiting (antenatal care) | 14.8/20 | 10.9/20 | t = 10.1 | 0.0001 | ||
| Expectation of labour/birth (antenatal care) | 9.8/18 | 9.3/18 | t = 1.4 | 0.16 | ||
| Asking questions (antenatal care) | 8.5/12 | 6.9/12 | t = 6.6 | 0.0001 | ||
| Information/communication (labour and birth) | 28.3/30 | 24.8/30 | t = 7.48 | 0.0001 | ||
| Coping with labour (labour and birth) | 20.9/30 | 19.3/30 | t = 2.83 | 0.005 | ||
| Midwife skill/caring (labour and birth) | 22.7/24 | 21.3/24 | t = 3.44 | 0.0007 | ||
| Help and advice (postnatal care) | 21.0/24 | 19.7/24 | t = 1.88 | 0.06 | ||
| Midwife skill and communication (postnatal care) | 16.6/18 | 15.4/18 | t = 4.48 | 0.0001 | ||
| Managing baby (postnatal care) | 8.7/12 | 8.5/12 | t = 0.77 | 0.77 | ||
| Self‐rated health (postnatal care) | 7.5/12 | 7.1/12 | t = 1.67 | 0.10 | ||
| OR | ||||||
| Encouraged to ask questions | N/A | 4.22 | 2.72‐6.55 | |||
| Given answers they could understand | N/A | 3.03 | 1.33‐7.04 | |||
| Able to discuss anxieties | N/A | 3.60 | 2.28‐5.69 | |||
| Always had choices explained to them | N/A | 4.17 | 1.93‐9.18 | |||
| Participation in decision making | N/A | 2.95 | 1.22‐7.27 | |||
| Midwives interested in woman as a person | N/A | 7.50 | 4.42‐12.80 | |||
| Midwives always friendly | N/A | 3.48 | 1.92 ‐ 6.35 | |||
| n/N | n/N | Mean difference ‐ satisfaction score | ||||
| Antenatal care | 534/648 | 487/651 | 0.48 | 0.55‐0.41 | ||
| Intrapartum care | 445/648 | 380/651 | 0.28 | 0.37‐0.18 | ||
| Hospital‐based postnatal care | 445/648 | 380/651 | 0.57 | 0.70‐0.45 | ||
| Home‐based postnatal care | 445/648 | 380/651 | 0.33 | 0.42‐0.25 | ||
| % | % | OR | ||||
| Overall antenatal care was very good (strongly agree) | 58.2% | 39.7% | 2.22 | 1.66‐2.95 | < 0.001 | |
| Happy with the physical aspect of intrapartum care (strongly agree) | 58.6% | 42.5% | 1.94 | 1.46‐2.59 | < 0.001 | |
| Happy with the emotional aspect of intrapartum care (strongly agree) | 58.8% | 44.0% | 1.78 | 1.34‐2.38 | < 0.001 | |
| Overall postnatal care was very good (strongly agree) | 37.6% | 33.2% | 1.27 | 0.97‐1.67 | 0.08 | |
| Care and sensitivity of staff (antenatal) | 1.32 | 1.77 | Mean difference? | 0.0000 | ||
| Care and sensitivity of staff (labour and delivery) | 1.26 | 1.58 | Mean difference? | 0.008 | ||
| Care and sensitivity of staff (postpartum at home) | 1.24 | 1.57 | Mean difference? | 0.0000 | ||
| Labour and Delivery Satisfaction Index + | 211 | 185 | 26 | 18.8‐33.1 | 0.001 | |
| Satisfaction with antenatal care (very good) | 195/344 (57%) | 100/287 (35%) | 1.24 | 1.13‐1.36 | 0.001 | |
| Satisfaction with intrapartum care (very good) | 215/241 (63%) | 134/282 (47%) | 1.11 | 1.03‐1.20 | 0.01 | |
| Satisfaction with postpartum care in hospital (very good) | 141/344 (41%) | 102/284 (31%) | 0.92 | 0.82‐1.04 | 0.22 | |
| *: 99% Confidence interval (CI) for Flint study was reported | ||||||
| Outcome or subgroup title | No. of studies | No. of participants | Statistical method | Effect size |
| 1 Regional analgesia (epidural/spinal) Show forest plot | 13 | 15982 | Risk Ratio (M‐H, Random, 95% CI) | 0.83 [0.76, 0.90] |
| 2 Caesarean birth Show forest plot | 13 | 15982 | Risk Ratio (M‐H, Random, 95% CI) | 0.93 [0.84, 1.02] |
| 3 Instrumental vaginal birth (forceps/vacuum) Show forest plot | 12 | 15809 | Risk Ratio (M‐H, Random, 95% CI) | 0.88 [0.81, 0.96] |
| 4 Spontaneous vaginal birth (as defined by trial authors) Show forest plot | 11 | 14995 | Risk Ratio (M‐H, Random, 95% CI) | 1.05 [1.03, 1.08] |
| 5 Intact perineum Show forest plot | 9 | 11494 | Risk Ratio (M‐H, Random, 95% CI) | 1.03 [0.94, 1.13] |
| 6 Preterm birth (< 37 weeks) Show forest plot | 7 | 11546 | Risk Ratio (M‐H, Random, 95% CI) | 0.77 [0.62, 0.94] |
| 7 Overall fetal loss and neonatal death Show forest plot | 12 | 15869 | Risk Ratio (M‐H, Random, 95% CI) | 0.84 [0.71, 1.00] |
| 8 Antenatal hospitalisation Show forest plot | 6 | 6039 | Risk Ratio (M‐H, Random, 95% CI) | 0.93 [0.83, 1.05] |
| 9 Antepartum haemorrhage Show forest plot | 4 | 3654 | Risk Ratio (M‐H, Random, 95% CI) | 0.89 [0.57, 1.40] |
| 10 Induction of labour Show forest plot | 12 | 15809 | Risk Ratio (M‐H, Random, 95% CI) | 0.95 [0.86, 1.03] |
| 11 Amniotomy Show forest plot | 4 | 3253 | Risk Ratio (M‐H, Random, 95% CI) | 0.80 [0.66, 0.98] |
| 12 Augmentation/artificial oxytocin during labour Show forest plot | 11 | 13502 | Risk Ratio (M‐H, Random, 95% CI) | 0.89 [0.79, 1.01] |
| 13 No intrapartum analgesia/anaesthesia Show forest plot | 6 | 8807 | Risk Ratio (M‐H, Random, 95% CI) | 1.16 [1.04, 1.31] |
| 14 Opiate analgesia Show forest plot | 10 | 11997 | Risk Ratio (M‐H, Random, 95% CI) | 0.90 [0.80, 1.01] |
| 15 Attendance at birth by known midwife Show forest plot | 6 | 5225 | Risk Ratio (M‐H, Random, 95% CI) | 7.83 [4.15, 14.80] |
| 16 Episiotomy Show forest plot | 13 | 15982 | Risk Ratio (M‐H, Random, 95% CI) | 0.84 [0.76, 0.92] |
| 17 Perineal laceration requiring suturing Show forest plot | 9 | 13412 | Risk Ratio (M‐H, Random, 95% CI) | 1.02 [0.95, 1.10] |
| 18 Mean labour length (hrs) Show forest plot | 3 | 3328 | Mean Difference (IV, Random, 95% CI) | 0.50 [0.27, 0.74] |
| 19 Postpartum haemorrhage (as defined by trial authors) Show forest plot | 9 | 12522 | Risk Ratio (M‐H, Random, 95% CI) | 0.97 [0.84, 1.11] |
| 20 Breastfeeding initiation Show forest plot | 2 | 2050 | Risk Ratio (M‐H, Random, 95% CI) | 1.12 [0.81, 1.53] |
| 21 Duration of postnatal hospital stay (days) Show forest plot | 3 | 3593 | Mean Difference (IV, Random, 95% CI) | ‐0.10 [‐0.29, 0.09] |
| 22 Low birthweight (< 2500 g) Show forest plot | 6 | 9766 | Risk Ratio (M‐H, Random, 95% CI) | 0.98 [0.83, 1.16] |
| 23 5‐minute Apgar score below or equal to 7 Show forest plot | 10 | 10854 | Risk Ratio (M‐H, Random, 95% CI) | 0.99 [0.70, 1.41] |
| 24 Neonatal convulsions (as defined by trial authors) Show forest plot | 2 | 2923 | Risk Ratio (M‐H, Random, 95% CI) | 0.91 [0.14, 5.74] |
| 25 Admission to special care nursery/neonatal intensive care unit Show forest plot | 12 | 15869 | Risk Ratio (M‐H, Random, 95% CI) | 0.90 [0.76, 1.06] |
| 26 Mean length of neonatal hospital stay (days) Show forest plot | 2 | 1979 | Mean Difference (IV, Random, 95% CI) | ‐3.63 [‐7.57, 0.30] |
| 27 Fetal loss/neonatal death before 24 weeks Show forest plot | 10 | 13953 | Risk Ratio (M‐H, Random, 95% CI) | 0.81 [0.66, 0.99] |
| 28 Fetal loss/neonatal death equal to/after 24 weeks Show forest plot | 11 | 15667 | Risk Ratio (M‐H, Random, 95% CI) | 1.00 [0.67, 1.51] |
| Outcome or subgroup title | No. of studies | No. of participants | Statistical method | Effect size |
| 1 Regional analgesia (epidural/spinal) Show forest plot | 13 | 15982 | Risk Ratio (M‐H, Random, 95% CI) | 0.83 [0.76, 0.90] |
| 1.1 Caseload | 3 | 5090 | Risk Ratio (M‐H, Random, 95% CI) | 0.88 [0.76, 1.03] |
| 1.2 Team models of midwifery care | 10 | 10892 | Risk Ratio (M‐H, Random, 95% CI) | 0.81 [0.73, 0.89] |
| 2 Caesarean birth Show forest plot | 13 | 15966 | Risk Ratio (M‐H, Random, 95% CI) | 0.93 [0.84, 1.02] |
| 2.1 Caseload | 3 | 5090 | Risk Ratio (M‐H, Random, 95% CI) | 0.93 [0.75, 1.17] |
| 2.2 Team models of midwifery care | 10 | 10876 | Risk Ratio (M‐H, Random, 95% CI) | 0.94 [0.84, 1.05] |
| 3 Instrumental vaginal birth (forceps/vacuum) Show forest plot | 12 | 16273 | Risk Ratio (M‐H, Random, 95% CI) | 0.89 [0.82, 0.96] |
| 3.1 Caseload | 3 | 5090 | Risk Ratio (M‐H, Random, 95% CI) | 0.91 [0.80, 1.04] |
| 3.2 Team models of midwifery care | 9 | 11183 | Risk Ratio (M‐H, Random, 95% CI) | 0.88 [0.79, 0.97] |
| 4 Spontaneous vaginal birth (as defined by trial authors) Show forest plot | 11 | 14995 | Risk Ratio (M‐H, Random, 95% CI) | 1.05 [1.03, 1.08] |
| 4.1 Caseload | 3 | 5090 | Risk Ratio (M‐H, Random, 95% CI) | 1.05 [0.98, 1.14] |
| 4.2 Team models of midwifery care | 8 | 9905 | Risk Ratio (M‐H, Random, 95% CI) | 1.05 [1.02, 1.07] |
| 5 Intact perineum Show forest plot | 9 | 11494 | Risk Ratio (M‐H, Random, 95% CI) | 1.03 [0.94, 1.13] |
| 5.1 Caseload | 2 | 2783 | Risk Ratio (M‐H, Random, 95% CI) | 1.12 [0.83, 1.50] |
| 5.2 Team | 7 | 8711 | Risk Ratio (M‐H, Random, 95% CI) | 1.01 [0.91, 1.13] |
| 6 Preterm birth (< 37 weeks) Show forest plot | 7 | 11546 | Risk Ratio (M‐H, Random, 95% CI) | 0.77 [0.62, 0.94] |
| 6.1 Caseload | 2 | 3585 | Risk Ratio (M‐H, Random, 95% CI) | 0.65 [0.47, 0.90] |
| 6.2 Team | 5 | 7961 | Risk Ratio (M‐H, Random, 95% CI) | 0.81 [0.62, 1.07] |
| 7 Overall fetal loss and neonatal death Show forest plot | 12 | 15835 | Risk Ratio (M‐H, Random, 95% CI) | 0.84 [0.70, 1.00] |
| 7.1 Caseload | 3 | 5090 | Risk Ratio (M‐H, Random, 95% CI) | 0.65 [0.43, 0.99] |
| 7.2 Team | 9 | 10745 | Risk Ratio (M‐H, Random, 95% CI) | 0.89 [0.73, 1.07] |
| Outcome or subgroup title | No. of studies | No. of participants | Statistical method | Effect size |
| 1 Regional analgesia (epidural/spinal) Show forest plot | 13 | 15982 | Risk Ratio (M‐H, Random, 95% CI) | 0.83 [0.76, 0.90] |
| 1.1 Low risk | 8 | 11096 | Risk Ratio (M‐H, Random, 95% CI) | 0.82 [0.73, 0.92] |
| 1.2 Mixed risk | 5 | 4886 | Risk Ratio (M‐H, Random, 95% CI) | 0.84 [0.75, 0.95] |
| 2 Caesarean birth Show forest plot | 13 | 15982 | Risk Ratio (M‐H, Random, 95% CI) | 0.93 [0.84, 1.02] |
| 2.1 Low risk | 8 | 11096 | Risk Ratio (M‐H, Random, 95% CI) | 0.91 [0.79, 1.06] |
| 2.2 Mixed risk | 5 | 4886 | Risk Ratio (M‐H, Random, 95% CI) | 0.96 [0.84, 1.09] |
| 3 Instrumental vaginal birth (forceps/vacuum) Show forest plot | 12 | 15809 | Risk Ratio (M‐H, Random, 95% CI) | 0.88 [0.81, 0.96] |
| 3.1 Low risk | 7 | 10923 | Risk Ratio (M‐H, Random, 95% CI) | 0.89 [0.81, 0.99] |
| 3.2 Mixed risk | 5 | 4886 | Risk Ratio (M‐H, Random, 95% CI) | 0.82 [0.65, 1.03] |
| 4 Spontaneous vaginal birth (as defined by trial authors) Show forest plot | 11 | 14995 | Risk Ratio (M‐H, Random, 95% CI) | 1.05 [1.03, 1.08] |
| 4.1 Low risk | 7 | 10923 | Risk Ratio (M‐H, Random, 95% CI) | 1.05 [1.02, 1.08] |
| 4.2 Mixed risk | 4 | 4072 | Risk Ratio (M‐H, Random, 95% CI) | 1.06 [1.01, 1.10] |
| 5 Intact perineum Show forest plot | 9 | 11494 | Risk Ratio (M‐H, Random, 95% CI) | 1.03 [0.94, 1.13] |
| 5.1 Low risk | 6 | 8616 | Risk Ratio (M‐H, Random, 95% CI) | 1.06 [0.93, 1.21] |
| 5.2 Mixed risk | 3 | 2878 | Risk Ratio (M‐H, Random, 95% CI) | 0.98 [0.90, 1.07] |
| 6 Preterm birth (< 37 weeks) Show forest plot | 7 | 11546 | Risk Ratio (M‐H, Random, 95% CI) | 0.77 [0.62, 0.94] |
| 6.1 Low risk | 5 | 9726 | Risk Ratio (M‐H, Random, 95% CI) | 0.71 [0.54, 0.92] |
| 6.2 Mixed risk | 2 | 1820 | Risk Ratio (M‐H, Random, 95% CI) | 0.92 [0.70, 1.21] |
| 7 Overall fetal loss and neonatal death Show forest plot | 12 | 15835 | Risk Ratio (M‐H, Random, 95% CI) | 0.84 [0.70, 1.00] |
| 7.1 Low risk | 7 | 10895 | Risk Ratio (M‐H, Random, 95% CI) | 0.94 [0.73, 1.20] |
| 7.2 Mixed risk | 5 | 4940 | Risk Ratio (M‐H, Random, 95% CI) | 0.76 [0.59, 0.97] |