| 1 Mean number of antenatal visits Show forest plot | 1 | 405 | Mean Difference (IV, Fixed, 95% CI) | 1.5 [0.96, 2.04] |
|
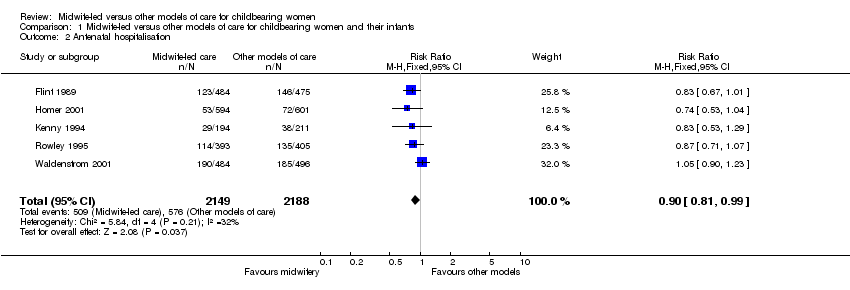
| 2 Antenatal hospitalisation Show forest plot | 5 | 4337 | Risk Ratio (M‐H, Fixed, 95% CI) | 0.90 [0.81, 0.99] |
|
| 3 Antepartum haemorrhage Show forest plot | 4 | 3655 | Risk Ratio (M‐H, Fixed, 95% CI) | 0.86 [0.63, 1.17] |
|
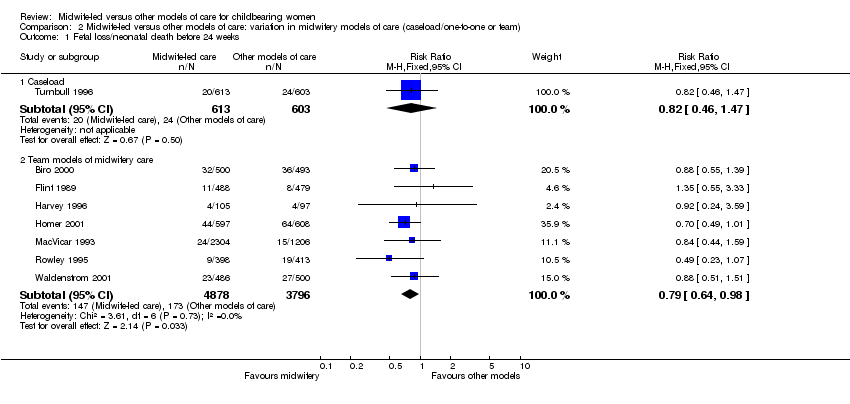
| 4 Fetal loss/neonatal death before 24 weeks Show forest plot | 8 | 9890 | Risk Ratio (M‐H, Fixed, 95% CI) | 0.79 [0.65, 0.97] |
|
| 5 Fetal loss/neonatal death equal to/after 24 weeks Show forest plot | 9 | 11604 | Risk Ratio (M‐H, Fixed, 95% CI) | 1.01 [0.67, 1.53] |
|
| 6 Overall fetal loss and neonatal death Show forest plot | 10 | 11806 | Risk Ratio (M‐H, Fixed, 95% CI) | 0.83 [0.70, 1.00] |
|
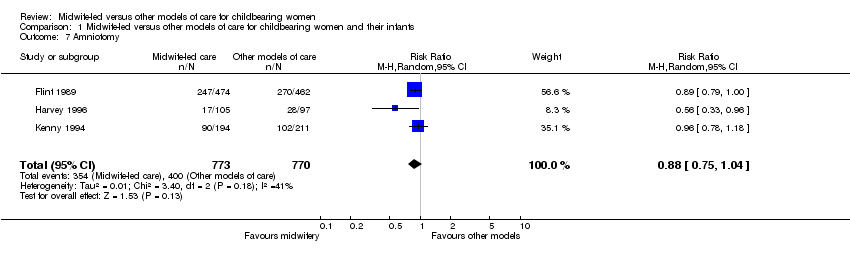
| 7 Amniotomy Show forest plot | 3 | 1543 | Risk Ratio (M‐H, Random, 95% CI) | 0.88 [0.75, 1.04] |
|
| 8 Augmentation/artificial oxytocin during labour Show forest plot | 10 | 11709 | Risk Ratio (M‐H, Random, 95% CI) | 0.92 [0.81, 1.05] |
|
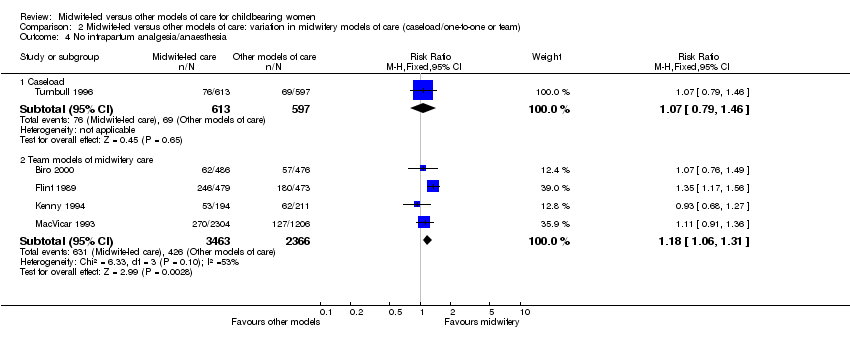
| 9 No intrapartum analgesia/anaesthesia Show forest plot | 5 | 7039 | Risk Ratio (M‐H, Fixed, 95% CI) | 1.16 [1.05, 1.29] |
|
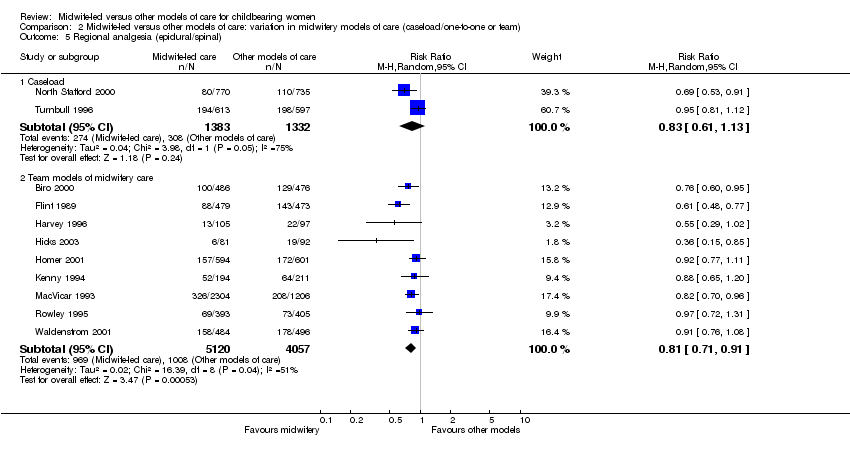
| 10 Regional analgesia (epidural/spinal) Show forest plot | 11 | 11892 | Risk Ratio (M‐H, Random, 95% CI) | 0.81 [0.73, 0.91] |
|
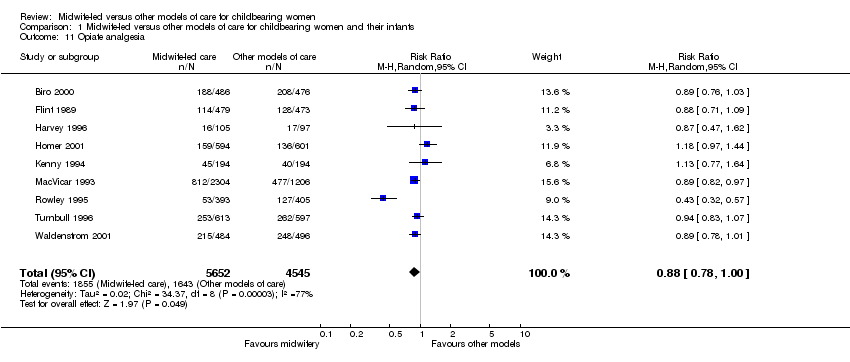
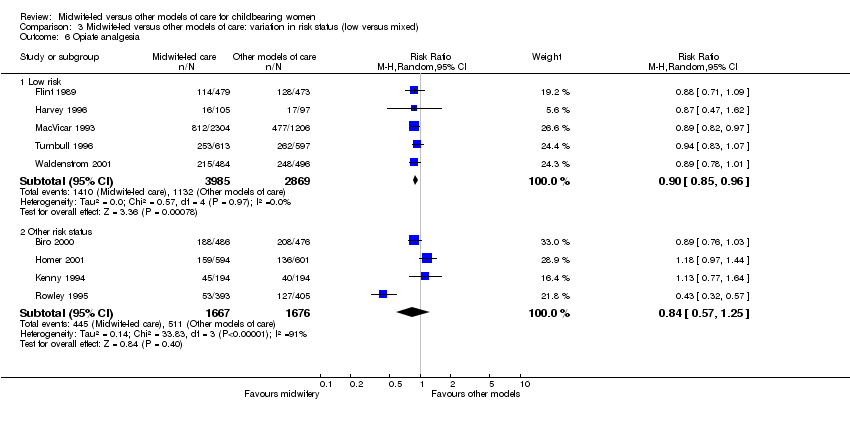
| 11 Opiate analgesia Show forest plot | 9 | 10197 | Risk Ratio (M‐H, Random, 95% CI) | 0.88 [0.78, 1.00] |
|
| 12 Mean labour length Show forest plot | 2 | 1614 | Mean Difference (IV, Random, 95% CI) | 0.27 [‐0.18, 0.72] |
|
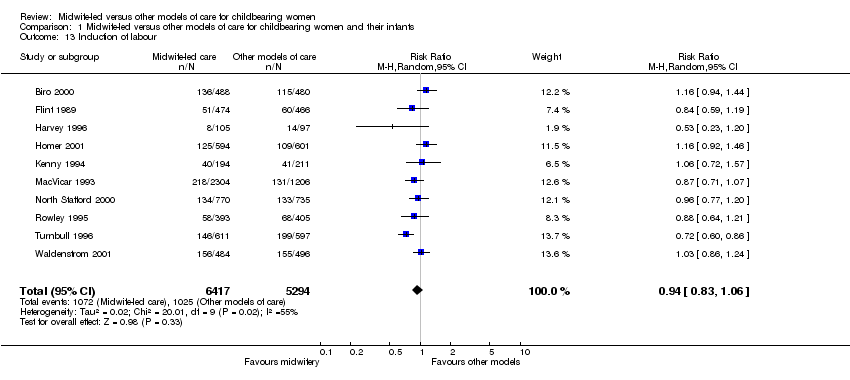
| 13 Induction of labour Show forest plot | 10 | 11711 | Risk Ratio (M‐H, Random, 95% CI) | 0.94 [0.83, 1.06] |
|
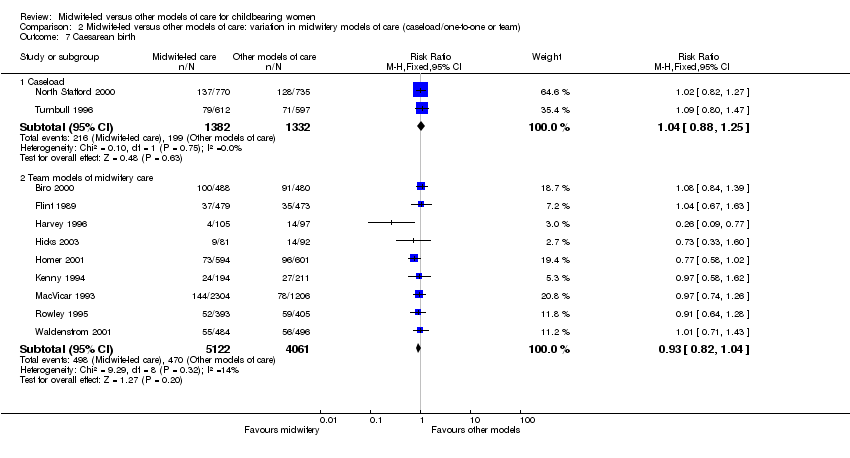
| 14 Caesarean birth Show forest plot | 11 | 11897 | Risk Ratio (M‐H, Fixed, 95% CI) | 0.96 [0.87, 1.06] |
|
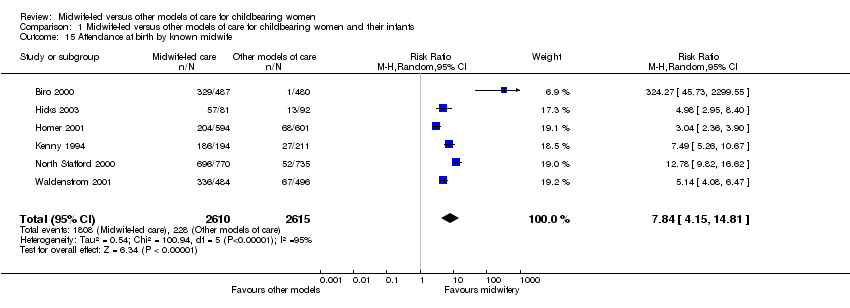
| 15 Attendance at birth by known midwife Show forest plot | 6 | 5225 | Risk Ratio (M‐H, Random, 95% CI) | 7.84 [4.15, 14.81] |
|
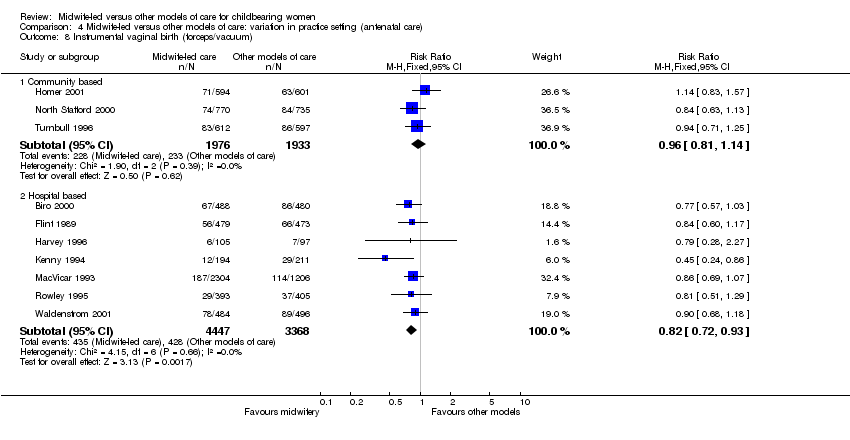
| 16 Instrumental vaginal birth (forceps/vacuum) Show forest plot | 10 | 11724 | Risk Ratio (M‐H, Fixed, 95% CI) | 0.86 [0.78, 0.96] |
|
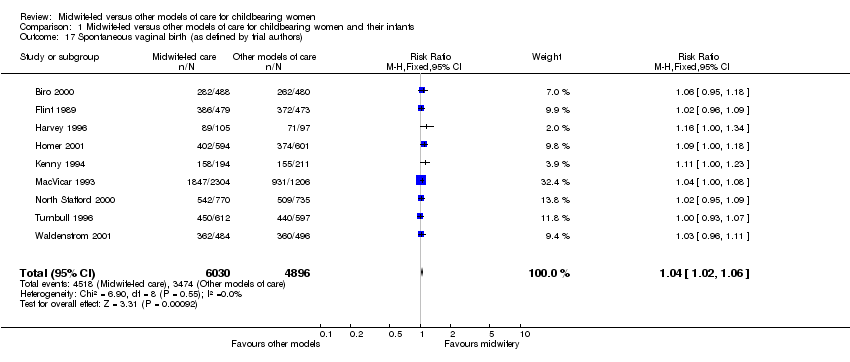
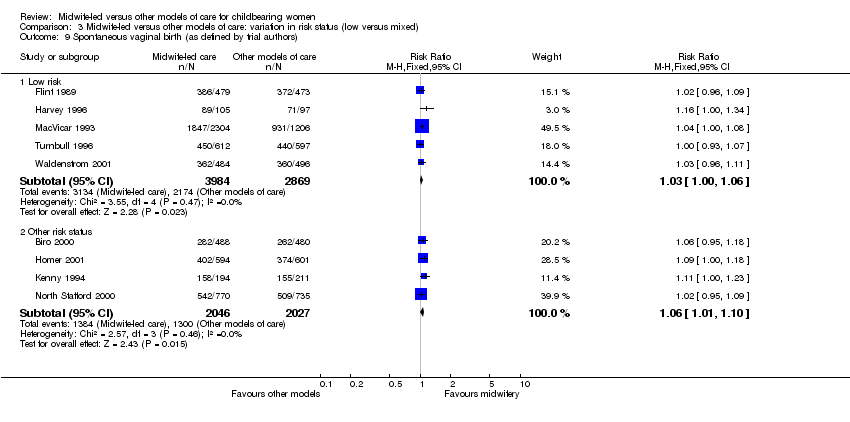
| 17 Spontaneous vaginal birth (as defined by trial authors) Show forest plot | 9 | 10926 | Risk Ratio (M‐H, Fixed, 95% CI) | 1.04 [1.02, 1.06] |
|
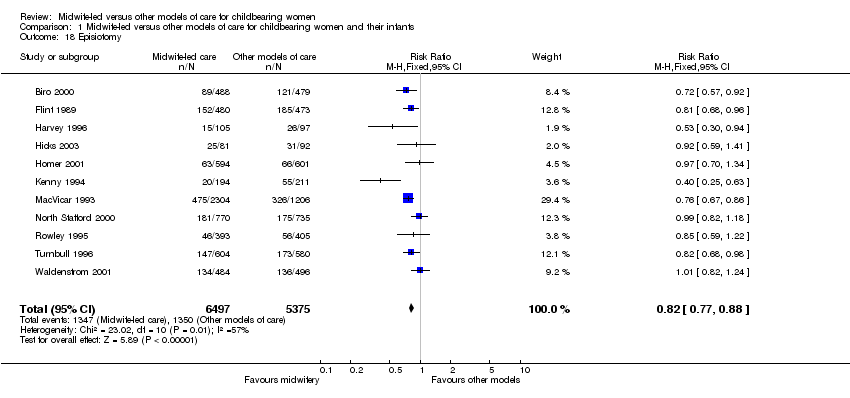
| 18 Episiotomy Show forest plot | 11 | 11872 | Risk Ratio (M‐H, Fixed, 95% CI) | 0.82 [0.77, 0.88] |
|
| 19 Perineal laceration requiring suturing Show forest plot | 7 | 9349 | Risk Ratio (M‐H, Fixed, 95% CI) | 0.99 [0.94, 1.03] |
|
| 20 Intact perineum Show forest plot | 8 | 9706 | Risk Ratio (M‐H, Random, 95% CI) | 1.05 [0.95, 1.16] |
|
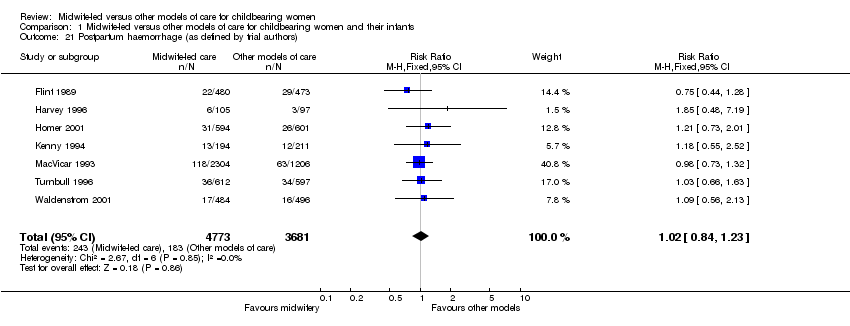
| 21 Postpartum haemorrhage (as defined by trial authors) Show forest plot | 7 | 8454 | Risk Ratio (M‐H, Fixed, 95% CI) | 1.02 [0.84, 1.23] |
|
| 22 Maternal death | 0 | 0 | Odds Ratio (M‐H, Fixed, 95% CI) | 0.0 [0.0, 0.0] |
| 23 Duration of postnatal hospital stay (days) Show forest plot | 2 | 1944 | Mean Difference (IV, Fixed, 95% CI) | ‐0.14 [‐0.33, 0.04] |
|
| 24 Low birthweight (< 2500 g) Show forest plot | 5 | 8009 | Risk Ratio (M‐H, Fixed, 95% CI) | 0.99 [0.83, 1.17] |
|
| 25 Preterm birth (< 37 weeks) Show forest plot | 5 | 7516 | Risk Ratio (M‐H, Fixed, 95% CI) | 0.87 [0.73, 1.04] |
|
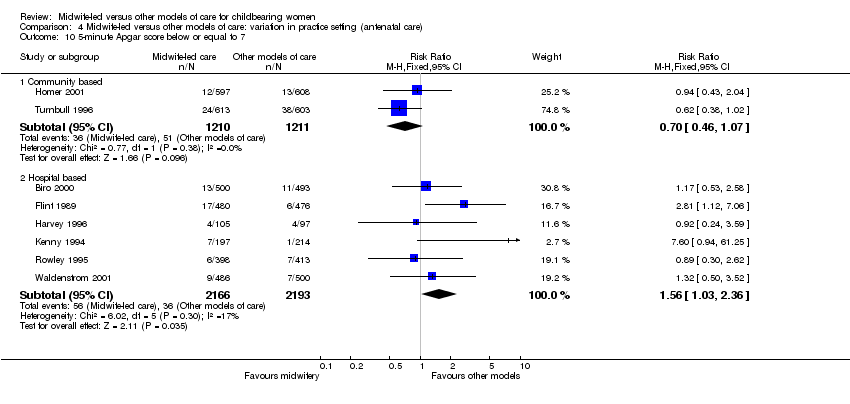
| 26 5‐minute Apgar score below or equal to 7 Show forest plot | 8 | 6780 | Risk Ratio (M‐H, Fixed, 95% CI) | 1.06 [0.79, 1.41] |
|
| 27 Admission to special care nursery/neonatal intensive care unit Show forest plot | 10 | 11782 | Risk Ratio (M‐H, Fixed, 95% CI) | 0.92 [0.81, 1.05] |
|
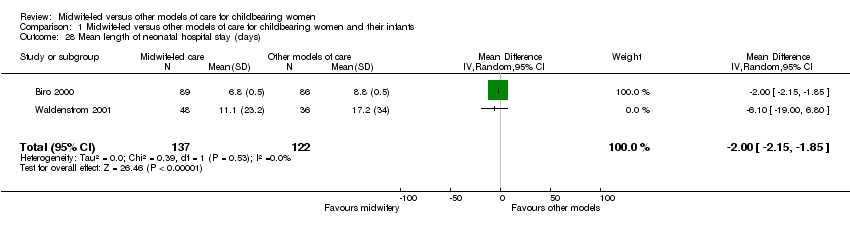
| 28 Mean length of neonatal hospital stay (days) Show forest plot | 2 | 259 | Mean Difference (IV, Random, 95% CI) | ‐2.00 [‐2.15, ‐1.85] |
|
| 29 Neonatal convulsions (as defined by trial authors) Show forest plot | 1 | 1216 | Risk Ratio (M‐H, Fixed, 95% CI) | 0.33 [0.01, 8.03] |
|
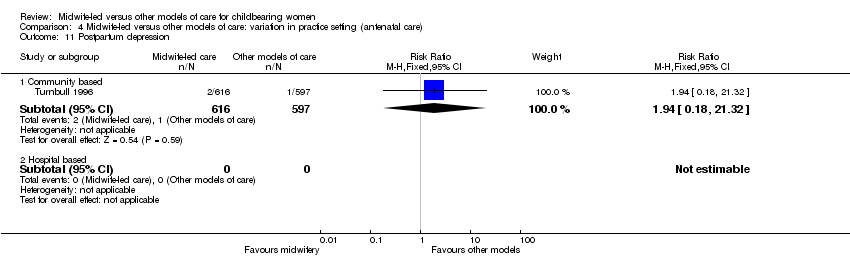
| 30 Postpartum depression Show forest plot | 1 | 1213 | Risk Ratio (M‐H, Fixed, 95% CI) | 1.94 [0.18, 21.32] |
|
| 31 Breastfeeding initiation Show forest plot | 1 | 405 | Risk Ratio (M‐H, Random, 95% CI) | 1.35 [1.03, 1.76] |
|
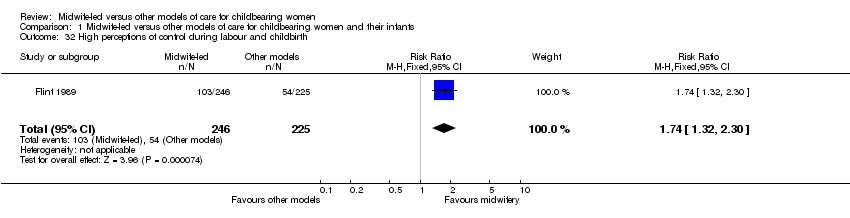
| 32 High perceptions of control during labour and childbirth Show forest plot | 1 | 471 | Risk Ratio (M‐H, Fixed, 95% CI) | 1.74 [1.32, 2.30] |
|