Doustne podawanie witaminy B12 w porównaniu do podawania domięśniowego w niedoborach witaminy B12
Appendices
Appendix 1. Search strategies
| Cochrane Library |
| 1. [mh "Vitamin B 12"] 2. ((vitamin* or vit or coenzym*) near/1 (b12 or "b 12" or b12? or "b 12?")):ti,ab 3. (cobalamin* or hydrox?cobalamin* or c?anocobalamin* or methylcobalamin* or adenosylcobalamin* or dibencozid* or cobamamid* or cobamid*):ti,ab 4. {or #1‐#3} 5. [mh "Vitamin B 12 Deficiency"] 6. ((b12 or "b 12" or b12? or "b 12?" or cobalamin* or cyanocobalamin) near/3 deficien*):ti,ab 7. #5 or #6 8. #4 and #7 [Publication Year from 2005 to 2017] |
| MEDLINE (Ovid SP) |
| 1. exp Vitamin B 12/ 2. ((vitamin* or vit or coenzym*) adj1 (b12? or "b 12?")).tw. 3. (cobalamin* or hydrox?cobalamin* or c?anocobalamin* or methylcobalamin* or adenosylcobalamin* or dibencozid* or cobamamid* or cobamid*).tw. 4. or/1‐3 5. exp Vitamin B 12 Deficiency/ 6. ((b12? or "b 12?" or cobalamin* or cyanocobalamin) adj3 deficien*).tw. 7. or/5‐6 8. 4 and 7 [9‐19: Cochrane Handbook 2008 RCT filter ‐ sensitivity max. version] 9. randomized controlled trial.pt. 10. controlled clinical trial.pt. 11. randomi?ed.ab. 12. placebo.ab. 13. drug therapy.fs. 14. randomly.ab. 15. trial.ab. 16. groups.ab. 17. or/9‐16 18. exp animals/ not humans/ 19. 17 not 18 20. 8 and 19 21. (200412?? or 2005* or 2006* or 2007* or 2008* or 2009 or 201*).dc. 22. 20 and 21 |
| Embase (Ovid SP) |
| 1. cobalamin derivative/ 2. hydroxocobalamin/ 3. methylcobalamin/ 4. cyanocobalamin/ 5. cobamamide/ 6. cobalamin/ 7. ((vitamin* or vit or coenzym*) adj1 (b12? or "b 12?")).tw. 8. (cobalamin* or hydrox?cobalamin* or c?anocobalamin* or methylcobalamin* or adenosylcobalamin* or dibencozid* or cobamamid* or cobamid*).tw. 9. or/1‐8 10. cyanocobalamin deficiency/ 11. ((b12? or "b 12?" or cobalamin* or cyanocobalamin) adj3 deficien*).tw. 12. or/10‐11 13. 9 and 12 [13Wong 2006"sound treatment studies" filter – BS version] 14. random*.tw. or clinical trial*.mp. or exp health care quality/ 15. 13 and 14 16. (200412?? or 2005* or 2006* or 2007* or 2008* or 2009 or 201*).dc. 17. 15 and 16 |
| LILACS (iAHx) |
| (MH:" Vitamin B 12" OR ((vitamin$ OR coenzym$ OR coenzim$) AND (B12 OR "B 12")) OR (cobalamin$ OR hydroxicobalamin$ OR hydroxocobalamin$ hidroxicobalamin$ OR hidroxocobalamin$ OR cyanocobalamin$ OR cianocobalamin$ OR methylcobalamin$ OR metilcobalamin$ OR adenosylcobalamin$ OR adenosilcobalamin$ OR dibencozid$ OR cobamamid$ OR cobamid$)) AND (MH: "Vitamin B 12 Deficiency" OR ((B12 OR "B 12" OR cobalamin$ OR cyanocobalamin$ OR cianocobalamin$) AND deficien$)) + Filter "Controlled Clinical Trial" |
| ClinicalTrials.gov (Expert search) |
| ( hydroxocobalamin OR hydroxicobalamin OR methylcobalamin OR cyanocobalamin OR cobamamide OR cobalamin OR dibencozid OR adenosylcobalamin OR cobamide OR "vitamin B12" OR "vitamin B 12" OR "coenzym B12" OR "coenzym B 12" ) AND ( B12 OR "B 12" OR cobalamin OR cyanocobalamin ) AND ( deficiency OR deficiencies OR deficient ) AND EXACT "Interventional" [STUDY‐TYPES] |
| ICTRP Search Portal (Standard search) |
| deficien* AND vitamin B12 OR deficien* AND vitamin B 12 OR vitamin B12 deficiency OR vitamin B 12 deficiency OR deficien* AND cobalamin* OR deficien* AND cyanocobalamin* |
Appendix 2. Description of interventions
| Trial ID | Intervention(s) | Comparator(s) |
| Bolaman 2003 | Oral: 1000 µg cyanocobalamin (ampoule mixed with 20 mL fruit juice) self administered once daily for 10 days; after 10 days, once a week for 4 weeks and then once a month for life | Intramuscular: 1000 µg cyanocobalamin (ampoule, injection by a nurse into the gluteus muscle) once daily for 10 days; after 10 days, once a week for 4 weeks and then once a month for life |
| Kuzminski 1998 | Oral: 2000 µg cyanocobalamin (two 1000 µg tablets) with breakfast daily for 4 months | Intramuscular: 1000 µg cyanocobalamin on days 1, 3, 7, 10, 14, 21, 30, 60, and 90 (injection by a nurse) |
| Saraswathy 2012 | Oral: 1000 μg of vitamin B12 daily for 3 months | Intramuscular: 1000 μg of vitamin B12 once daily for a week followed by once a week for 8 weeks |
Appendix 3. Baseline characteristics (I)
| Trial ID | Intervention(s) and comparator(s) | Duration of intervention | Description of participants | Trial period | Country | Setting | Ethnic groups | Duration of vitamin B12 deficiency | Vitamin B12 levels (mean pg/mL (SD)) |
| Bolaman 2003 | I: oral vitamin B12 | 90 days (90 days) | People with megaloblastic anaemia due to vitamin B12 deficiency (defined as serum vitamin B12 level < 160 pg/mL) | 1999 to 2003 | Turkey | Hospital | ‐ | ‐ | 72.9 (54.8) |
| C: intramuscular vitamin B12 | 90 days (90 days) | 70.2 (59.1) | |||||||
| Kuzminski 1998 | I: oral vitamin B12 | 4 months (4 months) | People with newly diagnosed vitamin B12 deficiency (defined as serum vitamin B12 level < 160 pg/mL) | 1993 to 1996 | USA | Ambulatory care centres | White: 97 Latina: 3 | ‐ | 93 (46) |
| C: intramuscular vitamin B12 | 90 days (4 months) | 95 (92) | |||||||
| Saraswathy 2012 | I: oral vitamin B12 | 3 months (3 months) | Consecutive patients with vitamin B12 deficiency (serum vitamin B12 level < 200 pg/mL) | 2009 to 2010 | South India | A tertiary care hospital | ‐ | ‐ | 149.8 (37.6) |
| C: intramuscular vitamin B12 | 9 weeks (3 months) | 146.0 (42.1) | |||||||
| ‐ denotes not reported C: comparator; I: intervention; SD: standard deviation | |||||||||
Appendix 4. Baseline characteristics (II)
| Trial ID | Intervention(s) and comparator(s) | Sex | Age | MCV (mean fL (SD)) | Haemoglobin (mean g/dL (SD)) | Total homocysteine (mean μmol/L (SD)) | Serum methylmalonic acid (mean nmol/L (SD)) | Comedications/Cointerventions | Comorbidities |
| Bolaman 2003 | I: oral vitamin B12 | 39 | 60 (15) | 112.3 (11.4) | 8.4 (2.1) | ‐ | ‐ | 18/26 participants with upper GI endoscopy | Atrophic gastritis: 5 |
| C: intramuscular vitamin B12 | 50 | 64 (10) | 114.8 (10.9) | 8.3 (2.3) | ‐ | ‐ | 27/34 participants with upper GI endoscopy | Atrophic gastritis: 9 | |
| Kuzminski 1998 | I: oral vitamin B12 | 67 | 72 (11) | 100 (12) | ‐ | 37.2 (44.9) | 3850 (6930) | ‐ | Atrophic gastritis: 7 (3 unclear) |
| C: intramuscular vitamin B12 | 87 | 71 (15) | 102 (11) | ‐ | 40.0 (26.2) | 3630 (7040) | ‐ | Atrophic gastritis: 7 | |
| Saraswathy 2012 | I: oral vitamin B12 | 36.7 | 38.6 (14.8) | 92.8 (14.3) | 11.7 (2.4) | ‐ | ‐ | ‐ | ‐ |
| C: intramuscular vitamin B12 | 16.7 | 44.3 (9.3) | 89.4 (16.3) | 12.4 (2.7) | ‐ | ‐ | ‐ | ‐ | |
| ‐ denotes not reported C: comparator; GI: gastrointestinal tract; I: intervention; MCV: mean corpuscular volume; SD: standard deviation | |||||||||
Appendix 5. Matrix of trial endpoints (publications and trial documents)
| Trial ID | Endpoints quoted in trial document(s) | Trial results/ | Endpoints quoted in publication(s)b,c | Endpoints quoted in abstract of publication(s)b,c |
| Saraswathy 2012 | Source: N/T | No full publication | Primary outcome measure: proportion of participants with serum vitamin B12 normalisation (≥ 200 pg/mL) after 60 days of treatment | |
| Secondary outcome measure: compliance: ensured by pill/ampoule count and verification of injection records | ||||
| Other outcome measure(s): ‐ | ||||
| Bolaman 2003 | Source: N/T | Primary outcome measure(s): ‐ | Primary outcome measure(s): ‐ | |
| Secondary outcome measure(s): ‐ | Secondary outcome measure(s): ‐ | |||
| Other outcome measure(s): haemoglobin level, improvements in signs and symptoms of anaemia; response to therapy (detection of reticulocytosis between days 5 and 10, and recovery of the haematologic parameters on complete blood counts and peripheral blood smears at days 10, 30, and 90 of treatment); tolerability ‐ adverse events (assessed by a haematologist at days 0, 30, and 90 using laboratory tests, e.g. serum potassium level, eosinophilia on blood smear, and patient interviews); costs (costs of the study drug and of the injections); serum vitamin B12 levels; serum autoantibodies to gastric parietal cells; cognitive function (Mini‐Mental State Examination); vibration threshold; neurologic sensory assessment (soft‐touch, pinprick examination) | Other outcome measure(s): therapeutic effectiveness (haematologic parameters on days 0, 10, 30, and 90); serum vitamin B12 (on days 0 and 90); cognitive function, vibration threshold; neurologic sensory assessment; tolerability | |||
| Kuzminski 1998 | Source: N/T | Primary outcome measure(s): ‐ | Primary outcome measure(s): ‐ | |
| Secondary outcome measure(s): ‐ | Secondary outcome measure(s): ‐ | |||
| Other outcome measure(s): serum vitamin B12 levels, serum folate levels, serum anti‐intrinsic factor antibodies, unsaturated serum cobalamin‐binding capacity, serum methylmalonic acid levels, serum homocysteine levels, serum pepsinogen I levels, neurologic symptoms, haematocrit, mean corpuscular volume | Other outcome measure(s): therapeutic effectiveness: haematologic and neurologic improvement and changes in serum levels of cobalamin (normal: 200 to 900 pg/mL), methylmalonic acid (normal: 73 to 271 nmol/L), and homocysteine (normal: 5.1 to 13.9 µmol/L) | |||
| ‐ denotes not reported aTrial document(s) refers to all available information from published design papers and sources other than regular publications (e.g. FDA/EMA documents, manufacturer's websites, trial registers). | ||||
Appendix 6. High risk of outcome reporting bias according to Outcome Reporting Bias In Trials (ORBIT) classification
| Trial ID | Outcome | High risk of bias | High risk of bias | High risk of bias | High risk of bias |
| Bolaman 2003 | Clinical signs and symptoms of vitamin B12 deficiency | No | Yes | No | No |
| Kuzminski 1998 | N/A | ||||
| Saraswathy 2012 | N/A | ||||
| N/A: not applicable aClear that outcome was measured and analysed; trial report states that outcome was analysed but only reports that result was not significant. | |||||
Appendix 7. Definition of endpoint measurementa
| Trial ID | Definition of vitamin B12 deficiency | Therapeutic efficacy | Clinical signs and symptoms of vitamin B12 deficiency | Adverse events | Health‐related quality of life | Acceptability | Socioeconomic effects |
| Bolaman 2003 | Serum vitamin B12 concentrations < 160 pg/mL, megaloblastic anaemia, mean corpuscular volume > 94 fL (IO) | Response to therapy (detection of reticulocytosis between days 5 and 10, and recovery of the haematologic parameters on complete blood counts and peripheral blood smears at days 10, 30, and 90 of treatment) | Cognitive function (Mini‐Mental State Examination) | Tolerabilty ‐ adverse events (assessed by a haematologist at days 0, 30, and 90 using laboratory tests, e.g. serum potassium level, eosinophilia on blood smear, and participant interviews) | N/I | Tolerabilty ‐ adverse events (assessed by a haematologist at days 0, 30, and 90 using laboratory tests, e.g. serum potassium level, eosinophilia on blood smear, and participant interviews) | Costs of the study drug and of the injections |
| Kuzminski 1998 | Serum vitamin B12 concentrations < 160 pg/mL | Haematologic and neurologic improvement and changes in serum levels of vitamin B12 (normal: 200 to 900 pg/mL), methylmalonic acid (normal: 73 to 271 nmol/L), and homocysteine (normal: 5.1 to 13.9 µmol/L) | "Neurologic improvement" | N/I | N/I | N/I | N/I |
| Saraswathy 2012 | Serum vitamin B12 concentrations < 200 pg/mL | Proportion of participants in each treatment arm in whom vitamin B12 levels were normalised (≥ 200 ng/mL) at 3 months after initial treatment | N/I | N/I | N/I | N/I | N/I |
| AO: adjudicated outcome measurement; IO: investigator‐assessed outcome measurement; N/I: not investigated; SO: self reported outcome measurement aIn addition to definition of endpoint measurement, description of who measured the outcome (AO: adjudicated outcome measurement; IO: investigator‐assessed outcome measurement; SO: self reported outcome measurement). | |||||||
Appendix 8. Adverse events (I)
| Trial ID | Intervention(s) and comparator(s) | Participants included in analysis | Deaths | Deaths | Participants with adverse events | Participants with adverse events | Participants with severe/serious adverse events | Participants with severe/serious adverse events |
| Bolaman 2003 | I: oral vitamin B12 | 26a | 0 | 0 | 0 | 0 | 0 | 0 |
| C: intramuscular vitamin B12 | 34a | 0 | 0 | 0 | 0 | 0 | 0 | |
| Kuzminski 1998 | I: oral vitamin B12 | 18b | 0 | 0 | ‐ | ‐ | ‐ | ‐ |
| C: intramuscular vitamin B12 | 15b | 0 | 0 | ‐ | ‐ | ‐ | ‐ | |
| Saraswathy 2012 | I: oral vitamin B12 | 22c | 0 | 0 | ‐ | ‐ | ‐ | ‐ |
| C: intramuscular vitamin B12 | 27d | 0 | 0 | ‐ | ‐ | ‐ | ‐ | |
| ‐ denotes not reported C: comparator; I: intervention aTen participants in Bolaman 2003 left the trial early, and the group assignment of the 10 participants was not reported ("no treatment related adverse events were reported in either treatment group"). bFive participants in Kuzminski 1998 were judged to have deficiency of primary folate rather than of cobalamin, therefore they were excluded from the data analysis. cEight participants in this group left the trial early due to adverse events (n = 2), loss to follow‐up (n = 4), and lack of subjective improvement (n = 2). dThree participants in this group left the trial early due to expired (n = 1) and loss to follow‐up (n = 2). | ||||||||
Appendix 9. Adverse events (II)
| Trial ID | Intervention(s) and comparator(s) | Participants included in analysis | Participants discontinuing study due to adverse events | Participants discontinuing study due to adverse events | Participants hospitalised | Participants hospitalised | Participants with outpatient treatment | Participants with outpatient treatment |
| Bolaman 2003 | I: oral vitamin B12 | 26a | 0 | 0 | ‐ | ‐ | ‐ | ‐ |
| C: intramuscular vitamin B12 | 34a | 0 | 0 | ‐ | ‐ | ‐ | ‐ | |
| Kuzminski 1998 | I: oral vitamin B12 | 18b | ‐ | ‐ | ‐ | ‐ | ‐ | ‐ |
| C: intramuscular vitamin B12 | 15b | ‐ | ‐ | ‐ | ‐ | ‐ | ‐ | |
| Saraswathy 2012 | I: oral vitamin B12 | 22c | 2 | 6.7 | ‐ | ‐ | ‐ | ‐ |
| C: intramuscular vitamin B12 | 27d | 0 | 0 | ‐ | ‐ | ‐ | ‐ | |
| ‐ denotes not reported C: comparator; I: intervention aTen participants in Bolaman 2003 left the trial early, and the group assignment of the 10 participants was not reported. bFive participants in Kuzminski 1998 were judged to have deficiency of primary folate rather than of cobalamin, therefore they were excluded from the data analysis. cEight participants in this group left the trial early due to adverse events (n = 2), loss to follow‐up (n = 4), and lack of subjective improvement (n = 2). dThree participants in this group left the trial early due to expired (n = 1) and loss to follow‐up (n = 2). | ||||||||
Appendix 10. Adverse events (III)
| Trial ID | Intervention(s) and comparator(s) | Participants included in analysis | Participants with specific adverse events | Participants with specific adverse events | Participants with specific adverse events |
| Bolaman 2003 | I: oral vitamin B12 | 26a | ‐ | ‐ | ‐ |
| C: intramuscular vitamin B12 | 34a | ‐ | ‐ | ‐ | |
| Kuzminski 1998 | I: oral vitamin B12 | 18b | ‐ | ‐ | ‐ |
| C: intramuscular vitamin B12 | 15b | ‐ | ‐ | ‐ | |
| Saraswathy 2012 | I: oral vitamin B12 | 22c | ‐ | ‐ | ‐ |
| C: intramuscular vitamin B12 | 27d | ‐ | ‐ | ‐ | |
| ‐ denotes not reported C: comparator; I: intervention aTen participants in Bolaman 2003 left the trial early, and the group assignment of the 10 participants was not reported. bFive participants in Kuzminski 1998 were judged to have deficiency of primary folate rather than of cobalamin, therefore they were excluded from the data analysis. cEight participants in this group left the trial early due to adverse events (n = 2), loss to follow‐up (n = 4), and lack of subjective improvement (n = 2). dThree participants in this group left the trial early due to expired (n = 1) and loss to follow‐up (n = 2). | |||||
Appendix 11. Survey of study investigators providing information on included trials
| Trial ID | Date trial author contacted | Date trial author replied | Date trial author asked for additional information | Date trial author provided data |
| Bolaman 2003 | 18 March 2016 | No reply | N/A | N/A |
| Kuzminski 1998 | 18 March 2016 | No reply | N/A | N/A |
| Saraswathy 2012 | 23 December 2016 | No reply | N/A | N/A |
| N/A: not applicable | ||||
Appendix 12. Checklist to aid consistency and reproducibility of GRADE assessments
| Serum vitamin B12 level | Clinical signs and symptoms of vitamin B12 deficiency | Adverse events | Health‐related quality of life | Acceptability | Socioeconomic effects | ||
| Trial limitations | Was random sequence generation used (i.e. no potential for selection bias)? | Yes | N/R | Unclear | N/R | N/R | Unclear |
| Was allocation concealment used (i.e. no potential for selection bias)? | Unclear | Unclear | Unclear | ||||
| Was there blinding of participants and personnel (i.e. no potential for performance bias) or outcome not likely to be influenced by lack of blinding? | Yes | No (↓) | Yes | ||||
| Was there blinding of outcome assessment (i.e. no potential for detection bias) or was outcome measurement not likely to be influenced by lack of blinding? | Yes | No (↓) | Yes | ||||
| Was an objective outcome used? | Yes | No (↓) | Yes | ||||
| Were more than 80% of participants enrolled in trials included in the analysis (i.e. no potential reporting bias)?e | Yes | Yes | Yes | ||||
| Were data reported consistently for the outcome of interest (i.e. no potential selective reporting)? | Yes | Unclear | Unclear | ||||
| No other biases reported (i.e. no potential for other bias)? | N/A | Yes | Yes | ||||
| Did the trials end as scheduled (i.e. not stopped early)? | Yes | Yes | Yes | ||||
| Inconsistencyb | Point estimates did not vary widely? | N/A | N/A | N/A | |||
| To what extent did confidence intervals overlap (substantial: all confidence intervals overlap at least one of the included studies point estimate; some: confidence intervals overlap but not all overlap at least one point estimate; no: at least one outlier: where the confidence intervals of some | N/A | N/A | N/A | ||||
| Was the direction of effect consistent? | N/A | N/A | N/A | ||||
| What was the magnitude of statistical heterogeneity (as measured by I²): low (I² < 40%), moderate (I² 40% to 60%), high (I² > 60%)? | N/A | N/A | N/A | ||||
| Was the test for heterogeneity statistically significant (P < 0.1)? | N/A | N/A | N/A | ||||
| Indirectnessa | Were the populations in the included studies applicable to the decision context? | Yes | Yes | Yes | |||
| Were the interventions in the included studies applicable to the decision context? | Highly applicable | Highly applicable | Highly applicable | ||||
| Was the included outcome not a surrogate outcome? | Yes | Yes | Yes | ||||
| Was the outcome time frame sufficient? | Sufficient | Sufficient | Sufficient | ||||
| Were the conclusions based on direct comparisons? | Yes | Yes | Yes | ||||
| Imprecisionc | Was the confidence interval for the pooled estimate not consistent with benefit and harm? | N/A | N/A | N/A | |||
| What is the magnitude of the median sample size (high: 300 participants, intermediate: 100 to 300 participants, low: < 100 participants)?e | Low (↓) | Low (↓) | Low (↓) | ||||
| What was the magnitude of the number of included studies (large: > 10 studies, moderate: 5 to 10 studies, small: < 5 studies)?e | Small (↓) | Small (↓) | Small (↓) | ||||
| Was the outcome a common event (e.g. occurs more than 1/100)? | N/A | Yes | N/A | ||||
| Publication biasd | Was a comprehensive search conducted? | Yes | Yes | Yes | |||
| Was grey literature searched? | Yes | Yes | Yes | ||||
| Were no restrictions applied to study selection on the basis of language? | Yes | Yes | Yes | ||||
| There was no industry influence on studies included in the review? | Unclear | Unclear | Unclear | ||||
| There was no evidence of funnel plot asymmetry? | N/A | N/A | N/A | ||||
| There was no discrepancy in findings between published and unpublished trials? | N/A | N/A | N/A | ||||
| (↓): key item for possible downgrading the quality of the evidence (GRADE) as shown in the footnotes of the 'Summary of findings' table(s); N/A: not applicable; N/R: not reported aQuestions on risk of bias are answered in relation to the majority of the aggregated evidence in the meta‐analysis rather than to individual trials. cWhen judging the width of the confidence interval, it is recommended that a clinical decision threshold be used to assess whether the imprecision is clinically meaningful. | |||||||
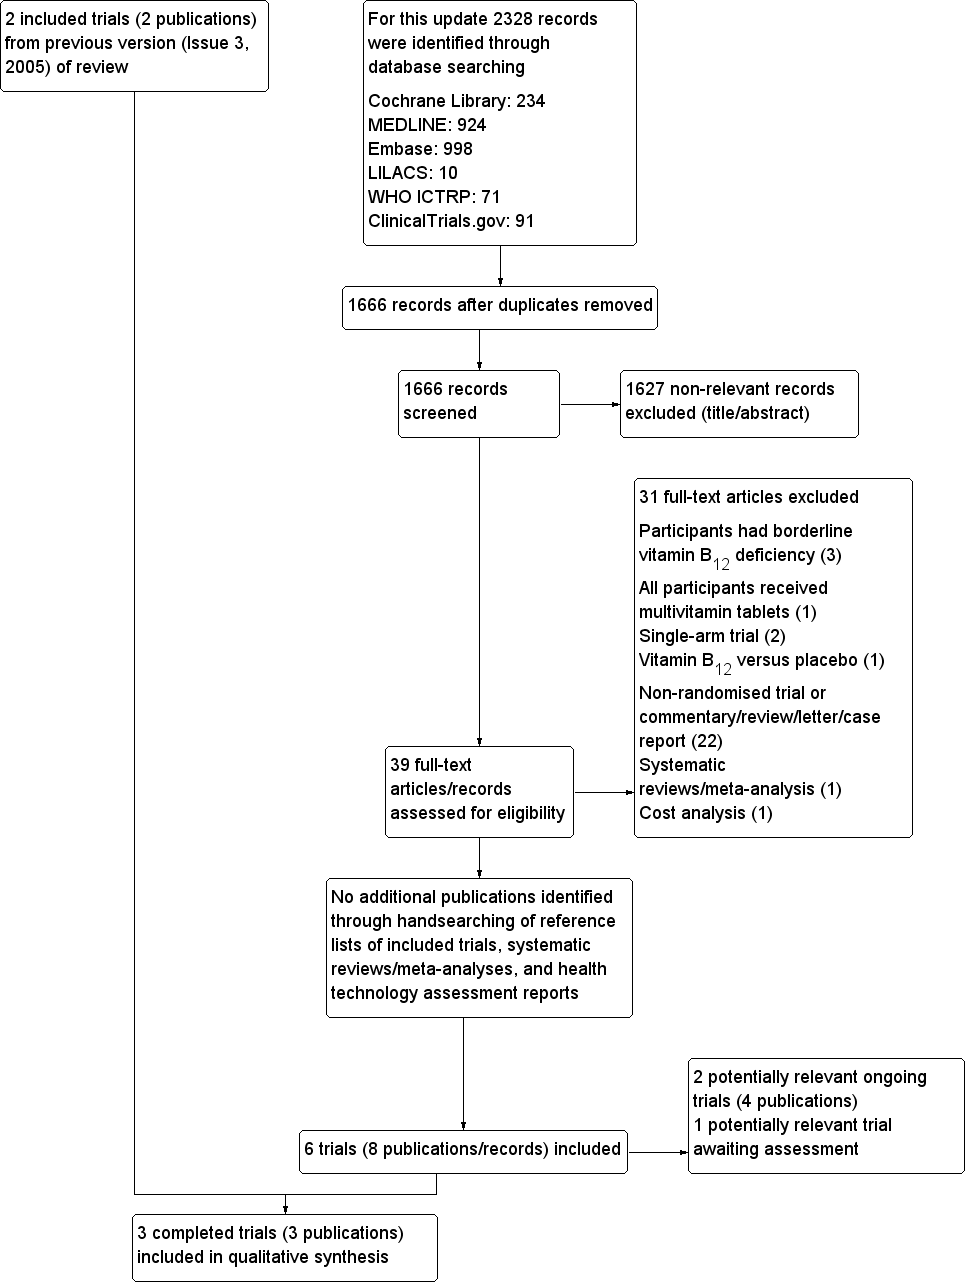
Study flow diagram.

Risk of bias graph: review authors' judgements about each risk of bias item presented as percentages across all included studies (blank cells indicate that the particular outcome was not measured in some studies).
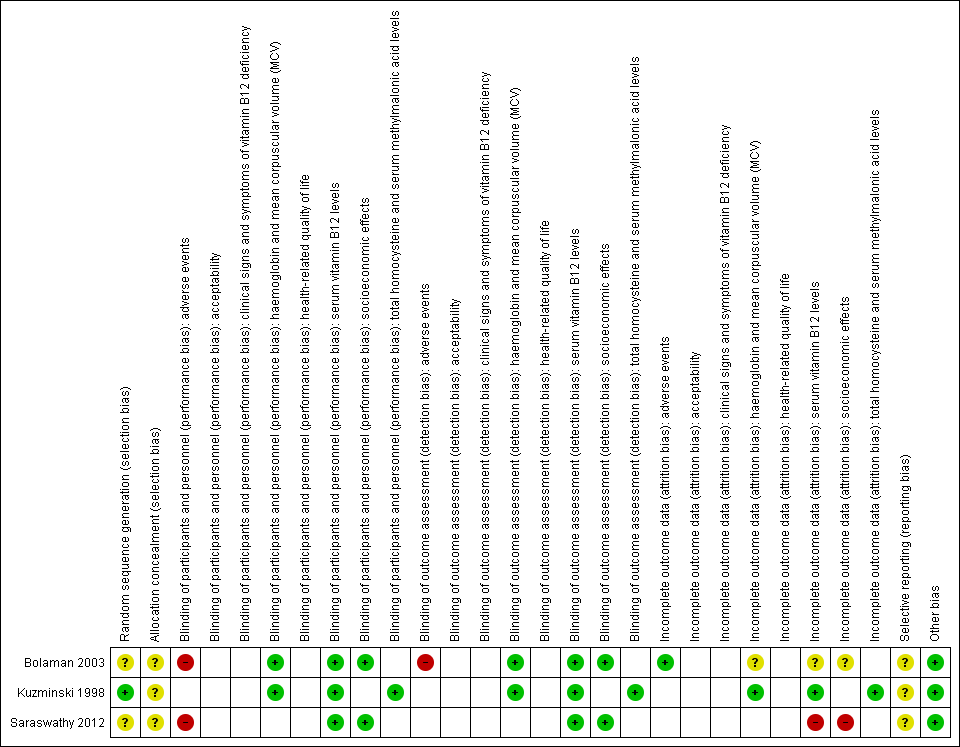
Risk of bias summary: review authors' judgements about each risk of bias item for each included study (blank cells indicate that the study did not measure that particular outcome).

Comparison 1 Oral versus intramuscular vitamin B12, Outcome 1 Serum vitamin B12 levels.
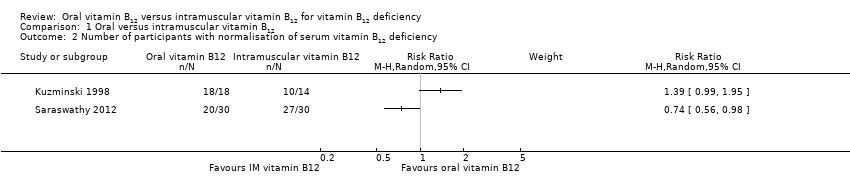
Comparison 1 Oral versus intramuscular vitamin B12, Outcome 2 Number of participants with normalisation of serum vitamin B12 deficiency.

Comparison 1 Oral versus intramuscular vitamin B12, Outcome 3 Adverse events.
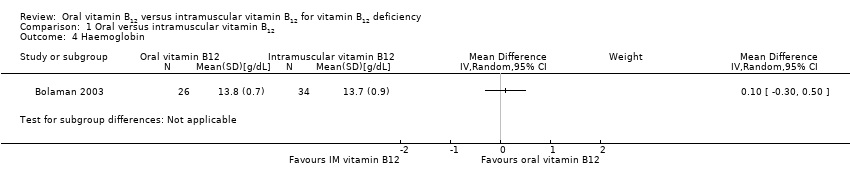
Comparison 1 Oral versus intramuscular vitamin B12, Outcome 4 Haemoglobin.
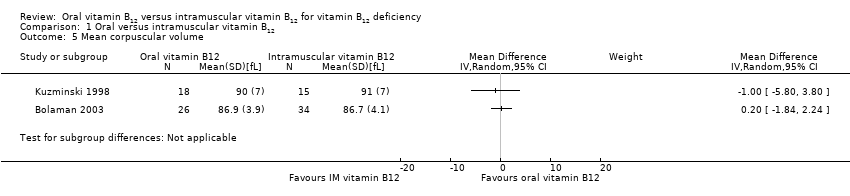
Comparison 1 Oral versus intramuscular vitamin B12, Outcome 5 Mean corpuscular volume.

Comparison 1 Oral versus intramuscular vitamin B12, Outcome 6 Total homocysteine.

Comparison 1 Oral versus intramuscular vitamin B12, Outcome 7 Serum methylmalonic acid.
| Oral versus intramuscular vitamin B12 for vitamin B12 deficiency | ||||||
| Patient: people with vitamin B12 deficiency Intervention: oral versus IM vitamin B12 | ||||||
| Outcomes | IM vitamin B12 | Oral vitamin B12 | Relative effect | No. of participants | Quality of the evidence | Comments |
| Serum vitamin B12 levels Normal value: > 300 pg/mL (> 221 pmol/L) Follow‐up: 90 days and 4 months | See comment | See comment | Not estimable | 153 (3) | ⊕⊕⊝⊝ | 1 trial (60 participants) used 1000 μg/day oral or IM vitamin B12 (total dose 15 mg): MD was ‐11.7 pg/mL (95% CI ‐29.5 to 6.1) (Bolaman 2003). 1 trial (33 participants) used 2000 μg/day vitamin B12 (total dose 240 mg) or 1000 μg/day IM vitamin B12 (total dose 9 mg): MD was 680 pg/mL (95% CI 392.7 to 967.3) in favour of oral vitamin B12 (Kuzminski 1998). 1 trial (60 participants) (using 1000 μg/day oral or IM vitamin B12 (total dose 90 mg and 15 mg, oral and IM respectively) reported that 27/30 in the IM vitamin B12 group (90%) and 20/30 in the oral vitamin B12 group (66.7%) achieved normalisation of serum vitamin B12, defined as ≥ 200 pg/mL (Saraswathy 2012). |
| Clinical signs and symptoms | Not reported | |||||
| Adverse events | See comment | See comment | Not estimable | 120 (2) | ⊕⊝⊝⊝ | Bolaman 2003 reported no treatment‐related adverse events in both the oral and IM vitamin B12 groups. Saraswathy 2012 reported that 2/30 participants (6.7%) in the oral vitamin B12 group left the trial early due to adverse events. |
| Health‐related quality of life | Not reported | |||||
| Acceptability | Not reported | |||||
| Socioeconomic effects Follow‐up: 90 days | See comment | See comment | Not estimable | 60 (1) | ⊕⊕⊝⊝ | Only 1 trial reported data for this outcome (Bolaman 2003). The costs per treatment were USD 80 per person in the oral vitamin B12 group compared with USD 220 per person in the IM group. |
| CI: confidence interval; IM: intramuscular; MD: mean difference | ||||||
| GRADE Working Group grades of evidence | ||||||
| aDowngraded by two levels due to serious imprecision (low numbers of trials and participants); see Appendix 12. | ||||||
| Intervention(s) and comparator(s) | Description of power and sample size calculation | Screened/eligible | Randomised | Analysed | Finishing trial | Randomised finishing trial | Follow‐up | |
| Bolaman 2003 (parallel RCT) | I: 1000 µg oral vitamin B12 | — | — | 26 | 26 | 26 | 100 | 90 days (none) |
| C: 1000 µg IM vitamin B12 | 34 | 34 | 34 | 100 | ||||
| Total: | 60b | 60 | 60 | 100 | ||||
| Kuzminski 1998 (parallel RCT) | I: 2000 µg oral vitamin B12 | — | 138 | 18 | 18 | 18 | 100 | 4 months (none) |
| C: 1000 µg IM vitamin B12 | 15 | 15 | 15 | 100 | ||||
| Total: | 33c | 33 | 33 | 100 | ||||
| Saraswathy 2012 (parallel RCT) | I: 1000 μg oral vitamin B12 | "Sample size was estimated to be 23 in each study arm, assuming equal response of 90% and non inferiority margin of 25% /alpha = 0.25, 1‐beta = 80%)" | — | 30 | 22 | 22 | 73 | 3 months (none) |
| C: 1000 μg IM vitamin B12 | 30 | 27 | 27 | 90 | ||||
| Total: | 60 | 49 | 49 | 82 | ||||
| Grand total | All interventions | 74 | 66 | |||||
| All comparators | 79 | 76 | ||||||
| All interventions and comparators | 153 | 142 | ||||||
| — denotes not reported C: comparator; I: intervention; IM: intramuscular; RCT: randomised controlled trial aFollow‐up under randomised conditions until end of trial (= duration of intervention + follow‐up postintervention or identical to duration of intervention); extended follow‐up refers to follow‐up of participants once the original trial was terminated as specified in the power calculation. | ||||||||
| Outcome or subgroup title | No. of studies | No. of participants | Statistical method | Effect size |
| 1 Serum vitamin B12 levels Show forest plot | 2 | Mean Difference (IV, Random, 95% CI) | Totals not selected | |
| 2 Number of participants with normalisation of serum vitamin B12 deficiency Show forest plot | 2 | Risk Ratio (M‐H, Random, 95% CI) | Subtotals only | |
| 3 Adverse events Show forest plot | 1 | Risk Ratio (M‐H, Fixed, 95% CI) | Subtotals only | |
| 4 Haemoglobin Show forest plot | 1 | Mean Difference (IV, Random, 95% CI) | Subtotals only | |
| 5 Mean corpuscular volume Show forest plot | 2 | Mean Difference (IV, Random, 95% CI) | Subtotals only | |
| 6 Total homocysteine Show forest plot | 1 | Mean Difference (IV, Random, 95% CI) | Subtotals only | |
| 7 Serum methylmalonic acid Show forest plot | 1 | Mean Difference (IV, Random, 95% CI) | Subtotals only | |