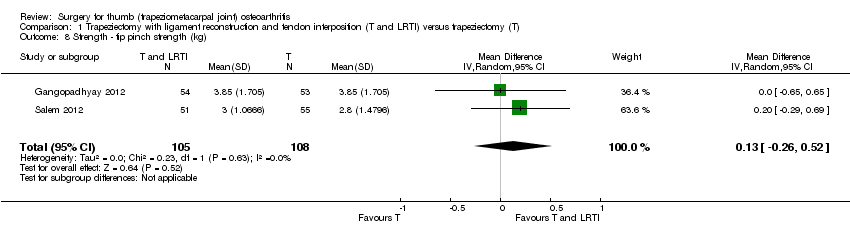
| Trapeziectomy with ligament reconstruction and tendon interposition (T and LRTI) versus trapeziectomy (T) |
| Patient or population: Patients with thumb (trapeziometacarpal joint) osteoarthritis
Settings: Hospital
Intervention: Trapeziectomy with ligament reconstruction and tendon interposition (T and LRTI)
Comparison: Trapeziectomy (T) |
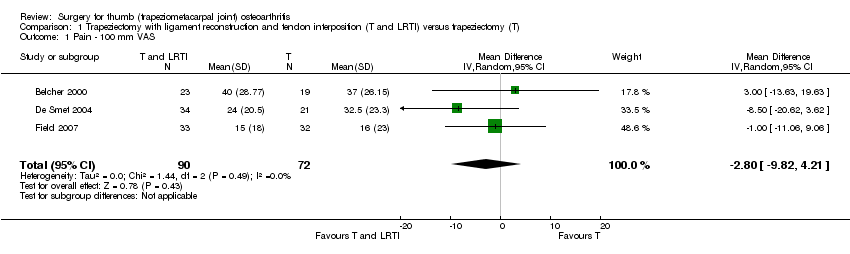
| Pain
100mm VAS . Scale from: 0 to 100.
Follow‐up: 3 to 54 months | The mean pain in the control groups was
26 mm | The mean pain in the intervention groups was
2.8 lower
(9.8 lower to 4.2 higher) | | 162
(3 studies) | ⊕⊕⊝⊝
low1,2,3,4 | Absolute change ‐3% (‐10% to 4%); Relative change ‐4% (‐13% to 6%)5. |
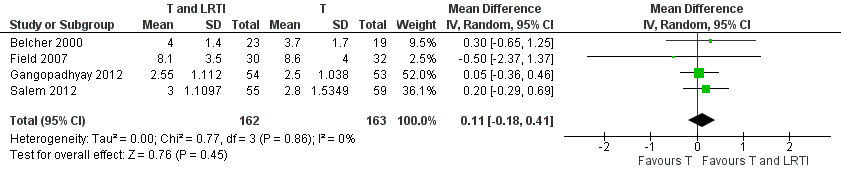
| Physical function
DASH Score. Scale from: 0 to 100.
Follow‐up: 7 to 97 months | The mean physical function in the control groups was
31 points | The mean physical function in the intervention groups was
0.01 standard deviations higher
(0.30 lower to 0.32 higher) This translates to an absolute mean increase of 0.03 (‐0.83 to 0.88) points compared to control using a 0 to 100 point scale7 | | 211
(3 studies) | ⊕⊕⊝⊝
low1,2,4,6 | SMD 0.01 (‐0.30 to 0.32); Absolute change 0.03% (‐0.83% to 0.88%); Relative change 0.05% (‐1.56% to 1.66%)7. |
| Quality of life ‐ not measured | See comment | See comment | Not estimable | — | See comment | Not reported in any study. |
| Global assessment ‐ not measured | See comment | See comment | Not estimable | — | See comment | Not reported in any study. |
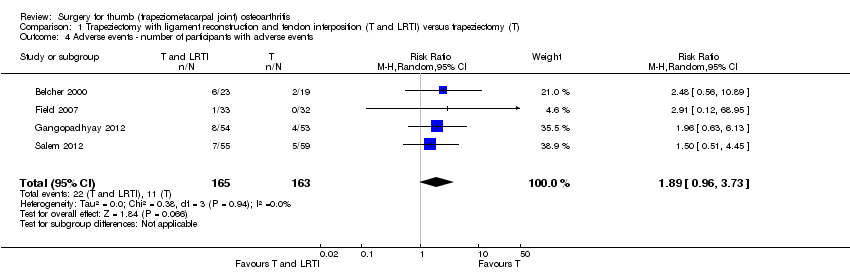
| Adverse events
Complications reported
Follow‐up: 7 to 54 months | Moderate | RR 1.81
(0.96 to 3.73) | 328
(4 studies) | ⊕⊕⊝⊝
low1,3,4,6,8 | Absolute change of 5% (‐1% to 11%)<BR/>Relative change 89% (‐4% to 273%) |
| 10 per 100 | 19 per 100
(10 to 39) |
| Treatment failure ‐ not measured | See comment | See comment | Not estimable | — | See comment | Not reported in any study. |
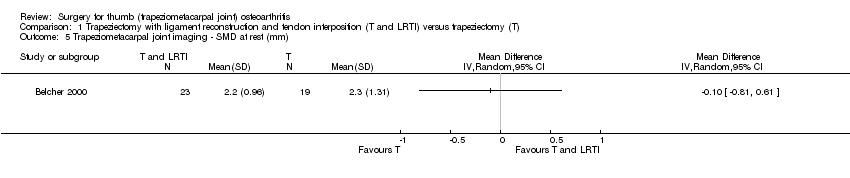
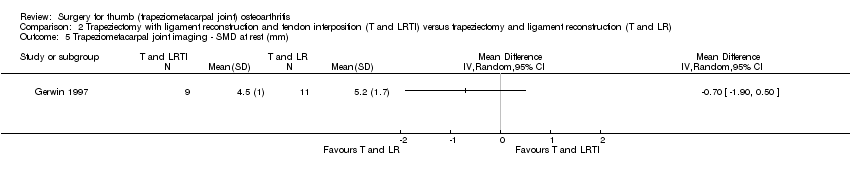
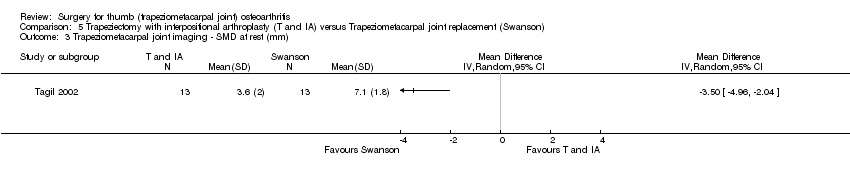
| Trapeziometacarpal joint imaging
Scapho‐metacarpal distance
Follow‐up: 7 to 29 months | The mean trapeziometacarpal joint imaging in the control groups was
2.3 mm | The mean trapeziometacarpal joint imaging in the intervention groups was
0.1 lower
(0.81 lower to 0.61 higher) | | 42
(1 study) | ⊕⊕⊝⊝
low1,4 | Absolute and relative change cannot be calculated9. |
| *The basis for the assumed risk (e.g. the median control group risk across studies) is provided in footnotes. The corresponding risk (and its 95% CI) is based on the assumed risk in the comparison group and the relative effect of the intervention (and its 95% CI).
CI: Confidence interval; RR: Risk ratio. |
| GRADE Working Group grades of evidence
High quality: Further research is very unlikely to change our confidence in the estimate of effect.
Moderate quality: Further research is likely to have an important impact on our confidence in the estimate of effect and may change the estimate.
Low quality: Further research is very likely to have an important impact on our confidence in the estimate of effect and is likely to change the estimate.
Very low quality: We are very uncertain about the estimate. |