Raspaje y pulido sistemático para la salud periodontal en adultos
Información
- DOI:
- https://doi.org/10.1002/14651858.CD004625.pub4Copiar DOI

- Base de datos:
-
- Cochrane Database of Systematic Reviews
- Versión publicada:
-
- 07 noviembre 2013see what's new
- Tipo:
-
- Intervention
- Etapa:
-
- Review
- Grupo Editorial Cochrane:
-
Grupo Cochrane de Salud oral
- Copyright:
-
- Copyright © 2013 The Cochrane Collaboration. Published by John Wiley & Sons, Ltd.
Cifras del artículo
Altmetric:
Citado por:
Autores
Contributions of authors
Paul Beirne (PB), Helen Worthington (HW), Jan Clarkson (JC) and Andrew Forgie (AF) wrote the protocol. For the initial review PB and AF decided which studies were eligible. All four current authors have been involved in the final decisions on inclusion/exclusion. Risk of bias assessments were made by Gemma Bryan (GB) and Helen Worthington (HW). Data extraction and analysis were undertaken by PB, JC and HW. The review update was written by HW, JC and GB.
Sources of support
Internal sources
-
The School of Dentistry, The University of Manchester, UK.
-
The University of Dundee, UK.
-
NHS Education for Scotland, UK.
-
University College Cork, Ireland.
-
Manchester Academic Health Sciences Centre (MAHSC), UK.
The Cochrane Oral Health Group is supported by MAHSC and the NIHR Manchester Biomedical Research Centre.
External sources
-
National Institute for Health and Care Excellence, UK.
-
Cochrane Fellowship ‐ Health Research Board, Ireland.
-
Department of Health Cochrane Review Incentive Scheme, UK.
-
Cochrane Oral Health Group Global Alliance, UK.
All reviews in the Cochrane Oral Health Group are supported by Global Alliance member organisations (British Association of Oral Surgeons, UK; British Orthodontic Society, UK; British Society of Paediatric Dentistry, UK; British Society of Periodontology, UK; Canadian Dental Hygienists Association, Canada; National Center for Dental Hygiene Research & Practice, USA; Mayo Clinic, USA; New York University College of Dentistry, USA; and Royal College of Surgeons of Edinburgh, UK) providing funding for the editorial process (http://ohg.cochrane.org/).
-
National Institute for Health Research (NIHR), UK.
CRG funding acknowledgement:
The NIHR is the largest single funder of the Cochrane Oral Health Group.Disclaimer:
The views and opinions expressed therein are those of the authors and do not necessarily reflect those of the NIHR, NHS or the Department of Health.
Declarations of interest
Helen V Worthington: no interests to declare.
Jan E Clarkson: no interests to declare.
Gemma Bryan: no interests to declare.
Paul V Beirne: no interests to declare.
Acknowledgements
We acknowledge the contribution of Andrew Forgie to the protocol of the review. We wish to thank Anne Littlewood (Cochrane Oral Health Group) for her assistance with literature searching; Luisa Fernandez Mauleffinch and Phil Riley (Cochrane Oral Health Group) for their help with the preparation of this review; Regina Mitezki for translating three German articles; Mikako Hayashi for translating a Japanese study; Lowell Smith, Ram Nanda, Jan Lindhe and Lim Lum Pen for responding to our requests for information on specific trials. The review authors are also grateful for the comments of members of the Guideline Development Group on recall intervals between routine dental examinations conducted under the auspices of the National Institute for Health and Care Excellence (NICE) and co‐ordinated by the National Collaborating Centre for Acute Care. In particular the review authors would like to thank Jacqueline Dutchak and Nigel Pitts.
Version history
| Published | Title | Stage | Authors | Version |
| 2018 Dec 27 | Routine scale and polish for periodontal health in adults | Review | Thomas Lamont, Helen V Worthington, Janet E Clarkson, Paul V Beirne | |
| 2013 Nov 07 | Routine scale and polish for periodontal health in adults | Review | Helen V Worthington, Jan E Clarkson, Gemma Bryan, Paul V Beirne | |
| 2007 Oct 17 | Routine scale and polish for periodontal health in adults | Review | Paul V Beirne, Helen V Worthington, Jan E Clarkson | |
| 2005 Jan 24 | Routine scale and polish for periodontal health in adults | Review | Paul V Beirne, Andrew Forgie, Helen V Worthington, Jan E Clarkson | |
| 2004 Jan 26 | Routine scale and polish for periodontal health in adults | Protocol | Andrew Forgie, Paul V Beirne, Helen V Worthington, Jan E Clarkson | |
Differences between protocol and review
We have tightened up the inclusion criteria to exclude split‐mouth studies, studies including participants with severe periodontal disease, participants who had been referred for specialist treatment, or who had undergone specialist periodontal treatment and were in the maintenance phase. We also excluded studies with only a single scale and polish treatment. In a previous version the search strategy was amended and the primary and secondary outcomes altered.
Keywords
MeSH
Medical Subject Headings (MeSH) Keywords
Medical Subject Headings Check Words
Adult; Humans;
PICO

Risk of bias graph: review authors' judgements about each risk of bias item presented as percentages across all included studies.

Risk of bias summary: review authors' judgements about each risk of bias item for each included study.

Comparison 1 Scale and polish versus no scale and polish (control), Outcome 1 Gingivitis at 24 months.

Comparison 1 Scale and polish versus no scale and polish (control), Outcome 2 Calculus at 24 months.

Comparison 1 Scale and polish versus no scale and polish (control), Outcome 3 Plaque at 24 months.
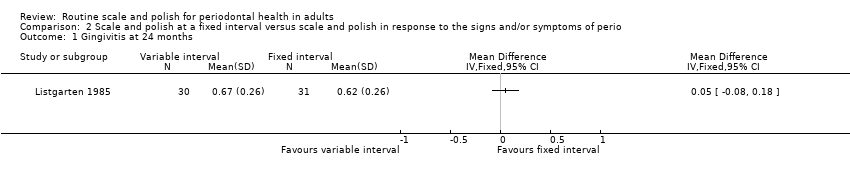
Comparison 2 Scale and polish at a fixed interval versus scale and polish in response to the signs and/or symptoms of perio, Outcome 1 Gingivitis at 24 months.

Comparison 2 Scale and polish at a fixed interval versus scale and polish in response to the signs and/or symptoms of perio, Outcome 2 Plaque at 24 months.

Comparison 2 Scale and polish at a fixed interval versus scale and polish in response to the signs and/or symptoms of perio, Outcome 3 Pocket depth at 24 months.
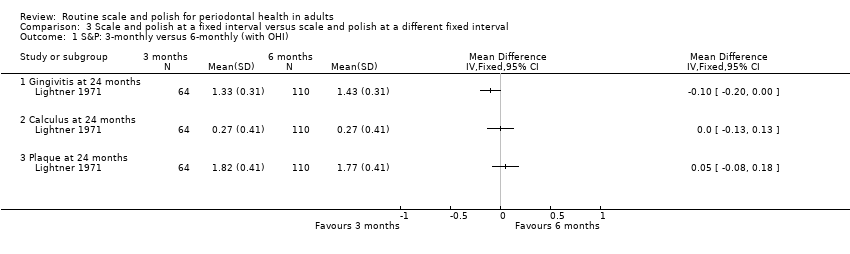
Comparison 3 Scale and polish at a fixed interval versus scale and polish at a different fixed interval, Outcome 1 S&P: 3‐monthly versus 6‐monthly (with OHI).

Comparison 3 Scale and polish at a fixed interval versus scale and polish at a different fixed interval, Outcome 2 S&P: 3‐monthly versus 12‐monthly (with OHI).
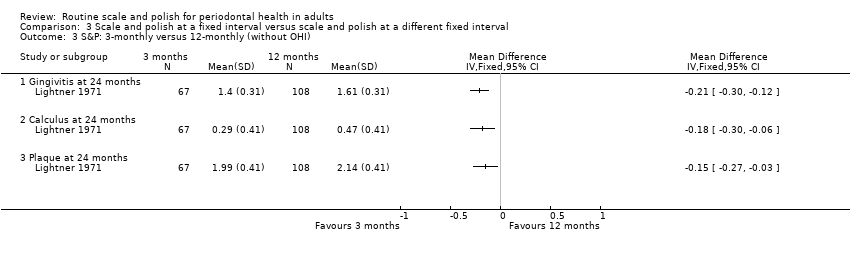
Comparison 3 Scale and polish at a fixed interval versus scale and polish at a different fixed interval, Outcome 3 S&P: 3‐monthly versus 12‐monthly (without OHI).

Comparison 3 Scale and polish at a fixed interval versus scale and polish at a different fixed interval, Outcome 4 S&P: 6‐monthly versus 12‐monthly (with OHI).

Comparison 4 Scale and polish at a fixed interval with OHI versus scale and polish without OHI at the same fixed interval, Outcome 1 S&P every 3 months with OHI versus without OHI.

Comparison 4 Scale and polish at a fixed interval with OHI versus scale and polish without OHI at the same fixed interval, Outcome 2 S&P every 12 months with OHI versus without OHI.
| Routine scale and polish compared with no treatment for periodontal health | ||||
| Patient or population: Healthy dentate adults Settings: General dental practice Intervention: Routine scale and polish (either 6‐monthly or 12‐monthly) Comparison: No treatment | ||||
| Outcomes | Relative effect | No of participants | Quality of the evidence | Comments |
| Gingivitis (proportion of index sites bleeding) at 24 months 6‐monthly scale and polish Mean proportion in control group is 0.40 sites | MD ‐0.02 (‐0.10 to 0.06) | 1 study1 (207 participants) | ⊕⊕⊝⊝ | The results for 12‐monthly scale and polish were similar and also not significant |
| Calculus (mean depth in mm at index sites) at 24 months 6‐monthly scale and polish Mean in control group is 0.95 mm | MD ‐0.24 (‐0.51 to 0.03) | 1 study1 (207 participants) | ⊕⊕⊝⊝ | The results for 12‐monthly scale and polish were similar and also not significant |
| Plaque (proportion of index sites with plaque) at 24 months 6‐monthly scale and polish Mean proportion in control group is 0.44 sites | MD ‐0.04 (‐0.13 to 0.05) | 1 study1 (207 participants) | ⊕⊕⊝⊝ | The results for 12‐monthly scale and polish were similar and also not significant |
| CI: confidence interval; MD: mean difference | ||||
| GRADE Working Group grades of evidence | ||||
| 1Single study at unclear risk of bias | ||||
| Routine scale and polish at different frequencies for periodontal health | ||||
| Patient or population: Healthy dentate young adults Settings: Air Force Academy Intervention: Routine scale and polish every 6 months with oral hygiene instruction Comparison: Routine scale and polish every 12 months with oral hygiene instruction | ||||
| Outcomes | Relative effect | No of participants | Quality of the evidence | Comments |
| Gingivitis different indices used | SMD ‐0.08 (‐0.27 to 0.10) | 2 studies1 (438 participants) | ⊕⊕⊝⊝ | The results for comparing 3 versus 12 months are significant but based on only 1 study |
| Calculus different indices used | SMD ‐0.25 (‐0.44 to ‐0.06) | 2 studies1 (438 participants) | ⊕⊕⊝⊝ | The results for comparing 3 versus 12 months are significant but based on only 1 study |
| Plaque different indices used | SMD ‐0.16 (‐0.35 to 0.03) | 2 studies1 (438 participants) | ⊕⊕⊝⊝ | The results for comparing 3 versus 12 months are generally not significant |
| CI: confidence interval; MD: mean difference; SMD: standardised mean difference | ||||
| GRADE Working Group grades of evidence | ||||
| 12 studies at unclear risk of bias | ||||
| Routine scale and polish with and without oral hygiene instruction for periodontal health | ||||
| Patient or population: Healthy dentate young adults Settings: Air Force Academy Intervention: Routine scale and polish with oral hygiene instruction Comparison: Routine scale and polish without oral hygiene instruction | ||||
| Outcomes | Relative effect | No of participants | Quality of the evidence | Comments |
| Gingivitis (mean on 0‐3 scale) at 24 months 3‐monthly scale and polish Mean gingivitis score (0‐3 scale) in control group is 1.40 | MD ‐0.07 (‐0.18 to 0.04) | 1 study1 (131 participants) | ⊕⊕⊝⊝ | Results for 12‐monthly scale and polish was significant |
| Calculus (mean on 0‐3 scale) at 24 months 3‐monthly scale and polish Mean calculus score (0‐3 scale) in control group is 0.29 mm | MD ‐0.02 (‐0.16 to 0.12) | 1 study1 (131 participants) | ⊕⊕⊝⊝ | Results for 12‐monthly scale and polish was similar |
| Plaque (mean on 0‐3 scale) at 24 months 3‐monthly scale and polish Mean plaque score (0‐3 scale) in control group is 1.99 | MD ‐0.17 (‐0.31 to ‐0.03) | 1 study1 (131 participants) | ⊕⊕⊝⊝ | Results for 12‐monthly scale and polish was not significant |
| CI: confidence interval; MD: mean difference | ||||
| GRADE Working Group grades of evidence | ||||
| 1Single study at unclear risk of bias | ||||
| Routine scale and polish undertaken by dentist or dental care professional for periodontal health | ||||
| Patient or population: Healthy dentate adults Settings: General dental practice Intervention: Routine scale and polish by dental professional Comparison: Routine scale and polish by dentist | ||||
| Outcomes | Relative effect | No of participants | Quality of the evidence | Comments |
| Gingivitis | No studies | |||
| Calculus | No studies | |||
| Plaque | No studies | |||
| GRADE Working Group grades of evidence | ||||
| Study | Notes/references | Plaque | Calculus | Gingivitis/bleeding | Pocket depth | Attachment change | Periodontal indices |
| Jones 2011 | For references to index teeth used in trial seeRamfjord 1959 | Visual presence of any plaque on the 6 (Ramfjord) index teeth according to a dichotomous scale: plaque present/not present | Measurement of calculus in mm: 1 measurement, | Bleeding from the gingival margin of 6 (Ramfjord) index teeth. Bleeding was detected by running a blunt‐ended (PCP‐10) probe gently around the gingival margin of the tooth at a 60° | Not reported | Not reported | Not reported |
| Lightner 1971 | For references to indices used in trial seeO' Leary 1967. The examination system used was the Periodontal Screening Examination (O' Leary 1967). The mouth is divided into 6 segments. The highest score found for any tooth in a segment is recorded as the score for the segment | Plaque index (no description of the precise criteria used). Plaque scores range from 0 to 3. Data reported as mean plaque index scores | Hard deposit index. Hard deposit scores range from 0 to 3 (precise criteria not described). Data presented as mean hard deposit index scores | Gingival index (precise criteria not described). Gingival scores range from 0 to 3. Data reported as mean gingival index scores | Not reported | Loss of epithelial attachment. Data reported as mean attachment loss (mm). Reported data not used in this review as no standard deviations provided | Periodontal index. Possible scores of 0, 4, 5 or 6 (criteria described in full in the paper). To simplify the statistical handling of data, scores 4, 5 and 6 were transformed to 1, 2 and 3 respectively. Reported data were not used in this review as presented in an inappropriate format |
| Listgarten 1985 | For references to indices used in trial seeLoe 1967 | Modified plaque index. Index based on a 0‐3 score (Loe 1967). Each tooth was scored on the mid‐buccal and mid‐lingual surfaces as well as on the mesial buccal surface. The mean values for the whole mouth obtained by adding all mid‐buccal and mid‐lingual and the doubled value of the mesial buccal scores and dividing by the number of surfaces at risk. Data reported as mean plaque index scores for control and test groups | Not reported | Modified gingival index (Loe 1967). Index is based on a 0‐3 score. Data reported as mean gingival index scores for control and test groups for all surfaces measured at each examination | Probing depth. Data reported as mean probing depth (mm). Probing depth recorded to the nearest mm with uniform probes calibrated in mm, with a tip diameter of 0.35 mm | Recession recorded to the nearest mm as the distance from the gingival margin to the cemento‐enamel junction (only when a distinct cemento‐enamel junction was identifiable) | Not reported |
| mm = millimetre | |||||||
| Frequency of scale and polish | Data points | Plaque | Calculus | Gingivitis/bleeding | Pocket depth | Attachment change |
| 6 months | 24 | Jones 2011 | Jones 2011 | Jones 2011 | ||
| 12 months | 24 | Jones 2011 | Jones 2011 | Jones 2011 |
| Frequency of scale and polish | Data points | Plaque | Calculus | Gingivitis/bleeding | Pocket depth | Attachment change |
| 6 months | 6 | Listgarten 1985 | Listgarten 1985 | Listgarten 1985 | ||
| 12 | Listgarten 1985 | Listgarten 1985 | Listgarten 1985 | |||
| 18 | Listgarten 1985 | Listgarten 1985 | Listgarten 1985 | |||
| 24 | Listgarten 1985 | Listgarten 1985 | Listgarten 1985 | |||
| 30 | Listgarten 1985 | Listgarten 1985 | Listgarten 1985 | |||
| 36 | Listgarten 1985 | Listgarten 1985 | Listgarten 1985 |
| Frequency of scale and polish | Data points | Plaque | Calculus | Gingivitis/bleeding | Pocket depth | Attachment change | Periodontal indices |
| 3 months versus 6 months | 12 | Lightner 1971 | Lightner 1971 | Lightner 1971 | |||
| 24 | Lightner 1971 | Lightner 1971 | Lightner 1971 | ||||
| 36 | Lightner 1971 | Lightner 1971 | Lightner 1971 | ||||
| 46 | Lightner 1971 | Lightner 1971 | Lightner 1971 | ||||
| 3 months versus 12 months | 24 | Lightner 1971 | Lightner 1971 | Lightner 1971 | |||
| 36 | Lightner 1971 | Lightner 1971 | Lightner 1971 | ||||
| 46 | Lightner 1971 | Lightner 1971 | Lightner 1971 | ||||
| 6 months versus 12 months | 24 | Lightner 1971 Jones 2011 | Lightner 1971 Jones 2011 | Lightner 1971 Joners 2011 | |||
| 36 | Lightner 1971 | Lightner 1971 | Lightner 1973 | ||||
| 46 | Lightner 1971 | Lightner 1971 | Lightner 1971 | ||||
| Outcome measured | Variable interval | Fixed interval | ||||||
| Mean | SD | n | Mean | SD | n | MD (95% CI) | P value | |
| Gingivitis | ||||||||
| 6 months | 0.3 | 0.26 | 30 | 0.29 | 0.26 | 31 | 0.01 (‐0.12, 0.14) | 0.88 |
| 12 | 0.4 | 0.26 | 30 | 0.42 | 0.26 | 31 | ‐0.02 (‐0.15, 0.11) | 0.76 |
| 18 | 0.52 | 0.26 | 30 | 0.59 | 0.26 | 31 | ‐0.07 (‐0.20, 0.06) | 0.29 |
| 24 | 0.67 | 0.26 | 30 | 0.62 | 0.26 | 31 | 0.05 (‐0.08, 0.18) | 0.45 |
| 30 | 0.7 | 0.26 | 30 | 0.7 | 0.26 | 31 | 0.00 (‐0.13, 0.13) | 1.00 |
| 36 | 0.63 | 0.26 | 30 | 0.67 | 0.26 | 31 | ‐0.04 (‐0.17, 0.09) | 0.55 |
|
| ||||||||
| Plaque |
|
| ||||||
| 6 months | 0.43 | 0.24 | 30 | 0.53 | 0.24 | 31 | ‐0.10 (‐0.22, 0.02) | 0.10 |
| 12 | 0.55 | 0.24 | 30 | 0.62 | 0.24 | 31 | ‐0.07 (‐0.19, 0.05) | 0.25 |
| 18 | 0.6 | 0.24 | 30 | 0.7 | 0.24 | 31 | ‐0.10 (‐0.22, 0.02) | 0.10 |
| 24 | 0.59 | 0.24 | 30 | 0.69 | 0.24 | 31 | ‐0.10 (‐0.22, 0.02) | 0.10 |
| 30 | 0.68 | 0.24 | 30 | 0.74 | 0.24 | 31 | ‐0.06 (‐0.18, 0.06) | 0.33 |
| 36 | 0.6 | 0.24 | 30 | 0.68 | 0.24 | 31 | ‐0.08 (‐0.20, 0.04) | 0.19 |
|
| ||||||||
| Pocket depth |
|
|
|
|
|
|
|
|
| 6 months | 1.65 | 0.19 | 30 | 1.7 | 0.19 | 31 | ‐0.05 (‐0.15, 0.05) | 0.19 |
| 12 | 1.65 | 0.19 | 30 | 1.7 | 0.19 | 31 | ‐0.05 (‐0.15, 0.05) | 0.19 |
| 18 | 1.65 | 0.17 | 30 | 1.7 | 0.17 | 31 | ‐0.05 (‐0.14, 0.04) | 0.17 |
| 24 | 1.65 | 0.17 | 30 | 1.7 | 0.17 | 31 | ‐0.05 (‐0.14, 0.04) | 0.17 |
| 30 | 1.65 | 0.18 | 30 | 1.7 | 0.17 | 31 | ‐0.05 (‐0.14, 0.04) | 0.18 |
| 36 | 1.65 | 0.17 | 30 | 1.7 | 0.17 | 31 | ‐0.05 (‐0.14, 0.04) | 0.17 |
| CI = confidence interval; MD = mean difference; SD = standard deviation | ||||||||
| Comparison | Outcome measured | Variable interval | Fixed interval | MD (95% CI) | P value | ||||
| 3 versus 6 months | Gingivitis | Mean | SD | n | Mean | SD | n |
|
|
| Lightner 1971 | 12 | 1.58 | 0.31 | 64 | 1.63 | 0.31 | 110 | ‐0.05 (‐0.15, 0.05) | 0.30 |
| Lightner 1971 | 24 | 1.33 | 0.31 | 64 | 1.43 | 0.31 | 110 | ‐0.10 (‐0.20, ‐0.00) | 0.04 |
| Lightner 1971 | 36 | 1.27 | 0.31 | 64 | 1.34 | 0.31 | 110 | ‐0.07 (‐0.17, 0.03) | 0.15 |
| Lightner 1971 | 48 | 1.25 | 0.31 | 64 | 1.34 | 0.31 | 110 | ‐0.09 (‐0.19, 0.01) | 0.06 |
|
| |||||||||
|
| Calculus |
|
|
|
|
|
|
|
|
| Lightner 1971 | 12 | 0.26 | 0.41 | 64 | 0.3 | 0.41 | 110 | ‐0.04 (‐0.17, 0.09) | 0.53 |
| Lightner 1971 | 24 | 0.27 | 0.41 | 64 | 0.27 | 0.41 | 110 | 0.00 (‐0.13, 0.13) | 1.00 |
| Lightner 1971 | 36 | 0.22 | 0.41 | 64 | 0.23 | 0.41 | 110 | ‐0.01 (‐0.14, 0.12) | 0.88 |
| Lightner 1971 | 48 | 0.13 | 0.41 | 64 | 0.15 | 0.41 | 110 | ‐0.02 (‐0.15, 0.11) | 0.76 |
|
| Plaque |
|
|
|
|
|
|
|
|
| Lightner 1971 | 12 | 1.85 | 0.41 | 64 | 1.84 | 0.41 | 110 | 0.01 (‐0.12, 0.14) | 0.88 |
| Lightner 1971 | 24 | 1.82 | 0.41 | 64 | 1.77 | 0.41 | 110 | 0.05 (‐0.08, 0.18) | 0.44 |
| Lightner 1971 | 36 | 1.53 | 0.41 | 64 | 1.58 | 0.41 | 110 | ‐0.05 (‐0.18, 0.08) | 0.44 |
| Lightner 1971 | 48 | 1.48 | 0.41 | 64 | 1.47 | 0.41 | 110 | 0.01 (‐0.12, 0.14) | 0.88 |
|
| |||||||||
| 3 versus 12 months (with OHI) | Gingivitis |
|
|
|
|
|
|
|
|
| Lightner 1971 | 24 | 1.33 | 0.31 | 64 | 1.47 | 0.31 | 121 | ‐0.14 (‐0.23, ‐0.05) | 0.003 |
| Lightner 1971 | 36 | 1.27 | 0.31 | 64 | 1.39 | 0.31 | 121 | ‐0.12 (‐0.21, ‐0.03) | 0.01 |
| Lightner 1971 | 48 | 1.25 | 0.31 | 64 | 1.4 | 0.31 | 121 | ‐0.15 (‐0.24, ‐0.06) | 0.002 |
|
| |||||||||
|
| Calculus |
|
|
|
|
|
|
|
|
| Lightner 1971 | 24 | 0.27 | 0.41 | 64 | 0.4 | 0.41 | 121 | ‐0.13 (‐0.25, ‐0.01) | 0.04 |
| Lightner 1971 | 36 | 0.22 | 0.41 | 64 | 0.32 | 0.41 | 121 | ‐0.10 (‐0.22, 0.02) | 0.11 |
| Lightner 1971 | 48 | 0.13 | 0.41 | 64 | 0.26 | 0.41 | 121 | ‐0.13 (‐0.25, ‐0.01) | 0.04 |
|
| |||||||||
|
| Plaque |
|
|
|
|
|
|
|
|
| Lightner 1971 | 24 | 1.82 | 0.41 | 64 | 1.84 | 0.41 | 121 | ‐0.02 (‐0.14, 0.10) | 0.75 |
| Lightner 1971 | 36 | 1.53 | 0.41 | 64 | 1.68 | 0.41 | 121 | ‐0.15 (‐0.27, ‐0.03) | 0.02 |
| Lightner 1971 | 48 | 1.48 | 0.41 | 64 | 1.53 | 0.41 | 121 | ‐0.05 (‐0.17, 0.07) | 0.43 |
|
|
|
|
|
|
|
|
|
|
|
| 3 versus 12 months (without OHI) | Gingivitis |
|
|
|
|
|
|
|
|
| Lightner 1971 | 24 | 1.4 | 0.31 | 67 | 1.61 | 0.31 | 108 | ‐0.21 (‐0.30, ‐0.12) | < 0.001 |
| Lightner 1971 | 36 | 1.41 | 0.31 | 67 | 1.56 | 0.31 | 108 | ‐0.15 (‐0.24, ‐0.06) | 0.002 |
| Lightner 1971 | 48 | 1.34 | 0.31 | 67 | 1.55 | 0.31 | 108 | ‐0.21 (‐0.30, ‐0.12) | < 0.001 |
|
| |||||||||
|
| Calculus |
|
|
|
|
|
|
|
|
| Lightner 1971 | 24 | 0.29 | 0.41 | 67 | 0.47 | 0.41 | 108 | ‐0.18 (‐0.30, ‐0.06) | 0.005 |
| Lightner 1971 | 36 | 0.29 | 0.41 | 67 | 0.45 | 0.41 | 108 | ‐0.16 (‐0.28, ‐0.04) | 0.01 |
| Lightner 1971 | 48 | 0.19 | 0.41 | 67 | 0.33 | 0.41 | 108 | ‐0.14 (‐0.26, ‐0.02) | 0.03 |
|
| |||||||||
|
| Plaque |
|
|
|
|
|
|
|
|
| Lightner 1971 | 24 | 1.99 | 0.41 | 67 | 2.14 | 0.41 | 108 | ‐0.15 (‐0.27, ‐0.03) | 0.02 |
| Lightner 1971 | 36 | 1.9 | 0.41 | 67 | 2.04 | 0.41 | 108 | ‐0.14 (‐0.26, ‐0.02) | 0.03 |
| Lightner 1971 | 48 | 1.75 | 0.41 | 67 | 1.93 | 0.41 | 108 | ‐0.18 (‐0.30, ‐0.06) | 0.005 |
|
| |||||||||
| 6 versus 12 months | Gingivitis |
|
|
|
|
|
|
|
|
| Jones 2011 | 24 | 0.379 | 0.303 | 107 | 0.388 | 0.307 | 100 | ‐0.01 (‐0.09, 0.07) | 0.03 |
| Lightner 1971 | 24 | 1.43 | 0.31 | 110 | 1.47 | 0.31 | 121 | ‐0.04 (‐0.12, 0.04) | 0.33 |
| Lightner 1971 | 36 | 1.34 | 0.31 | 110 | 1.39 | 0.31 | 121 | ‐0.05 (‐0.13, 0.03) | 0.22 |
| Lightner 1971 | 48 | 1.34 | 0.31 | 110 | 1.4 | 0.31 | 121 | ‐0.06 (‐0.14, 0.02) | 0.14 |
|
| |||||||||
|
| Calculus |
|
|
|
|
|
|
|
|
| Jones 2011 | 24 | 0.71 | 1.0 | 107 | 0.89 | 0.99 | 100 | ‐0.18 (‐0.45, 0.09) | 0.19 |
| Lightner 1971 | 24 | 0.27 | 0.41 | 110 | 0.4 | 0.41 | 121 | ‐0.13 (‐0.24, ‐0.02) | 0.02 |
| Lightner 1971 | 36 | 0.23 | 0.41 | 110 | 0.32 | 0.41 | 121 | ‐0.09 (‐0.20, 0.02) | 0.10 |
| Lightner 1971 | 48 | 0.15 | 0.41 | 110 | 0.26 | 0.41 | 121 | ‐0.11 (‐0.22, ‐0.00) | 0.04 |
|
| |||||||||
|
| Plaque |
|
|
|
|
|
|
|
|
| Jones 2011 | 24 | 0.394 | 0.342 | 107 | 0.435 | 0.347 | 100 | ‐0.04 (‐0.13, 0.05) | 0.39 |
| Lightner 1971 | 24 | 1.77 | 0.41 | 110 | 1.84 | 0.41 | 121 | ‐0.07 (‐0.18, 0.04) | 0.19 |
| Lightner 1971 | 36 | 1.58 | 0.41 | 110 | 1.68 | 0.41 | 121 | ‐0.10 (‐0.21, 0.01) | 0.06 |
| Lightner 1971 | 48 | 1.47 | 0.41 | 110 | 1.53 | 0.41 | 121 | ‐0.06 (‐0.17, 0.05) | 0.27 |
| CI = confidence interval; MD = mean difference; OHI = oral hygiene instruction; SD = standard deviation | |||||||||
| Comparison | Outcome measured (months) | OHI | Without OHI | MD (95% CI) | P value | ||||
| Scale and polish every 3 months | Gingivitis | Mean | SD | n | Mean | SD | n |
|
|
| Lightner 1971 | 12 | 1.58 | 0.31 | 64 | 1.65 | 0.31 | 67 | ‐0.07 (‐0.18, 0.04) | 0.20 |
| Lightner 1971 | 24 | 1.33 | 0.31 | 64 | 1.4 | 0.31 | 67 | ‐0.07 (‐0.18, 0.04) | 0.20 |
| Lightner 1971 | 36 | 1.27 | 0.31 | 64 | 1.41 | 0.31 | 67 | ‐0.14 (‐0.25, ‐0.03) | 0.01 |
| Lightner 1971 | 48 | 1.25 | 0.31 | 64 | 1.34 | 0.31 | 67 | ‐0.09 (‐0.20, 0.02) | 0.10 |
|
| |||||||||
|
| Calculus |
|
|
|
|
|
|
|
|
| Lightner 1971 | 12 | 0.26 | 0.41 | 64 | 0.31 | 0.41 | 67 | ‐0.05 (‐0.19, 0.09) | 0.49 |
| Lightner 1971 | 24 | 0.27 | 0.41 | 64 | 0.29 | 0.41 | 67 | ‐0.02 (‐0.16, 0.12) | 0.78 |
| Lightner 1971 | 36 | 0.22 | 0.41 | 64 | 0.29 | 0.41 | 67 | ‐0.07 (‐0.21, 0.07) | 0.33 |
| Lightner 1971 | 48 | 0.13 | 0.41 | 64 | 0.19 | 0.41 | 67 | ‐0.06 (‐0.20, 0.08) | 0.40 |
|
| |||||||||
|
| Plaque |
|
|
|
|
|
|
|
|
| Lightner 1971 | 12 | 1.85 | 0.41 | 64 | 2.12 | 0.41 | 67 | ‐0.27 (‐0.41, ‐0.13) | < 0.001 |
| Lightner 1971 | 24 | 1.82 | 0.41 | 64 | 1.99 | 0.41 | 67 | ‐0.17 (‐0.31, ‐0.03) | 0.02 |
| Lightner 1971 | 36 | 1.53 | 0.41 | 64 | 1.9 | 0.41 | 67 | ‐0.37 (‐0.51, ‐0.23) | < 0.001 |
| Lightner 1971 | 48 | 1.48 | 0.41 | 64 | 1.75 | 0.41 | 67 | ‐0.27 (‐0.41, ‐0.13) | < 0.001 |
|
| |||||||||
| Scale and polish every 12 months | Gingivitis |
|
|
|
|
|
|
|
|
| Lightner 1971 | 24 | 1.47 | 0.31 | 121 | 1.61 | 0.31 | 108 | ‐0.14 (‐0.22, ‐0.06) | < 0.001 |
| Lightner 1971 | 36 | 1.39 | 0.31 | 121 | 1.56 | 0.31 | 108 | ‐0.17 (‐0.25, ‐0.09) | < 0.001 |
| Lightner 1971 | 48 | 1.4 | 0.31 | 121 | 1.55 | 0.31 | 108 | ‐0.15 (‐0.23, ‐0.07) | < 0.001 |
|
| Calculus |
|
|
|
|
|
|
|
|
| Lightner 1971 | 24 | 0.4 | 0.41 | 121 | 0.47 | 0.41 | 108 | ‐0.07 (‐0.18, 0.04) | 0.20 |
| Lightner 1971 | 36 | 0.32 | 0.41 | 121 | 0.45 | 0.41 | 108 | ‐0.13 (‐0.24, ‐0.02) | 0.02 |
| Lightner 1971 | 48 | 0.26 | 0.41 | 121 | 0.33 | 0.41 | 108 | ‐0.07 (‐0.18, 0.04) | 0.20 |
|
| |||||||||
|
| Plaque |
|
|
|
|
|
|
|
|
| Lightner 1971 | 24 | 1.84 | 0.41 | 121 | 2.14 | 0.41 | 108 | ‐0.30 (‐0.41, ‐0.19) | < 0.001 |
| Lightner 1971 | 36 | 1.68 | 0.41 | 121 | 2.04 | 0.41 | 108 | ‐0.36 (‐0.47, ‐0.25) | < 0.001 |
| Lightner 1971 | 48 | 1.53 | 0.41 | 121 | 1.93 | 0.41 | 108 | ‐0.40 (‐0.51, ‐0.29) | < 0.001 |
| CI = confidence interval; MD = mean difference; OHI = oral hygiene instruction; SD = standard deviation | |||||||||
| Outcome or subgroup title | No. of studies | No. of participants | Statistical method | Effect size |
| 1 Gingivitis at 24 months Show forest plot | 1 | Mean Difference (IV, Fixed, 95% CI) | Totals not selected | |
| 1.1 6‐monthly S&P | 1 | Mean Difference (IV, Fixed, 95% CI) | 0.0 [0.0, 0.0] | |
| 1.2 12‐monthly S&P | 1 | Mean Difference (IV, Fixed, 95% CI) | 0.0 [0.0, 0.0] | |
| 2 Calculus at 24 months Show forest plot | 1 | Mean Difference (IV, Fixed, 95% CI) | Totals not selected | |
| 2.1 6‐monthly S&P | 1 | Mean Difference (IV, Fixed, 95% CI) | 0.0 [0.0, 0.0] | |
| 2.2 12‐monthly S&P | 1 | Mean Difference (IV, Fixed, 95% CI) | 0.0 [0.0, 0.0] | |
| 3 Plaque at 24 months Show forest plot | 1 | Mean Difference (IV, Fixed, 95% CI) | Totals not selected | |
| 3.1 6‐monthly S&P | 1 | Mean Difference (IV, Fixed, 95% CI) | 0.0 [0.0, 0.0] | |
| 3.2 12‐monthly S&P | 1 | Mean Difference (IV, Fixed, 95% CI) | 0.0 [0.0, 0.0] | |
| Outcome or subgroup title | No. of studies | No. of participants | Statistical method | Effect size |
| 1 Gingivitis at 24 months Show forest plot | 1 | Mean Difference (IV, Fixed, 95% CI) | Totals not selected | |
| 2 Plaque at 24 months Show forest plot | 1 | Mean Difference (IV, Fixed, 95% CI) | Totals not selected | |
| 3 Pocket depth at 24 months Show forest plot | 1 | Mean Difference (IV, Fixed, 95% CI) | Totals not selected | |
| Outcome or subgroup title | No. of studies | No. of participants | Statistical method | Effect size |
| 1 S&P: 3‐monthly versus 6‐monthly (with OHI) Show forest plot | 1 | Mean Difference (IV, Fixed, 95% CI) | Totals not selected | |
| 1.1 Gingivitis at 24 months | 1 | Mean Difference (IV, Fixed, 95% CI) | 0.0 [0.0, 0.0] | |
| 1.2 Calculus at 24 months | 1 | Mean Difference (IV, Fixed, 95% CI) | 0.0 [0.0, 0.0] | |
| 1.3 Plaque at 24 months | 1 | Mean Difference (IV, Fixed, 95% CI) | 0.0 [0.0, 0.0] | |
| 2 S&P: 3‐monthly versus 12‐monthly (with OHI) Show forest plot | 1 | Mean Difference (IV, Fixed, 95% CI) | Totals not selected | |
| 2.1 Gingivitis at 24 months | 1 | Mean Difference (IV, Fixed, 95% CI) | 0.0 [0.0, 0.0] | |
| 2.2 Calculus at 24 months | 1 | Mean Difference (IV, Fixed, 95% CI) | 0.0 [0.0, 0.0] | |
| 2.3 Plaque at 24 months | 1 | Mean Difference (IV, Fixed, 95% CI) | 0.0 [0.0, 0.0] | |
| 3 S&P: 3‐monthly versus 12‐monthly (without OHI) Show forest plot | 1 | Mean Difference (IV, Fixed, 95% CI) | Totals not selected | |
| 3.1 Gingivitis at 24 months | 1 | Mean Difference (IV, Fixed, 95% CI) | 0.0 [0.0, 0.0] | |
| 3.2 Calculus at 24 months | 1 | Mean Difference (IV, Fixed, 95% CI) | 0.0 [0.0, 0.0] | |
| 3.3 Plaque at 24 months | 1 | Mean Difference (IV, Fixed, 95% CI) | 0.0 [0.0, 0.0] | |
| 4 S&P: 6‐monthly versus 12‐monthly (with OHI) Show forest plot | 2 | Std. Mean Difference (IV, Fixed, 95% CI) | Subtotals only | |
| 4.1 Gingivitis at 24 months | 2 | 438 | Std. Mean Difference (IV, Fixed, 95% CI) | ‐0.08 [‐0.27, 0.10] |
| 4.2 Calculus at 24 months | 2 | 438 | Std. Mean Difference (IV, Fixed, 95% CI) | ‐0.25 [‐0.44, ‐0.06] |
| 4.3 Plaque at 24 months | 2 | 438 | Std. Mean Difference (IV, Fixed, 95% CI) | ‐0.16 [‐0.35, 0.03] |
| Outcome or subgroup title | No. of studies | No. of participants | Statistical method | Effect size |
| 1 S&P every 3 months with OHI versus without OHI Show forest plot | 1 | Mean Difference (IV, Fixed, 95% CI) | Totals not selected | |
| 1.1 Gingivitis at 24 months | 1 | Mean Difference (IV, Fixed, 95% CI) | 0.0 [0.0, 0.0] | |
| 1.2 Calculus at 24 months | 1 | Mean Difference (IV, Fixed, 95% CI) | 0.0 [0.0, 0.0] | |
| 1.3 Plaque at 24 months | 1 | Mean Difference (IV, Fixed, 95% CI) | 0.0 [0.0, 0.0] | |
| 2 S&P every 12 months with OHI versus without OHI Show forest plot | 1 | Mean Difference (IV, Fixed, 95% CI) | Totals not selected | |
| 2.1 Gingivitis at 24 months | 1 | Mean Difference (IV, Fixed, 95% CI) | 0.0 [0.0, 0.0] | |
| 2.2 Calculus at 24 months | 1 | Mean Difference (IV, Fixed, 95% CI) | 0.0 [0.0, 0.0] | |
| 2.3 Plaque at 24 months | 1 | Mean Difference (IV, Fixed, 95% CI) | 0.0 [0.0, 0.0] | |