Tratamiento antibiótico para la diarrea asociada al Clostridium difficile en adultos
Appendices
Appendix 1. Search strategies
MEDLINE (Ovid)
[mp=title, abstract, original title, name of substance word, subject heading word, protocol supplementary concept, rare disease supplementary concept, unique identifier]
1. exp Anti‐Bacterial Agents/
2. exp Aminoglycosides/
3. exp Cephalosporins/
4. (Vancomycin or Metronidazole or Fusidic acid or Nitazoxanide or Teicoplanin or Rifampicin or Rifaximin or Bacitracin or Fidaxomicin or Amoxicillin or Azithromycin or Cephalosporin* or Cephalexin or Ciprofloxacin or Clarithromycin or Clindamycin or Doxycycline or Erythromycin or Flouroquinolone* or Levofloxacin or Macrolide* or Nitrofurantoin or Penicillin or Tetracycline or Trimethoprim or antibiotic* or anti‐bacterial* or anti bacterial* or antibacterial* or bacteriocid* or bactericid* or antimicrobial* or anti‐microbial*).mp.
5. 1 or 2 or 3 or 4
6. exp Clostridium difficile/
7. exp Clostridium Infections/
8. exp Diarrhea/dt [Drug Therapy]
9. exp Enterocolitis, Pseudomembranous/dt [Drug Therapy]
10. (Clostridium difficile or difficile or pseudomembranous enterocolitis).mp.
11. 6 or 7 or 8 or 9 or 10
12. 5 and 11
13. randomised controlled trial.pt.
14. controlled clinical trial.pt.
15. randomized.ab.
16. placebo.ab.
17. clinical trial.sh.
18. randomly.ab.
19. trial.ti.
20. 13 or 14 or 15 or 16 or 17 or 18 or 19
21. humans.sh.
22. 20 and 21
23. 12 and 22
EMBASE (Ovid)
[mp=title, abstract, subject headings, heading word, drug trade name, original title, device manufacturer, drug manufacturer, device trade name, keyword]
1. *antiinfective agent/
2. (Vancomycin or Metronidazole or Fusidic acid or Nitazoxanide or Teicoplanin or Rifampicin or Rifaximin or Bacitracin or Fidaxomicin or Amoxicillin or Azithromycin or Cephalosporin* or Cephalexin or Ciprofloxacin or Clarithromycin or Clindamycin or Doxycycline or Erythromycin or Flouroquinolone* or Levofloxacin or Macrolide* or Nitrofurantoin or Penicillin or Tetracycline or Trimethoprim or antibiotic* or anti‐bacterial* or anti bacterial* or antibacterial* or bacteriocid* or bactericid* or antimicrobial* or anti‐microbial*).m_titl.
3. 1 or 2
4. *Clostridium difficile/
5. *Clostridium infection/
6. *diarrhoea/dt [Drug Therapy]
7. *pseudomembranous colitis/dt [Drug Therapy]
8. (Clostridium difficile or difficile or pseudomembranous enterocolitis).mp.
9. 4 or 5 or 6 or 7 or 8
10. 3 and 9
11. randomised controlled trial/
12. randomization/
13. controlled study/
14. multicenter study/
15. phase 3 clinical trial/
16. phase 4 clinical trial/
17. double blind procedure/
18. single blind procedure/
19. ((singl* or doubl* or trebl* or tripl*) adj (blind* or mask*)).ti,ab.
20. (random* or cross* over* or factorial* or placebo* or volunteer*).ti,ab.
21. 16 or 13 or 17 or 19 or 12 or 18 or 14 or 11 or 20 or 15
22. "human*".ti,ab.
23. (animal* or nonhuman*).ti,ab.
24. 23 and 22
25. 23 not 24
26. 21 not 25
27. 10 and 26
Cochrane Library (CENTRAL)
#1 MeSH descriptor Anti‐Bacterial Agents explode all trees
#2 MeSH descriptor Aminoglycosides explode all trees
#3 MeSH descriptor Cephalosporins explode all trees
#4 (Vancomycin or Metronidazole or Fusidic acid or Nitazoxanide or Teicoplanin or Rifampicin or Rifaximin or Bacitracin or Fidaxomicin or Amoxicillin or Azithromycin or Cephalosporin* or Cephalexin or Ciprofloxacin or Clarithromycin or Clindamycin or Doxycycline or Erythromycin or Flouroquinolone* or Levofloxacin or Macrolide* or Nitrofurantoin or Penicillin or Tetracycline or Trimethoprim or antibiotic* or anti‐bacterial* or anti bacterial* or antibacterial* or bacteriocid* or bactericid* or antimicrobial* or anti‐microbial*):ti,ab,kw
#5 (#1 OR #2 OR #3 OR #4)
#6 MeSH descriptor Clostridium difficile explode all trees
#7 MeSH descriptor Clostridium Infections explode all trees
#8 MeSH descriptor Diarrhea explode all trees with qualifier: DT
#9 MeSH descriptor Enterocolitis, Pseudomembranous explode all trees with qualifier: DT
#10 (Clostridium difficile or difficile or pseudomembranous enterocolitis):ti,ab,kw
#11 (#6 OR #7 OR #8 OR #9 OR #10)
#12 (#5 AND #11)

Study flow diagram.
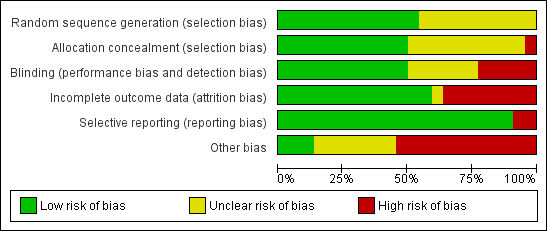
Methodological quality graph: review authors' judgements about each methodological quality item presented as percentages across all included studies.

Methodological quality summary: review authors' judgements about each methodological quality item for each included study.
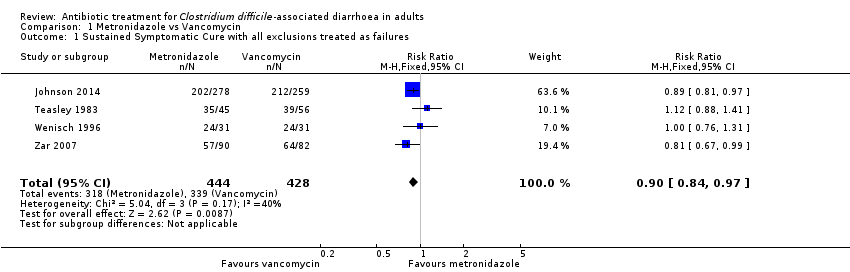
Comparison 1 Metronidazole vs Vancomycin, Outcome 1 Sustained Symptomatic Cure with all exclusions treated as failures.
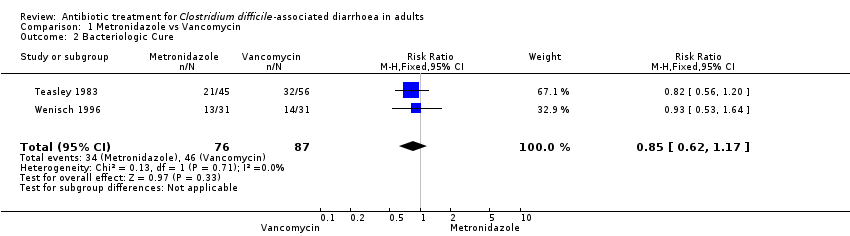
Comparison 1 Metronidazole vs Vancomycin, Outcome 2 Bacteriologic Cure.
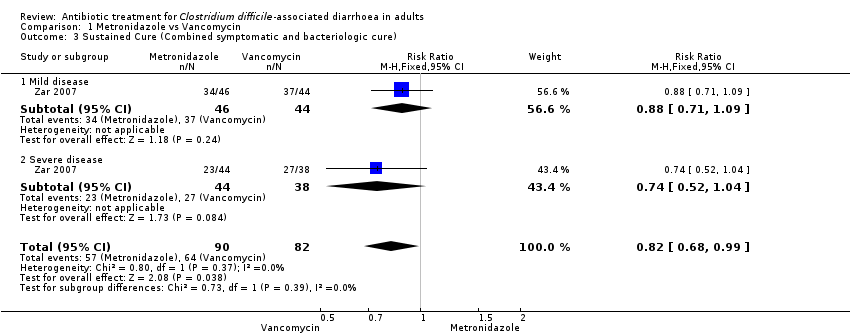
Comparison 1 Metronidazole vs Vancomycin, Outcome 3 Sustained Cure (Combined symptomatic and bacteriologic cure).
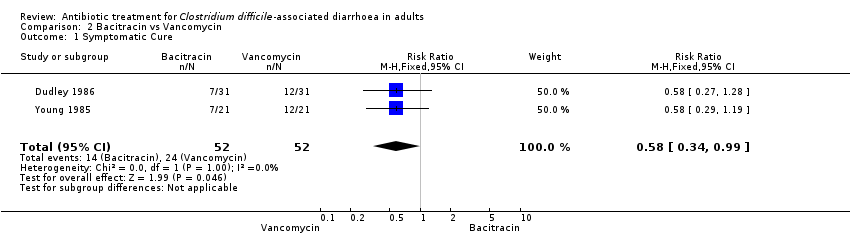
Comparison 2 Bacitracin vs Vancomycin, Outcome 1 Symptomatic Cure.
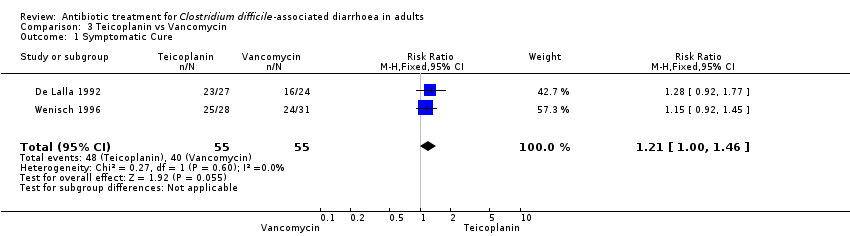
Comparison 3 Teicoplanin vs Vancomycin, Outcome 1 Symptomatic Cure.
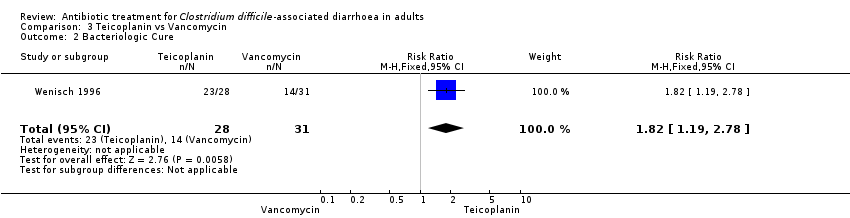
Comparison 3 Teicoplanin vs Vancomycin, Outcome 2 Bacteriologic Cure.
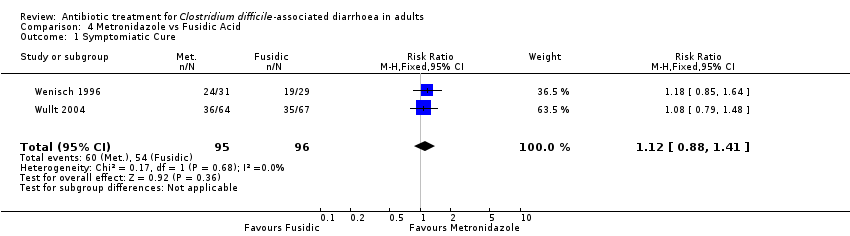
Comparison 4 Metronidazole vs Fusidic Acid, Outcome 1 Symptomiatic Cure.

Comparison 4 Metronidazole vs Fusidic Acid, Outcome 2 Bacteriologic Cure.

Comparison 5 Fidaxomicin vs Vancomycin, Outcome 1 Symptomatic Cure.
| Metronidazole versus Vancomycin for Clostridium difficile‐associated diarrhoea in adults | ||||||
| Patient or population: patients with Clostridium difficile‐associated diarrhoea in adults | ||||||
| Outcomes | Illustrative comparative risks* (95% CI) | Relative effect | No of Participants | Quality of the evidence | Comments | |
| Assumed risk | Corresponding risk | |||||
| Control | Metronidazole versus Vancomycin | |||||
| Symptomatic cure with all exclusions treated as failures | 792 per 10001 | 713 per 1000 | RR 0.9 | 872 | ⊕⊕⊕⊝ | |
| Bacteriologic cure | 529 per 10001 | 449 per 1000 | RR 0.85 | 163 | ⊕⊝⊝⊝ | |
| Cure (combined symptomatic and bacteriologic cure) ‐ mild disease | 841 per 10001 | 740 per 1000 | RR 0.88 | 90 | ⊕⊝⊝⊝ | |
| Cure (combined symptomatic and bacteriologic cure) ‐ severe disease | 711 per 10001 | 526 per 1000 | RR 0.74 | 82 | ⊕⊝⊝⊝ | |
| *The basis for the assumed risk (e.g. the median control group risk across studies) is provided in footnotes. The corresponding risk (and its 95% confidence interval) is based on the assumed risk in the comparison group and the relative effect of the intervention (and its 95% CI). | ||||||
| GRADE Working Group grades of evidence | ||||||
| 1 Control group risk comes from control arm of meta‐analysis, based on included trials. | ||||||
| Teicoplanin versus Vancomycin for Clostridium difficile‐associated diarrhoea in adults | ||||||
| Patient or population: patients with Clostridium difficile‐associated diarrhoea in adults | ||||||
| Outcomes | Illustrative comparative risks* (95% CI) | Relative effect | No of Participants | Quality of the evidence | Comments | |
| Assumed risk | Corresponding risk | |||||
| Control | Teicoplanin versus Vancomycin | |||||
| Symptomatic Cure | 727 per 10001 | 880 per 1000 | RR 1.21 | 110 | ⊕⊝⊝⊝ | |
| Bacteriologic Cure | 452 per 10001 | 822 per 1000 | RR 1.82 | 59 | ⊕⊝⊝⊝ | |
| *The basis for the assumed risk (e.g. the median control group risk across studies) is provided in footnotes. The corresponding risk (and its 95% confidence interval) is based on the assumed risk in the comparison group and the relative effect of the intervention (and its 95% CI). | ||||||
| GRADE Working Group grades of evidence | ||||||
| 1 Control group risk comes from control arm of meta‐analysis, based on included trials. | ||||||
| Fidaxomicin compared to Vancomycin for Clostridium difficile‐associated diarrhoea in adults | ||||||
| Patient or population: patients with Clostridium difficile‐associated diarrhoea in adults | ||||||
| Outcomes | Illustrative comparative risks* (95% CI) | Relative effect | No of Participants | Quality of the evidence | Comments | |
| Assumed risk | Corresponding risk | |||||
| Vancomycin | Fidaxomicin | |||||
| Symptomatic Cure | 610 per 10001 | 713 per 1000 | RR 1.17 | 1164 | ⊕⊕⊕⊝ | |
| *The basis for the assumed risk (e.g. the median control group risk across studies) is provided in footnotes. The corresponding risk (and its 95% confidence interval) is based on the assumed risk in the comparison group and the relative effect of the intervention (and its 95% CI). | ||||||
| GRADE Working Group grades of evidence | ||||||
| 1 Control group risk comes from control arm of meta‐analysis, based on included trials. | ||||||
| Bacitracin versus Vancomycin for Clostridium difficile‐associated diarrhoea in adults | ||||||
| Patient or population: patients with Clostridium difficile‐associated diarrhoea in adults | ||||||
| Outcomes | Illustrative comparative risks* (95% CI) | Relative effect | No of Participants | Quality of the evidence | Comments | |
| Assumed risk | Corresponding risk | |||||
| Control | Bacitracin versus Vancomycin | |||||
| Symptomatic Cure | 462 per 10001 | 268 per 1000 | RR 0.58 | 104 | ⊕⊝⊝⊝ | |
| *The basis for the assumed risk (e.g. the median control group risk across studies) is provided in footnotes. The corresponding risk (and its 95% confidence interval) is based on the assumed risk in the comparison group and the relative effect of the intervention (and its 95% CI). | ||||||
| GRADE Working Group grades of evidence | ||||||
| 1 Control group risk comes from control arm of meta‐analysis, based on included trials. | ||||||
| Study | n=Total | Deaths | Harms due to Intervention | Attrition% | Stratified by Severity |
| 49 | 1 | joint pain | <10% | ||
| 20 | 0 | 0 | 0 | ||
| 535 | 20 Fid 17 Van | none | 4.9% | Yes post randomisation | |
| 51 | 2 | NR | 10% | ||
| 62 | 0 | NR | 52% | ||
| 46 | 0 | NR | 18% | ||
| 79 | skin rash | 14% | |||
| 1118 | 23 Met 16 Van | none | 1.8% | Yes post randonisation | |
| 39 | 2 | 0 | |||
| 209 | 4 | 5 | 7% | ||
| 49 | 0 | 4% | |||
| 629 | 16 Fid 21 Van | elevated liver enzymes | 5.2% | Yes post randomisation | |
| 82 | 2 | 7.3% | |||
| 72 | 0 | 44% | |||
| 142 | 4 | 23% | |||
| 50 | 0 | 2% | Yes post randomisation | ||
| 101 | 2 | NR | 7% | ||
| 126 | 3 | 5.5% | |||
| 131 | 0 | 26% | |||
| 42 | 0 | NR | 0 | ||
| 172 | 7 | 13% | Yes but uncertain when | ||
| TOTAL | 140 | ||||
| NR: None reported | |||||
| HPA1 | ESCMID2 | SHEA & IDSA3 | |
| MILD CDAD | Stop inciting antibiotic and observe, or oral metronidazole 500 mg three times daily Alternate dosing also recommended and change to vancomycin if no better in 4 days | Stop inciting antibiotic and observe, or oral metronidazole 500 mg three times daily | Stop inciting antibiotic, or oral metronidazole 500 mg three times daily for 10 days |
| SEVERE CDAD | Oral vancomycin 500 mg four times daily with tapering | Oral vancomycin 125 mg four times daily for 10 days | Oral vancomycin 125 mg four times daily for 10 days |
| SEVERE AND CANNOT TOLERATE ORAL MEDS | Intravenous metronidazole and vancomycin via nasogastric tube or enemas four times daily | Same | Same |
| SURGERY | For toxic megacolon or lactate > 5 | For perforation, toxic megacolon, Ileus, lactate > 5 | |
| RECURRENCE | First as Primary 2nd: oral vancomycin with taper | Same | |
| Outcome or subgroup title | No. of studies | No. of participants | Statistical method | Effect size |
| 1 Sustained Symptomatic Cure with all exclusions treated as failures Show forest plot | 4 | 872 | Risk Ratio (M‐H, Fixed, 95% CI) | 0.90 [0.84, 0.97] |
| 2 Bacteriologic Cure Show forest plot | 2 | 163 | Risk Ratio (M‐H, Fixed, 95% CI) | 0.85 [0.62, 1.17] |
| 3 Sustained Cure (Combined symptomatic and bacteriologic cure) Show forest plot | 1 | 172 | Risk Ratio (M‐H, Fixed, 95% CI) | 0.82 [0.68, 0.99] |
| 3.1 Mild disease | 1 | 90 | Risk Ratio (M‐H, Fixed, 95% CI) | 0.88 [0.71, 1.09] |
| 3.2 Severe disease | 1 | 82 | Risk Ratio (M‐H, Fixed, 95% CI) | 0.74 [0.52, 1.04] |
| Outcome or subgroup title | No. of studies | No. of participants | Statistical method | Effect size |
| 1 Symptomatic Cure Show forest plot | 2 | 104 | Risk Ratio (M‐H, Fixed, 95% CI) | 0.58 [0.34, 0.99] |
| Outcome or subgroup title | No. of studies | No. of participants | Statistical method | Effect size |
| 1 Symptomatic Cure Show forest plot | 2 | 110 | Risk Ratio (M‐H, Fixed, 95% CI) | 1.21 [1.00, 1.46] |
| 2 Bacteriologic Cure Show forest plot | 1 | 59 | Risk Ratio (M‐H, Fixed, 95% CI) | 1.82 [1.19, 2.78] |
| Outcome or subgroup title | No. of studies | No. of participants | Statistical method | Effect size |
| 1 Symptomiatic Cure Show forest plot | 2 | 191 | Risk Ratio (M‐H, Fixed, 95% CI) | 1.12 [0.88, 1.41] |
| 2 Bacteriologic Cure Show forest plot | 2 | 191 | Risk Ratio (M‐H, Fixed, 95% CI) | 1.07 [0.84, 1.36] |
| Outcome or subgroup title | No. of studies | No. of participants | Statistical method | Effect size |
| 1 Symptomatic Cure Show forest plot | 2 | 1164 | Risk Ratio (M‐H, Fixed, 95% CI) | 1.17 [1.07, 1.27] |