| | Analgesia | Rescue medication |
| Study ID | Treatment | PI or PR | Number with 50% PR | PGE: very good or excellent | Time to use (hr) | % using |
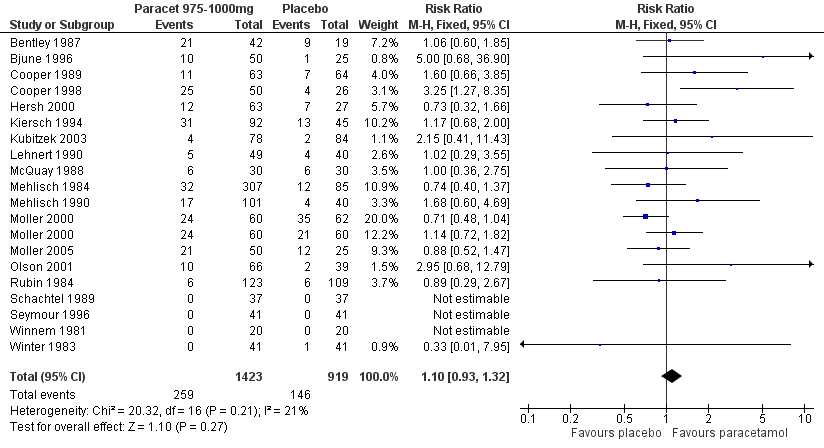
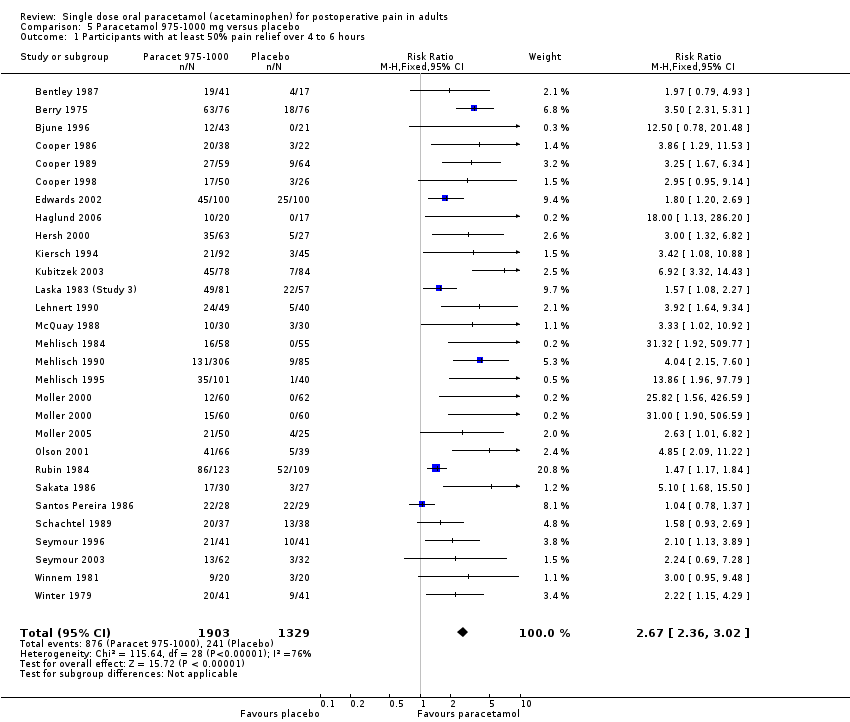
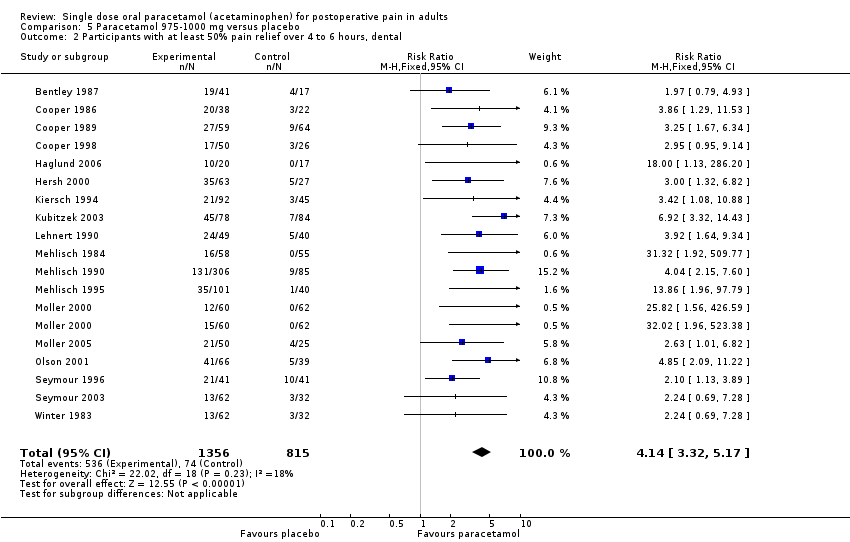
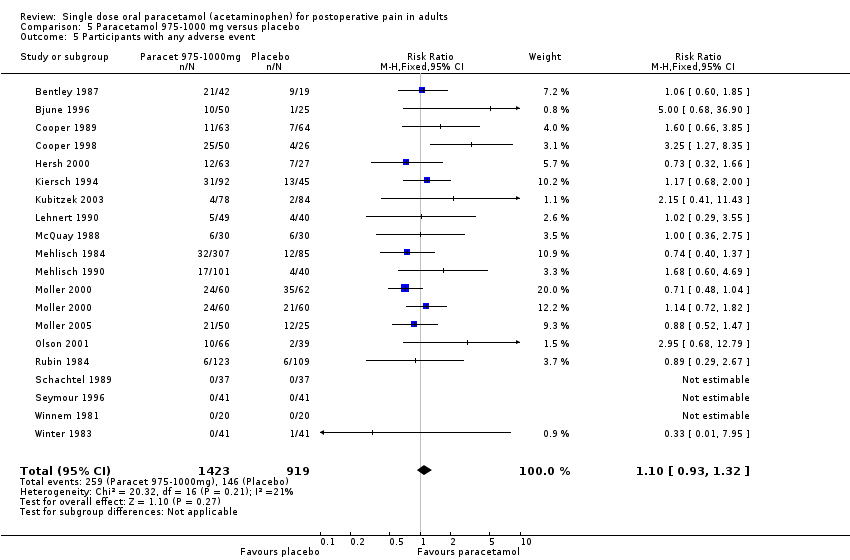
| Bentley 1987 | (1) Paracetamol 1000 mg, n=41 (2) Paracetamol+codeine 1000/60 mg, n=41 (3) Codeine 60 mg, n=21 (4) Placebo, n=17 | TOTPAR 5: (1) 8.7 (4) 4.9 | (1) 19/41 (4) 4/17 | No data | Median: (1) 3.3 (4) 1.4 | at 4 hrs: (1) 68 (4) 81 |
| Berry 1975 | (1) Paracetamol 1000 mg, n=76 (2) Propoxyphene, 65 mg, n=73 (3) Placebo, n=76 | non standard scales | (1) 63/76 (3) 18/76 | Global rating > good: (1) 63/76 (3) 18/76 | No data | at 4 hrs: (1) 2 (3) 17 |
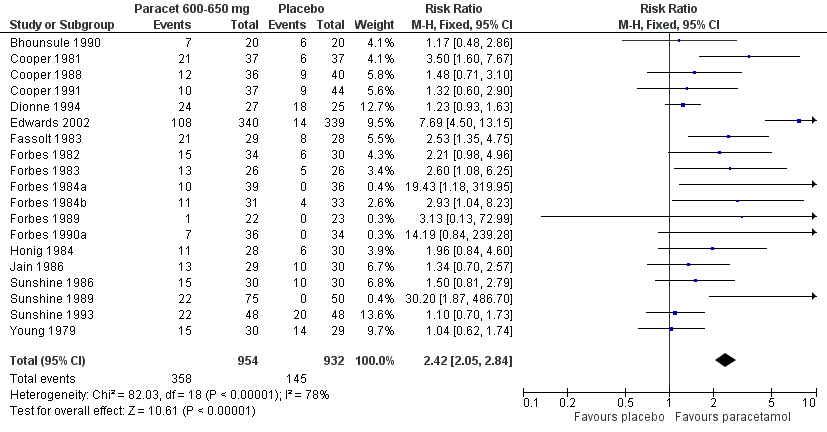
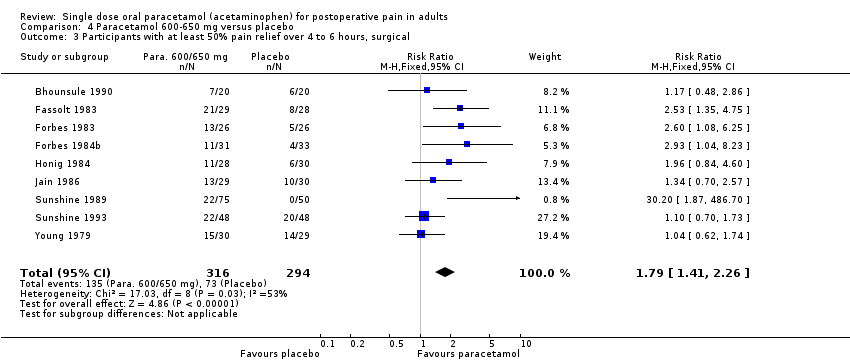
| Bhounsule 1990 | (1) Paracetamol 1000 mg, n=20 (2) Ibuprofen 400 mg, n=20 (3) Aspirin 600 mg, n=20 (4) Analgin 500 mg, n=20 (5) Placebo, n=20 | SPID 6: (1) 5.4 (5) 4.4 | (1) 7/20 (5) 6/20 | No data | No data | No data |
| Bjune 1996 | (1) Paracetamol 1000 mg, n=50 (2) Paracetamol+codeine 800/60 mg, n=50 (3) Placebo, n=25 | TOTPAR 6: severe pain (1) 6.4 (3) 0 moderate pain (1) 8.0 (3) 1.5 | (1) 12/43 (3) 0/21 | No data | No data | No data |
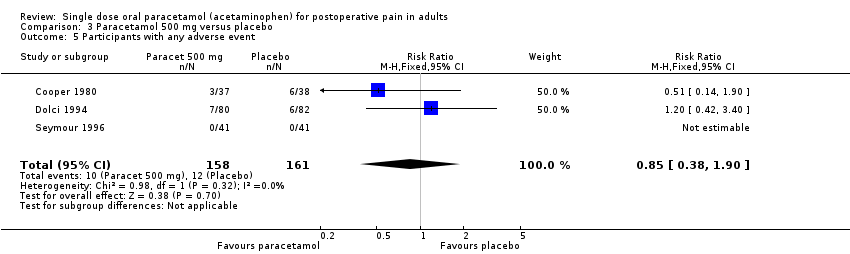
| Cooper 1980 | (1) Paracetamol 500 mg, n=37 (2) Oxycodone 5 mg, n=42 (3) Paracetamol+oxycodone 500/5 mg, n=45 (4) Paracetamol+oxycodone 1000/5 mg, n=40 (5) Paracetamol+oxycodone 1000/10 mg, n=45 (6) Placebo, n=38 | TOTPAR 4: (1) 5.1 (6) 4.8 | (1) 11/37 (6) 11/38 | No data | Mean: (1) 2.8 (6) 2.5 | No data |
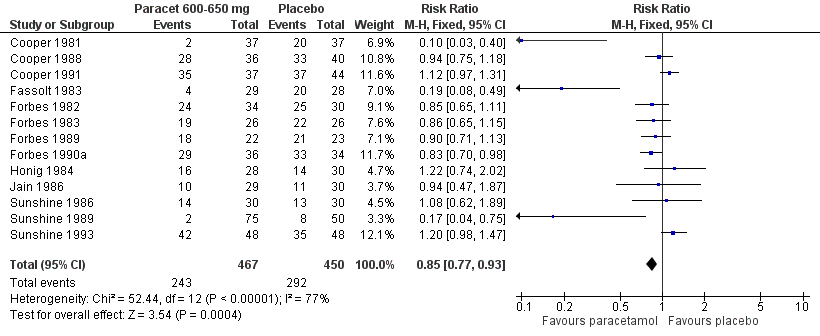
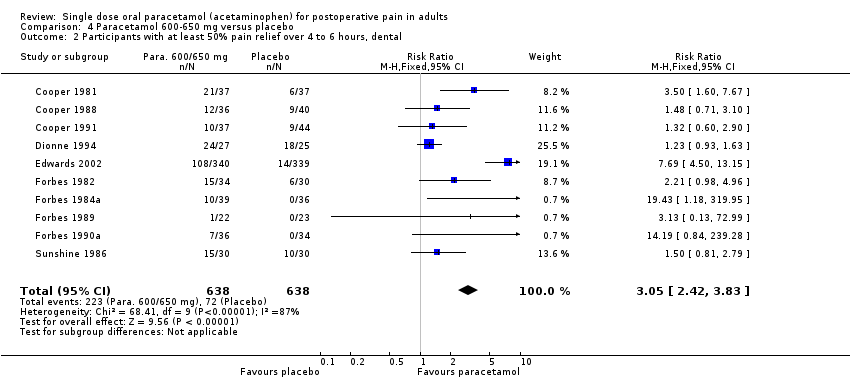
| Cooper 1981 | (1) Paracetamol 650 mg, n=37 (2) Paracetamol+codeine 650/60 mg, n=42 (3) Paracetamol+d‐propoxyphene 650/100 mg, n=42 (4) Ibuprofen 200 mg, n=42 (5) Placebo, n=37 | TOTPAR 4: (1) 8.2 (3) 3.4 | (1) 21/37 (5) 6/37 | No usable data | Mean: (1) 3.5 (5) 2.9 | at 4 hrs: (1) 5 (5) 54 |
| Cooper 1986 | (1) Paracetamol 1000 mg, n=38 (2) Paracetamol+codeine+caffeine 1000/16/30 mg, n=39 (3) Placebo, n=22 | TOTPAR 6: (1) 11.6 (3) 4.3 | (1) 20/38 (3) 3/22 | No data | Mean: (1) 4.7 (3) 3.5 | No data |
| Cooper 1988 | (1) Paracetamol 600 mg, n=36 (2) Paracetamol+codeine 600+60 mg, n=31 (3) Placebo, n=40 | TOTPAR 6: (1) 8.0 (3) 6.3 | (1) 12/36 (3) 9/40 | (1) 12/36 (3) 8/40 | No data | at 6 hrs: (1) 78 (3) 82 |
| Cooper 1989 | (1) Paracetamol 1000 mg, n=59 (2) Ibuprofen 400 mg, n=61 (3) Placebo, n=64 | TOTPAR 6: (1) 10.2 (3) 4.7 | (1) 27/59 (3) 9/64 | (1) 16/59 (3) 4/64 | Median: (1) 3.7 (3) 2.3 Mean: (1) 4.1 (3) 3.3 | at 6 hrs: (1) 63 (3) 78 |
| Cooper 1991 | (1) Paracetamol 650 mg, n=37 (2) Paracetamol+codeine 650/60 mg, n=39 (3) Zomepirac 100 mg, n=23 (4) Flurbiprofen 50 mg, n=42 (5) Flurbiprofen 100 mg, n=41 (6) Placebo, n=44 | TOTPAR 6: (1) 6.8 (6) 5.7 | (1) 10/37 (6) 9/44 | (1) 3/37 (6) 2/44 | Mean: (1) 3.2 (6) 3.1 | at 6 hrs: (1) 95 (6) 84 |
| Cooper 1998 | (1) Paracetamol 1000 mg n=50 (2) Ketoprofen 100 mg, n=51 (3) Ketoprofen 1000 mg, n=50 (4) Placebo, n=26 | TOTPAR 6: (1) 8.2 (4) 4.5 | (1) 17/50 (4) 3/26 | No data | median: (1) 3.3 (4) 1.7 | at 6 hrs: (1) 60 (4) 78 |
| Dionne 1994 | (1) Paracetamol 650 mg, n=27 (2) Paracetamol+codeine 650/60 mg, n=24 (3) Flurbiprofen 50 mg, n=25 (4) Flurbiprofen 100 mg, n=22 (5) Placebo, n=25 | TOTPAR 6: (1) 18.4 (5) 14.9 | (1) 24/27 (5) 18/25 | No usable data | no data | no data |
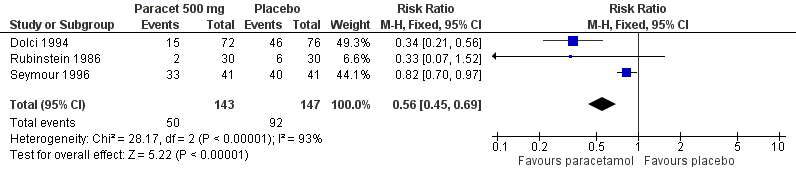
| Dolci 1994 | (1) Paracetamol 500 mg, n=72 (2) Piroxicam 20 mg, n=76 (3) Piroxicam cyclodextrin =20 mg, n=74 (4) Placebo, n=76 | TOTPAR 4: (1) 10.5 (6) 5.4 | (1) 54/72 (4) 25/76 | No usable data | no data | at 4 hrs: (1) 15/72 (4) 46/76 |
| Edwards 2002 | (1) Paracetamol 650 mg, n=340 (2) Placebo, n=339 5 dental studies included in meta‐analysis | TOTPAR 6: values not given | (1) 108/340 (2) 14/339 | (1) 110/340 (2) 34/337 | No data | 1) 9 2) 36 |
| Edwards 2002 | (1) Paracetamol 975 mg, n=100 (2) Placebo, n=100 2 gynae or ortho studies in meta‐analysis | TOTPAR 6: values not given | (1) 45/100 (2) 25/100 | (1) 37/100 (2) 22/100 | No data | 1) 3 2) 1 |
| Fassolt 1983 | (1) Paracetamol 650 mg, n=29 (2) Suprofen 200 mg, n=32 (3) Suprofen 400 mg, n=28 (4) Paracetamol+suprofen 650/100 mg, n=29 (5) Placebo, n=28 | TOTPAR 6: (1) 15.1 (5) 7.5 | (1) 21/29 (5) 8/28 | (1) 21/29 (5) 5/27 | No data | at 6 hrs: (1) 4/29 (5) 19/28 |
| Forbes 1982 | (1) Paracetamol 600 mg, n=34 (2) Paracetamol+codeine 600/60 mg, n=31 (3) Diflusinal 500 mg, n=32 (4) Diflusinal 1000 mg, n=32 (5) Placebo, n=30 | TOTPAR 4: (1) 8.9 (5) 3.8 | (1) 15/34 (5) 6/30 | No usable data | Median: (1) 3.5 (5) 2.4 | at 6 hrs: (1) 70 (5) 82 |
| Forbes 1983 | (1) Paracetamol 600 mg, n=26 (2) Paracetamol+codeine 600/60 mg, n=26 (3) Diflusinal 500 mg, n=26 (4) Diflusinal 1000 mg, n=28 (5) Placebo, n=26 | TOTPAR 6: (1) 11.2 (5) 5.4 | (1) 13/26 (5) 5/26 | No usable data | Median: (1) 4.0 (5) 1.9 | at 6 hrs: (1) 73 (5) 86 |
| Forbes 1984a | (1) Paracetamol 650 mg, n=39 (2) Phenyltoloxamine 60 mg, n=33 (3) Patacetamol+phenyltoxolamine 650/60 mg, n=40 (4) Placebo, n=36 | TOTPAR 6: (1) 6.7 (4) 2.1 | (1) 10/39 (4) 0/36 | No usable data | Mean: (1) 4.3 (4) 2.7 | at 6 hrs: (1) 74 (4) 97 |
| Forbes 1984b | (1) Paracetamol 650 mg, n=31 (2) Nalbuphine 30 mg, n=32 (3) Paracetamol+nalbuphine 650/30 mg, n=33 (4) Placebo, n=33 | TOTPAR 6: (1) 8.5 (4) 4.5 | (1) 11/31 (4) 4/33 | No usable data | No data | No data |
| Forbes 1989 | (1) Paracetamol 600 mg, n=22 (2) Paracetamol+codeine 600/60 mg, n=17 (3) Flurbiprofen 100 mg, n=26 (4) Placebo, n=23 | (1) 4.6 (4) 2.0 | (1) 1/22 (4) 0/23 | No usable data | Median: (1) 2.8 (4) 1.7 | at 4 hrs: (1) 82 (4) 91 |
| Forbes 1990 | (1) Paracetamol 600 mg, n=36 (2) Paracetamol+codeine 600/60 mg, n=38 (3) Ketorolac 10 mg, n=31 (4) Ketorolac 20 mg, n=35 (5) Ibuprofen 400 mg, n=32 (6) Placebo, n=34 | TOTPAR 6: (1) 5.8 (6) 1.9 | (1) 7/3 (6) 0/34 | No usable data | Median: (1) 3.0 (6) 1.8 Mean: (1) 3.9 (6) 2.9 | at 6 hrs: (1) 81 (6) 97 |
| Haglund 2006 | (1) Paracetamol 1000 mg, n=20 (2) Rofecoxib+paracetamol 50/1000 mg, n=34 (3) Rofecoxib 50 mg, n=36 (4) Placebo n=17 | TOTPAR 6: (1) 11.5 (4) 0.25 | (1) 10/20 (4) 0/17 | No usable data | Median: (1) >8 (4) 1.5 | At 8 hrs: (1) 40.0 (4) 71 At 6 hrs: (1) 24 (4) 70 |
| Hersch 2000 | (1) Paracetamol capsule 1000 mg, n=63 (2) Ibuprofen liquigel 200 mg, n=61 (3) Ibuprofen liquigel, 400 mg n=59 (4) Placebo, n=27 | TOTPAR 6: (1) 11.99 (4) 5.25 | | at 6 hrs: (1) 52% (4) 14% | Median: (1) 6 (4) 1.63 | at 6 hrs: (1) 50 (4) 75 |
| Honig 1984 | (1) Paracetamol 600 mg, n = 28 (2) Paracetamol+codeine 600/60 mg, n=28 (3) Codeine 60 mg, n=28 (4) Placebo, n = 25 | TOTPAR 6: (1) value not given (4) 8.9 | (1) 11/28 (4) 6/30 | at 6 hrs: (1) 8/28 (4) 4/25 | No data | at 6 hrs: (1) 16/28 (4) 114/30 |
| Jain 1986 | (1) Paracetamol 650 mg, n=30 (2) Nalbuphine 30 mg, n=34 (3) Paracetamol+nalbuphine 650/30 mg, n=32 (4) Placebo, n=32 | TOTPAR 6: (1) 10.4 (4) 7.9 | (1) 13/29 (4) 10/30 | No data | No data | at 6 hrs: (1) 10/30 (4) 11/32 |
| Kiersch 1994 | (1) Paracetamol 1000 mg, n=92 (2) Naproxen Na 440 mg, n=89 (3) Placebo, n=45 | TOTPAR 6: (1) 6.2 (3) 3.1 | (1) 21/92 (3) 3/45 | No usable data | Median: (1) 3.1 (3) 2.0 | at 6 hrs: (1) 69 (3) 85 |
| Kubitzek 2003 | (1) Paracetamol 1000 mg, n=78 (2) Diclofenac K 25 mg, n=83 (3) Placebo, n=84 | TOTPAR 6: values not given | At 6 hrs: (1) 45/78 (3) 7/84 | at 6 hrs: (1) 17/78 (3) 1/84 | Median: (1) 4.2 (3) 1.5 | at 6h: (1) 76 (3) 89 |
| Laska 1983 (Study 3) | (1) Paracetamol 500 mg, n=81 (2) Paracetamol 1000 mg, n=81 (3) Paracetamol 1500 mg, n=81 (4) Placebo, n=57 | %max SPID: (1) 43 (2) 46.4 (3) 49.8 (4) 29.9 | (1) 46/81 (2) 49/81 (3) 53/81 (4) 22/57 | No data | not estimable | at 4 hrs: None |
| Lenhert 1990 | (1) Paracetamol 1000 mg, n=49 (2) Aspirin 1000 mg, n=45 (3) Placebo, n=40 | SPID 6: (1) 5.8 (3) 1.5 | (1) 24/49 (3) 5/40 | No usable data | No data | No data |
| McQuay 1988 | (1) Paracetamol 1000 mg, n=30 (2) Bromfenac 5 mg, n=30 (3) Bromfenac 10 mg, n=30 (4) Bromfenac 25 mg, n=30 (5) Placebo, n=30 | TOTPAR 6: (1) 7.9 (5) 4.1 | (1) 10/30 (5) 3/30 | No usable data | Median: (1) 3.7 (5) 3.0 | at 6 hrs: (1) 63 (5) 87 |
| Mehlisch 1984 | (1) Paracetamol 1000 mg, n=58 (2) Aspirin 650 mg, n=49 (3) Placebo, n=55 | TOTPAR 6: (1) 7.0 (3) 1.8 | (1) 16/58 (3) 0/55 | No usable data | No data | at 6hrs: (1) 45/58 (3) 52/55 |
| Mehlisch 1990 | (1) Paracetamol 1000 mg, n=306 (2) Ibuprofen 400 mg, n=306 (3) Placebo, n=85 | (1) 4.1 (3) 1.2 | (1) 131/306 (3) 9/85 | No data | No data | No data |
| Mehlisch 1995 | (1) Paracetamol 1000 mg, n=101 (2) Ibuprofen 400 mg, n=98 (3) Placebo, n=40 | (1) 8.4 (3) 2.6 | (1) 35/101 (3) 1/40 | (1) 31/101 (3) 1/40 | Median: (1) 4.2 (3) 1.4 | at 6 hrs: (1) 60 (3) 88 |
| Moller 2000 | (1) Paracetamol tablet 1000 mg, n=60 (2) Placebo tablet, n=60 (3) Paracetamol effervescent 1000 mg, n = 60 (4) Placebo effervescent, n=62 | TOTPAR 6: (1) 4.4 (2) 0.8 (3) 3.7 (4) 0.8 | (1) 15/60 (2) 0/60 (3) 12/60 (4) 0/62 | No usable data | Median: (1) 2.7 (2) 1.0 (3) 2.1 (4) 1.0 | (1) 73 (2) 93 (3) 85 (4) 100 |
| Moller 2005 | (1) Paracetamol tablet 1000 mg, n=50 (2) Propacetamol 2000 mg iv bolus, n=50 (3) Propacetamol 2000 mg 15 min infusion, n=50 (4) Placebo, n=25 | TOTPAR 6: (1) 9.4 (4) 5.0 | (1) 22/50 (4) 4/25 | No data | Median: (1) 4.6 (4) 1.1 | No data |
| Olson 2001 | (1) Paracetamol 1000 mg, n=66 (2) Ibuprofen liquigel 400 mg, n=67 (3) Ketoprofen 25 mg, n=67 (4) Placebo, n=39 | TOTPAR 6: (1) 13.3 (4) 4.3 | (1) 41/66 (4) 5/39 | at 6 hrs: (1) 57% (4) 11% | Median: (1) >6 (4) 1.3 | at 6 hrs: (1) 25/66 (4) 31/39 |
| Pinto 1984 | (1) Paracetamol 500 mg, n = 29 (2) Dipyrone 500 mg, n=29 (3) Placebo, n = 29 | TOTPAR 4: (1) 11.4 (3) 5.6 | (1) 24/29 (3) 10/29 | No usable data | No data | at 4 hrs: (1) 0 (3) 28 |
| Rubin 1984 | (1) Paracetamol 1000 mg, n=123 (2) Paracetamol+aspirin 648/648 mg, n=123 (3) Aspirin+caffeine 800/6.5 mg, n=121 (4) Placebo, n=109 | %max SPID: (1) 53.3 (4) 36.6 | (1) 86/123 (4) 52/109 | no data | no data | at 4 hrs: (1) 1/123 (4) 15/109 |
| Rubinstein 1986 | (1) Paracetamol 500 mg, n=30 (2) Dypyrone 500 mg, n=30 (3) Placebo, n=30 | TOTPAR 4: (1) 10.1 (3) 4.7 | (1) 22/30 (3) 8/30 | No usable data | No data | at 4 hrs: (1) 7 (3) 20 |
| Sakata 1986 | (1) Paracetamol 1000 mg, n=30 (2) Dipyrone 1000 mg, n=30 (3) Placebo, n=27 | TOTPAR 4: (1) 8.4 (3) 2.8 | (1) 17/30 (3) 3/27 | No usable data | No data | No data |
| Santos Pereira 1986 | (1) Paracetamol 1000 mg, n=28 (2) Dipyrone 1000 mg, n=28 (3) Placebo, n=29 | SPID 4: (1) 6.4 (3) 2.1 | (1) 22/28 (3) 7/29 | No usable data | No data | (1) 0 (3) 38 |
| Schachtel 1989 | (1) Paracetamol 1000 mg, n=37 (2) Ibuprofen 400 mg, n=36 (3) Placebo, n=38 | TOTPAR 6: (1) 7.9 (3) 5.5 | (1) 20/37 (3) 13/38 | No usable data | No data | at 6 hrs: (1) 35 (3) 58 |
| Seymour 1996 | (1) Paracetamol 500 mg n=41 (2) Paracetamol 1000 mg n=41 (3) Ketoprofen 12.5 mg n=42 (4) ketoprofen 25 mg n=41 (5) Placebo, n=41 | VAS SPID 6: (1) 135.4 (2) 150.0 (5) 75 | (1) 19/41 (2) 21/41 (5) 10/41 | at 6 hr: (1) 15/41 (2) 23/41 (5) 8/41 | Median: (1) 2.8 (2) 4.1 (5) 1.8 | (1) 32/40 (2) 33/40 (5) 38/39 |
| Seymour 2003 | (1) Paracetamol 1000 mg, n=62 (2) Aspirin (soluble) 900 mg, n=59 (3) Placebo, n=32 | SPID 4 (VAS): (1) 40.7 (3) 22.6 | (1) 13/62 (3) 3/32 | at 4 hrs: (1) 53% (3) 10% | Median: (1) 1.6 (3) 1.1 | At 4 hrs: (1) 74% (3) 91% |
| Sunshine 1986 | (1) Paracetamol 650 mg, n=30 (2) Paracetamol+codeine 650/60 mg, n=31 (3) Flurbiprofen 50 mg, n=31 (4) Flurbiprofen 100 mg, n=29 (5) Zomepirac 100 mg, n=31 (6) Placebo, n=30 | TOTPAR 6: (1) 11.1 (6) 8.3 | (1) 15/30 (6) 10/30 | No usable data | No data | at 6 hrs: (1) 47 (6) 43 |
| Sunshine 1989 | (1) Paracetamol 650 mg, n=75 (2) Paracetamol+phenyltoloxamine 650/60 mg, n=75 (3) Placebo, n=50 | TOTPAR 6: (1) 7.3 (3) 2.2 | (1) 22/75 (3) 0/50 | No usable data | No data | at 6 hrs: (1) 3 (3) 16 |
| Sunshine 1993 | (1) Paracetamol 650mg, n=48 (2) Paracetamol+oxycodone 650/10 mg, n=48 (3) Ketoprofen 50 mg, n=48 (4) Ketoprofen 100 mg, n=48 (5) Placebo, n=48 | TOTPAR 6: (1) 10.4 (5) 9.7 | (1) 22/48 (5) 20/48 | No usable data | Of pts with onset: Median: (1) 7 .0 (5) 6.0 No usable data | at 8 hrs: (1) 88 (5) 73 |
| Winnem 1981 | (1) Paracetamol 1000 mg, n=20 (2) Tiaramide 100 mg, n=20 (3) Tiaramide 200 mg, n=19 (4) Placebo, n=20 | SPID 6: (1) 4.3 (4) 1.7 | (1) 9/20 (4) 3/20 | No data | No usable data | at 6 hrs: (1) 24 (4) 45 |
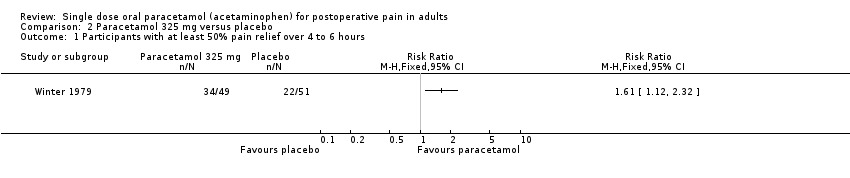
| Winter 1979 | (1) Paracetamol 325 mg, n=49 (2) Orphenadrine 25 mg, n=50 (3) Paracetamol+orphenadrine 325/25 mg, n=50 (4) Placebo, n=51 | SPID 6: (1) 9.5 (4) 5.9 | (1) 34/49 (4) 22/51 | No data | Mean: (1) 3.1 (4) 2.9 | at 6 hrs: (1) 67 (4) 75 |
| Winter 1983 | (1) Paracetamol 1000 mg, n=41 (2) Paracetamol+caffeine 1000/130 mg, n=40 (3) Caffeine 130 mg, n=42 (4) Placebo, n=41 | TOTPAR 4: (1) 7.4 (4) 4.0 | (1) 20/41 (4) 9/41 | No data | No data | at 4 hrs: (1) 2 (4) 2 |
| Young 1979 | Study 1: (1) Paracetamol 650 mg, n=30 (2 Paracetamol+butorphanol 650/4 mg, n=30 (3) Butorphanol 4 mg, n=30 (4) Placebo, n=29 | TOTPAR 4: (1) 7.3 (4) 7.2 | (1) 15/30 (4) 14/29 | No usable data | No data | No data |