| Study ID | N | Participants | Interventions | Infection rate | Definition of infection | Duration | Antibiotic prophylaxis |
| Camilo 2005 | 30 | Ilizarov external fixators; no infection. | (1) Daily: shower, cleanse with saline, gauze dressing soaked with polyvinylpyrrolidone‐iodine; (2) Daily: shower, cleanse with saline; dry dressing | (1) 66.7%; (2) 46.7%; NS | Defined as purulent secretion. | Follow‐up for time external fixator in place, mean = 273 days (95‐726 days) | Not reported. |
| Egol 2006 | 118 | Adults; displaced, unstable, distal radial fracture | (1) Daily: cleansing with 1/2 saline/1/2 hydrogen peroxide; (2) Biopatch dressing changed weekly; (3) No pin site care; dry dressing changed weekly. | (1) 22.5%; (2) 5%;
(3) 2.5%. | Defined as requiring antibiotics. | Follow‐up for mean of 5.9 weeks (4‐8 weeks). External fixator removed at 6 weeks and patients followed‐up for 6 months. | Standard prophylaxis given to all patients: before and immediately after surgery. |
| Grant 2005 | 20 | 18+ years | (1) Daily: saline cleansing, soft white paraffin ointment; (2) Twice daily: saline cleansing, 10% povidone‐iodine. | (1) 34.1%; (2) 18.1% (pin sites, not participants). | Defined as redness, induration, haemo‐serous ooze and pain. | Follow‐up until clinical infection or removal of pin. | Intraoperative or postoperative period: 83%. |
| Henry 1996 | 30 | Aged 11‐18 years | (1) Daily: cleansing with 0.9% sodium chloride; (2) Daily: cleansing with 70% alcohol; (3) Daily: no cleansing. All groups had pin site care consisting of sterile gauze covering, ease of crusting; massage, dry povidone‐iodine spray. | (1) 25%; (2) 17.5%; (3) 7.5%. NS | Defined as pain, redness and swelling and when a significant number of pathogenic bacteria cultured. | Pin in place for mean of 150 days (56‐244 days) | Not reported. |
| Patterson 2005 | 101 | All ages (3‐80 years); 65% male; no inclusion criteria reported. | (1) Twice daily: 1/2 strength peroxide, rinse with saline, apply stable gauze/sponge; (2) Same cleansing; apply Xeroform/Xeroflo dressing; (3) Twice daily; saline cleansing, apply stable gauze/sponge; (4) Same cleansing; apply Xeroform/Xeroflo dressing; (5) Twice daily: antibacterial soap and water cleansing, apply stable gauze/sponge; (6) Same cleansing; apply Xeroform/Xeroflo; (7) No cleansing, apply gauze/sponge (change only if wet/soiled). | (1) 46%; (2) 9%; (3) 33%; (4) 27%; (5) 39%; (6) 50%; (7) 36%. NS | Rating scale that measured redness, swelling, discomfort, tenting, loosening of pins, crusting and drainage. Stage II infection defined as score >3 and requiring treatment with antibiotics; stage III infection defined as score > 7, treatment with IV antibiotics and/or removal of pin. | 6‐week follow‐up. | Not reported. |
| W‐Dahl 2003 | 50 | Surgery for gonarthrosis by hemicallotosis technique; mean age 54 years; inclusion criteria not reported. | (1) Daily: pin site care: cleansing with 0.9% sodium chloride, sterile compress fixed with soft dressing; (2) Weekly; same pin site care protocol. | Grade 1:
(1) 7.4%; (2) 12%. Grade II:
(1) 2.8%; (2) 0%. NS | Checketts‐Otterburns classification of pin site infections. | 10‐week follow‐up | Prophylaxis with IV antibiotics during surgery and 2 doses within 24 hours post operatively followed by 14 days of oral prophylaxis. |
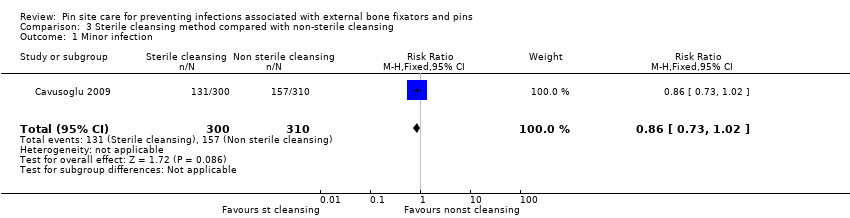
| Cavusoglu 2009 | 39 | Mean age 50 and 47 years in two groups; 65% and 53% male; no inclusion criteria reported. | (1) Daily showering; cleaning crusts with sterile gauze with iodine solution; (2) Daily showering; brushing pin sites with soap and water. | Minor infection: (1) 44%; (2) 51%. Major infection: (1) 4%; (2) 4%. | Minor infection: Grade 1 and 2 on a modification of the Dahl system by Gordon ‐ not requiring any extra pin site care. Major infection: Grade 3 and above ‐ requiring treatment with oral antibiotics. | Pin site inspection on 5th, 10th, 15th, 30th, 45th, 60th, 75th, 90th, 120th and 150th days of follow‐up until fixator removal. | Prophylaxis for closed fractures: preoperative and postoperative single dose intravenous cephazolin sodium (1 g); open fractures: preoperative 1 day and postoperative 4 day intravenous cephazolin sodium (1 g 3 X day), intravenous gentamicin (160 mg/day) and oral ornidazole (500 mg 2 X day). |
| Chan 2009 | 62 | Distraction osteogenesis using Ilizarov fixators; age ranged from 1‐76 years; 37% < 14 years; no inclusion criteria reported. | (1) Daily povidone‐iodine cleansing solution; (2) Saline cleansing solution. | Any grade of Infection: (1) 19%; (2) 17%. | Three point grading of infections by system developed in Department of Orthopaedic Surgery in University of Malaya Medical Centre. | Every 2 weeks for 6 months. | Antibiotics only prescribed for patients with grade 2 or 3 infections. |