نقش موسیقیدرمانی در درمان افسردگی
Información
- DOI:
- https://doi.org/10.1002/14651858.CD004517.pub3Copiar DOI

- Base de datos:
-
- Cochrane Database of Systematic Reviews
- Versión publicada:
-
- 16 noviembre 2017see what's new
- Tipo:
-
- Intervention
- Etapa:
-
- Review
- Grupo Editorial Cochrane:
-
Grupo Cochrane de Trastornos mentales comunes
- Copyright:
-
- Copyright © 2017 The Cochrane Collaboration. Published by John Wiley & Sons, Ltd.
Cifras del artículo
Altmetric:
Citado por:
Autores
Contributions of authors
Review Maratos 2008
Idea of the review: Maratos.
First review author: Maratos
Writing the review: Maratos, Crawford.
Designing study protocol: Maratos, Gold.
Handsearching journals: Maratos, Gold.
Extracting study data: Maratos, Crawford, Wang.
Performing analysis: Maratos, Crawford, Wang.
Review Aalbers 2017
Idea of updating the review: Vink, Aalbers.
First review author and co‐ordinator of the current review: Aalbers.
Writing the review: Aalbers, Fusar‐Poli, Freeman, Ket, Gold (reviewed and approved by Vink, Spreen, Maratos, Crawford, Chen).
Peparing the Background: Aalbers, Freeman.
Determining Objectives, criteria for considering studies: Aalbers, Freeman, Maratos, Gold.
Developing search strategies, methods: Ket, Aalbers.
Conducting database searches and other searches: Ket, Aalbers.
Screening search results: Aalbers, Freeman.
Screening retrieved papers against inclusion criteria: Aalbers, Freeman.
Appraising quality of papers: Aalbers, Vink, Spreen.
Extracting study data: Aalbers, Freeman.
Assessing risk of bias: Aalbers, Freeman.
Writing to authors of papers for additional information: Aalbers.
Providing additional data about papers: Aalbers.
Obtaining and screening data on unpublished studies: Aalbers; Freeman.
Managing data for the review: Aalbers, Freeman, Fusar‐Poli, Vink, Gold.
Entering data into Review Manager: Aalbers, Fusar‐Poli, Gold.
Analysing RevMan statistical data: Aalbers, Fusar‐Poli, Gold.
Performing other statistical analysis not using RevMan: Gold, Spreen.
Interpreting data: Aalbers, Fusar‐Poli, Gold, Vink, Spreen, Crawford.
Making statistical inferences: Aalbers, Fusar‐Poli, Gold, Spreen.
Serving as guarantor for the review (one author): Aalbers.
Taking responsibility for reading and checking the review before submission: Aalbers.
Sources of support
Internal sources
-
Central and North West London NHS Foundation Trust, London, UK.
-
Sogn og Fjordane University College, Norway.
-
School of Social Work and Arts Therapies, Stenden University of Applied Sciences Leeuwarden, Netherlands.
Time, translation of a Chinese study report and supervising the PhD project
-
Clinical, Neuro & Developmental Psychology, Vrije Universiteit Amsterdam, Amsterdam, Netherlands.
Supervising the PhD project
-
Music Therapy, Artez School of Music, Enschede, Netherlands.
Supervising the review project
-
Department of Brain and Behavioral Sciences, University of Pavia, Pavia, Italy.
External sources
-
The Research Council of Norway, Norway.
Declarations of interest
SA: none known.
LF‐Pi: none known.
REF: none known.
MS: none known.
JCFK: none known.
ACV: none known.
AM: none known.
MC: none known.
X‐JC: I am a music therapist.
CG: I am a co‐author of one included study. I am a clinically trained music therapist and an associate editor of the Cochrane Developmental, Psychosocial and Learning Problems Group. I am an editor of the Nordic Journal of Music Therapy, where one included trial was published, and have been involved in trials that included, but were not specifically focused on, people with depressive disorders.
Acknowledgements
We would like to thank study authors Yadira Albornoz and Penchaya Atiwannapat for providing additional information concerning music therapy intervention from their respective studies; Vera Brandes and Mariette Broersen for providing their study reports; content experts for responding to our requests for information about possible ongoing studies; Sarah Dawson, Trials Search Co‐ordinator for the Cochrane Common Mental Disorders (CCMD) Group, for undertaking searches for this review; Jaakko Erkkilä for providing additional information concerning his trial and valuable comments on an earlier version of this review; Sarah Davis, Editorial Assistant for the CCMD Group, for her kind assistance; Stenden University of Applied Sciences for support and full translation of a Chinese study into English; Jessica Sharp, Managing Editor for the CCMD Group, for her kind assistance, guidance, and support throughout the review process; Erik Scherder of the Vrije Universiteit Amsterdam for assisting throughout the review process and reviewing the final version of the review; Seng Kuong Ung for translating a Chinese study into English; Xu Wang for contributing to the first review; and Kun Zhao for sending Chinese full texts and translating Chinese abstracts into English.
Version history
| Published | Title | Stage | Authors | Version |
| 2017 Nov 16 | Music therapy for depression | Review | Sonja Aalbers, Laura Fusar‐Poli, Ruth E Freeman, Marinus Spreen, Johannes CF Ket, Annemiek C Vink, Anna Maratos, Mike Crawford, Xi‐Jing Chen, Christian Gold | |
| 2008 Jan 23 | Music therapy for depression | Review | Anna Maratos, Christian Gold, Xu Wang, Mike Crawford | |
| 2003 Oct 20 | Music therapy for depression | Protocol | C Maratos A and Gold, Anna Maratos, Xu Wang, Mike Crawford | |
Differences between protocol and review
In compliance with developments in systematic review methods since publication of the first version of this review (Maratos 2008), we have made a distinction between primary and secondary outcomes. To avoid lack of balance and the possibility of bias, we added adverse events as a primary outcome (Higgins 2015). We added anxiety as a secondary outcome because anxiety is a common comorbidity with depression (Gotlib 2014). We examined clinician‐rated and patient‐reported depression separately to retain both sources of information and because many studies reported both; the Cochrane Group approved this change. We commented on the quality of the body evidence using GRADE profile software and included 'Summary of findings' tables as recommended by Higgins and colleagues (Higgins 2015). We submitted these protocol amendments and received approval before we began work on the review update.
Keywords
MeSH
Medical Subject Headings (MeSH) Keywords
Medical Subject Headings Check Words
Adult; Humans;
PICO

PRISMA flow diagram.

Risk of bias graph: review authors' judgements about each risk of bias item presented as percentages across all included studies.

Risk of bias summary: review authors' judgements about each risk of bias item for each included study.

Comparison 1 Music therapy plus TAU versus TAU alone (primary comparison), Outcome 1 Severity of depression symptoms, clinician‐rated (primary outcome; high=poor).
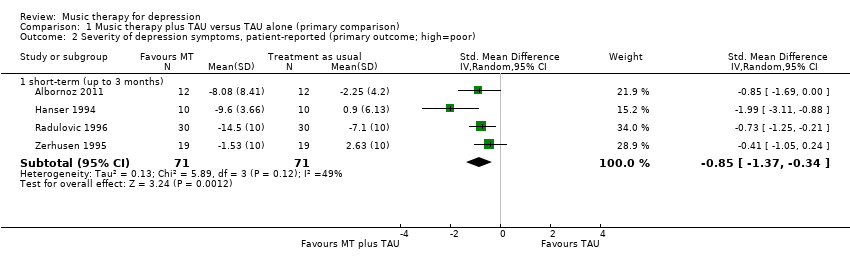
Comparison 1 Music therapy plus TAU versus TAU alone (primary comparison), Outcome 2 Severity of depression symptoms, patient‐reported (primary outcome; high=poor).

Comparison 1 Music therapy plus TAU versus TAU alone (primary comparison), Outcome 3 Any adverse event.

Comparison 1 Music therapy plus TAU versus TAU alone (primary comparison), Outcome 4 Functioning (high=good).

Comparison 1 Music therapy plus TAU versus TAU alone (primary comparison), Outcome 5 Quality of life (high=good).

Comparison 1 Music therapy plus TAU versus TAU alone (primary comparison), Outcome 6 Leaving the study early.

Comparison 1 Music therapy plus TAU versus TAU alone (primary comparison), Outcome 7 Anxiety (high=poor).

Comparison 1 Music therapy plus TAU versus TAU alone (primary comparison), Outcome 8 Self‐esteem (high=good).

Comparison 2 Music therapy versus psychological therapy, Outcome 1 Severity of depressive symptoms, clinician‐rated (primary outcome; high=poor).

Comparison 2 Music therapy versus psychological therapy, Outcome 2 Severity of depressive symptoms, patient‐reported (primary outcome; high=poor).

Comparison 2 Music therapy versus psychological therapy, Outcome 3 Quality of life (high=good).

Comparison 2 Music therapy versus psychological therapy, Outcome 4 Leaving the study early.

Comparison 3 Active music therapy versus receptive music therapy, Outcome 1 Severity of depressive symptoms, clinician‐reported (primary outcome; high=poor).

Comparison 3 Active music therapy versus receptive music therapy, Outcome 2 Severity of depressive symptoms, patient‐reported (primary outcome; high=poor).

Comparison 3 Active music therapy versus receptive music therapy, Outcome 3 Quality of life (high=good).

Comparison 3 Active music therapy versus receptive music therapy, Outcome 4 Leaving the study early.
| Music therapy plus treatment as usual (TAU) versus TAU | ||||||
| Patient or population: individuals with depression | ||||||
| Outcomes | Anticipated absolute effects* (95% CI) | Relative effect | No. of participants | Quality of the evidence | Comments | |
| Risk with treatment as usual | Risk with music therapy | |||||
| Depressive symptoms (clinician‐rated) (various scales) Up to 3 months | Mean clinician‐rated depressive symptoms in the intervention group were SMD 0.98 SD lower (1.69 lower to 0.27 lower). | ‐ | 219 | ⊕⊕⊕⊝ | Lower score equals a better outcome. SMD corresponds to a large effect size. | |
| Depressive symptoms (patient‐reported) (various scales) Up to 3 months | Mean patient‐reported depressive symptoms in the intervention group were SMD 0.85 SD lower (1.37 lower to 0.34 lower). | ‐ | 142 | ⊕⊕⊕⊝ | Lower score equals a better outcome. SMD corresponds to a large effect size. | |
| Any adverse events Up to 3 months | Study population | OR 0.45 | 79 | ⊕⊕⊝⊝ | ||
| 22 per 1000 | 10 per 1000 | |||||
| Functioning (GAF) Up to 3 months | Mean functioning in the intervention group was SMD 0.51 SD higher (0.02 higher to 1 higher). | ‐ | 67 | ⊕⊕⊝⊝ | Higher score equals a better outcome. SMD corresponds to a moderate effect size. | |
| Quality of life (RAND‐36) Up to 3 months | Mean quality of life in the intervention group was SMD 0.32 SD higher (0.17 lower to 0.80 higher). | ‐ | 67 | ⊕⊕⊝⊝ | Higher score equals a better outcome. | |
| Leaving the study early Up to 3 months | Study population | OR 0.49 | 293 | ⊕⊕⊕⊝ | ||
| 65 per 1000 | 33 per 1000 | |||||
| Anxiety (HADS‐A) Up to 3 months | Mean anxiety in the intervention group was SMD 0.74 SD lower (1.40 lower to 0.08 lower). | ‐ | 195 | ⊕⊕⊝⊝ | Lower score equals a better outcome. SMD corresponds to a moderate effect size. | |
| *The risk in the intervention group (and its 95% confidence interval) is based on the assumed risk in the comparison group and the relative effect of the intervention (and its 95% CI). | ||||||
| GRADE Working Group grades of evidence. | ||||||
| aDowngraded one level for unclear randomisation, allocation concealment, blinding, missing study protocol. bDowngraded two levels for wide confidence intervals, although adequately powered, well‐performed trial. | ||||||
| Music therapy versus psychological treatment for depression | ||||||
| Patient or population: adults with depression | ||||||
| Outcomes | Anticipated absolute effects* (95% CI) | Relative effect | No. of participants | Quality of the evidence | Comments | |
| Risk with psychological treatment | Risk with music therapy | |||||
| Depressive symptoms (clinician‐rated) (MADRS) Up to 3 months | Mean clinician‐rated depressive symptoms in the intervention group was SMD 0.78 SD lower (2.36 lower to 0.81 higher). | ‐ | 11 | ⊕⊝⊝⊝ | Lower score equals better outcome. SMD corresponds to a large effect size. | |
| Depressive symptoms (patient‐reported) (various scales) Up to 3 months | Mean patient‐reported depressive symptoms in the intervention group were SMD 1.28 SD lower (3.57 lower to 1.02 higher). | ‐ | 131 | ⊕⊕⊝⊝ | Lower score equals better outcome. SMD corresponds to a large effect size. | |
| Any adverse events ‐ not reported | ‐ | ‐ | ‐ | ‐ | ‐ | |
| Functioning ‐ not reported | ‐ | ‐ | ‐ | ‐ | ‐ | |
| Quality of life (Thai RAND‐36) Up to 3 months | Mean quality of life in the intervention group was SMD 1.31 SD higher (0.36 lower to 2.99 higher). | ‐ | 11 | ⊕⊝⊝⊝ | Higher score equals better outcome. | |
| Leaving the study early Up to 3 months | Study population | OR 0.17 | 157 | ⊕⊕⊕⊝ | ||
| 35 per 1000 | 9 per 1000 | |||||
| Anxiety ‐ not reported | ‐ | ‐ | ‐ | ‐ | ‐ | |
| *The risk in the intervention group (and its 95% confidence interval) is based on the assumed risk in the comparison group and the relative effect of the intervention (and its 95% CI). | ||||||
| GRADE Working Group grades of evidence. | ||||||
| aDowngraded one level for limitations in design such as unclear allocation concealment, blinding, incomplete outcome data, missing protocol. bDowngraded two levels for small sample size. cDowngraded one level for non‐overlap of confidence intervals, high heterogeneity (P < 0.00001); I2 = 96%. | ||||||
| Active music therapy versus receptive music therapy for depression | ||||||
| Patient or population: adults with depression | ||||||
| Outcomes | Anticipated absolute effects* (95% CI) | Relative effect | No. of participants | Quality of the evidence | Comments | |
| Risk with receptive music therapy | Risk with active music therapy | |||||
| Depressive symptoms (clinician‐rated) (MADRS) Up to 3 months | Mean clinician‐rated depressive symptoms in the intervention group were SMD 0.52 SD lower (1.87 lower to 0.83 higher). | ‐ | 9 | ⊕⊝⊝⊝ | Lower score equals a better outcome. | |
| Depressive symptoms (patient‐reported) (TDI) Up to 3 months | Mean patient‐reported depressive symptoms in the intervention group were SMD 0.01 SD lower (1.33 lower to 1.3 higher). | ‐ | 9 | ⊕⊝⊝⊝ | Lower score equals a better outcome. | |
| Any adverse events ‐ not reported | ‐ | ‐ | ‐ | ‐ | ‐ | |
| Functioning ‐ not reported | ‐ | ‐ | ‐ | ‐ | ‐ | |
| Quality of life (SF‐36 Thai) Up to 3 months | Mean quality of life in the intervention group was SMD 0.24 SD lower (1.57 lower to 1.08 higher). | ‐ | 9 | ⊕⊝⊝⊝ | Higher score equals a better outcome. | |
| Leaving the study early Up to 3 months | Study population | OR 0.27 | 10 | ⊕⊝⊝⊝ | ||
| 200 per 1000 | 63 per 1000 | |||||
| Anxiety ‐ not reported | ‐ | ‐ | ‐ | ‐ | ‐ | |
| *The risk in the intervention group (and its 95% confidence interval) is based on the assumed risk in the comparison group and the relative effect of the intervention (and its 95% CI). | ||||||
| GRADE Working Group grades of evidence. | ||||||
| aDowngraded one level for limitations in design such as unclear allocation concealment, blinding, missing protocol. bDowngraded two levels for small sample size. | ||||||
| Outcome or subgroup title | No. of studies | No. of participants | Statistical method | Effect size |
| 1 Severity of depression symptoms, clinician‐rated (primary outcome; high=poor) Show forest plot | 4 | Std. Mean Difference (IV, Random, 95% CI) | Subtotals only | |
| 1.1 short‐term (up to 3 months) | 4 | 219 | Std. Mean Difference (IV, Random, 95% CI) | ‐0.98 [‐1.69, ‐0.27] |
| 1.2 medium‐term (up to 6 months) | 1 | 64 | Std. Mean Difference (IV, Random, 95% CI) | ‐0.38 [‐0.87, 0.12] |
| 2 Severity of depression symptoms, patient‐reported (primary outcome; high=poor) Show forest plot | 4 | Std. Mean Difference (IV, Random, 95% CI) | Subtotals only | |
| 2.1 short‐term (up to 3 months) | 4 | 142 | Std. Mean Difference (IV, Random, 95% CI) | ‐0.85 [‐1.37, ‐0.34] |
| 3 Any adverse event Show forest plot | 1 | Odds Ratio (M‐H, Random, 95% CI) | Totals not selected | |
| 3.1 short‐term (up to 3 months) | 1 | Odds Ratio (M‐H, Random, 95% CI) | 0.0 [0.0, 0.0] | |
| 3.2 medium‐term (up to 6 months) | 1 | Odds Ratio (M‐H, Random, 95% CI) | 0.0 [0.0, 0.0] | |
| 4 Functioning (high=good) Show forest plot | 1 | Std. Mean Difference (IV, Random, 95% CI) | Totals not selected | |
| 4.1 short‐term (up to 3 months) | 1 | Std. Mean Difference (IV, Random, 95% CI) | 0.0 [0.0, 0.0] | |
| 4.2 medium‐term (up to 6 months) | 1 | Std. Mean Difference (IV, Random, 95% CI) | 0.0 [0.0, 0.0] | |
| 5 Quality of life (high=good) Show forest plot | 1 | Std. Mean Difference (IV, Random, 95% CI) | Subtotals only | |
| 5.1 short‐term (up to 3 months) | 1 | 67 | Std. Mean Difference (IV, Random, 95% CI) | 0.32 [‐0.17, 0.80] |
| 5.2 medium‐term (up to 6 months) | 1 | 64 | Std. Mean Difference (IV, Random, 95% CI) | 0.26 [‐0.23, 0.76] |
| 6 Leaving the study early Show forest plot | 6 | Odds Ratio (M‐H, Random, 95% CI) | Subtotals only | |
| 6.1 short‐term (up to 3 months) | 6 | 293 | Odds Ratio (M‐H, Random, 95% CI) | 0.49 [0.14, 1.70] |
| 6.2 medium‐term (up to 6 months) | 1 | 79 | Odds Ratio (M‐H, Random, 95% CI) | 0.44 [0.13, 1.53] |
| 7 Anxiety (high=poor) Show forest plot | 3 | Std. Mean Difference (IV, Random, 95% CI) | Subtotals only | |
| 7.1 short‐term (up to 3 months) | 3 | 195 | Std. Mean Difference (IV, Random, 95% CI) | ‐0.74 [‐1.40, ‐0.08] |
| 7.2 medium‐term (up to 6 months) | 1 | 64 | Std. Mean Difference (IV, Random, 95% CI) | ‐0.40 [‐0.90, 0.10] |
| 8 Self‐esteem (high=good) Show forest plot | 1 | Std. Mean Difference (IV, Random, 95% CI) | Totals not selected | |
| 8.1 short‐term (up to 3 months) | 1 | Std. Mean Difference (IV, Random, 95% CI) | 0.0 [0.0, 0.0] | |
| Outcome or subgroup title | No. of studies | No. of participants | Statistical method | Effect size |
| 1 Severity of depressive symptoms, clinician‐rated (primary outcome; high=poor) Show forest plot | 1 | Std. Mean Difference (IV, Random, 95% CI) | Totals not selected | |
| 1.1 short‐term (up to 3 months) | 1 | Std. Mean Difference (IV, Random, 95% CI) | 0.0 [0.0, 0.0] | |
| 1.2 medium‐term (up to 6 months) | 1 | Std. Mean Difference (IV, Random, 95% CI) | 0.0 [0.0, 0.0] | |
| 2 Severity of depressive symptoms, patient‐reported (primary outcome; high=poor) Show forest plot | 4 | Std. Mean Difference (IV, Random, 95% CI) | Subtotals only | |
| 2.1 short‐term (up to 3 months) | 4 | 131 | Std. Mean Difference (IV, Random, 95% CI) | ‐1.28 [‐3.57, 1.02] |
| 2.2 medium‐term (up to 6 months) | 1 | 11 | Std. Mean Difference (IV, Random, 95% CI) | ‐0.68 [‐2.26, 0.89] |
| 3 Quality of life (high=good) Show forest plot | 1 | Std. Mean Difference (IV, Random, 95% CI) | Totals not selected | |
| 3.1 short‐term (up to 3 months) | 1 | Std. Mean Difference (IV, Random, 95% CI) | 0.0 [0.0, 0.0] | |
| 3.2 medium‐term (up to 6 months) | 1 | Std. Mean Difference (IV, Random, 95% CI) | 0.0 [0.0, 0.0] | |
| 4 Leaving the study early Show forest plot | 4 | Odds Ratio (M‐H, Random, 95% CI) | Subtotals only | |
| 4.1 short‐term (up to 3 months) | 4 | 137 | Odds Ratio (M‐H, Random, 95% CI) | 0.17 [0.02, 1.49] |
| 4.2 medium‐term (up to 6 months) | 1 | 14 | Odds Ratio (M‐H, Random, 95% CI) | 0.11 [0.01, 1.92] |
| Outcome or subgroup title | No. of studies | No. of participants | Statistical method | Effect size |
| 1 Severity of depressive symptoms, clinician‐reported (primary outcome; high=poor) Show forest plot | 1 | Std. Mean Difference (IV, Random, 95% CI) | Totals not selected | |
| 1.1 short‐term (up to 3 months) | 1 | Std. Mean Difference (IV, Random, 95% CI) | 0.0 [0.0, 0.0] | |
| 1.2 medium‐term (up to 6 months) | 1 | Std. Mean Difference (IV, Random, 95% CI) | 0.0 [0.0, 0.0] | |
| 2 Severity of depressive symptoms, patient‐reported (primary outcome; high=poor) Show forest plot | 1 | Std. Mean Difference (IV, Random, 95% CI) | Totals not selected | |
| 2.1 short‐term (up to 3 months) | 1 | Std. Mean Difference (IV, Random, 95% CI) | 0.0 [0.0, 0.0] | |
| 2.2 medium‐term (up to 6 months) | 1 | Std. Mean Difference (IV, Random, 95% CI) | 0.0 [0.0, 0.0] | |
| 3 Quality of life (high=good) Show forest plot | 1 | Std. Mean Difference (IV, Random, 95% CI) | Totals not selected | |
| 3.1 short‐term (up to 3 months) | 1 | Std. Mean Difference (IV, Random, 95% CI) | 0.0 [0.0, 0.0] | |
| 3.2 medium‐term (up to 6 months) | 1 | Std. Mean Difference (IV, Random, 95% CI) | 0.0 [0.0, 0.0] | |
| 4 Leaving the study early Show forest plot | 1 | Odds Ratio (M‐H, Random, 95% CI) | Totals not selected | |
| 4.1 short‐term (up to 3 months) | 1 | Odds Ratio (M‐H, Random, 95% CI) | 0.0 [0.0, 0.0] | |
| 4.2 medium‐term (up to 6 months) | 1 | Odds Ratio (M‐H, Random, 95% CI) | 0.0 [0.0, 0.0] | |