| 1 Cognitive processing (change from baseline at 5 weeks) Show forest plot | 1 | | Mean Difference (IV, Fixed, 95% CI) | Subtotals only |
|
| 1.1 Speed of processing ‐ boxes | 1 | 39 | Mean Difference (IV, Fixed, 95% CI) | 2.12 [‐11.28, 15.52] |
| 1.2 Speed of processing ‐ digit symbol coding | 1 | 39 | Mean Difference (IV, Fixed, 95% CI) | 2.19 [‐7.40, 11.78] |
| 1.3 Speed of processing ‐ symbol search | 1 | 39 | Mean Difference (IV, Fixed, 95% CI) | 1.59 [‐1.55, 4.73] |
| 1.4 Working memory ‐ digit span backwards | 1 | 39 | Mean Difference (IV, Fixed, 95% CI) | ‐0.31 [‐2.66, 2.04] |
| 1.5 Working memory ‐ letter number sequencing | 1 | 39 | Mean Difference (IV, Fixed, 95% CI) | ‐0.5 [‐2.78, 1.78] |
| 2 Memory (change from baseline at 5 weeks) Show forest plot | 1 | | Mean Difference (IV, Fixed, 95% CI) | Subtotals only |
|
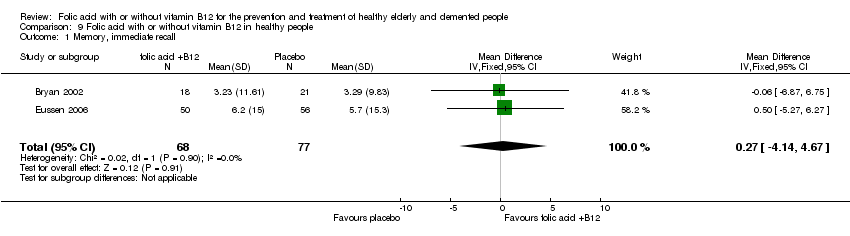
| 2.1 Immediate recall ‐ RAVLT 1‐5 | 1 | 39 | Mean Difference (IV, Fixed, 95% CI) | ‐0.06 [‐6.87, 6.75] |
| 2.2 Immediate recall ‐ RAVLT B | 1 | 39 | Mean Difference (IV, Fixed, 95% CI) | ‐0.54 [‐2.05, 0.97] |
| 2.3 Delayed recall ‐ RAVLT 6 | 1 | 39 | Mean Difference (IV, Fixed, 95% CI) | ‐0.07 [‐2.28, 2.14] |
| 2.4 Delayed recall ‐ RAVLT 7 | 1 | 39 | Mean Difference (IV, Fixed, 95% CI) | ‐0.34 [‐2.85, 2.17] |
| 2.5 Recognition ‐ RAVLT A | 1 | 39 | Mean Difference (IV, Fixed, 95% CI) | 1.42 [‐0.24, 3.08] |
| 2.6 Recognition ‐ RAVLT B | 1 | 39 | Mean Difference (IV, Fixed, 95% CI) | 1.59 [‐1.35, 4.53] |
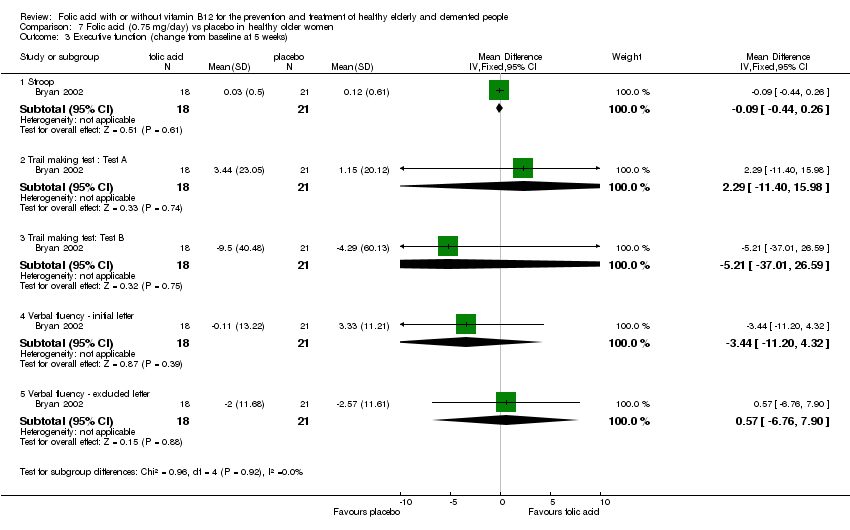
| 3 Executive function (change from baseline at 5 weeks) Show forest plot | 1 | | Mean Difference (IV, Fixed, 95% CI) | Subtotals only |
|
| 3.1 Stroop | 1 | 39 | Mean Difference (IV, Fixed, 95% CI) | ‐0.09 [‐0.44, 0.26] |
| 3.2 Trail making test : Test A | 1 | 39 | Mean Difference (IV, Fixed, 95% CI) | 2.29 [‐11.40, 15.98] |
| 3.3 Trail making test: Test B | 1 | 39 | Mean Difference (IV, Fixed, 95% CI) | ‐5.21 [‐37.01, 26.59] |
| 3.4 Verbal fluency ‐ initial letter | 1 | 39 | Mean Difference (IV, Fixed, 95% CI) | ‐3.44 [‐11.20, 4.32] |
| 3.5 Verbal fluency ‐ excluded letter | 1 | 39 | Mean Difference (IV, Fixed, 95% CI) | 0.57 [‐6.76, 7.90] |
| 4 Verbal ability (change from baseline at 5 weeks) Show forest plot | 1 | | Mean Difference (IV, Fixed, 95% CI) | Subtotals only |
|
| 4.1 Vocabulary | 1 | 39 | Mean Difference (IV, Fixed, 95% CI) | ‐0.13 [‐4.87, 4.61] |
| 4.2 Spot the word | 1 | 39 | Mean Difference (IV, Fixed, 95% CI) | 0.87 [‐7.92, 9.66] |
| 5 Mood Measures (change from baseline at 5 weeks) Show forest plot | 1 | | Mean Difference (IV, Fixed, 95% CI) | Subtotals only |
|
| 5.1 CESD ‐ depression | 1 | 39 | Mean Difference (IV, Fixed, 95% CI) | ‐1.11 [‐7.31, 5.09] |
| 5.2 POMS: total | 1 | 39 | Mean Difference (IV, Fixed, 95% CI) | ‐3.14 [‐23.56, 17.28] |
| 5.3 POMS ‐ Tension/anxiety | 1 | 39 | Mean Difference (IV, Fixed, 95% CI) | 0.3 [‐3.93, 4.53] |
| 5.4 POMS ‐ Depression/dejection | 1 | 39 | Mean Difference (IV, Fixed, 95% CI) | 0.59 [‐5.45, 6.63] |
| 5.5 POMS ‐ Anger/hostility | 1 | 39 | Mean Difference (IV, Fixed, 95% CI) | 0.97 [‐3.29, 5.23] |
| 5.6 POMS ‐ Vigour/activity | 1 | 39 | Mean Difference (IV, Fixed, 95% CI) | 3.13 [‐2.26, 8.52] |
| 5.7 POMS ‐ Fatigue/inertia | 1 | 39 | Mean Difference (IV, Fixed, 95% CI) | ‐1.83 [‐5.85, 2.19] |
| 5.8 POMS ‐ Confusion/bewilderment | 1 | 39 | Mean Difference (IV, Fixed, 95% CI) | ‐0.05 [‐3.05, 2.95] |