Administración de líquidos y alimentos por vía oral temprana versus tardía para la disminución de las complicaciones después de la cirugía ginecológica abdominal mayor
Información
- DOI:
- https://doi.org/10.1002/14651858.CD004508.pub4Copiar DOI

- Base de datos:
-
- Cochrane Database of Systematic Reviews
- Versión publicada:
-
- 12 diciembre 2014see what's new
- Tipo:
-
- Intervention
- Etapa:
-
- Review
- Grupo Editorial Cochrane:
-
Grupo Cochrane de Ginecología y fertilidad
- Copyright:
-
- Copyright © 2014 The Cochrane Collaboration. Published by John Wiley & Sons, Ltd.
Cifras del artículo
Altmetric:
Citado por:
Autores
Contributions of authors
Kittipat Charoenkwan: Took the lead in writing the protocol. For the review took the lead in writing, selected trials for inclusion, performed independent data extraction, statistical analysis and interpretation of data.
Elizabeth Matovinovic: For the updated review, selected articles for inclusion, performed independent data extraction, assessed risk of bias for included articles, data interpretation, and contributed to writing.
Sources of support
Internal sources
-
Faculty of Medicine, Chiang Mai University, Thailand.
Funding
External sources
-
National Research University Project under Thailand’s Office of the Higher Education Commission, Thailand.
Funding
Declarations of interest
Kittipat Charoenkwan: None
Elizabeth Matovinovic: None
Acknowledgements
We wish to thanks the Cochrane Menstrual Disorders and Subfertility Group (CMDSG) editorial group for their support. We would like to acknowledge the contribution of Greg Phillipson and Teraporn Vutyavanich for their contribution to the original version of this review.
Version history
| Published | Title | Stage | Authors | Version |
| 2014 Dec 12 | Early versus delayed oral fluids and food for reducing complications after major abdominal gynaecologic surgery | Review | Kittipat Charoenkwan, Elizabeth Matovinovic | |
| 2007 Oct 17 | Early versus delayed oral fluids and food for reducing complications after major abdominal gynaecologic surgery | Review | Kittipat Charoenkwan, Greg Phillipson, Teraporn Vutyavanich | |
| 2006 Jul 19 | Early versus delayed (traditional) oral fluids and food for reducing complications after major abdominal gynaecologic surgery | Protocol | Kittipat Charoenkwan, Greg Phillipson, Theera Tongsong | |
| 2003 Oct 20 | Early versus delayed (traditional) oral fluids and food for reducing complications after major abdominal gynaecologic surgery | Protocol | Kittipat Charoenkwan, Greg Phillipson, Theera Tongsong | |
Keywords
MeSH
Medical Subject Headings (MeSH) Keywords
- *Drinking;
- *Eating;
- *Gynecologic Surgical Procedures;
- *Postoperative Care;
- Food;
- Genital Neoplasms, Female [surgery];
- Hysterectomy [adverse effects];
- Intestinal Pseudo‐Obstruction [etiology];
- Nausea [etiology];
- Ovariectomy [adverse effects];
- Postoperative Complications [prevention & control];
- Randomized Controlled Trials as Topic;
- Recovery of Function;
- Time Factors;
Medical Subject Headings Check Words
Female; Humans;
PICO
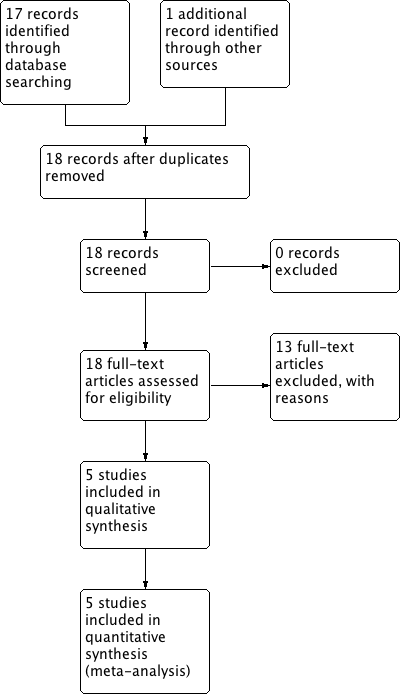
Study flow diagram.

Risk of bias graph: review authors' judgements about each risk of bias item presented as percentages across all included studies.

Risk of bias summary: review authors' judgements about each risk of bias item for each included study.
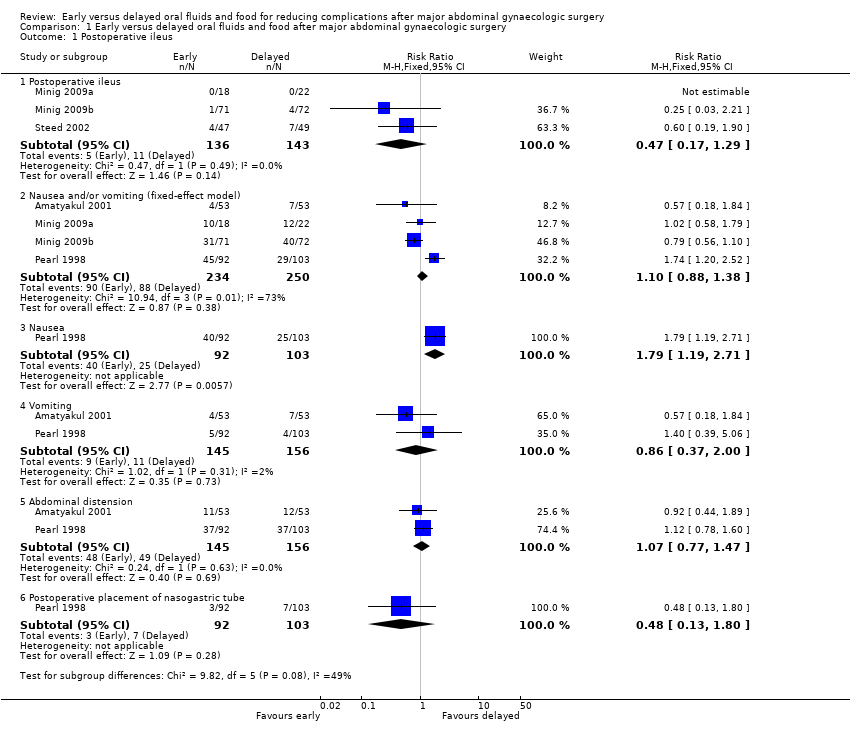
Comparison 1 Early versus delayed oral fluids and food after major abdominal gynaecologic surgery, Outcome 1 Postoperative ileus.
![Comparison 1 Early versus delayed oral fluids and food after major abdominal gynaecologic surgery, Outcome 2 Time intervals (fixed‐effect model) [days].](/es/cdsr/doi/10.1002/14651858.CD004508.pub4/media/CDSR/CD004508/image_n/nCD004508-CMP-001-02.png)
Comparison 1 Early versus delayed oral fluids and food after major abdominal gynaecologic surgery, Outcome 2 Time intervals (fixed‐effect model) [days].

Comparison 1 Early versus delayed oral fluids and food after major abdominal gynaecologic surgery, Outcome 3 Other major postoperative complications.
![Comparison 1 Early versus delayed oral fluids and food after major abdominal gynaecologic surgery, Outcome 4 Satisfaction visual analog scale [mm].](/es/cdsr/doi/10.1002/14651858.CD004508.pub4/media/CDSR/CD004508/image_n/nCD004508-CMP-001-04.png)
Comparison 1 Early versus delayed oral fluids and food after major abdominal gynaecologic surgery, Outcome 4 Satisfaction visual analog scale [mm].
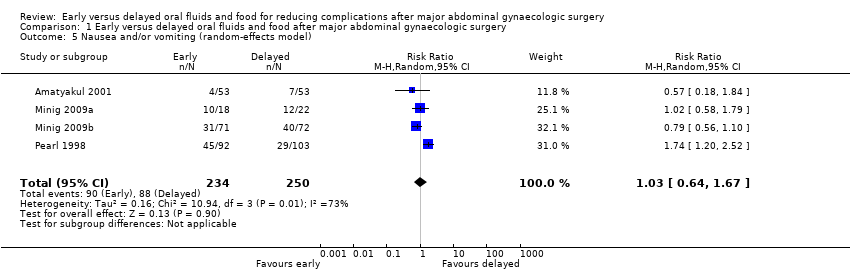
Comparison 1 Early versus delayed oral fluids and food after major abdominal gynaecologic surgery, Outcome 5 Nausea and/or vomiting (random‐effects model).
![Comparison 1 Early versus delayed oral fluids and food after major abdominal gynaecologic surgery, Outcome 6 Time to the presence of bowel sound (random‐effects model) [days].](/es/cdsr/doi/10.1002/14651858.CD004508.pub4/media/CDSR/CD004508/image_n/nCD004508-CMP-001-06.png)
Comparison 1 Early versus delayed oral fluids and food after major abdominal gynaecologic surgery, Outcome 6 Time to the presence of bowel sound (random‐effects model) [days].
![Comparison 1 Early versus delayed oral fluids and food after major abdominal gynaecologic surgery, Outcome 7 Time to the first solid diet (random‐effects model) [days].](/es/cdsr/doi/10.1002/14651858.CD004508.pub4/media/CDSR/CD004508/image_n/nCD004508-CMP-001-07.png)
Comparison 1 Early versus delayed oral fluids and food after major abdominal gynaecologic surgery, Outcome 7 Time to the first solid diet (random‐effects model) [days].
![Comparison 1 Early versus delayed oral fluids and food after major abdominal gynaecologic surgery, Outcome 8 Hospital stay (random‐effects model) [days].](/es/cdsr/doi/10.1002/14651858.CD004508.pub4/media/CDSR/CD004508/image_n/nCD004508-CMP-001-08.png)
Comparison 1 Early versus delayed oral fluids and food after major abdominal gynaecologic surgery, Outcome 8 Hospital stay (random‐effects model) [days].
| Early oral feeding compared to delayed oral feeding for women who had major abdominal gynaecologic surgery | ||||||
| Patient or population: Women who had major abdominal gynaecologic surgery | ||||||
| Outcomes | Illustrative comparative risks* (95% CI) | Relative effect | No of Participants | Quality of the evidence | Comments | |
| Assumed risk | Corresponding risk | |||||
| Delayed oral feeding | Early oral feeding | |||||
| Postoperative ileus | 77 per 1000 | 36 per 1000 | RR 0.47 | 279 | ⊕⊕⊕⊝ | |
| Nausea or vomiting or both | 352 per 1000 | 363 per 1000 | RR 1.03 | 484 | ⊕⊕⊕⊝ | Random effects model, deployed because of substantial heterogeneity between studies (I2> 50%) |
| Time to bowel sounds [days] | The mean time to the presence of bowel sound [days] in the intervention groups was | 338 | ⊕⊕⊕⊝ | Random effects model, deployed because of substantial heterogeneity between studies (I2> 50%) | ||
| Time to the passage of flatus [days] | The mean time to the passage of flatus [days] in the intervention groups was | 444 | ⊕⊕⊕⊕ | |||
| Time to the first solid diet [days] | The mean time to the first solid diet [days] in the intervention groups was | 301 | ⊕⊕⊕⊝ | Random effects model, deployed because of substantial heterogeneity between studies (I2> 50%) | ||
| Time to first passage of stool [days] | The mean time to first passage of stool [days] in the intervention groups was | 249 | ⊕⊕⊕⊝ | |||
| Hospital stay [days] | The mean hospital stay [days] in the intervention groups was | 484 | ⊕⊕⊕⊝ | Random effects model, deployed because of substantial heterogeneity between studies (I2> 50%) | ||
| *The basis for the assumed risk (e.g. the median control group risk across studies) is provided in footnotes. The corresponding risk (and its 95% confidence interval) is based on the assumed risk in the comparison group and the relative effect of the intervention (and its 95% CI). | ||||||
| GRADE Working Group grades of evidence | ||||||
| 1 For the three studies contributing data, all were at high risk of performance bias, two were at unclear risk of detection bias, and one was at high risk of selection bias (no allocation concealment). 4 This outcome may be influenced by the high risk of performance bias in all studies that provided data. | ||||||
| Outcome or subgroup title | No. of studies | No. of participants | Statistical method | Effect size |
| 1 Postoperative ileus Show forest plot | 5 | Risk Ratio (M‐H, Fixed, 95% CI) | Subtotals only | |
| 1.1 Postoperative ileus | 3 | 279 | Risk Ratio (M‐H, Fixed, 95% CI) | 0.47 [0.17, 1.29] |
| 1.2 Nausea and/or vomiting (fixed‐effect model) | 4 | 484 | Risk Ratio (M‐H, Fixed, 95% CI) | 1.10 [0.88, 1.38] |
| 1.3 Nausea | 1 | 195 | Risk Ratio (M‐H, Fixed, 95% CI) | 1.79 [1.19, 2.71] |
| 1.4 Vomiting | 2 | 301 | Risk Ratio (M‐H, Fixed, 95% CI) | 0.86 [0.37, 2.00] |
| 1.5 Abdominal distension | 2 | 301 | Risk Ratio (M‐H, Fixed, 95% CI) | 1.07 [0.77, 1.47] |
| 1.6 Postoperative placement of nasogastric tube | 1 | 195 | Risk Ratio (M‐H, Fixed, 95% CI) | 0.48 [0.13, 1.80] |
| 2 Time intervals (fixed‐effect model) [days] Show forest plot | 4 | Mean Difference (IV, Fixed, 95% CI) | Subtotals only | |
| 2.1 Time to the presence of bowel sound (fixed‐effect model) [days] | 2 | 338 | Mean Difference (IV, Fixed, 95% CI) | ‐0.29 [‐0.48, ‐0.11] |
| 2.2 Time to the passage of flatus [days] | 3 | 444 | Mean Difference (IV, Fixed, 95% CI) | ‐0.21 [‐0.40, ‐0.01] |
| 2.3 Time to the first solid diet (fixed‐effect model) [days] | 2 | 301 | Mean Difference (IV, Fixed, 95% CI) | ‐1.19 [‐1.34, ‐1.05] |
| 2.4 Time to the first passage of stool [days] | 2 | 249 | Mean Difference (IV, Fixed, 95% CI) | ‐0.25 [‐0.58, 0.09] |
| 2.5 Hospital stay (fixed‐effect model) [days] | 4 | 484 | Mean Difference (IV, Fixed, 95% CI) | ‐0.59 [‐0.83, ‐0.35] |
| 3 Other major postoperative complications Show forest plot | 4 | 1286 | Risk Ratio (M‐H, Fixed, 95% CI) | 0.80 [0.63, 1.01] |
| 3.1 Febrile morbidity | 1 | 195 | Risk Ratio (M‐H, Fixed, 95% CI) | 0.98 [0.76, 1.27] |
| 3.2 Infectious complications | 2 | 183 | Risk Ratio (M‐H, Fixed, 95% CI) | 0.20 [0.05, 0.73] |
| 3.3 Wound complications | 4 | 474 | Risk Ratio (M‐H, Fixed, 95% CI) | 0.82 [0.50, 1.35] |
| 3.4 Pneumonia | 3 | 434 | Risk Ratio (M‐H, Fixed, 95% CI) | 0.35 [0.07, 1.73] |
| 4 Satisfaction visual analog scale [mm] Show forest plot | 1 | Mean Difference (IV, Fixed, 95% CI) | Subtotals only | |
| 5 Nausea and/or vomiting (random‐effects model) Show forest plot | 4 | 484 | Risk Ratio (M‐H, Random, 95% CI) | 1.03 [0.64, 1.67] |
| 6 Time to the presence of bowel sound (random‐effects model) [days] Show forest plot | 2 | 338 | Mean Difference (IV, Random, 95% CI) | ‐0.32 [‐0.61, ‐0.03] |
| 7 Time to the first solid diet (random‐effects model) [days] Show forest plot | 2 | 301 | Mean Difference (IV, Random, 95% CI) | ‐1.47 [‐2.26, ‐0.68] |
| 8 Hospital stay (random‐effects model) [days] Show forest plot | 4 | 484 | Mean Difference (IV, Random, 95% CI) | ‐0.92 [‐1.53, ‐0.31] |