Semen preparation techniques for intrauterine insemination
Abstract
Background
Semen preparation techniques for assisted reproduction, including intrauterine insemination (IUI), were developed to select the motile morphologically normal spermatozoa. The yield of many motile, morphologically normal spermatozoa might influence treatment choices and therefore outcomes.
Objectives
To compare the effectiveness of three different semen preparation techniques (gradient; swim‐up; wash and centrifugation) on clinical outcomes (live birth rate; clinical pregnancy rate) in subfertile couples undergoing IUI.
Search methods
We searched the Cochrane Gynaecology and Fertility Group (CGFG) trials register, CENTRAL, MEDLINE, Embase, Science Direct Database, National Research Register, Biological Abstracts and clinical trial registries in March 2019, and checked references and contacted study authors to identify additional studies.
Selection criteria
We included randomised controlled trials (RCTs) comparing the efficacy in terms of clinical outcomes of semen preparation techniques used for subfertile couples undergoing IUI.
Data collection and analysis
We used standard methodological procedures recommended by Cochrane. The primary review outcomes are live birth rate and clinical pregnancy rate per couple.
Main results
We included seven RCTS in the review; we included six of these, totalling 485 couples, in the meta‐analysis. No trials reported the primary outcome of live birth. The evidence was of very low‐quality. The main limitations were (unclear) risk of bias, signs of imprecision and inconsistency in results among studies and the small number of studies/participants included.
Swim‐up versus gradient technique
Considering the quality of evidence, we are uncertain whether there was a difference between clinical pregnancy rates (CPR) for swim‐up versus a gradient technique (odds ratio (OR) 0.83, 95% CI 0.51 to 1.35; I² = 71%; 4 RCTs, 370 participants; very low‐quality evidence). The results suggest that if the chance of pregnancy after the use of a gradient technique is assumed to be 24%, the chance of pregnancy after using the swim‐up technique is between 14% and 30%. We are uncertain whether there was a real difference between ongoing pregnancy rates per couple (OR 0.39, 95% CI 0.19 to 0.82; heterogeneity not applicable; 1 RCT, 223 participants; very low‐quality evidence). Considering the quality of evidence, we are uncertain whether there was a difference between multiple pregnancy rates (MPR) per couple comparing a swim‐up versus gradient technique (MPR per couple 0% versus 0%; 1 RCT, 25 participants; very low‐quality of evidence). Considering the quality of evidence, we are also uncertain whether there was a difference between miscarriage rates (MR) per couple comparing a swim‐up versus gradient technique (OR 0.85, 95% CI 0.28 to 2.59; I² = 44%; 3 RCTs, 330 participants; very low‐quality evidence). No studies reported on ectopic pregnancy rate, fetal abnormalities or infection rate.
Swim‐up versus wash technique
Considering the quality of evidence, we are uncertain whether there is a difference in clinical pregnancy rates after a swim‐up technique versus wash and centrifugation (OR 0.41, 95% CI 0.15 to 1.13; I² = 55%; 2 RCTs, 78 participants; very low‐quality evidence). The results suggest that if the chance of pregnancy after the use of a wash technique is assumed to be 38%, the chance of pregnancy after using the swim‐up technique is between 9% and 41%. Considering the quality of evidence, we are uncertain whether there was a difference between multiple pregnancy rates between swim‐up technique versus wash technique (OR 0.49, 95% CI 0.02 to 13.28; heterogeneity not applicable; 1 RCT, 26 participants; very low‐quality evidence). Miscarriage rate was only reported by one study: no miscarriages were reported in either treatment arm. No studies reported on ongoing pregnancy rate, ectopic pregnancy rate, fetal abnormalities or infection rate.
Gradient versus wash technique
Considering the quality of evidence, we are uncertain whether there is a difference in clinical pregnancy rates after a gradient versus wash and centrifugation technique (OR 1.78, 95% CI 0.58 to 5.46; I² = 52%; 2 RCTs, 94 participants; very low‐quality evidence). The results suggest that if the chance of pregnancy after the use of a wash technique is assumed to be 13%, the chance of pregnancy after using the gradient technique is between 8% and 46%. Considering the quality of evidence, we are uncertain whether there was a difference between multiple pregnancy rates per couple between the treatment groups (OR 0.33, 95% CI 0.01 to 8.83; very low‐quality evidence). Considering the quality of evidence, we are also uncertain whether there was a difference between miscarriage rates per couple between the treatment groups (OR 6.11, 95% CI 0.27 to 138.45; very low‐quality evidence). No studies reported on ongoing pregnancy rate, ectopic pregnancy rate, fetal abnormalities or infection rate.
Authors' conclusions
The very low quality of the available evidence means we cannot be certain about the relative effectiveness of the different semen preparation techniques: swim‐up versus gradient versus wash and centrifugation technique. No studies reported on live birth rates. We are uncertain whether there is a difference in clinical pregnancy rates, ongoing pregnancy rates, multiple pregnancy rates or miscarriage rates per couple between the three sperm preparation techniques. Further randomised trials are warranted that report live birth data
PICO
Plain language summary
Semen preparation techniques for intrauterine insemination
Review question
Cochrane authors reviewed the evidence about the effectiveness of three different sperm preparation techniques (gradient, swim‐up, and wash technique) on clinical outcome after intrauterine insemination (IUI).
Background
Semen preparation techniques are used in assisted reproduction to separate sperm which have a normal appearance and move spontaneously from the fluid portion of the semen in which the sperm are suspended. The effectiveness of specific semen preparation techniques for increasing pregnancy rates in subfertile couples undergoing IUI is unknown.
Study characteristics
We found six randomised controlled trials comparing a gradient, swim‐up or wash technique, in a total of 485 couples undergoing IUI. The evidence is current to March 2019.
Key results
We are uncertain whether there is a difference in pregnancy outcomes between the three sperm preparation techniques for subfertile couples undergoing IUI. No studies reported on live birth rates.
Swim‐up versus gradient technique
Considering the quality of evidence (very low), we are uncertain whether there was a difference between clinical pregnancy rates (CPR) for swim‐up versus a gradient technique. The results suggest that if the chance of pregnancy after the use of a gradient technique is assumed to be 24%, the chance of pregnancy after using the swim‐up technique is between 14% and 30%. We are uncertain whether there was a difference between ongoing pregnancy rates per couple, multiple pregnancy rates (MPR) per couple or miscarriage rates (MR) per couple when comparing a swim‐up versus gradient technique. The quality of the evidence for these outcomes was very low. No studies reported on ectopic pregnancy rate, fetal abnormalities or infection rate.
Swim‐up versus wash technique
Considering the quality of evidence (very low), we are uncertain whether there is a difference in clinical pregnancy rates after a swim‐up technique versus wash and centrifugation. The results suggest that if the chance of pregnancy after the use of a wash technique is assumed to be 38%, the chance of pregnancy after using the swim‐up technique is between 9% and 41%. Considering the very low‐quality evidence, we are uncertain whether there was a difference between multiple pregnancy rates between swim‐up technique versus wash technique. Miscarriage rate was only reported by one study: no miscarriages were reported in either treatment arm. No studies reported on ongoing pregnancy rate, ectopic pregnancy rate, fetal abnormalities or infection rate.
Gradient versus wash technique
Considering the quality of evidence (very low), we are uncertain whether there is a difference in clinical pregnancy rates after a gradient versus wash and centrifugation technique. The results suggest that if the chance of pregnancy after the use of a wash technique is assumed to be 13%, the chance of pregnancy after using the gradient technique is between 8% and 46%. Considering the quality of evidence, we are uncertain whether there was a difference between multiple pregnancy rates per couple between the treatment groups. Considering the quality of evidence, we are also uncertain whether there was a difference between miscarriage rates per couple between the treatment groups. No studies reported on ongoing pregnancy rate, ectopic pregnancy rate, fetal abnormalities or infection rate.
Quality of evidence
The quality of the evidence was very low. The main limitations were (unclear) risk of bias, signs of imprecision (small number of studies/participants included) and inconsistency in results among studies.
Authors' conclusions
Summary of findings
| Swim‐up technique compared to gradient technique for undergoing intrauterine insemination | ||||||
| Patient or population: patients undergoing intrauterine insemination (fresh semen) | ||||||
| Outcomes | Illustrative comparative risks* (95% CI) | Relative effect | No. of participants | Quality of the evidence | Comments | |
| Assumed risk | Corresponding risk | |||||
| Gradient technique | Swim‐up technique | |||||
| Live birth rate per couple | See comment | See comment | No studies reported on this outcome. | |||
| Clinical pregnancy rate per couple | 244 per 1000 | 212 per 1000 | OR 0.83 | 370 | ⊕⊝⊝⊝ | |
| Ongoing pregnancy rate per couple | 234 per 1000 | 107 per 1000 (55 to 201) | OR 0.39 (0.19 to 0.82) | 223 (1 study) | ⊕⊝⊝⊝ | |
| Multiple pregnancy rate per couple | See comment | See comment | Not estimable | 25 | ⊕⊝⊝⊝ | There were no events recorded in either group |
| Miscarriage rate per couple | 38 per 1000 | 33 per 1000 | OR 0.85 | 330 | ⊕⊝⊝⊝ | |
| *The basis for the assumed risk (e.g. the median control group risk across studies) is provided in footnotes. The corresponding risk (and its 95% CI) is based on the assumed risk in the comparison group and the relative effect of the intervention (and its 95% CI). | ||||||
| GRADE Working Group grades of evidence | ||||||
| a Risk of bias, downgrade 1 level: unclear risk of bias, no adequate explanation for randomisation or allocation concealment or attrition. High risk of performance bias. | ||||||
| Swim‐up technique compared to wash and centrifugation for undergoing intrauterine insemination | ||||||
| Patient or population: patients undergoing intrauterine insemination (fresh semen) | ||||||
| Outcomes | Illustrative comparative risks* (95% CI) | Relative effect | No. of participants | Quality of the evidence | Comments | |
| Assumed risk | Corresponding risk | |||||
| Wash and centrifugation | Swim‐up technique | |||||
| Live birth rate per couple | See comment | See comment | No studies reported on this outcome. | |||
| Clinical pregnancy rate per couple | 381 per 1000 | 201 per 1000 | OR 0.41 | 78 | ⊕⊝⊝⊝ | |
| Ongoing pregnancy rate per couple | See comment | See comment | No studies reported on this outcome. | |||
| Multiple pregnancy rate per couple | 63 per 1000 | 32 per 1000 (1 to 470) | OR 0.49 | 26 | ⊕⊝⊝⊝ | |
| Miscarriage rate per couple | See comment | See comment | Not estimable | 20 | ⊕⊝⊝⊝ | There were no events in either group |
| *The basis for the assumed risk (e.g. the median control group risk across studies) is provided in footnotes. The corresponding risk (and its 95% CI) is based on the assumed risk in the comparison group and the relative effect of the intervention (and its 95% CI). | ||||||
| GRADE Working Group grades of evidence | ||||||
| a Risk of bias, downgrade 1 level: 1 of the 2 trials did not conceal allocation and there was no blinding. High risk of performance bias. | ||||||
| Gradient technique compared to Wash and centrifugation for undergoing intrauterine insemination | ||||||
| Patient or population: patients with undergoing intrauterine insemination (fresh semen) | ||||||
| Outcomes | Illustrative comparative risks* (95% CI) | Relative effect | No. of participants | Quality of the evidence | Comments | |
| Assumed risk | Corresponding risk | |||||
| Wash and centrifugation | Gradient technique | |||||
| Live birth rate per couple | See comment | See comment | No studies reported on this outcome. | |||
| Clinical pregnancy rate per couple | 133 per 1000 | 215 per 1000 | OR 1.78 | 94 | ⊕⊝⊝⊝ | |
| Ongoing pregnancy rate per couple | See comment | See comment | No studies reported on this outcome. | |||
| Multiple pregnancy rate per couple | 63 per 1000 | 22 per 1000 | OR 0.33 | 31 | ⊕⊝⊝⊝ | |
| Miscarriage rate per couple | no events (0/16) | 2/15 see comment | OR 6.11 | 31 | ⊕⊝⊝⊝ | Corresponding risk not estimable since there were no events in "wash and centrifugation" (0/16). |
| *The basis for the assumed risk (e.g. the median control group risk across studies) is provided in footnotes. The corresponding risk (and its 95% CI) is based on the assumed risk in the comparison group and the relative effect of the intervention (and its 95% CI). | ||||||
| GRADE Working Group grades of evidence | ||||||
| a Risk of bias, downgrade 1 level: 1 of the 2 trials did not provide adequate details on randomisation or allocation concealment and did not use blinding, abstract. High risk of performance bias. | ||||||
Background
Description of the condition
The success of the treatment of subfertile couples has made substantial progress over the last two decades. Subfertile couples are defined as couples who have tried unsuccessfully to conceive for at least one year despite regular and unprotected sexual intercourse (Evers 2002). Subfertility is a common problem, affecting up to 15% of couples (Evers 2002; Templeton 1990). Demand for infertility treatment is on the rise as increasing numbers of women delay having children till an age when natural female fertility is in decline and there is a raised chance of exposure to sexually transmitted diseases and continually falling sperm counts (Delhanty 2001; Niederberger 2018; Swan 1999), although worldwide the percentage of women seeking treatment has not significantly changed over the last two decades (Mascarenhas 2012). According to a number of high‐quality studies, intrauterine insemination (IUI) should be the first choice treatment in case of unexplained and moderate male factor subfertility and an unfavourable prognosis for natural conception (Farquhar 2018; Ombelet 2017).
With the emergence of in vitro fertilization (IVF) with uterine transfer of embryos (IVF‐ET), semen preparation techniques were developed to separate motile sperm that are morphologically normal (normal appearance) from seminal plasma (the fluid portion of the semen in which the spermatozoa are suspended) and foreign material. It is known that white blood cells, bacteria and dead spermatozoa produce oxygen radicals that negatively influence the ability of normal spermatozoa to fertilize the egg (Aitken 1994; De Jonge 2002; Parinaud 1997). Reactive oxygen species (ROS) cause peroxidative damage and loss of sperm function, as well as DNA damage in both the nuclear and mitochondrial genomes (WHO 2010). A randomised controlled trial (RCT) of prepared sperm compared to unprepared first split ejaculates showed that semen preparation significantly increased the probability of conception after IUI in a group of couples with male subfertility (Goldenberg 1992). Furthermore, in IUI the use of fresh unprepared semen has been reported to cause uterine cramps and may induce pelvic inflammatory disease, endometritis, cervicitis or vaginitis, as well as an increased likelihood of miscarriage, premature delivery or a malformed fetus (Wang 1991; Yan 1998).
Some research has suggested an association between the probability of conception after IUI and the absolute number of motile sperm that are inseminated. Some retrospective studies have defined a threshold level beyond which pregnancy rates reached a plateau (Berg 1997; Huang 1996a; Khalil 2001; Madbouly 2017). However, the threshold levels found in these studies differed substantially from one to five million motile sperm, which makes these results less useful in practice. One prospective controlled trial demonstrated links between total sperm motility and the probability of conception after IUI (Van Voorhis 2001).
In couples with subfertility, the yield of as many motile, morphologically normal spermatozoa as possible is important as it influences treatment choices and therefore outcomes. A high yield can lead to a preference for IUI or IVF, whereas a lower yield could result in a preference for intracytoplasmic sperm injection (ICSI). ICSI is an IVF procedure in which a single sperm is injected directly into an egg, a procedure that is most commonly used to overcome severe male infertility problems. The treatment outcome after ICSI is not related to the number of available motile sperm.
Description of the intervention
Many sperm preparation procedures are available, but there are three main groups of methods.
Firstly, spermatozoa may be selected on their ability to swim, known as the 'swim‐up technique'. This technique is performed by layering culture medium over the liquefied semen. Motile spermatozoa swim up into the culture. The upper part of the layered medium is then carefully removed for further use.
The second method of selecting spermatozoa is by the use of density gradients. The semen sample is pipetted on top of the density column, which is then centrifuged. Density gradient centrifugation separates spermatozoa according to their density. This way you can select the motile, morphologically normal spermatozoa in the solution with the highest concentration of gradient, which is aspirated for further use (WHO 1999). Sperm preparation with the use of density gradient centrifugation has been a standard technique in assisted reproductive techniques. Fresh semen samples have been centrifuged on Percoll gradients in the 40% to 90% range with good recovery (Byrd 1996). In late 1996, Percoll was removed from clinical human use. This product was replaced by silica stabilized with covalently bound hydrophilic silane, marketed under several commercial names.
The third method is the conventional wash method in combination with centrifugation, previously only used for diagnostic procedures. The semen sample is diluted with a medium and centrifuged. Subsequently, the pellet (the bottom part after centrifugation) is resuspended in a small amount of medium and incubated until the time of insemination.
Apart from a simple wash technique, the swim‐up technique is the oldest and most commonly used sperm preparation method. It is still used largely in IUI and IVF laboratories around the world. Density gradient techniques are easier to standardize than the swim‐up technique and the results are more consistent. Usually, the choice of sperm preparation technique is dictated by the nature of the semen sample. Swim‐up technique is often used when semen samples are considered to be largely normal, whereas density gradient techniques can be preferred in male factor infertility because of the greater total number of motile spermatozoa recovered (Henkel 2003; WHO 2010).
How the intervention might work
The aim of semen preparation is to separate the normal sperm from the debris of the ejaculate and, in the case of IUI, to yield as many normal motile spermatozoa as possible. The number of motile sperm after preparation in relation to the total number of motile sperm before preparation is expressed as the recovery rate. Preparation techniques that have higher recovery rates are considered superior for IUI. Sperm preparation techniques may also influence DNA fragmentation. A prospective randomised study was conducted in subfertile patients (unexplained and male factor infertility) to compare basal and post‐procedure DNA fragmentation rates in swim‐up and gradient techniques. Swim‐up method significantly reduces sperm DNA fragmentation rates (Oguz 2018). Current evidence supports the association between high sperm DNA fragmentation and poor reproductive outcomes for natural conception and intrauterine insemination (Cho 2017).
Although spermatozoa recovery rates might be interesting when you compare different semen preparation techniques, clinicians and prospective parents regard live birth rate as the most important outcome. One type of semen preparation technique might be superior to another in relation to clinical outcome after IUI.
Why it is important to do this review
The comparison of different semen preparation techniques in relation to semen parameters has been the focus of a substantial amount of research. Studies addressing semen parameters after different semen preparation techniques may be less useful since different practitioners have different methods of sperm analysis, resulting in less comparable data. Clinical outcomes are objective and of interest to patients and clinicians. There is, however, no consensus in the literature on this topic. Differences found in individual trials do not always reach significance. It seemed appropriate to perform a meta‐analysis combining the results of available randomised controlled trials. This systematic review investigated which semen preparation technique is superior.
Objectives
To compare the effectiveness of three different semen preparation techniques (gradient; swim‐up; wash and centrifugation) on clinical outcomes (live birth rate, clinical pregnancy rate) in subfertile couples undergoing IUI.
Methods
Criteria for considering studies for this review
Types of studies
We included randomised controlled trials (RCTs) in this review. We assessed the method of randomisation to determine whether each study was truly randomised. We only included studies with a cross‐over design in the meta‐analysis if the first cycle was randomised and first cycle data were available (prior to crossing‐over). We did not include split‐sample studies since by design they cannot compare clinical outcomes.
Types of participants
We defined subfertility as couples who have tried unsuccessfully to conceive for at least one year, despite regular and unprotected sexual intercourse (Evers 2002). We placed no restriction on causes of subfertility. We defined unexplained subfertility as infertility for at least one year without any abnormality found at routine fertility check‐up (normal results in semen analyses, luteal phase assessment, tubal patency, immunological testing and investigations into uterine anomalies). We did not include normal fertile participants or healthy volunteers.
If essential information about the participants was lacking, we sought more information from the authors.
Types of interventions
Any included study must have made a comparison of the following, in pairs or in a combination of all three techniques:
-
A gradient technique
-
A swim‐up technique
-
Wash and centrifugation
We included subfertile couples undergoing IUI. We excluded subfertile couples undergoing other assisted reproduction techniques because of the likelihood of a large difference in the number of motile sperm needed for IUI compared to IVF, ICSI or gamete intrafallopian transfer (GIFT), for example.
Types of outcome measures
Primary outcomes
-
Live birth rate (LBR) per couple. Live birth is defined as delivery of a live fetus after 20 completed weeks of gestation.
-
Clinical pregnancy rate (CPR) per couple defined as evidence of a gestational sac, confirmed by ultrasound.
Secondary outcomes
-
Ongoing pregnancy rate (OPR) per couple. Ongoing pregnancy is defined as evidence of a gestational sac with fetal heart motion at 12 weeks, confirmed with ultrasound.
-
Multiple pregnancy rate (MPR) per couple — twins, triplets or higher order — specified if possible (confirmed by ultrasound or delivery).
-
Miscarriage rate (MR) per couple, confirmed by ultrasound and pregnancy test or by histology.
-
Ectopic pregnancy rate per couple (confirmed by histology).
-
Fetal abnormalities per couple.
-
Infections per couple.
Search methods for identification of studies
We searched for all published and unpublished RCTs comparing clinical outcomes after a gradient technique, swim‐up technique or wash and centrifuge, without language restriction and in consultation with the Cochrane Gynaecology and Fertility Group (CGF) Information Specialist, Marian Showell.
Electronic searches
We searched the following electronic databases for relevant trials.
-
The CGFG Specialised Register of Controlled Trials, PROCITE platform (searched 12 March 2019);
-
CENTRAL; via the Cochrane Register of Studies Online (CRSO Web platform) (searched 12 March 2019);
-
MEDLINE (Epub Ahead of Print, In‐Process & Other Non‐Indexed Citations) Ovid platform (searched from 1946 to 12 March 2019);
-
Embase Ovid platform (searched from 1980 to 12 March 2019);
-
PsycINFO Ovid platform (searched from 1806 to 12 March 2019);
We combined the MEDLINE search with the Cochrane Highly Sensitive Search Strategy for identifying randomised trials which appears in the Cochrane Handbook of Systematic Reviews of Interventions (Version 5.1.0 chapter 6, 6.4.11). We combined the Embase and PsycINFO searches with trial filters developed by the Scottish Intercollegiate Guidelines Network (SIGN) https://www.sign.ac.uk/search‐filters.html.
We searched databases using different search strategies as provided in Appendix 1, Appendix 2, Appendix 3, Appendix 4 and Appendix 5.
Searching other resources
We also handsearched the citation lists of relevant publications, review articles, European Society of Human Reproduction and Embryology (ESHRE) and American Society for Reproductive Medicine (ASRM) abstract books. We conducted a simple search in PubMed and Google in order to identify any trials not yet indexed in the major databases. We searched abstracts of scientific meetings and included studies. We also searched the trial register www.ClinicalTrials.gov (a service of the US National Institutes of Health) for ongoing and registered trials (Appendix 6). In addition we had personal communication with experts and authors in the field.
Data collection and analysis
Selection of studies
After an initial screen of titles and abstracts retrieved by the search, conducted by two authors (Boomsma and Cohlen), we retrieved the full texts of all potentially eligible studies. Two review authors (Boomsma and Cohlen) independently examined these full‐text articles for compliance with the inclusion criteria and selected eligible studies. We corresponded with study investigators as required, to clarify study eligibility. We resolved disagreement through discussion or, if required, in consultation with the third author until we reached consensus. If any reports had required translation, we would have described the process used for data collection. We have documented the selection process with a PRISMA flow chart (Figure 1).

PRISMA study flow diagram (updated search 2019)
Data extraction and management
Two review authors independently extracted data from eligible studies using a data extraction form designed and pilot‐tested by the authors. We resolved any disagreements by discussion. Data extracted included study characteristics and outcome data (see data extraction form for details, Appendix 7). We corresponded with study investigators for further data on methods, results or both, as required. Data are often presented in a non‐standardised format: we included studies irrespective of whether outcomes are reported in a 'usable' way. In multi‐arm studies, we excluded data from arms that do not meet eligibility criteria.
Assessment of risk of bias in included studies
Two review authors independently assessed the included studies for risk of bias using the Cochrane 'Risk of bias' assessment tool (Higgins 2011) to assess the following.
-
Selection bias (random sequence generation and allocation concealment)
-
Performance bias (blinding of participants and personnel)
-
Detection bias (blinding of outcome assessment; the primary outcome 'live birth rate/ongoing pregnancy rate' was not, however, susceptible to this kind of bias)
-
Attrition bias (describing the completeness of outcome data)
-
Reporting bias (selective reporting, such as failure to report outcomes/publication bias)
-
Other bias.
We assigned judgements as recommended in the Cochrane Handbook for Systematic Reviews of Interventions, Section 8.5. There were no disagreements. We summarised results in the 'Risk of bias' tables for all included studies, and incorporated them into our interpretation of review findings.
Measures of treatment effect
For dichotomous data (e.g. clinical pregnancy rates), we used the numbers of events in the control and intervention groups of each study to calculate odds ratio (OR). We presented 95% confidence intervals for all outcomes. Should data to calculate ORs not have been available, we would have utilised the most detailed numerical data available that may facilitate similar analyses of included studies (e.g. test statistics, P values). We assessed whether the estimates calculated in the review for individual studies were compatible in each case with the estimates reported in the study publications.
Unit of analysis issues
Results from included studies that we excluded from the meta‐analysis due to a cross‐over design are described in additional tables (Table 1, Table 2). The primary analyses are data per couple randomised; only miscarriage rates per pregnancy were mentioned in the review text. We have only included first‐phase data from cross‐over trials and we contacted authors when needed.
| Study ID | Allocation Score | Methods | Participants | Interventions | Outcomes |
| B | Stated random, but no details. Design: cross‐over, multi‐centre. Concealment of allocation, blinding, number of dropouts or cancelled cycles, intention‐to‐treat analysis, power calculation: all not stated. | 363 women: 558 cycles in the 3 methods of interest. Age of women, duration subfertility: not stated. Cause: unexplained/(fe)male related disorders. Exclusion criteria: oligoasthenozoospermic semen samples after preparation. Inclusion criteria: not stated. | 3 preparation techniques (out of 5 described). 1) Sperm wash: 8 to 10 ml. medium (Ham's F‐10), 10 min. 400 × g centrifugation. Supernatant decanted, pellet resuspended. 2) Swim‐up: 2× washed, resuspended. Medium layered on top. Incubation 1h. Top removed. 3) Gradient: 1x wash + resuspension. Percoll, (35%/ 90%).15 min 400 × g centrifugation. 90% layer washed. Single IUI. 2.5 ± 0.3 inseminations per women. 124 women: 50 to 200 mg. CC day 5 to 9 or no COH. 239 women: gonadotropin/hCG. | Clinical pregnancy rate (CPR)/cycle, Miscarriage rate (MR)/pregnancy, Live birth rate (LBR)/ cycle |
| Study ID | Sample Size | Gradient technique | Swim‐up | Wash and centrifuge | Conclusion | Statistical analysis |
| 558 cycles | CPR/cycle: 16% (33/204), LBR/ cycle: 13% (26/204), MR/pregnancy: 21% (7/33) | CPR/cycle: 15% (29/197), LBR/cycle: 13% (26/197), MR/pregnancy: 10 % (3/29) | CPR/cycle: 9% (14/157), LBR/cycle: 7% (11/157), MR/pregnancy: 21% (3/14) | CPR/cycle wash‐method significantly lower than Swim‐up/Percoll (P < 0.05), LBR/cycle wash‐method significantly lower than Swim‐up/Percoll (P < 0.05). No other significant differences. | CPR/cycle and MR/pregnancy: ×2 analysis and Fisher's exact test. Statistical significance P < 0.05. |
Dealing with missing data
For included studies, we have noted levels of attrition in the Characteristics of included studies tables. We analysed the data on an intention‐to‐treat basis as far as possible.
Assessment of heterogeneity
We examined heterogeneity between the results of different studies by inspecting the scatter in the data points and the overlap in their confidence intervals, and more formally by checking the results of the Chi² tests. We took an I² statistic greater than 50% to indicate substantial statistical heterogeneity (Higgins 2011). Clinical heterogeneity in subfertility cannot be avoided because most centres use their own materials and methods, which can differ in a number of ways. When trials met the inclusion criteria and they had performed the same intervention, we considered it appropriate to pool their results.
Assessment of reporting biases
In view of the difficulty of detecting and correcting for publication bias and other reporting biases, we aimed to minimise their potential impact by ensuring a comprehensive search for eligible studies and by being alert for duplication of data. If there had been 10 or more studies in an analysis, we would have used a funnel plot to explore the possibility of small‐study effects (a tendency for estimates of the intervention effect to be more beneficial in smaller studies).
Data synthesis
We combined the data using a fixed‐effect model (underlying effect size assumed to be the same for all trials in the analysis) in the following comparisons.
-
Swim‐up versus gradient technique
-
Swim‐up versus wash technique
-
Gradient versus wash technique
We performed statistical analysis using Review Manager 5 (Review Manager 2014). We considered clinical pregnancy and live birth rates to be positive consequences of treatment; we therefore considered a higher proportion achieving these outcomes to be a benefit. The outcomes of adverse effects (multiple pregnancy, miscarriage, ectopic pregnancy, fetal abnormalities and infections) are negative consequences of treatment and therefore we considered higher numbers to be detrimental. This needs to be taken into consideration when viewing the summary graphs.
Subgroup analysis and investigation of heterogeneity
A priori, it was planned to perform a subgroup analysis to look at the possible contribution of differences in the indication of subfertility (male factor versus other) and type and method of the semen preparation technique. It was planned to perform these analyses if there were more than five trials in each group.
Sensitivity analysis
A priori, we planned to perform a sensitivity analysis to determine whether the conclusions are robust to arbitrary decisions made regarding the eligibility and analysis and to look at the possible contribution of differences in methodological quality of the trials. We would have performed sensitivity analyses by excluding those studies with a high risk of bias. We planned to perform these analyses if there were more than five trials in each group.
Overall quality of the body of evidence: 'Summary of findings' table
We prepared a 'Summary of findings' table using GRADEpro and Cochrane methods. This table evaluates the overall quality of the body of evidence for the main review outcomes (clinical pregnancy rate, ongoing pregnancy rate, multiple pregnancy rate, and miscarriage rate) for the main review comparisons (swim‐up versus gradient technique, swim‐up versus wash technique, and gradient versus wash technique). Two review authors (Boomsma and Farquhar) assessed the quality of the evidence independently by using GRADE criteria: risk of bias; consistency of effect; imprecision; indirectness; and publication bias.
Results
Description of studies
Results of the search
Sixty‐one studies (39 studies after the initial search and 22 studies after the update) were potentially eligible and we retrieved them in full text. Seven studies met our inclusion criteria (of which we included six studies in the meta‐analysis). We excluded 54 studies. See study tables: Characteristics of included studies, and Characteristics of excluded studies. A PRISMA flow chart of the results of the initial and updated search is included (Figure 1).
Included studies
Study design and setting
We included six randomised controlled trials in the meta‐analysis (Dodson 1998; Grigoriou 2005; Karamahmutoglu 2014; Posada 2005; Soliman 2005; Xu 2000). We included one of the studies in the meta‐analysis after contact with the authors of the study (Dodson 1998). This study had a cross‐over design but the authors were able to provide initial cycle data, prior to the cross‐over. Carrell 1998 was not able to provide data from the initial treatment cycle, and therefore we included this study in the review but excluded it from the meta‐analysis. The characteristics and results of these cross‐over trials are summarized in Table 1 and Table 2.
Only Karamahmutoglu 2014 and Dodson 1998 performed a power analysis; only Karamahmutoglu 2014 performed it prospectively. Dodson 1998 reported that 700 cycles would have been needed in each treatment arm (power 80%) and they included 153 cycles in total. Karamahmutoglu 2014 reported 280 patients were required (140 in each treatment arm), 223 couples were included in total. Both studies do not describe the reasons for not including the number of patients needed for adequate statistical power.
Participants
The studies included 485 subfertile couples undergoing IUI with subfertility for at least one year. Dodson 1998, Karamahmutoglu 2014, Posada 2005 and Soliman 2005 included women with a variety of causes of infertility. Male factor infertility was excluded by Carrell 1998. Grigoriou 2005 included couples with unexplained infertility. The cause of subfertility in Xu 2000 was male factor infertility only (all semen samples were oligoasthenoteratospermic).
Treatment groups were similar at baseline in Dodson 1998, Karamahmutoglu 2014, Posada 2005. Since Grigoriou 2005 and Xu 2000 lacked details about important prognostic indicators concerning the participants (women's age, duration of infertility), it was unclear whether treatment groups were similar at baseline regarding these indicators. Women's age is an important factor in predicting the success of reproductive treatment (Campana 1996). In Dodson 1998 we were able to extract information about the participants from the raw data supplied by the authors. Soliman 2005, an abstract, did report women's age (32.4 and 34.5 years for the gradient and wash technique respectively).
The studies were performed in different countries: Canada (Soliman 2005), China (Xu 2000), Colombia (Posada 2005), Greece (Grigoriou 2005), Turkey (Karamahmutoglu 2014), and the USA (Dodson 1998).
Interventions
Xu 2000 compared a gradient technique (Percoll) versus swim‐up technique versus a real‐time separation technique (which was not considered by this review). Grigoriou 2005 compared a wash technique (with exogenous platelet‐activating factor) versus a swim‐up technique. Soliman 2005 also compared a gradient technique with a wash technique. Dodson 1998 compared the efficacy of wash and centrifugation versus multiple tube swim‐up versus a gradient technique (Percoll). Karamahmutoglu 2014 and Posada 2005 compared a swim‐up versus a gradient technique. Carrell 1998 compared five different semen preparation techniques: wash technique; swim‐up; swim‐down; gradient technique; refrigeration and heparin technique. See the table Characteristics of included studies for further details.
The assisted reproductive technique used in all studies was IUI. In Dodson 1998, Grigoriou 2005, Karamahmutoglu 2014, Posada 2005 and Soliman 2005, all women received ovarian hyperstimulation with gonadotropins or clomiphene citrate, or both. Soliman 2005 performed two inseminations per cycle, 24 hours apart. Carrell 1998 included IUI both with and without controlled ovarian hyperstimulation. In Xu 2000 it was not stated whether controlled ovarian hyperstimulation was used.
Outcomes
Primary outcomes
No trials reported the primary outcome 'live birth'. All included studies reported the primary outcome 'clinical pregnancy rate per couple'. However, Xu 2000 and Soliman 2005 only reported pregnancy rates without a definition. Posada 2005 reported clinical pregnancy rates, also without definition. Dodson 1998, Grigoriou 2005 and Karamahmutoglu 2014 defined clinical pregnancy rate by the presence of a gestational sac on ultrasound scan.
Secondary outcomes
Karamahmutoglu 2014 reported ongoing pregnancy rates defined as a viable fetus detected after 12 weeks of pregnancy.
After receiving raw data from Dodson 1998 we were also able to calculate the miscarriage rate and multiple pregnancy rate per couple (first cycle). Karamahmutoglu 2014 and Posada 2005 also reported the miscarriage rate per couple. No other adverse effects were described by the studies.
Excluded studies
Fifty‐four studies failed to meet the inclusion criteria for reasons outlined in the table Characteristics of excluded studies. Exclusions, for one or more reasons, were as follows.
We excluded 32 studies as they did not perform a comparison of interest (Abed 2015; Almagor 1993; Aribarg 1995; Bajamonte 1994; Baka 2009; Berteli 2017; Bhakta 2010; Chan 1992; Fazaeli 2018; Fleming 2008; Gentis 2012; Heidari 2016; Huang 1996b; Inaudi 2002; Jalilian 2016; Karlström 1991; Kücük 2008; Mathieu 1988; Menge 1992; Monqaut 2011; Ozturk 2008; Paul 2004; Ragni 1998; Romany 2017; Roth 2018; Siam 2012; Su 1993; Tomari 2017; Tsai 2004; Urry 1988; Zarmakoupis‐Zavos 1998; Zavos 1992). Menge 1992, a conference abstract, was not able to provide separate data from the swim‐up and Percoll group and, after contact with the authors, this allocation seemed to us to be non‐randomised. Urry and colleagues did not provide separate data in their article about the comparison between the swim‐up and wash preparation in the 'husband artificial insemination group' (Urry 1988). We did not succeed in contacting the authors to see if separate data were available.
We excluded 17 studies for not using IUI as an assisted reproduction technique (Bajamonte 1994; Chan 1992; Cimino 1990; Guerin 1989; Hammadeh 2001; Heidari 2016; Jaroudi 1993; Leonetti 1995; Levay 1995; Mathieu 1988; Ord 1990; Ricci 2009; Sapienza 1993; Tanphaichitr 1988; Tomari 2017; Van Der Zwalmen 1991; Zech 1993).
We excluded 30 studies for failing to use a randomised design (Almagor 1993; Bajamonte 1994; Berteli 2017; Caccamo 1995; Chan 1992; Cimino 1990; Depypere 1995; Fleming 2008; Guerin 1989; Hammadeh 2001; Heidari 2016; Huang 1996b; Leonetti 1995; Levay 1995; Mathieu 1988; Menge 1992; Morshedi 2003; Oguz 2018; Ohashi 1992; Ord 1990; Remohi 1989; Ren 2004; Ricci 2009; Roth 2018; Su 1993; Tanphaichitr 1988; Tomari 2017; Urry 1988; Van Der Zwalmen 1991; Werlin 1992). Four studies were quasi‐randomised (Bajamonte 1994; Morshedi 2003; Tomari 2017; Werlin 1992); and Van Der Zwalmen 1991 and Remohi 1989 failed to describe the design. Two studies were excluded after contact with the authors (Butt 2016; Oguz 2018). Butt 2016 appeared to be a prospective observational study. The method of sperm preparation (density gradient versus swim‐up) was dependent on sperm parameters rather than randomised. Oguz 2018 compared a swim‐up and gradient technique on sperm DNA fragmentation status of semen samples from patients undergoing IUI. Sperm DNA fragmentation rates were evaluated in two portions of each sample of semen that was prepared with either swim‐up or gradient techniques. Afterwards, patients were randomised to swim‐up versus gradient technique, and one half of the semen sample was used for IUI. However, clinical data in relation to sperm preparation technique was not available.
Risk of bias in included studies
The risk of bias of the studies is summarised in Figure 2 and Figure 3.

Risk domains: review authors' judgements about each potential risk of bias item for each included study.

Risk of bias: review authors' judgements about each risk domain presented as percentages across all included studies.
Allocation
Sequence generation
We rated two studies at low risk of selection bias related to sequence generation, as they used computer randomisation (Dodson 1998; Karamahmutoglu 2014). We also rated Grigoriou 2005 at low risk of selection bias since they randomised their patients by a permuted block design from a table with random numbers. Four studies did not describe the method used and we rated them at unclear risk of this bias (Carrell 1998; Posada 2005; Soliman 2005; Xu 2000). We did not succeed in contacting the authors.
Allocation concealment
We rated two studies at low risk of selection bias regarding allocation concealment, as allocation was concealed by keeping the random numbers sequence at the laboratory in a separate location (Dodson 1998; Karamahmutoglu 2014). Four studies failed to describe methods of allocation concealment and we rated these at unclear risk of bias for this domain (Carrell 1998; Posada 2005; Soliman 2005; Xu 2000). We did not succeed in contacting the authors. We rated one study at high risk of selection bias since allocation was not concealed (Grigoriou 2005).
Blinding
Performance bias
In Karamahmutoglu 2014 the patients and the clinicians were blinded from knowledge of which sperm preparation technique was used by keeping the method of sperm preparation restricted to the laboratory staff. In Dodson 1998 study participants were blinded (information provided by the authors), but personnel were not blinded from knowledge of which intervention a participant received. Grigoriou 2005, Posada 2005, Soliman 2005 and Xu 2000 did not report blinding. We considered all studies to be at a high risk of performance bias, since the laboratory staff can easily perform better or worse with either technique according to subjective and subconscious prejudice.
Detection bias
In Karamahmutoglu 2014 outcome assessors were blinded from knowledge of which intervention a participant received; intended blinding was effective. Laboratory staff were not involved in outcome assessment. Overall, therefore, a low risk of detection bias.
We consider risk of detection bias for all other studies (due to knowledge of the allocated interventions by outcome assessors) to be unclear, since the primary review outcomes are not susceptible to bias (clinical pregnancy/live birth rate).
Incomplete outcome data
Dodson 1998 reported four dropouts who achieved a treatment‐independent pregnancy during study enrolment; no intention‐to‐treat analysis was done. They do not report further dropouts (high risk of attrition bias). Grigoriou 2005 reported two dropouts in the swim‐up study group; no reason was reported. An intention‐to‐treat analysis was performed (by imputation of no event) (low risk of attrition bias). The number of cancelled cycles was not stated. Five studies did not report dropouts or loss to follow‐up and we judged them to be at unclear risk of attrition bias (Carrell 1998; Karamahmutoglu 2014; Posada 2005; Soliman 2005; Xu 2000).
Selective reporting
We identified no studies at high risk for selective reporting. No studies reported live birth as an outcome; this primary outcome is often not reported in fertility studies, however, because of the need for long follow‐up rather than selective reporting bias. None of the studies failed to report outcomes that they planned to in their Methods section. However, data on adverse events were available for only two of the studies (Dodson 1998; Posada 2005). We did not classify the studies which did not report adverse events as at high risk of selective reporting in this review since adverse events are not expected as a result of different semen preparation techniques and the impact of failure to report them is unclear.
It was not useful to use a funnel plot to assess for publication bias, since at most four studies were pooled in any meta‐analysis.
Other potential sources of bias
We identified use of inappropriate cross‐over design as a source of potential bias in two studies (Carrell 1998; Dodson 1998). The risk of other biases was unclear in two studies (Soliman 2005; Xu 2000), one of which was an abstract (Soliman 2005), as they did not describe their methods in detail. In Xu 2000 it was unclear whether treatment groups were similar at baseline. In addition, the definition of pregnancy was unclear in Posada 2005, Xu 2000 and Soliman 2005, and we assumed it to be a risk of bias. Although Posada 2005 did report clinical pregnancy rates, rather than pregnancy rates.
Effects of interventions
See: Summary of findings for the main comparison Swim‐up technique compared to gradient technique for undergoing intrauterine insemination; Summary of findings 2 Swim‐up technique compared to wash and centrifugation for undergoing intrauterine insemination; Summary of findings 3 Gradient technique compared to wash and centrifugation for undergoing intrauterine insemination
1. Swim‐up versus gradient technique
We included Dodson 1998, Karamahmutoglu 2014, Posada 2005 and Xu 2000 in this analysis.
Live birth rate per couple
No studies reported on this outcome.
1.1 Clinical pregnancy rate per couple
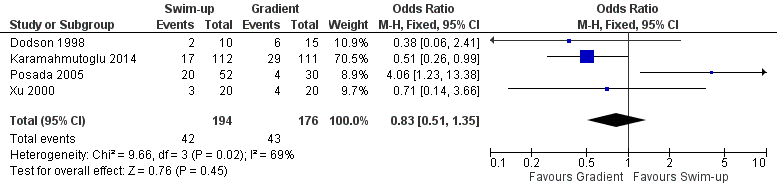
Considering the quality of evidence, we are uncertain whether there was a difference between CPR for swim‐up versus a gradient technique (PR 22% versus 24% respectively; odds ratio (OR) 0.83, 95% CI 0.51 to 1.35; I² = 71%; 4 RCTs, 370 participants; very low‐quality evidence). The results suggest that if the chance of clinical pregnancy after the use of a gradient technique is assumed to be 24%, the chance of clinical pregnancy after using the swim‐up technique is between 14% and 30%. See Figure 4.

Forest plot of comparison: 1 Swim‐up versus gradient technique; fresh semen, outcome: 1.1 Clinical pregnancy rate per couple.
1.2 Ongoing pregnancy rate per couple (secondary outcome)
There were no available data from Dodson 1998, Posada 2005 and Xu 2000. The ongoing pregnancy rate per couple was 11% after swim‐up technique versus 23% after gradient technique (Karamahmutoglu 2014). Although there was a significantly higher ongoing pregnancy rate after gradient versus swim‐up technique, we are uncertain whether there was a real difference between ongoing pregnancy rates per couple considering the quality of evidence (OR 0.39, 95% CI 0.19 to 0.82; heterogeneity not applicable; 1 RCT, 223 participants; very low‐quality evidence).
1.3 Multiple pregnancy rate per couple (secondary outcome)
There were no available data from Karamahmutoglu 2014, Posada 2005 and Xu 2000. No multiple pregnancies were observed by Dodson 1998.
1.4 Miscarriage rate per couple (secondary outcome)
Considering the quality of evidence, we are uncertain whether there was a difference between miscarriage rates (MR) per couple comparing a swim‐up versus gradient technique (MR per couple 3% versus 4%; OR 0.85, 95% CI 0.28 to 2.59; I² = 44%; 3 RCTs, 330 participants; very low‐quality evidence). See Figure 5.
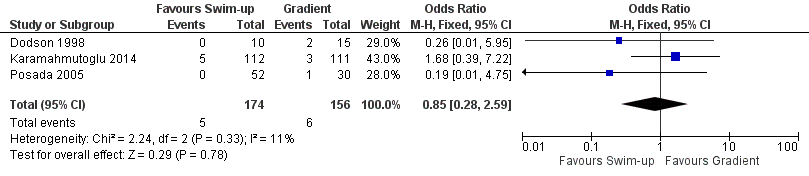
Forest plot of comparison: 1 Swim‐up versus gradient technique; fresh semen, outcome: 1.4 Miscarriage rate per couple.
Ectopic pregnancy rate per couple (secondary outcome)
No studies reported on this outcome.
Fetal abnormalities per couple (secondary outcome)
No studies reported on this outcome.
Infection rate per couple (secondary outcome)
No studies reported on this outcome.
2. Swim‐up versus wash and centrifugation technique
We included Dodson 1998 and Grigoriou 2005 in the analysis.
Live birth rate per couple
No studies reported on this outcome.
2.1 Clinical pregnancy rate per couple
Considering the quality of evidence, we are uncertain whether there is a difference between CPR per couple for swim‐up versus a wash technique (CPR 22% versus 38% respectively; OR 0.41, 95% CI 0.15 to 1.13; I² = 55%; 2 RCTs, 78 participants; very low‐quality evidence). The results suggest that if the chance of clinical pregnancy after the use of a wash technique is assumed to be 38%, the chance of clinical pregnancy after using the swim‐up technique is between 9% and 41%. See Figure 6.

Forest plot of comparison: 2 Swim‐up versus wash and centrifugation; fresh semen, outcome: 2.1 Clinical pregnancy rate per couple.
Ongoing pregnancy rate per couple (secondary outcome)
No studies reported on this outcome.
2.2 Multiple pregnancy rate per couple (secondary outcome)
There were no available data from Grigoriou 2005. Considering the quality of evidence, we are uncertain whether there was a difference between multiple pregnancy rates between treatment groups (OR 0.49, 95% CI 0.02 to 13.28; heterogeneity not applicable; 1 RCT, 26 participants; very low‐quality evidence). The multiple pregnancy rate per couple was 0% versus 6.3%, respectively (Dodson 1998). One triplet pregnancy was observed after the wash technique.
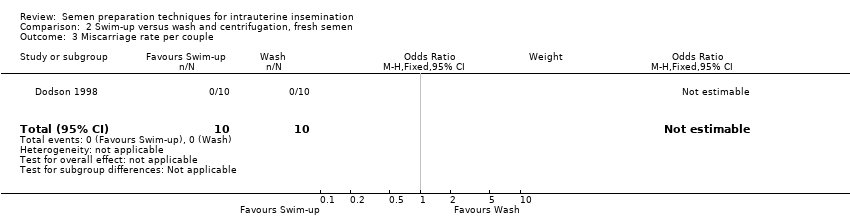
2.3 Miscarriage rate per couple (secondary outcome)
There were no available data from Grigoriou 2005. In Dodson 1998, after both techniques the miscarriage rate per couple was 0%.
Ectopic pregnancy rate per couple (secondary outcome)
No studies reported on this outcome.
Fetal abnormalities per couple (secondary outcome)
No studies reported on this outcome.
Infection rate per couple (secondary outcome)
No studies reported on this outcome.
3. Gradient versus wash and centrifugation technique
Dodson 1998 and Soliman 2005 were included in the analysis.
Live birth rate per couple
No studies reported on this outcome.
3.1 Clinical pregnancy rate per couple
Considering the quality of evidence, we are uncertain whether there was a difference between CPR for gradient technique versus a wash technique (CPR 24% versus 13%, respectively; OR 1.78, 95% CI 0.58 to 5.46; I² = 52%; 2 RCTs, n = 94; very low‐quality evidence). The results suggest that if the chance of clinical pregnancy after the use of a wash technique is assumed to be 13%, the chance of clinical pregnancy after using the gradient technique is between 8% and 46%. See Figure 7.

Forest plot of comparison: 3 Gradient technique versus wash and centrifugation; fresh semen, outcome: 3.1 Clinical pregnancy rate per couple.
Ongoing pregnancy rate per couple (secondary outcome)
No studies reported on this outcome.
3.2 Multiple pregnancy rate per couple (secondary outcome)
There were no available data from Soliman 2005. Considering the quality of evidence, we are uncertain whether there was a difference between multiple pregnancy rates per couple between the treatment groups (OR 0.33, 95% CI 0.01 to 8.83; very low‐quality evidence). The multiple pregnancy rate per couple was 0% versus 6%, respectively. One triplet pregnancy was recorded after the wash technique (Dodson 1998).
3.3 Miscarriage rate per couple (secondary outcome)
There were no available data from Soliman 2005. Considering the quality of evidence, we are uncertain whether there was a difference between miscarriage rates per couple between the treatment groups (OR 6.11, 95% CI 0.27 to 138.45; very low‐quality evidence). The miscarriage rate per couple was 10% (miscarriage rate per pregnancy 30%) versus 0%, respectively (Dodson 1998).
Ectopic pregnancy rate per couple (secondary outcome)
No studies reported on this outcome.
Fetal abnormalities per couple (secondary outcome)
No studies reported on this outcome.
Infection rate per couple (secondary outcome)
No studies reported on this outcome.
Overall there was no clear evidence which semen preparation technique was superior. No studies provided information on laboratory time and costs per preparation technique. Summaries of our findings are provided in the summary of findings Table for the main comparison, summary of findings Table 2, and summary of findings Table 3.
Heterogeneity results of included studies
We examined heterogeneity between the results of the different studies by inspecting the scatter in the data points and the overlap in their confidence intervals, and more formally by checking the results of the Chi² tests. We took an I² measurement greater than 50% as an indicator of substantial statistical heterogeneity. Considering the results of the meta‐analysis, there was a large overlap in confidence intervals. There was, however, a large difference in the direction of effect. Meta‐analysis of the pregnancy results after swim‐up technique versus gradient technique (I² = 71%), and swim‐up versus wash technique (I² = 55%) and wash technique versus gradient technique (I² = 52%) showed indication of substantial heterogeneity. This may partly be explained by heterogeneity in the sperm preparation procedures among the different trials, which are not standardised. Care must be taken in the interpretation of the Chi² test in these meta‐analyses though, since it has low power when studies have small sample sizes and are few in number. We could perform no sensitivity analyses to explore the heterogeneity.
Discussion
Summary of main results
The aim of this review was to compare the effectiveness of three different semen preparation techniques (gradient; swim‐up; wash and centrifugation) on clinical outcomes (live birth rate; clinical pregnancy rate) in subfertile couples undergoing IUI.
The first conclusion that can be drawn from this systematic review is that large, high‐quality randomised controlled trials comparing the effectiveness of a gradient, swim‐up or wash and centrifugation technique, alone or in combination, are lacking. No studies reported on live birth rates. We identified only seven RCTs which compared a gradient technique versus a swim‐up technique or a wash technique for IUI (Carrell 1998; Dodson 1998; Grigoriou 2005; Karamahmutoglu 2014; Posada 2005; Soliman 2005; Xu 2000). We identified one cross‐over RCT, which we excluded from the meta‐analysis but included in the review (Carrell 1998), since we could not extract data prior to crossing over.
In conclusion, we are uncertain whether there is a difference in pregnancy outcomes between the three sperm preparation techniques for subfertile couples undergoing IUI. The quality of evidence was very low. The main limitations were (unclear) risk of bias (unclear reporting), signs of imprecision and inconsistency in results among studies and the lack of power.
Overall completeness and applicability of evidence
The increasing availability of therapeutic choices resulting from advances in subfertility research poses a problem in trying to determine whether these options are equally effective in clinical care. In 2010 the World Health Organization (WHO) published a WHO laboratory manual for the examination and processing of human semen (WHO 2010). The manual describes the choices for sperm preparation, which is dictated by the nature of the semen sample (Canale 1994). For example, the direct swim‐up technique is often used when the semen sample is considered to be largely normal; whereas in cases of severe oligozoospermia, teratospermia or asthenospermia, density gradients are usually preferred because of the greater total number of motile spermatozoa recovered. Wash and centrifugation is not widely used, and is only thought to be suitable for normospermic specimens (WHO 2010). We have not been able to perform subgroup analyses to investigate this research question. The WHO laboratory manual also advises that each laboratory should determine after rigorous pre‐clinical testing the optimal centrifugal force and centrifugation time necessary to increase the chance of recovering the maximum number of spermatozoa (WHO 2010).
We included six studies in the meta‐analysis, of which only one study was less than 10 years old. The relevance of these older studies in current laboratory practice can be questioned. However, in general, laboratory procedures of sperm preparation have not significantly changed in the last two decades. Media used have been more standardised, though. A simple two‐step discontinuous density‐gradient preparation method is most widely applied. A number of commercial products are available for making density gradients suitable for semen processing (WHO 2010). Percoll was previously used in ART; since 1996, however, it has only been used for research purposes due to concerns about its safety. Xu 2000 and Dodson 1998 both used Percoll gradient. Research demonstrated, however, that the new products appear to be as effective as Percoll for the recovery of good, progressively motile sperm (Centola 1998).
The reason for the absence of current studies is unknown; and we could identify none ongoing in trial registers either. There is a wide practice variation of used methods and outcomes in IUI in fertility laboratories (Lemmens 2018). Although there is a lack of evidence for their efficacy, many laboratories seem to prefer density gradient techniques which are easier to use and standardize than the swim‐up technique (WHO 2010). The lack of new studies may also be the result of the ongoing debate about the value of IUI (Lemmens 2017). The British National Institute for Health and Care Excellence (NICE) guideline for infertility treatment (NICE 2013) strongly reduced the indications for IUI with IVF/ICSI as a first line treatment in the majority of cases.
The studies we identified were not sufficient to address the objectives of this review, due to statistical heterogeneity among the studies and methodological limitations.
Quality of the evidence
Only randomised controlled trials were included in this meta‐analysis. The quality of the evidence was very low. The main limitations in the evidence were unclear risk of bias, signs of inconsistency and (very) serious imprecision. Only two of the seven included studies used and described an adequate method of allocation concealment. In addition to the main limitations, there was a lack of blinding in most studies and high risk of performance bias in all studies. None of the studies reported live birth, which is the outcome most relevant to subfertile couples; and data on adverse events were available for only three of the studies.
In addition, the number of studies was low. One study dominated the results (Karamahmutoglu 2014). However, even this study with the largest study population seriously lacked power. Many fertility trials lack power. A prospective power calculation should always be performed, although the calculated sample size in most cases will be prohibitively large. Accruing this number of participants would require several years or a multi‐centre design to complete the trial. In both cases, this would increase clinical heterogeneity (Daya 2001), but might also ensure that studies more closely resemble the heterogeneity of daily practice. Only one of the trials performed an intention‐to‐treat analysis. The performance of this analysis minimizes an exclusion bias. A strategy to minimize this bias is to conduct the randomisation as late as possible in the study design; the dictum of 'select subjects early but randomise late' is particularly relevant in subfertility research (Daya 2001).
Potential biases in the review process
We assume the risk of bias in review design to be minimal; it was predefined and objective. We assume the bias in locating studies to be minimal, since the search was not limited to language or timeframe, and was conducted in multiple literature sources. We minimised the risk of bias in selecting studies by using two independent reviewers throughout the screening and data collection process, which reduces reviewer bias. The quality of the studies was assessed by two independent reviewers according to GRADE criteria.The risk of bias in synthesising studies is also assumed to be low. There was no selective outcome reporting. We published the study protocol in advance to promote transparency.
Agreements and disagreements with other studies or reviews
The results of this review are in agreement with other evidence from studies or reviews. Many studies on the efficacy of sperm preparation techniques focus on sperm recovery rates. The direct swim‐up technique generally recovers a lower number of motile sperm compared to density gradient techniques (Butt 2016; Ng 1992; WHO 2010). This outcome is not relevant to subfertile couples, however, and may not reflect clinical outcome. Firstly, the sperm preparation technique aims not only to recover a high number of morphologically normal and motile sperm, but also to eliminate any factors detrimental to fertilization and prostaglandins, and to perform sperm capacitation. Dodson 1998 and Butt 2016 showed that potential critical differences in sperm isolation and recovery for IUI yield no benefit in cycle fecundity. This may be due to all methods surpassing a low threshold number of motile sperm for conception, or all methods recover a subset of sperm capable of achieving fertilization with no benefit of additional sperm (Dodson 1998).
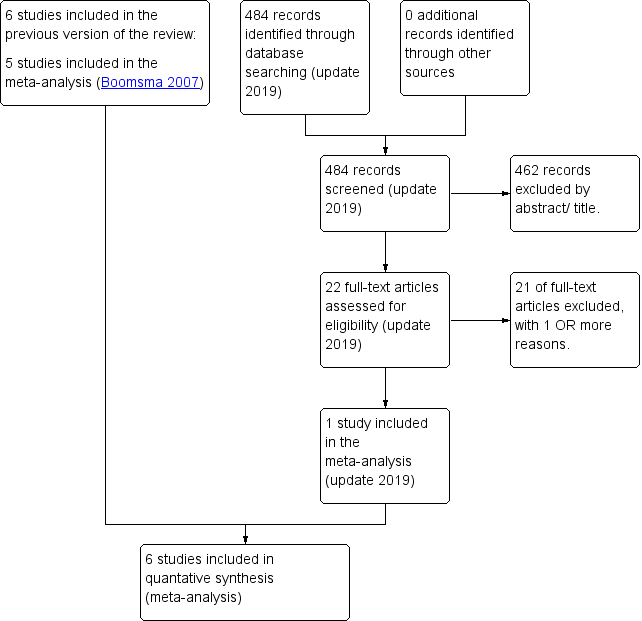
PRISMA study flow diagram (updated search 2019)

Risk domains: review authors' judgements about each potential risk of bias item for each included study.

Risk of bias: review authors' judgements about each risk domain presented as percentages across all included studies.
Forest plot of comparison: 1 Swim‐up versus gradient technique; fresh semen, outcome: 1.1 Clinical pregnancy rate per couple.

Forest plot of comparison: 1 Swim‐up versus gradient technique; fresh semen, outcome: 1.4 Miscarriage rate per couple.

Forest plot of comparison: 2 Swim‐up versus wash and centrifugation; fresh semen, outcome: 2.1 Clinical pregnancy rate per couple.

Forest plot of comparison: 3 Gradient technique versus wash and centrifugation; fresh semen, outcome: 3.1 Clinical pregnancy rate per couple.

Comparison 1 Swim‐up versus gradient technique, fresh semen, Outcome 1 Clinical pregnancy rate per couple.

Comparison 1 Swim‐up versus gradient technique, fresh semen, Outcome 2 Ongoing pregnancy rate.

Comparison 1 Swim‐up versus gradient technique, fresh semen, Outcome 3 Multiple pregnancy rate per couple.

Comparison 1 Swim‐up versus gradient technique, fresh semen, Outcome 4 Miscarriage rate per couple.

Comparison 2 Swim‐up versus wash and centrifugation, fresh semen, Outcome 1 Clinical pregnancy rate per couple.

Comparison 2 Swim‐up versus wash and centrifugation, fresh semen, Outcome 2 Multiple pregnancy rate per couple.
Comparison 2 Swim‐up versus wash and centrifugation, fresh semen, Outcome 3 Miscarriage rate per couple.

Comparison 3 Gradient technique versus wash and centrifugation, fresh semen, Outcome 1 Clinical pregnancy rate per couple.

Comparison 3 Gradient technique versus wash and centrifugation, fresh semen, Outcome 2 Multiple pregnancy rate per couple.
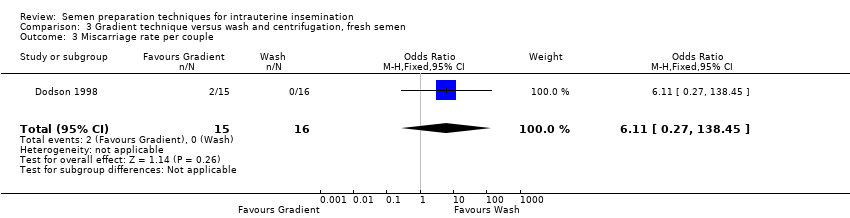
Comparison 3 Gradient technique versus wash and centrifugation, fresh semen, Outcome 3 Miscarriage rate per couple.
| Swim‐up technique compared to gradient technique for undergoing intrauterine insemination | ||||||
| Patient or population: patients undergoing intrauterine insemination (fresh semen) | ||||||
| Outcomes | Illustrative comparative risks* (95% CI) | Relative effect | No. of participants | Quality of the evidence | Comments | |
| Assumed risk | Corresponding risk | |||||
| Gradient technique | Swim‐up technique | |||||
| Live birth rate per couple | See comment | See comment | No studies reported on this outcome. | |||
| Clinical pregnancy rate per couple | 244 per 1000 | 212 per 1000 | OR 0.83 | 370 | ⊕⊝⊝⊝ | |
| Ongoing pregnancy rate per couple | 234 per 1000 | 107 per 1000 (55 to 201) | OR 0.39 (0.19 to 0.82) | 223 (1 study) | ⊕⊝⊝⊝ | |
| Multiple pregnancy rate per couple | See comment | See comment | Not estimable | 25 | ⊕⊝⊝⊝ | There were no events recorded in either group |
| Miscarriage rate per couple | 38 per 1000 | 33 per 1000 | OR 0.85 | 330 | ⊕⊝⊝⊝ | |
| *The basis for the assumed risk (e.g. the median control group risk across studies) is provided in footnotes. The corresponding risk (and its 95% CI) is based on the assumed risk in the comparison group and the relative effect of the intervention (and its 95% CI). | ||||||
| GRADE Working Group grades of evidence | ||||||
| a Risk of bias, downgrade 1 level: unclear risk of bias, no adequate explanation for randomisation or allocation concealment or attrition. High risk of performance bias. | ||||||
| Swim‐up technique compared to wash and centrifugation for undergoing intrauterine insemination | ||||||
| Patient or population: patients undergoing intrauterine insemination (fresh semen) | ||||||
| Outcomes | Illustrative comparative risks* (95% CI) | Relative effect | No. of participants | Quality of the evidence | Comments | |
| Assumed risk | Corresponding risk | |||||
| Wash and centrifugation | Swim‐up technique | |||||
| Live birth rate per couple | See comment | See comment | No studies reported on this outcome. | |||
| Clinical pregnancy rate per couple | 381 per 1000 | 201 per 1000 | OR 0.41 | 78 | ⊕⊝⊝⊝ | |
| Ongoing pregnancy rate per couple | See comment | See comment | No studies reported on this outcome. | |||
| Multiple pregnancy rate per couple | 63 per 1000 | 32 per 1000 (1 to 470) | OR 0.49 | 26 | ⊕⊝⊝⊝ | |
| Miscarriage rate per couple | See comment | See comment | Not estimable | 20 | ⊕⊝⊝⊝ | There were no events in either group |
| *The basis for the assumed risk (e.g. the median control group risk across studies) is provided in footnotes. The corresponding risk (and its 95% CI) is based on the assumed risk in the comparison group and the relative effect of the intervention (and its 95% CI). | ||||||
| GRADE Working Group grades of evidence | ||||||
| a Risk of bias, downgrade 1 level: 1 of the 2 trials did not conceal allocation and there was no blinding. High risk of performance bias. | ||||||
| Gradient technique compared to Wash and centrifugation for undergoing intrauterine insemination | ||||||
| Patient or population: patients with undergoing intrauterine insemination (fresh semen) | ||||||
| Outcomes | Illustrative comparative risks* (95% CI) | Relative effect | No. of participants | Quality of the evidence | Comments | |
| Assumed risk | Corresponding risk | |||||
| Wash and centrifugation | Gradient technique | |||||
| Live birth rate per couple | See comment | See comment | No studies reported on this outcome. | |||
| Clinical pregnancy rate per couple | 133 per 1000 | 215 per 1000 | OR 1.78 | 94 | ⊕⊝⊝⊝ | |
| Ongoing pregnancy rate per couple | See comment | See comment | No studies reported on this outcome. | |||
| Multiple pregnancy rate per couple | 63 per 1000 | 22 per 1000 | OR 0.33 | 31 | ⊕⊝⊝⊝ | |
| Miscarriage rate per couple | no events (0/16) | 2/15 see comment | OR 6.11 | 31 | ⊕⊝⊝⊝ | Corresponding risk not estimable since there were no events in "wash and centrifugation" (0/16). |
| *The basis for the assumed risk (e.g. the median control group risk across studies) is provided in footnotes. The corresponding risk (and its 95% CI) is based on the assumed risk in the comparison group and the relative effect of the intervention (and its 95% CI). | ||||||
| GRADE Working Group grades of evidence | ||||||
| a Risk of bias, downgrade 1 level: 1 of the 2 trials did not provide adequate details on randomisation or allocation concealment and did not use blinding, abstract. High risk of performance bias. | ||||||
| Study ID | Allocation Score | Methods | Participants | Interventions | Outcomes |
| B | Stated random, but no details. Design: cross‐over, multi‐centre. Concealment of allocation, blinding, number of dropouts or cancelled cycles, intention‐to‐treat analysis, power calculation: all not stated. | 363 women: 558 cycles in the 3 methods of interest. Age of women, duration subfertility: not stated. Cause: unexplained/(fe)male related disorders. Exclusion criteria: oligoasthenozoospermic semen samples after preparation. Inclusion criteria: not stated. | 3 preparation techniques (out of 5 described). 1) Sperm wash: 8 to 10 ml. medium (Ham's F‐10), 10 min. 400 × g centrifugation. Supernatant decanted, pellet resuspended. 2) Swim‐up: 2× washed, resuspended. Medium layered on top. Incubation 1h. Top removed. 3) Gradient: 1x wash + resuspension. Percoll, (35%/ 90%).15 min 400 × g centrifugation. 90% layer washed. Single IUI. 2.5 ± 0.3 inseminations per women. 124 women: 50 to 200 mg. CC day 5 to 9 or no COH. 239 women: gonadotropin/hCG. | Clinical pregnancy rate (CPR)/cycle, Miscarriage rate (MR)/pregnancy, Live birth rate (LBR)/ cycle |
| Study ID | Sample Size | Gradient technique | Swim‐up | Wash and centrifuge | Conclusion | Statistical analysis |
| 558 cycles | CPR/cycle: 16% (33/204), LBR/ cycle: 13% (26/204), MR/pregnancy: 21% (7/33) | CPR/cycle: 15% (29/197), LBR/cycle: 13% (26/197), MR/pregnancy: 10 % (3/29) | CPR/cycle: 9% (14/157), LBR/cycle: 7% (11/157), MR/pregnancy: 21% (3/14) | CPR/cycle wash‐method significantly lower than Swim‐up/Percoll (P < 0.05), LBR/cycle wash‐method significantly lower than Swim‐up/Percoll (P < 0.05). No other significant differences. | CPR/cycle and MR/pregnancy: ×2 analysis and Fisher's exact test. Statistical significance P < 0.05. |
| Outcome or subgroup title | No. of studies | No. of participants | Statistical method | Effect size |
| 1 Clinical pregnancy rate per couple Show forest plot | 4 | 370 | Odds Ratio (M‐H, Fixed, 95% CI) | 0.83 [0.51, 1.35] |
| 2 Ongoing pregnancy rate Show forest plot | 1 | 223 | Odds Ratio (M‐H, Fixed, 95% CI) | 0.39 [0.19, 0.82] |
| 3 Multiple pregnancy rate per couple Show forest plot | 1 | 25 | Odds Ratio (M‐H, Fixed, 95% CI) | 0.0 [0.0, 0.0] |
| 4 Miscarriage rate per couple Show forest plot | 3 | 330 | Odds Ratio (M‐H, Fixed, 95% CI) | 0.85 [0.28, 2.59] |
| Outcome or subgroup title | No. of studies | No. of participants | Statistical method | Effect size |
| 1 Clinical pregnancy rate per couple Show forest plot | 2 | 78 | Odds Ratio (M‐H, Fixed, 95% CI) | 0.41 [0.15, 1.13] |
| 2 Multiple pregnancy rate per couple Show forest plot | 1 | 26 | Odds Ratio (M‐H, Fixed, 95% CI) | 0.49 [0.02, 13.28] |
| 3 Miscarriage rate per couple Show forest plot | 1 | 20 | Odds Ratio (M‐H, Fixed, 95% CI) | 0.0 [0.0, 0.0] |
| Outcome or subgroup title | No. of studies | No. of participants | Statistical method | Effect size |
| 1 Clinical pregnancy rate per couple Show forest plot | 2 | 94 | Odds Ratio (M‐H, Fixed, 95% CI) | 1.78 [0.58, 5.46] |
| 2 Multiple pregnancy rate per couple Show forest plot | 1 | 31 | Odds Ratio (M‐H, Fixed, 95% CI) | 0.33 [0.01, 8.83] |
| 3 Miscarriage rate per couple Show forest plot | 1 | 31 | Odds Ratio (M‐H, Fixed, 95% CI) | 6.11 [0.27, 138.45] |