| 1 Instrumental delivery Show forest plot | 5 | 462 | Risk Ratio (M‐H, Fixed, 95% CI) | 0.84 [0.61, 1.15] |
|
| 2 Instrumental delivery by subgroup analysis Show forest plot | 5 | | Risk Ratio (M‐H, Fixed, 95% CI) | Subtotals only |
|
| 2.1 Continuous infusion | 4 | 388 | Risk Ratio (M‐H, Fixed, 95% CI) | 0.81 [0.58, 1.12] |
| 2.2 Intermittant bolus | 1 | 74 | Risk Ratio (M‐H, Fixed, 95% CI) | 1.2 [0.40, 3.59] |
| 2.3 LA alone | 4 | 399 | Risk Ratio (M‐H, Fixed, 95% CI) | 0.85 [0.62, 1.18] |
| 2.4 LA + opioid | 1 | 63 | Risk Ratio (M‐H, Fixed, 95% CI) | 0.71 [0.24, 2.09] |
| 3 Caesarean section Show forest plot | 4 | 282 | Risk Ratio (M‐H, Fixed, 95% CI) | 0.98 [0.43, 2.25] |
|
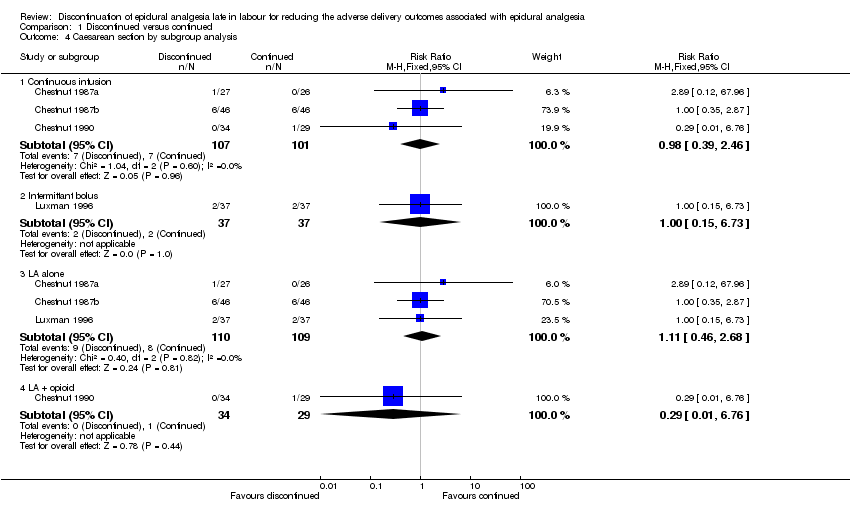
| 4 Caesarean section by subgroup analysis Show forest plot | 4 | | Risk Ratio (M‐H, Fixed, 95% CI) | Subtotals only |
|
| 4.1 Continuous infusion | 3 | 208 | Risk Ratio (M‐H, Fixed, 95% CI) | 0.98 [0.39, 2.46] |
| 4.2 Intermittant bolus | 1 | 74 | Risk Ratio (M‐H, Fixed, 95% CI) | 1.0 [0.15, 6.73] |
| 4.3 LA alone | 3 | 219 | Risk Ratio (M‐H, Fixed, 95% CI) | 1.11 [0.46, 2.68] |
| 4.4 LA + opioid | 1 | 63 | Risk Ratio (M‐H, Fixed, 95% CI) | 0.29 [0.01, 6.76] |
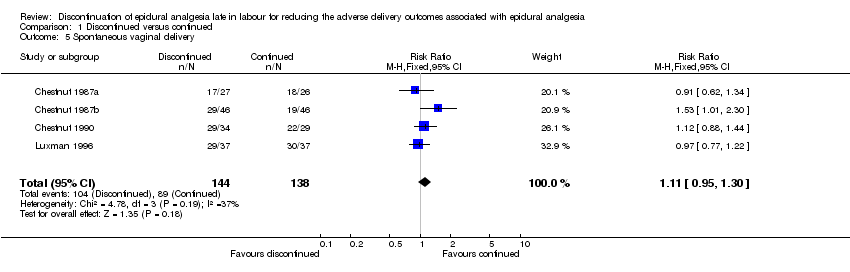
| 5 Spontaneous vaginal delivery Show forest plot | 4 | 282 | Risk Ratio (M‐H, Fixed, 95% CI) | 1.11 [0.95, 1.30] |
|
| 6 Spontaneous vaginal delivery by subgroup analysis Show forest plot | 4 | | Risk Ratio (M‐H, Fixed, 95% CI) | Subtotals only |
|
| 6.1 Continuous infusion | 3 | 208 | Risk Ratio (M‐H, Fixed, 95% CI) | 1.18 [0.97, 1.45] |
| 6.2 intermittant bolus | 1 | 74 | Risk Ratio (M‐H, Fixed, 95% CI) | 0.97 [0.77, 1.22] |
| 6.3 LA alone | 3 | 219 | Risk Ratio (M‐H, Fixed, 95% CI) | 1.11 [0.92, 1.34] |
| 6.4 LA + opioid | 1 | 63 | Risk Ratio (M‐H, Fixed, 95% CI) | 1.12 [0.88, 1.44] |
| 7 Duration of 2nd stage Show forest plot | 3 | 203 | Mean Difference (IV, Fixed, 95% CI) | ‐5.80 [‐12.91, 1.30] |
|
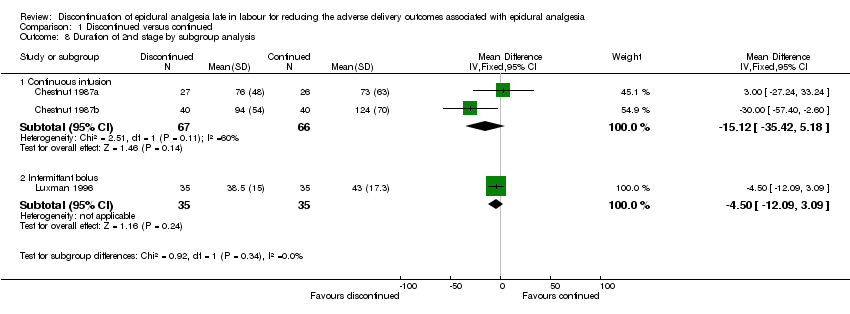
| 8 Duration of 2nd stage by subgroup analysis Show forest plot | 3 | | Mean Difference (IV, Fixed, 95% CI) | Subtotals only |
|
| 8.1 Continuous infusion | 2 | 133 | Mean Difference (IV, Fixed, 95% CI) | ‐15.12 [‐35.42, 5.18] |
| 8.2 Intermittant bolus | 1 | 70 | Mean Difference (IV, Fixed, 95% CI) | ‐4.5 [‐12.09, 3.09] |
| 9 Fetal malposition Show forest plot | 4 | 388 | Risk Ratio (M‐H, Fixed, 95% CI) | 1.36 [0.73, 2.56] |
|
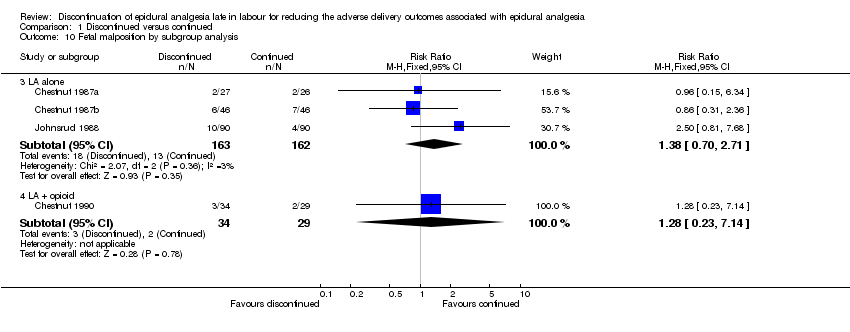
| 10 Fetal malposition by subgroup analysis Show forest plot | 4 | | Risk Ratio (M‐H, Fixed, 95% CI) | Subtotals only |
|
| 10.3 LA alone | 3 | 325 | Risk Ratio (M‐H, Fixed, 95% CI) | 1.38 [0.70, 2.71] |
| 10.4 LA + opioid | 1 | 63 | Risk Ratio (M‐H, Fixed, 95% CI) | 1.28 [0.23, 7.14] |
| 11 Inadequate pain relief Show forest plot | 4 | 384 | Risk Ratio (M‐H, Fixed, 95% CI) | 3.68 [1.99, 6.80] |
|
| 12 Inadequate pain relief by subgroup analysis Show forest plot | 4 | | Risk Ratio (M‐H, Fixed, 95% CI) | Subtotals only |
|
| 12.3 LA alone | 3 | 321 | Risk Ratio (M‐H, Fixed, 95% CI) | 3.44 [1.81, 6.53] |
| 12.4 LA + opioid | 1 | 63 | Risk Ratio (M‐H, Fixed, 95% CI) | 5.97 [0.78, 45.73] |
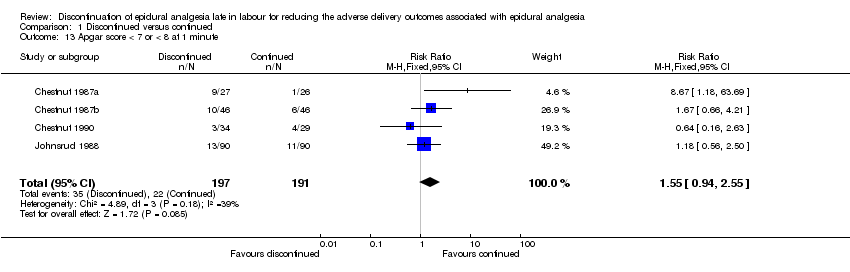
| 13 Apgar score < 7 or < 8 at 1 minute Show forest plot | 4 | 388 | Risk Ratio (M‐H, Fixed, 95% CI) | 1.55 [0.94, 2.55] |
|
| 14 Apgar score < 7 or < 8 at 1 minute by subgroup analysis Show forest plot | 4 | | Risk Ratio (M‐H, Fixed, 95% CI) | Subtotals only |
|
| 14.3 LA alone | 3 | 325 | Risk Ratio (M‐H, Fixed, 95% CI) | 1.77 [1.03, 3.03] |
| 14.4 LA + opioid | 1 | 63 | Risk Ratio (M‐H, Fixed, 95% CI) | 0.64 [0.16, 2.63] |
| 15 Apgar score < 7 at 5 minutes Show forest plot | 3 | 208 | Risk Ratio (M‐H, Fixed, 95% CI) | 3.92 [0.45, 34.21] |
|
| 16 Umbilical arterial pH Show forest plot | 3 | 208 | Mean Difference (IV, Fixed, 95% CI) | ‐0.01 [‐0.03, 0.01] |
|
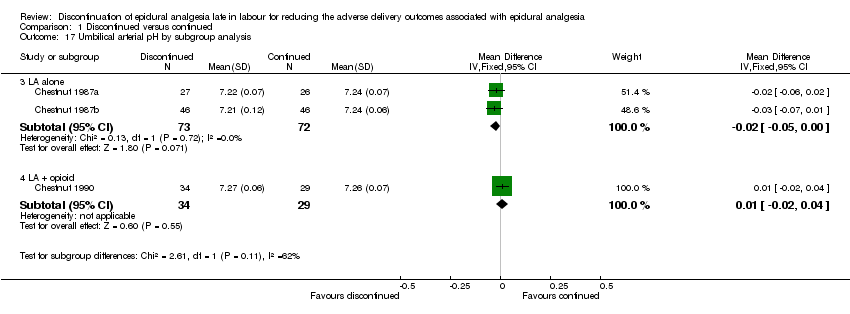
| 17 Umbilical arterial pH by subgroup analysis Show forest plot | 3 | | Mean Difference (IV, Fixed, 95% CI) | Subtotals only |
|
| 17.3 LA alone | 2 | 145 | Mean Difference (IV, Fixed, 95% CI) | ‐0.02 [‐0.05, 0.00] |
| 17.4 LA + opioid | 1 | 63 | Mean Difference (IV, Fixed, 95% CI) | 0.01 [‐0.02, 0.04] |