Scolaris Content Display Scolaris Content Display

Comparison 1 Overall Effect of Taxanes, Outcome 1 Overall Survival ‐ all studies.
Figuras y tablas -
Analysis 1.1

Comparison 1 Overall Effect of Taxanes, Outcome 1 Overall Survival ‐ all studies.

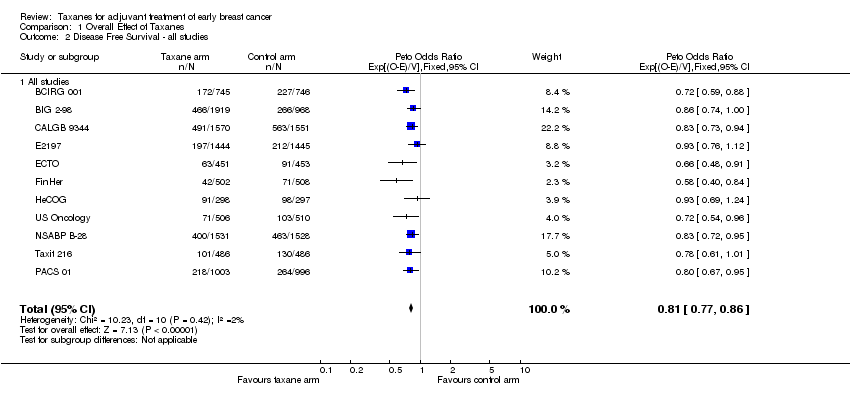
Comparison 1 Overall Effect of Taxanes, Outcome 2 Disease Free Survival ‐ all studies.
Figuras y tablas -
Analysis 1.2

Comparison 1 Overall Effect of Taxanes, Outcome 2 Disease Free Survival ‐ all studies.

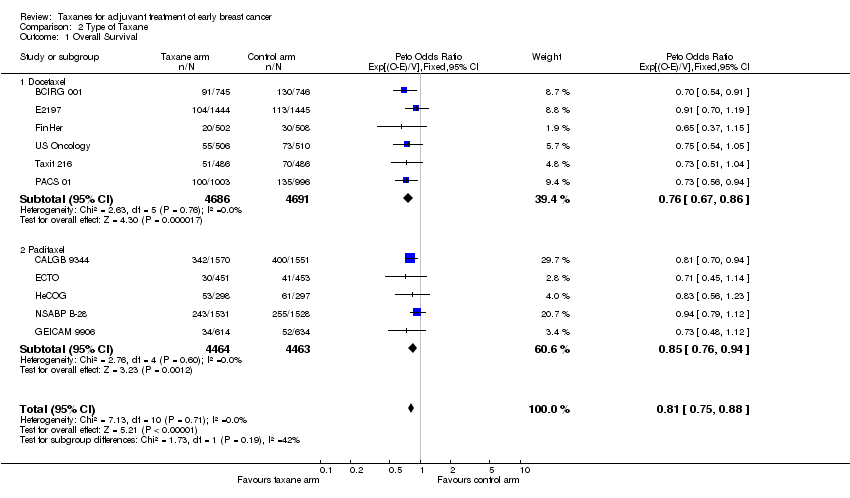
Comparison 2 Type of Taxane, Outcome 1 Overall Survival.
Figuras y tablas -
Analysis 2.1

Comparison 2 Type of Taxane, Outcome 1 Overall Survival.

Comparison 2 Type of Taxane, Outcome 2 Disease Free Survival.
Figuras y tablas -
Analysis 2.2

Comparison 2 Type of Taxane, Outcome 2 Disease Free Survival.

Comparison 3 Sequential or Concurrent Anthracycline/Taxane, Outcome 1 Overall Survival.
Figuras y tablas -
Analysis 3.1

Comparison 3 Sequential or Concurrent Anthracycline/Taxane, Outcome 1 Overall Survival.

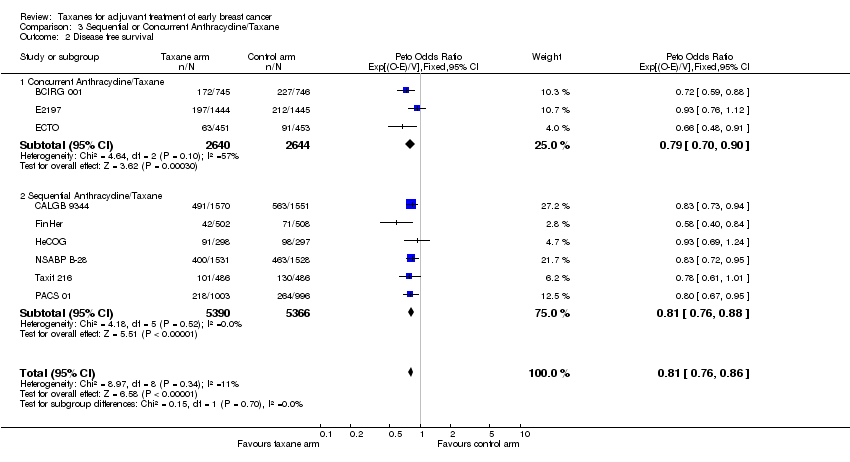
Comparison 3 Sequential or Concurrent Anthracycline/Taxane, Outcome 2 Disease free survival.
Figuras y tablas -
Analysis 3.2

Comparison 3 Sequential or Concurrent Anthracycline/Taxane, Outcome 2 Disease free survival.

Comparison 4 Addition or Substitution of Taxane, Outcome 1 Overall Survival.
Figuras y tablas -
Analysis 4.1

Comparison 4 Addition or Substitution of Taxane, Outcome 1 Overall Survival.

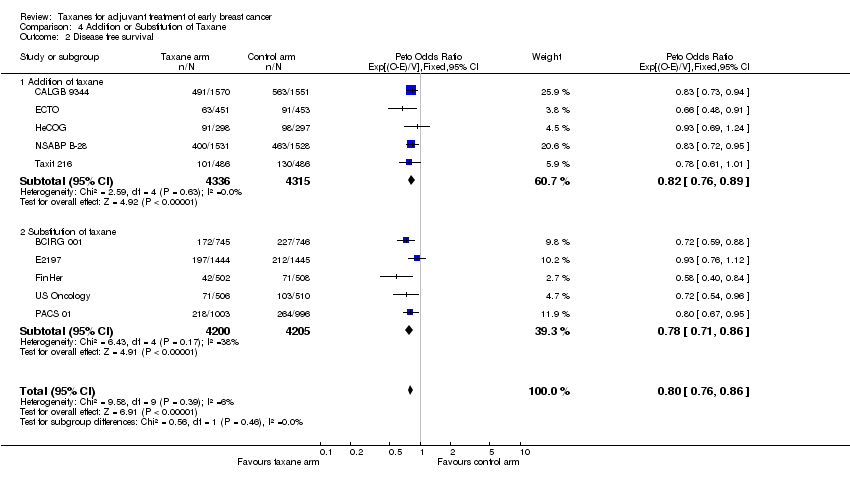
Comparison 4 Addition or Substitution of Taxane, Outcome 2 Disease free survival.
Figuras y tablas -
Analysis 4.2

Comparison 4 Addition or Substitution of Taxane, Outcome 2 Disease free survival.

Comparison 5 Lymph node status, Outcome 1 Overall Survival.
Figuras y tablas -
Analysis 5.1

Comparison 5 Lymph node status, Outcome 1 Overall Survival.

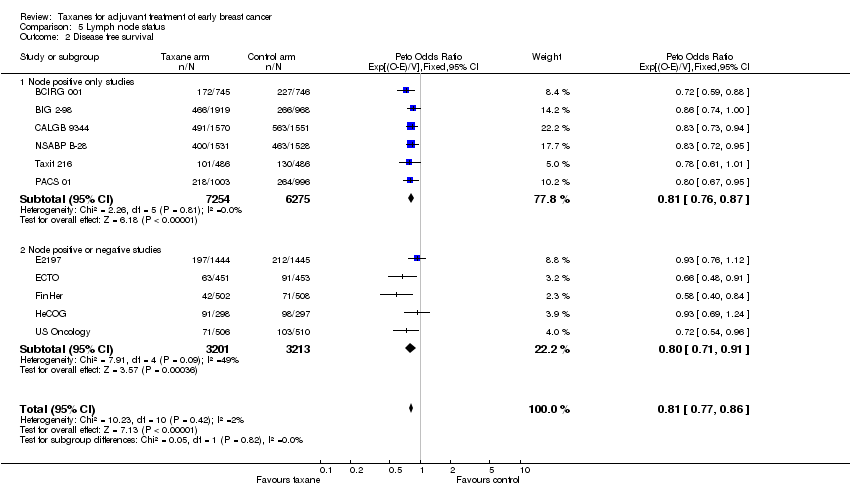
Comparison 5 Lymph node status, Outcome 2 Disease free survival.
Figuras y tablas -
Analysis 5.2

Comparison 5 Lymph node status, Outcome 2 Disease free survival.

Comparison 6 Duration of chemotherapy, Outcome 1 Overall Survival.
Figuras y tablas -
Analysis 6.1

Comparison 6 Duration of chemotherapy, Outcome 1 Overall Survival.

Comparison 6 Duration of chemotherapy, Outcome 2 Disease free survival.
Figuras y tablas -
Analysis 6.2

Comparison 6 Duration of chemotherapy, Outcome 2 Disease free survival.

Comparison 7 Publication status, Outcome 1 Overall survival.
Figuras y tablas -
Analysis 7.1

Comparison 7 Publication status, Outcome 1 Overall survival.

Comparison 7 Publication status, Outcome 2 Disease free survival.
Figuras y tablas -
Analysis 7.2

Comparison 7 Publication status, Outcome 2 Disease free survival.

Comparison 8 Number of Cycles of Taxane‐containig Chemotherapy, Outcome 1 Overall Survival.
Figuras y tablas -
Analysis 8.1

Comparison 8 Number of Cycles of Taxane‐containig Chemotherapy, Outcome 1 Overall Survival.

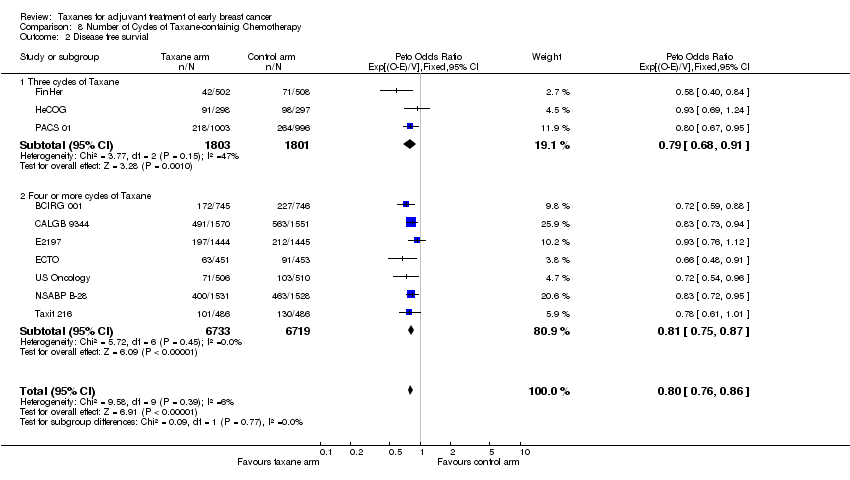
Comparison 8 Number of Cycles of Taxane‐containig Chemotherapy, Outcome 2 Disease free survial.
Figuras y tablas -
Analysis 8.2

Comparison 8 Number of Cycles of Taxane‐containig Chemotherapy, Outcome 2 Disease free survial.

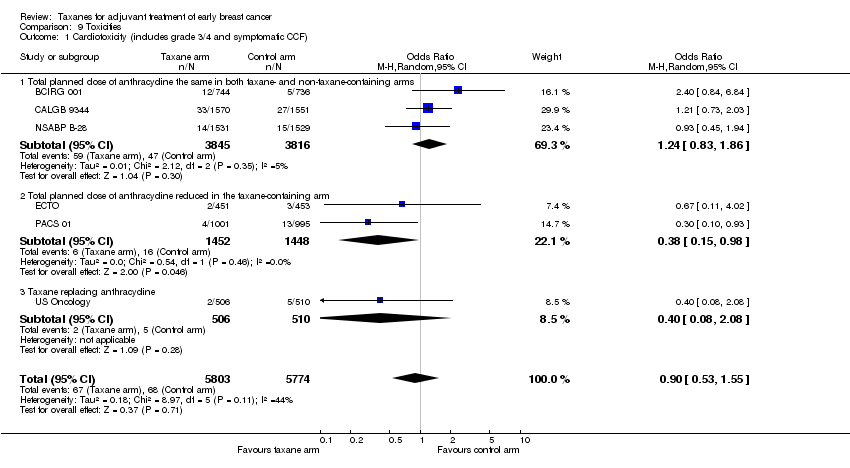
Comparison 9 Toxicities, Outcome 1 Cardiotoxicity (includes grade 3/4 and symptomatic CCF).
Figuras y tablas -
Analysis 9.1

Comparison 9 Toxicities, Outcome 1 Cardiotoxicity (includes grade 3/4 and symptomatic CCF).

Comparison 9 Toxicities, Outcome 2 Febrile neutropaenia.
Figuras y tablas -
Analysis 9.2

Comparison 9 Toxicities, Outcome 2 Febrile neutropaenia.

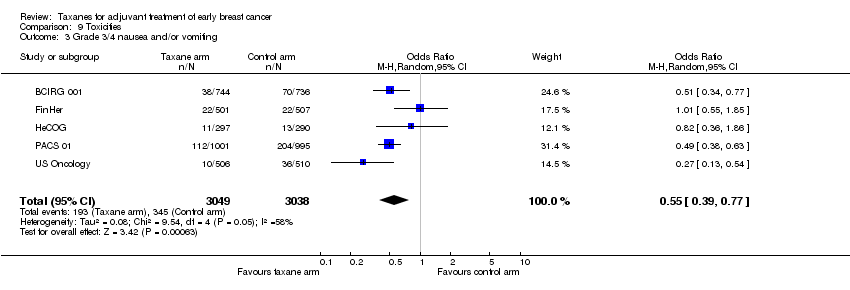
Comparison 9 Toxicities, Outcome 3 Grade 3/4 nausea and/or vomiting.
Figuras y tablas -
Analysis 9.3

Comparison 9 Toxicities, Outcome 3 Grade 3/4 nausea and/or vomiting.

Comparison 9 Toxicities, Outcome 4 Secondary leukaemia/myelodysplasia.
Figuras y tablas -
Analysis 9.4

Comparison 9 Toxicities, Outcome 4 Secondary leukaemia/myelodysplasia.

Comparison 9 Toxicities, Outcome 5 Grade 3/4 Fatigue.
Figuras y tablas -
Analysis 9.5

Comparison 9 Toxicities, Outcome 5 Grade 3/4 Fatigue.

Comparison 9 Toxicities, Outcome 6 Grade 3/4 Stomatitis.
Figuras y tablas -
Analysis 9.6

Comparison 9 Toxicities, Outcome 6 Grade 3/4 Stomatitis.

Comparison 9 Toxicities, Outcome 7 Treatment related deaths.
Figuras y tablas -
Analysis 9.7

Comparison 9 Toxicities, Outcome 7 Treatment related deaths.

Taxane‐containing chemotherapy compared to any chemotherapy without taxanes for early breast cancer (operable, stages I to IIIA)

Patient or population: patients with early breast cancer (operable, stages I to IIIA)

Settings: outpatient

Intervention: any chemotherapy including a taxane1

Comparison: any chemotherapy without taxanes

Outcomes

Illustrative comparative risks* (95% CI)

Relative effect
(95% CI)

No of Participants
(studies)

Quality of the evidence
(GRADE)

Comments

Assumed risk

Corresponding risk

any chemotherapy without taxanes

any chemotherapy including a taxane

Mortality

(follow‐up: 5 year survival)

Low risk population

HR 0.81
(0.75 to 0.88)

18304
(11)

⊕⊕⊕⊕
high

Analysis showed equivalent efficacy across subgroups including treatment duration, scheduling, doses, specific taxane, node positive and negative groups.

60 per 1000

49 per 1000
(45 to 53)

High risk population

260 per 1000

216 per 1000
(202 to 233)

Risk of recurrence

(follow‐up: 5 year survival)

Low risk population

HR 0.81
(0.77 to 0.86

19943
(11)

⊕⊕⊕⊕
high

As above.

140 per 1000

115 per 1000
(110 to 122)

High risk population

360 per 1000

303 per 1000
(291 to 319)

Quality of life2
(follow‐up: 24 to 62 months)

See comment

See comment

Not estimable2

See comment

2 studies no significant differences reported

Cardiotoxicity
(follow‐up: 43 to 69 months)

12 per 1000

11 per 1000
(6 to 18)

RR 0.9
(0.53 to 1.54)3

11577
(6)

⊕⊕⊕⊝
moderate3

Risk of cardiotoxicity reduced with lower planned dose of anthracycline.

Febrile neutropaenia
(follow‐up: 36‐62 months)

56 per 1000

130 per 1000
(62 to 251)

RR 2.32
(1.1 to 4.49)

10224
(7)

⊕⊕⊕⊝
moderate4

Nausea and/or vomiting
(follow‐up: 36 to 62 months)

114 per 1000

66 per 1000
(48 to 90)

RR 0.58
(0.42 to 0.79)

6087
(5)

⊕⊕⊕⊕
high

*The basis for the assumed risk (e.g. the median control group risk across studies) is provided in footnotes. The corresponding risk (and its 95% confidence interval) is based on the assumed risk in the comparison group and the relative effect of the intervention (and its 95% CI).

CI: Confidence interval; RR: Risk Ratio; HR: Hazard Ratio

GRADE Working Group grades of evidence
High quality: Further research is very unlikely to change our confidence in the estimate of effect.
Moderate quality: Further research is likely to have an important impact on our confidence in the estimate of effect and may change the estimate.
Low quality: Further research is very likely to have an important impact on our confidence in the estimate of effect and is likely to change the estimate.
Very low quality: We are very uncertain about the estimate.

1 Taxanes are highly active chemotherapy agent in metastic breast cancer. Their incorporation into adjuvant regimens for early breast cancer has increased. Two taxanes, paclitaxel and docetaxel, were included in these studies. In these studies, taxanes were compared to no taxanes in the same or different regimens, and compared to other drugs in the same regimen. Chemotherapy regimens were provided after surgery and in some studies endocrine therapy or radiotherapy were given.

2 Different instruments used to measure QOL and not fully reported in full publication.

3 The confidence interval crosses no difference and does not rule out a small increase

4 Significant heterogeneity across studies

Figuras y tablas -
Table 1. Grouping of toxicity outcomes and description of individual study definitions

TRIAL

Cardiotoxicity

Febrile Neutropenia

Nausea and Vomiting

Fatigue

Stomatitis

BCIRG 001

Overall congestive heart failure

Reported as "febrile neutropenia" : Protocol definition ‐ Fever of grade 2 or more concomitant with grade 4 neutropaenia requiring IV antibiotics, hospitalisation or both

Grade 3/4 or severe nausea : NCI CTC (version 2)

Grade 3/4 asthenia : NCI CTC (version 2)

Grade 3/4 stomatitis : NCI CTC (version 2)

BIG 2‐98

CALGB 9344

Congestive heart failure during treatment or post‐treatment follow‐up

E2197

Reported as "febrile neutropenia" : toxicity criteria not specified

ECTO

Symptomatic cardiac failure

FINHER

Reported as "neutropenic fever" : NCI CTC (version 2)

Grade 3/4 vomiting : NCI CTC (version 2)

Grade 3/4 fatigue : NCI CTC (version 2)

Grade 3/4 stomatitis : NCI CTC (version 2)

GEICAM 9906

Reported as "febrile neutropenia" : toxicity criteria not specified

Grade 3 mucositis : toxicity criteria not specified

HeCOG

Reported as "febrile neutropenia" : WHO toxicity criteria

Grade 3/4 nausea and/or vomiting : WHO toxicity criteria

Grade 3/4 fatigue : WHO toxicity criteria

NSABP B‐28

Grade 3 or higher cardiac dysfunction

PACS 01

Any serious adverse cardiac event

Reported as "febrile neutropenia" : WHO toxicity criteria

Grade 3/4 nausea and/or vomiting : WHO toxicity criteria

Grade 3/4 stomatitis : WHO toxicity criteria

Taxit 216

US Oncology

Death due to cardiac event

Reported as "fever and neutropenia" : NCI CTC (version 1)

Grade 3/4 nausea : NCI CTC (version 1)

Grade 3/4 asthenia : NCI CTC (version 1)

Grade 3/4 stomatitis : NCI CTC (version 1)

Figuras y tablas -
Table 1. Grouping of toxicity outcomes and description of individual study definitions
Table 2. Combined toxicities (assessable or randomised patients)

Toxicity

Number of trials

Taxane events (pts)

Control events (pts)

OR (95% CI)

CARDIOTOXICITY ‐ Total planned dose of anthracycline the same in both taxane‐ and non‐taxane‐containing arms

3 (a, b, c)

59/3845

47/3816

1.25 (0.85‐1.84)

CARDIOTOXICITY ‐ Total planned dose of anthracycline reduced in the taxane‐containing arm

2 (d, e)

6/1452

16/1448

0.37 (0.14‐0.95)

CARDIOTOXICITY ‐ Taxane replacing anthracycline

1 (f)

2/506

5/510

0.40 (0.08‐2.08)

CARDIOTOXICITY ‐ all studies

6 (a, b, c, d, e, f)

67/5803

68/5774

0.98 (0.70‐1.37)

FEBRILE NEUTROPENIA ‐ Sequential anthracycline and taxane treatment

4(e, g, h, i)

269/2413

167/2426

1.69 (1.38‐2.06)

FEBRILE NEUTROPENIA ‐ Concurrent anthracycline and taxane treatment

2 (a, j)

458/2188

105/2181

5.19 (4.16‐6.47)

FEBRILE NEUTROPENIA ‐ Taxane replacing anthracycline

1 (f)

25/506

13/510

1.99 (1.00‐3.93)

FEBRILE NEUTROPENIA ‐ all studies

7 (a, e, f, g, h, i)

752/5107

285/5117

2.90 (2.52‐3.34)

GRADE 3 OR 4 NAUSEA and/or VOMITING

5 (a, e, f, g, i)

193/3049

345/3038

0.52 (0.43‐0.62)

SECONDARY LEUKAEMIA/MYELODYSPLASIA

7 (a, b, c, e, f, i, j)

25/7093

23/7056

1.08 (0.62‐1.89)

GRADE 3 OR 4 FATIGUE

4 (a, f, g, i)

140/2048

80/2043

1.81 (1.37‐2.41)

GRADE 3 OR 4 STOMATITIS

5 (a, e, f, g, h)

143/3366

99/3382

1.47 (1.13‐2.41)

a

BCIRG 001

b

CALGB 9344

c

NSABP B‐28

d

ECTO

e

PACS 01

f

US Oncology

g

FinHer

h

GEICAM 9906

i

HeCOG

j

E2197

Figuras y tablas -
Table 2. Combined toxicities (assessable or randomised patients)
Table 3. Quality of life

Trial ID

Instruments used

Summary of findings

HeCOG

Patients completed EORTC QLQ‐C30 at baseline and on completion of chemotherapy

No differences were found between the two treatment arms either at the beginning or at the end of chemotherapy. Significant increase in nausea and vomiting for both groups, social functioning significantly decreased in the taxane‐containing arm while emotional functioning and pain significantly improved in the control arm.

BCIRG 001

Patients completed EORTC QLQ‐C30 and the breast‐cancer‐specific QLQ‐BR23 at baseline, before cycles 3 and 5, 3‐4 weeks after completion and at 6, 12 and 24 months.

Both FAC and TAC arms led to a transient and statistically significant reduction in QoL scores which returned to baseline levels at first follow‐up visit. The reduction in QoL score was greater in the TAC arm (mean score 72 to 62) than the FAC arm (mean score 72 to 62).

Figuras y tablas -
Table 3. Quality of life
Table 4. Definition of "Disease Free Survival"

Study

Description

Definition

BCIRG 001

DFS

Time from randomization to date of clinical relapse (histological or radiological evidence), a second cancer (except skin cancer other than melanoma or carcinoma insitu of breast or cervix), or death

CALGB 9344

DFS

Time from randomization to date of first locoregional reccurence, first distant metastasis, or death any cause

FinHer

Recurrence‐free Survival

Time from randomization to date of detection of local or distant relapse (histological or radiological evidence) or contralateral invasive breast cancer or death

HeCOG

DFS

Time from randomization until local recurrence, distant relapse or death (without relapse)

NSABP B‐28

DFS

Time from randomization until local, regional or distant treatment failures, contralateral breast cancers, non‐breast second primary cancers or death

PACS 01

DFS

Time from randomization until time to first relapse (local, regional or distant), contralateral breast cancer or death from any cause

BIG 2‐98

Event‐free Survival

Not published

E2197

DFS

Not published

ECTO

Freedom From Progression

Not published

Jones SE

DFS

Not published

Taxit 216

DFS

Not published

GEICAM 9906

DFS

Not published

Figuras y tablas -
Table 4. Definition of "Disease Free Survival"
Comparison 1. Overall Effect of Taxanes

Outcome or subgroup title

No. of studies

No. of participants

Statistical method

Effect size

1 Overall Survival ‐ all studies Show forest plot

11

18304

Peto Odds Ratio (95% CI)

0.81 [0.75, 0.88]

1.1 All studies

11

18304

Peto Odds Ratio (95% CI)

0.81 [0.75, 0.88]

2 Disease Free Survival ‐ all studies Show forest plot

11

19943

Peto Odds Ratio (95% CI)

0.81 [0.77, 0.86]

2.1 All studies

11

19943

Peto Odds Ratio (95% CI)

0.81 [0.77, 0.86]

Figuras y tablas -
Comparison 1. Overall Effect of Taxanes
Comparison 2. Type of Taxane

Outcome or subgroup title

No. of studies

No. of participants

Statistical method

Effect size

1 Overall Survival Show forest plot

11

18304

Peto Odds Ratio (95% CI)

0.81 [0.75, 0.88]

1.1 Docetaxel

6

9377

Peto Odds Ratio (95% CI)

0.76 [0.67, 0.86]

1.2 Paclitaxel

5

8927

Peto Odds Ratio (95% CI)

0.85 [0.76, 0.94]

2 Disease Free Survival Show forest plot

11

19943

Peto Odds Ratio (95% CI)

0.81 [0.77, 0.86]

2.1 Docetaxel

7

12264

Peto Odds Ratio (95% CI)

0.80 [0.74, 0.87]

2.2 Paclitaxel

4

7679

Peto Odds Ratio (95% CI)

0.82 [0.76, 0.89]

Figuras y tablas -
Comparison 2. Type of Taxane
Comparison 3. Sequential or Concurrent Anthracycline/Taxane

Outcome or subgroup title

No. of studies

No. of participants

Statistical method

Effect size

1 Overall Survival Show forest plot

10

17288

Peto Odds Ratio (95% CI)

0.81 [0.75, 0.88]

1.1 Concurrent Antracycline/Taxane

3

5284

Peto Odds Ratio (95% CI)

0.79 [0.66, 0.94]

1.2 Sequential Anthracycline/Taxane

7

12004

Peto Odds Ratio (95% CI)

0.82 [0.75, 0.90]

2 Disease free survival Show forest plot

9

16040

Peto Odds Ratio (95% CI)

0.81 [0.76, 0.86]

2.1 Concurrent Anthracycline/Taxane

3

5284

Peto Odds Ratio (95% CI)

0.79 [0.70, 0.90]

2.2 Sequential Anthracycline/Taxane

6

10756

Peto Odds Ratio (95% CI)

0.81 [0.76, 0.88]

Figuras y tablas -
Comparison 3. Sequential or Concurrent Anthracycline/Taxane
Comparison 4. Addition or Substitution of Taxane

Outcome or subgroup title

No. of studies

No. of participants

Statistical method

Effect size

1 Overall Survival Show forest plot

11

18304

Peto Odds Ratio (95% CI)

0.81 [0.75, 0.88]

1.1 Addition of taxane

5

8651

Peto Odds Ratio (95% CI)

0.84 [0.76, 0.93]

1.2 Substitution of taxane

6

9653

Peto Odds Ratio (95% CI)

0.76 [0.67, 0.87]

2 Disease free survival Show forest plot

10

17056

Peto Odds Ratio (95% CI)

0.80 [0.76, 0.86]

2.1 Addition of taxane

5

8651

Peto Odds Ratio (95% CI)

0.82 [0.76, 0.89]

2.2 Substitution of taxane

5

8405

Peto Odds Ratio (95% CI)

0.78 [0.71, 0.86]

Figuras y tablas -
Comparison 4. Addition or Substitution of Taxane
Comparison 5. Lymph node status

Outcome or subgroup title

No. of studies

No. of participants

Statistical method

Effect size

1 Overall Survival Show forest plot

11

18304

Peto Odds Ratio (95% CI)

0.81 [0.75, 0.88]

1.1 Node positive only studies

6

11890

Peto Odds Ratio (95% CI)

0.81 [0.74, 0.89]

1.2 Node positive or negative studies

5

6414

Peto Odds Ratio (95% CI)

0.81 [0.69, 0.95]

2 Disease free survival Show forest plot

11

19943

Peto Odds Ratio (95% CI)

0.81 [0.77, 0.86]

2.1 Node positive only studies

6

13529

Peto Odds Ratio (95% CI)

0.81 [0.76, 0.87]

2.2 Node positive or negative studies

5

6414

Peto Odds Ratio (95% CI)

0.80 [0.71, 0.91]

Figuras y tablas -
Comparison 5. Lymph node status
Comparison 6. Duration of chemotherapy

Outcome or subgroup title

No. of studies

No. of participants

Statistical method

Effect size

1 Overall Survival Show forest plot

11

18304

Peto Odds Ratio (95% CI)

0.81 [0.75, 0.88]

1.1 Taxane containing arm longer duration than control arm

4

7747

Peto Odds Ratio (95% CI)

0.85 [0.77, 0.94]

1.2 Taxane containing arm same duration as control arm

7

10557

Peto Odds Ratio (95% CI)

0.76 [0.67, 0.86]

2 Disease free survival Show forest plot

10

17056

Peto Odds Ratio (95% CI)

0.80 [0.76, 0.86]

2.1 Taxane containing arm longer duration than control arm

4

7747

Peto Odds Ratio (95% CI)

0.83 [0.77, 0.90]

2.2 Taxane containing arm same duration as control arm

6

9309

Peto Odds Ratio (95% CI)

0.77 [0.70, 0.85]

Figuras y tablas -
Comparison 6. Duration of chemotherapy
Comparison 7. Publication status

Outcome or subgroup title

No. of studies

No. of participants

Statistical method

Effect size

1 Overall survival Show forest plot

11

18304

Peto Odds Ratio (95% CI)

0.81 [0.75, 0.88]

1.1 Studies with published efficacy paper

7

12291

Peto Odds Ratio (95% CI)

0.81 [0.74, 0.89]

1.2 Studies published in abstract form only

4

6013

Peto Odds Ratio (95% CI)

0.80 [0.67, 0.96]

2 Disease free survival Show forest plot

11

19943

Peto Odds Ratio (95% CI)

0.81 [0.77, 0.86]

2.1 Studies with published efficacy paper

7

12291

Peto Odds Ratio (95% CI)

0.80 [0.75, 0.86]

2.2 Studies published in abstract form only

4

7652

Peto Odds Ratio (95% CI)

0.84 [0.76, 0.93]

Figuras y tablas -
Comparison 7. Publication status
Comparison 8. Number of Cycles of Taxane‐containig Chemotherapy

Outcome or subgroup title

No. of studies

No. of participants

Statistical method

Effect size

1 Overall Survival Show forest plot

10

17056

Peto Odds Ratio (95% CI)

0.81 [0.75, 0.88]

1.1 Three cycles of Taxane

3

3604

Peto Odds Ratio (95% CI)

0.74 [0.61, 0.91]

1.2 Four or more cycles of Taxane

7

13452

Peto Odds Ratio (95% CI)

0.83 [0.76, 0.90]

2 Disease free survial Show forest plot

10

17056

Peto Odds Ratio (95% CI)

0.80 [0.76, 0.86]

2.1 Three cycles of Taxane

3

3604

Peto Odds Ratio (95% CI)

0.79 [0.68, 0.91]

2.2 Four or more cycles of Taxane

7

13452

Peto Odds Ratio (95% CI)

0.81 [0.75, 0.87]

Figuras y tablas -
Comparison 8. Number of Cycles of Taxane‐containig Chemotherapy
Comparison 9. Toxicities

Outcome or subgroup title

No. of studies

No. of participants

Statistical method

Effect size

1 Cardiotoxicity (includes grade 3/4 and symptomatic CCF) Show forest plot

6

11577

Odds Ratio (M‐H, Random, 95% CI)

0.90 [0.53, 1.55]

1.1 Total planned dose of anthracycline the same in both taxane‐ and non‐taxane‐containing arms

3

7661

Odds Ratio (M‐H, Random, 95% CI)

1.24 [0.83, 1.86]

1.2 Total planned dose of anthracycline reduced in the taxane‐containing arm

2

2900

Odds Ratio (M‐H, Random, 95% CI)

0.38 [0.15, 0.98]

1.3 Taxane replacing anthracycline

1

1016

Odds Ratio (M‐H, Random, 95% CI)

0.40 [0.08, 2.08]

2 Febrile neutropaenia Show forest plot

7

10224

Odds Ratio (M‐H, Random, 95% CI)

2.51 [1.11, 5.66]

2.1 Sequential anthracycline and taxane treatment

4

4839

Odds Ratio (M‐H, Random, 95% CI)

1.57 [0.48, 5.17]

2.2 Concurrent anthracycline and taxane treatment

2

4369

Odds Ratio (M‐H, Random, 95% CI)

6.80 [1.91, 24.15]

2.3 Taxane replacing anthracycline

1

1016

Odds Ratio (M‐H, Random, 95% CI)

1.99 [1.00, 3.93]

3 Grade 3/4 nausea and/or vomiting Show forest plot

5

6087

Odds Ratio (M‐H, Random, 95% CI)

0.55 [0.39, 0.77]

4 Secondary leukaemia/myelodysplasia Show forest plot

7

14149

Odds Ratio (M‐H, Random, 95% CI)

1.06 [0.59, 1.89]

5 Grade 3/4 Fatigue Show forest plot

4

4091

Odds Ratio (M‐H, Random, 95% CI)

1.55 [0.83, 2.89]

6 Grade 3/4 Stomatitis Show forest plot

5

6748

Odds Ratio (M‐H, Random, 95% CI)

1.38 [0.50, 3.82]

7 Treatment related deaths Show forest plot

6

11260

Odds Ratio (M‐H, Random, 95% CI)

1.00 [0.33, 3.04]

Figuras y tablas -
Comparison 9. Toxicities