Принудительное лечение в сообществе и недобровольное амбулаторное лечение людей с тяжелыми психическими расстройствами
Referencias
References to studies included in this review
References to studies excluded from this review
Additional references
References to other published versions of this review
Characteristics of studies
Characteristics of included studies [ordered by study ID]
Ir a:
| Methods | Allocation: randomised (1:1 ratio). Blinding: not blinded: randomisation involved allocation to 2 different types of legal status. Therefore, it was impossible and unlawful to mask research assistants, treating clinicians or participants. Duration: 12 and 36 months | |
| Participants | Diagnosis: people with psychosis discharged from hospital; 84% had schizophrenia, diagnostic criteria not stated. n = 336. However, on the 1st day, 1 participant assigned to a CTO withdrew and 2 on Section 17 were excluded (1 was already on a CTO and the other had been on a Section 17 too long). This left 333 for an ITT analysis. Age: 18 to 65 years. Sex: 225 M, 111 F. History: involuntarily admitted to hospital with psychosis and deemed suitable for supervised outpatient care by the treating clinicians. Exclusion criteria: none. | |
| Interventions | 1. CCT. 2. Supervised discharge (Section 17 leave): participants allowed to leave hospital for some hours or days, or even exceptionally weeks, while still subject to recall. | |
| Outcomes | Service use: readmission to hospital, number of days in psychiatric hospital, number of readmissions, time to admission. Mental state: BPRS. Global state: GAF. Unable to use: loss to care, adherence to prescribed medication, satisfaction with services, engagement with clinical services. | |
| Notes | ITT analysis for 12‐month follow‐up. All but 3 people were followed up at 36 months (n = 330) although not all completed all the secondary and tertiary outcome measures. Both intervention and control groups were subject to some form of CCT for at least part of the study. | |
| Risk of bias | ||
| Bias | Authors' judgement | Support for judgement |
| Random sequence generation (selection bias) | Low risk | Consenting participants were randomly assigned (ratio 1:1) by an independent statistician to be discharged from hospital either on CTO or Section 17 leave. Randomisation used random permuted blocks with lengths of 2, 4 and 6, and stratified for sex (male or female), schizophrenic diagnosis (yes or no) and duration of illness (< 2 years or ≥ 2 years). Assignments were enclosed in sequentially numbered, opaque, sealed envelopes and stored by a researcher independent to the trial team. |
| Allocation concealment (selection bias) | Unclear risk | The details of the sequence remained unknown to all members of the trial team until recruitment, data collection and analyses were completed. Randomisation took place after consent was obtained and the baseline interview was done. The envelope was opened on the day of the interview by the independent researcher after recording the participant's trial identification number on the envelope. She then communicated the randomised allocation to the recruiting researcher by telephone. |
| Blinding (performance bias and detection bias) | High risk | See above; randomisation involved allocation to 2 different types of legal status. Therefore, it was impossible and unlawful to mask research assistants, treating clinicians or participants. |
| Incomplete outcome data (attrition bias) | Low risk | There was no attrition for the primary outcome measure, or health service use; outcome data on psychiatric symptoms and the GAF were only available on 70% of the sample. |
| Selective reporting (reporting bias) | Low risk | Not apparent |
| Other bias | High risk | Other potential sources of bias in the study included allowing clinicians to make decisions independent of initial randomisation, whereby 40 participants (25%) allocated to Section 17 were subsequently placed on a CTO during the study and 35 participants randomised to CTOs (22%) did not actually receive the intervention. A sensitivity analysis to remove these protocol violations may, in turn, have left the study underpowered and not removed the possibility that Section 17 participants swapped to a CTO might have been more severely ill than participants remaining on Section 17 as per the protocol. Uncertainty concerning control condition. Although length of initial compulsory outpatient treatment differed widely between the 2 groups (medians of 183 days with CCT versus 8 days with supervised discharge), Section 17 participants averaged 4 months on some form of compulsory treatment over the 12 months consisting of the mean of 8 days on Section 17 plus periods of compulsory care during follow‐up (outcome). Another potential source of bias was that clinicians could keep participants on Section 17 for a variable period of time. It is possible that participants who were most likely to default on treatment were maintained on Section 17 and that for these participants it acted more like a CTO thus reducing the chance of the study finding an effect of CTOs. A final issue was generalisability. Around 20% of the sample were ineligible or refused to take part. These participants may have been the most unwell or lacking in insight, and therefore the ones most likely to benefit from CTOs. |
| Methods | Allocation: randomised, described. Blinding: unclear*. Duration: 11 months. | |
| Participants | Diagnosis: majority had psychosis; diagnostic criteria not stated. n = 152.* Age: > 18 years. Sex: 94 M, 48 F. History: poor compliance with services when discharged. Exclusion criteria: history of violence. | |
| Interventions | 1. CCT: enhanced service package + intensive, court‐ordered compulsory OPC, including involuntary medication for people thought by court to lack capacity to give informed consent. n = 78. 2. Standard care: enhanced service package with inpatient assessment and comprehensive discharge treatment plan in which participants participated, case management and oversight by OPC co‐ordinating plan. n = 64.** | |
| Outcomes | Service use: number of admissions, compliance with medication. Social functioning: number of arrests, homelessness. Satisfaction with care: perceived coercion (MAES). We were unable to use: Service use: hospitalisation; length of stay (no SD), remaining in contact (leaving the study early) (data unusable). Mental state: PANSS (no SD). Global state: GAF (no SD). Quality of life: LBQL (no SD). Adverse effects: various adverse effects (no SD). | |
| Notes | ITT analysis. * Study did not specifically mention blinding but did use self‐report measures for at least some of the outcomes, which are effectively self‐blinding * 142 participants completed baseline interview, 10 excluded from all reporting (7 from the CTO group and 3 from the controls). ** There was a suggestion that members of the control group and their case managers thought that they were actually on OPC. | |
| Risk of bias | ||
| Bias | Authors' judgement | Support for judgement |
| Random sequence generation (selection bias) | Low risk | The study used a random number list to identify assignment to either the intervention or control group. Random number list was generated by computer, which then split 200 numbers between groups. |
| Allocation concealment (selection bias) | Unclear risk | Unclear. The printed list was maintained in the research team's office in a locked file. When the treatment team had completed their treatment plan, they called the research team who checked the computer list to see whether the client was to be assigned to the experimental or comparison group. |
| Blinding (performance bias and detection bias) | High risk | No specific mention in the study. Although self‐report measures were used for at least some of the outcomes, it was unlikely participants, clinicians or assessors were blind to treatment status. There was also confusion that resulted in some control participants and their clinicians believing that they were in the intervention group. |
| Incomplete outcome data (attrition bias) | High risk | Only 57% to 68% of the participants completed interviews at 1, 5 and 11 months after hospital discharge. Only some outcomes were assessed by ITT analysis. |
| Selective reporting (reporting bias) | Unclear risk | Unclear from paper. |
| Other bias | Unclear risk | Unclear, no conflict of interests reported. The New York Police did not bring people for assessment when they breached their treatment orders. Therefore, there was no consequence to the order as intended by the law. |
| Methods | Allocation: randomised. Blinding: not blinded. Duration: 12 months. | |
| Participants | Diagnosis: schizophrenia, schizoaffective disorder or other major psychotic or affective disorder; diagnostic criteria not stated. n = 264.* Age: > 18 years. Sex: 132 M, 132 F. History: ill > 1 year, significant functional impairment (NCFAS score ≥ 90), intensive treatment in past 2 years, awaiting period of court‐ordered CCT, only included people discharged from hospital and not those already living in the community. Exclusion criteria: personality disorder, psychoactive substance‐use disorder, organic brain syndrome in absence of primary psychotic or mood disorder, recent serious act of violence involving injury or use of a weapon.* | |
| Interventions | 1. CCT: intensive, court‐ordered compulsory OPC. n = 129. 2. Standard care: control group were released from OPC by notifying the court. n = 135. | |
| Outcomes | Service use: number of admissions, compliance with medication. Social functioning: number of arrests, threatening behaviour, homelessness. Quality of life: victimisation; number of violent or non‐violent attacks. Satisfaction with care: perceived coercion (MAES). We were unable to use: Hospitalisation: length of stay (data unusable). Leaving the study early (data unusable). | |
| Notes | * Data for this review based only on those randomised to treatment groups and only non‐violent participants were randomised. The RCT was supplemented by a non‐random post hoc analysis of the intervention group based on duration of involuntary outpatient treatment. Renewals of CCT were not randomised for people who no longer met legal criteria. ITT analysis. | |
| Risk of bias | ||
| Bias | Authors' judgement | Support for judgement |
| Random sequence generation (selection bias) | Unclear risk | Stated to be randomised but did not describe process. |
| Allocation concealment (selection bias) | Unclear risk | Stated to be randomised but did not describe process. |
| Blinding (performance bias and detection bias) | High risk | No specific mention in the study. Although self‐report measures were used for at least some of the outcomes, it is unlikely participants, clinicians or assessors were blind to treatment status. |
| Incomplete outcome data (attrition bias) | Low risk | Of the identified eligible people, about 12% refused to participate. Subsequent attrition from the study was 18.2% (n = 48) but bias was minimised by ITT analysis. |
| Selective reporting (reporting bias) | Unclear risk | Unclear from paper. |
| Other bias | Unclear risk | Unclear, no conflicts of interest reported. |
BPRS: Brief Psychiatric Rating Scale; CCT: compulsory community treatment; CTO: community treatment order; F: female; GAF: Global Assessment of Functioning Scale; ITT: intention to treat; LBQL: Lehman Brief Quality of Life Interview; M: male; MAES: MacArthur Modified Admission Experience Survey; n: number of participants; NCFAS: North Carolina Functional Assessment Scale; OPC: outpatient commitment; PANSS: Positive and Negative Syndrome Scale; RCT: randomised controlled trial; SD: standard deviation.
Characteristics of excluded studies [ordered by study ID]
Ir a:
| Study | Reason for exclusion |
| Allocation: not randomised, review. | |
| Allocation: not randomised. | |
| Allocation: not randomised, no controls. | |
| Allocation: not randomised. | |
| Allocation: not randomised. | |
| Review: no primary data. | |
| Review: no primary data. | |
| Allocation: not randomised, no controls. | |
| Allocation: not randomised. | |
| Allocation: not randomised. | |
| Not an RCT of CTOs | |
| Review: no primary data. | |
| Allocation: not randomised. | |
| Allocation: not randomised. | |
| Allocation: not randomised. | |
| Allocation: not randomised. | |
| Allocation: not randomised. | |
| Allocation: not randomised, review. | |
| Allocation: not randomised, review. | |
| Allocation: not randomised. | |
| Allocation: not randomised. | |
| Review: no primary data. | |
| Review: no primary data. | |
| Review: no primary data. | |
| Review: no primary data. | |
| Allocation: not randomised. | |
| Allocation: not randomised. | |
| Review: no primary data. | |
| Allocation: not randomised, review. | |
| Allocation: not randomised. | |
| Allocation: not randomised, before and after design. | |
| Allocation: not randomised, survey of providers. | |
| Allocation: not randomised, retrospective design. | |
| Allocation: not randomised, review. | |
| Allocation: not randomised, retrospective design. | |
| Allocation: not randomised, review. | |
| Allocation: not randomised, review. | |
| Allocation: not randomised, no controls. | |
| Allocation: not randomised, no controls. | |
| Review: no primary data. | |
| Qualitative evaluation: not randomised. | |
| Review: no primary data. | |
| Allocation: not randomised. | |
| Allocation: not randomised. | |
| Allocation: not randomised. | |
| Allocation: not randomised. | |
| Allocation: not randomised. | |
| Allocation: not randomised. | |
| Allocation: not randomised. | |
| Allocation: not randomised. | |
| Allocation: not randomised. | |
| Allocation: not randomised. | |
| Allocation: not randomised. | |
| Allocation: not randomised. | |
| Allocation: not randomised. | |
| Allocation: not randomised. | |
| Allocation: not randomised. | |
| Allocation: not randomised. | |
| No primary data. | |
| Not a study of CCT. | |
| Allocation: not randomised, no controls. | |
| Allocation: not randomised. | |
| Allocation: randomised. Participants: people with schizophrenia, schizoaffective disorder or other major psychotic or affective disorders. Intervention: 1. CCT: intensive court‐ordered compulsory outpatient commitment vs 2. standard care: control group who were released from outpatient commitment by notifying the court. Outcomes: no usable outcomes. Only the number of subsequent outpatient visits were reported, this was considered to be inherent to the process of CCT/outpatient commitment and not a result of the interventions. | |
| Review: no primary data. | |
| Allocation: not randomised. | |
| Allocation: not randomised, no controls. |
CCT: compulsory community treatment; CTO: community treatment order; RCT: randomised controlled trial.
Data and analyses
| Outcome or subgroup title | No. of studies | No. of participants | Statistical method | Effect size |
| 1 Health service outcomes: 1. Readmission to hospital ‐ by 11 to 12 months Show forest plot | 2 | 416 | Risk Ratio (M‐H, Fixed, 95% CI) | 0.98 [0.79, 1.21] |
| Analysis 1.1 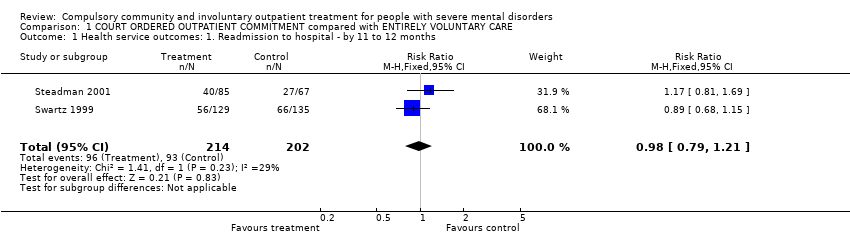 Comparison 1 COURT ORDERED OUTPATIENT COMMITMENT compared with ENTIRELY VOLUNTARY CARE, Outcome 1 Health service outcomes: 1. Readmission to hospital ‐ by 11 to 12 months. | ||||
| 2 Health service outcomes: 2. Hospital bed‐days Show forest plot | 1 | 264 | Mean Difference (IV, Fixed, 95% CI) | ‐1.24 [‐15.16, 12.68] |
| Analysis 1.2 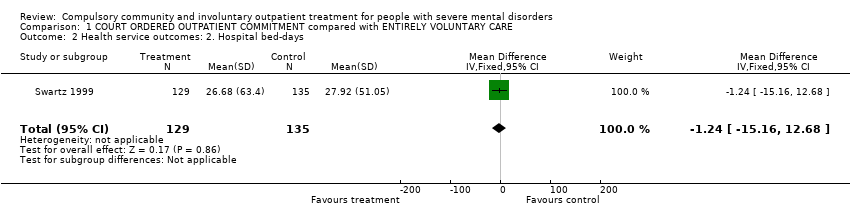 Comparison 1 COURT ORDERED OUTPATIENT COMMITMENT compared with ENTIRELY VOLUNTARY CARE, Outcome 2 Health service outcomes: 2. Hospital bed‐days. | ||||
| 3 Health service outcomes: 3. Number with multiple readmissions by 12 months Show forest plot | 1 | 152 | Risk Ratio (M‐H, Fixed, 95% CI) | 1.87 [0.87, 4.01] |
| Analysis 1.3  Comparison 1 COURT ORDERED OUTPATIENT COMMITMENT compared with ENTIRELY VOLUNTARY CARE, Outcome 3 Health service outcomes: 3. Number with multiple readmissions by 12 months. | ||||
| 4 Health service outcomes: 4. Compliance with medication by 11 to 12 months Show forest plot | 2 | 416 | Risk Ratio (M‐H, Fixed, 95% CI) | 0.99 [0.83, 1.19] |
| Analysis 1.4  Comparison 1 COURT ORDERED OUTPATIENT COMMITMENT compared with ENTIRELY VOLUNTARY CARE, Outcome 4 Health service outcomes: 4. Compliance with medication by 11 to 12 months. | ||||
| 5 Participant level outcomes: 1. Mental state ‐ psychiatric symptoms and global state at 11 to 12 months Show forest plot | 1 | 98 | Mean Difference (IV, Fixed, 95% CI) | ‐3.0 [‐8.08, 2.08] |
| Analysis 1.5 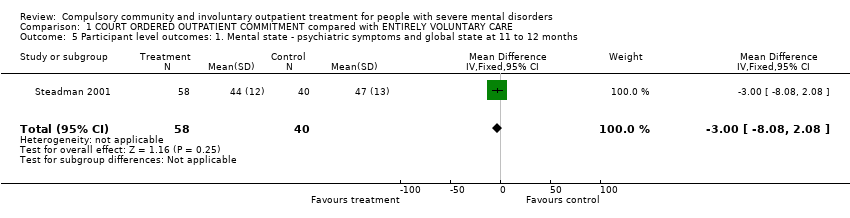 Comparison 1 COURT ORDERED OUTPATIENT COMMITMENT compared with ENTIRELY VOLUNTARY CARE, Outcome 5 Participant level outcomes: 1. Mental state ‐ psychiatric symptoms and global state at 11 to 12 months. | ||||
| 6 Participant level outcomes: 2. Social functioning: trouble with police by 11 to 12 months Show forest plot | 2 | Risk Ratio (M‐H, Fixed, 95% CI) | Subtotals only | |
| Analysis 1.6 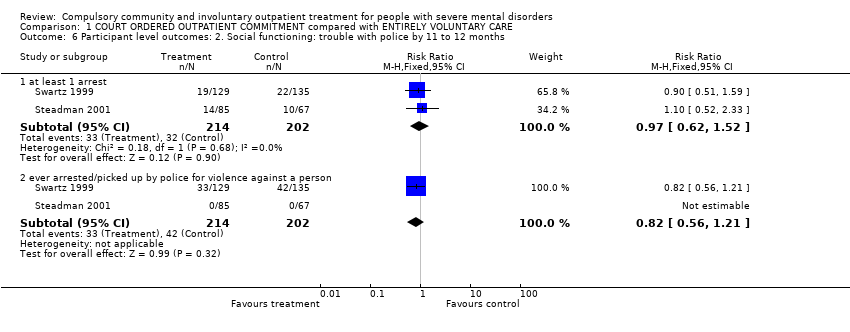 Comparison 1 COURT ORDERED OUTPATIENT COMMITMENT compared with ENTIRELY VOLUNTARY CARE, Outcome 6 Participant level outcomes: 2. Social functioning: trouble with police by 11 to 12 months. | ||||
| 6.1 at least 1 arrest | 2 | 416 | Risk Ratio (M‐H, Fixed, 95% CI) | 0.97 [0.62, 1.52] |
| 6.2 ever arrested/picked up by police for violence against a person | 2 | 416 | Risk Ratio (M‐H, Fixed, 95% CI) | 0.82 [0.56, 1.21] |
| 7 Participant level outcomes: 3. Social functioning: homeless by 11 to 12 months Show forest plot | 2 | 416 | Risk Ratio (M‐H, Fixed, 95% CI) | 0.67 [0.39, 1.15] |
| Analysis 1.7 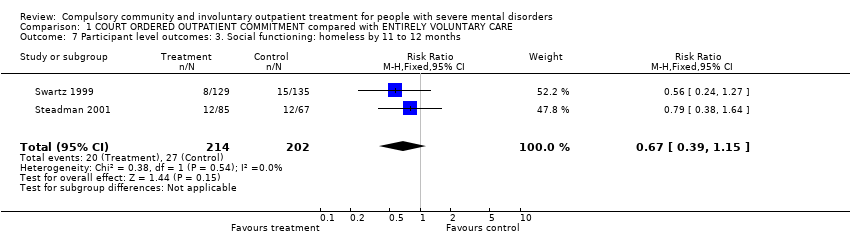 Comparison 1 COURT ORDERED OUTPATIENT COMMITMENT compared with ENTIRELY VOLUNTARY CARE, Outcome 7 Participant level outcomes: 3. Social functioning: homeless by 11 to 12 months. | ||||
| 8 Participant level outcomes: 4. Quality of life: Lehman Quality of Life Scale Show forest plot | 2 | 406 | Mean Difference (IV, Random, 95% CI) | ‐0.22 [‐0.95, 0.50] |
| Analysis 1.8 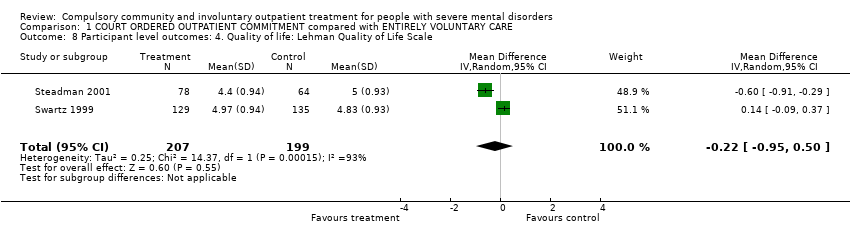 Comparison 1 COURT ORDERED OUTPATIENT COMMITMENT compared with ENTIRELY VOLUNTARY CARE, Outcome 8 Participant level outcomes: 4. Quality of life: Lehman Quality of Life Scale. | ||||
| 9 Participant level outcomes: 5. Quality of life: victimisation by 11 to 12 months Show forest plot | 1 | 264 | Risk Ratio (M‐H, Fixed, 95% CI) | 0.50 [0.31, 0.80] |
| Analysis 1.9  Comparison 1 COURT ORDERED OUTPATIENT COMMITMENT compared with ENTIRELY VOLUNTARY CARE, Outcome 9 Participant level outcomes: 5. Quality of life: victimisation by 11 to 12 months. | ||||
| 10 Participant level outcomes: 6. Satisfaction with care: perceived coercion by 11 to 12 months Show forest plot | 2 | 416 | Risk Ratio (M‐H, Fixed, 95% CI) | 1.36 [0.97, 1.89] |
| Analysis 1.10  Comparison 1 COURT ORDERED OUTPATIENT COMMITMENT compared with ENTIRELY VOLUNTARY CARE, Outcome 10 Participant level outcomes: 6. Satisfaction with care: perceived coercion by 11 to 12 months. | ||||
| Outcome or subgroup title | No. of studies | No. of participants | Statistical method | Effect size |
| 1 Health service outcomes: 1a. Readmission to hospital ‐ by 12 months Show forest plot | 1 | 333 | Risk Ratio (M‐H, Fixed, 95% CI) | 0.99 [0.74, 1.32] |
| Analysis 2.1  Comparison 2 COMMUNITY TREATMENT ORDERS compared with SUPERVISED DISCHARGE (SECTION 17), Outcome 1 Health service outcomes: 1a. Readmission to hospital ‐ by 12 months. | ||||
| 2 Health service outcomes. 1b. Readmission to hospital by 36 months Show forest plot | 1 | Odds Ratio (M‐H, Fixed, 95% CI) | Subtotals only | |
| Analysis 2.2  Comparison 2 COMMUNITY TREATMENT ORDERS compared with SUPERVISED DISCHARGE (SECTION 17), Outcome 2 Health service outcomes. 1b. Readmission to hospital by 36 months. | ||||
| 2.1 Readmission | 1 | 330 | Odds Ratio (M‐H, Fixed, 95% CI) | 0.71 [0.45, 1.11] |
| 2.2 > 1 readmission | 1 | 213 | Odds Ratio (M‐H, Fixed, 95% CI) | 1.07 [0.62, 1.85] |
| 3 Health service outcomes: 2. Hospital bed‐days by 12 months Show forest plot | 1 | 333 | Mean Difference (IV, Fixed, 95% CI) | ‐8.70 [‐30.88, 13.48] |
| Analysis 2.3  Comparison 2 COMMUNITY TREATMENT ORDERS compared with SUPERVISED DISCHARGE (SECTION 17), Outcome 3 Health service outcomes: 2. Hospital bed‐days by 12 months. | ||||
| 4 Health service outcomes: 3. Number of readmissions by 12 months Show forest plot | 1 | 119 | Mean Difference (IV, Fixed, 95% CI) | ‐0.20 [‐0.45, 0.05] |
| Analysis 2.4  Comparison 2 COMMUNITY TREATMENT ORDERS compared with SUPERVISED DISCHARGE (SECTION 17), Outcome 4 Health service outcomes: 3. Number of readmissions by 12 months. | ||||
| 5 Health service outcomes: 4. Number with multiple readmissions by 12 months Show forest plot | 1 | 333 | Risk Ratio (M‐H, Fixed, 95% CI) | 0.56 [0.27, 1.17] |
| Analysis 2.5  Comparison 2 COMMUNITY TREATMENT ORDERS compared with SUPERVISED DISCHARGE (SECTION 17), Outcome 5 Health service outcomes: 4. Number with multiple readmissions by 12 months. | ||||
| 6 Health service outcomes: 5a. Days in community till first admission by 12 months Show forest plot | 1 | 333 | Mean Difference (IV, Fixed, 95% CI) | 5.0 [‐21.74, 31.74] |
| Analysis 2.6  Comparison 2 COMMUNITY TREATMENT ORDERS compared with SUPERVISED DISCHARGE (SECTION 17), Outcome 6 Health service outcomes: 5a. Days in community till first admission by 12 months. | ||||
| 7 Health service outcomes: 5b. Days in community till first admission and mean duration of bed‐days by 36 months Show forest plot | 1 | Mean Difference (IV, Fixed, 95% CI) | Subtotals only | |
| Analysis 2.7  Comparison 2 COMMUNITY TREATMENT ORDERS compared with SUPERVISED DISCHARGE (SECTION 17), Outcome 7 Health service outcomes: 5b. Days in community till first admission and mean duration of bed‐days by 36 months. | ||||
| 7.1 Time to 1st readmission in days | 1 | 330 | Mean Difference (IV, Fixed, 95% CI) | 60.0 [‐27.62, 147.62] |
| 7.2 Mean duration of bed‐days | 1 | 212 | Mean Difference (IV, Fixed, 95% CI) | ‐15.10 [‐89.39, 59.19] |
| 8 Participant level outcomes: 1. Mental state ‐ psychiatric symptoms at 12 months (BPRS) Show forest plot | 1 | 234 | Mean Difference (IV, Fixed, 95% CI) | ‐0.10 [‐3.17, 2.97] |
| Analysis 2.8 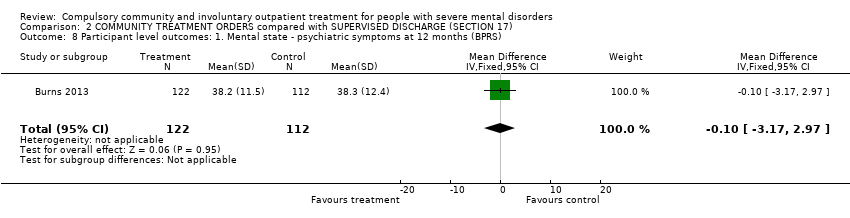 Comparison 2 COMMUNITY TREATMENT ORDERS compared with SUPERVISED DISCHARGE (SECTION 17), Outcome 8 Participant level outcomes: 1. Mental state ‐ psychiatric symptoms at 12 months (BPRS). | ||||
| 9 Participant level outcomes: 2. Global state: GAF at 12 months Show forest plot | 1 | 237 | Mean Difference (IV, Fixed, 95% CI) | ‐0.70 [‐3.91, 2.51] |
| Analysis 2.9  Comparison 2 COMMUNITY TREATMENT ORDERS compared with SUPERVISED DISCHARGE (SECTION 17), Outcome 9 Participant level outcomes: 2. Global state: GAF at 12 months. | ||||
| 10 Participant level outcomes: 3. Satisfaction with care: perceived coercion at 11 to 12 months Show forest plot | 1 | 182 | Mean Difference (IV, Fixed, 95% CI) | ‐0.5 [‐1.71, 0.71] |
| Analysis 2.10 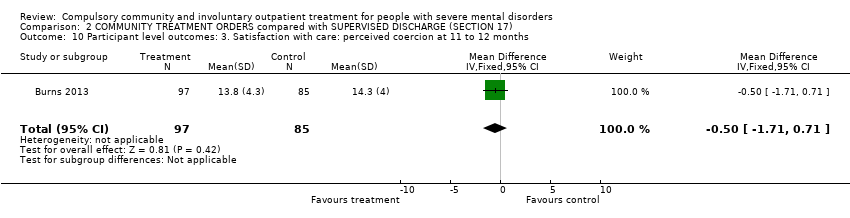 Comparison 2 COMMUNITY TREATMENT ORDERS compared with SUPERVISED DISCHARGE (SECTION 17), Outcome 10 Participant level outcomes: 3. Satisfaction with care: perceived coercion at 11 to 12 months. | ||||
| 11 Participant level outcomes: 4. Satisfaction with care: leverage at 11 to 12 months Show forest plot | 1 | 229 | Odds Ratio (M‐H, Fixed, 95% CI) | 1.23 [0.66, 2.31] |
| Analysis 2.11  Comparison 2 COMMUNITY TREATMENT ORDERS compared with SUPERVISED DISCHARGE (SECTION 17), Outcome 11 Participant level outcomes: 4. Satisfaction with care: leverage at 11 to 12 months. | ||||
| 12 Participant level outcomes: 5. Social Outcomes Index at 12 months Show forest plot | 1 | 236 | Mean Difference (IV, Fixed, 95% CI) | ‐0.10 [‐0.40, 0.20] |
| Analysis 2.12 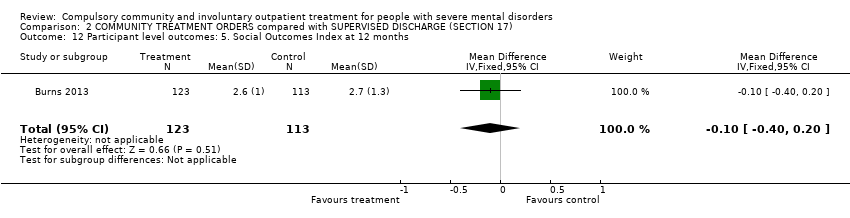 Comparison 2 COMMUNITY TREATMENT ORDERS compared with SUPERVISED DISCHARGE (SECTION 17), Outcome 12 Participant level outcomes: 5. Social Outcomes Index at 12 months. | ||||
| Outcome or subgroup title | No. of studies | No. of participants | Statistical method | Effect size |
| 1 Health service outcomes: 1. Readmission to hospital by 11 to 12 months Show forest plot | 3 | 749 | Risk Ratio (M‐H, Fixed, 95% CI) | 0.98 [0.83, 1.17] |
| Analysis 3.1 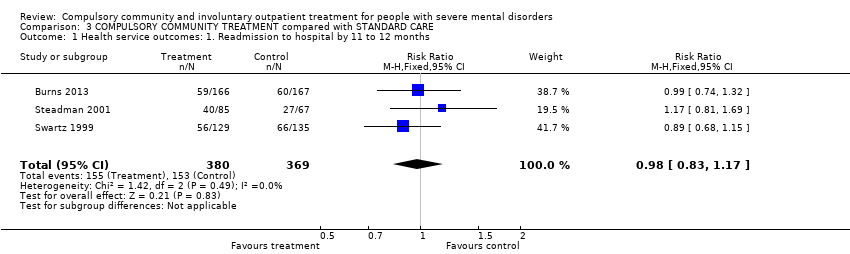 Comparison 3 COMPULSORY COMMUNITY TREATMENT compared with STANDARD CARE, Outcome 1 Health service outcomes: 1. Readmission to hospital by 11 to 12 months. | ||||
| 2 Health service outcomes: 2. Hospital bed‐days Show forest plot | 2 | 597 | Mean Difference (IV, Fixed, 95% CI) | ‐3.35 [‐15.14, 8.44] |
| Analysis 3.2 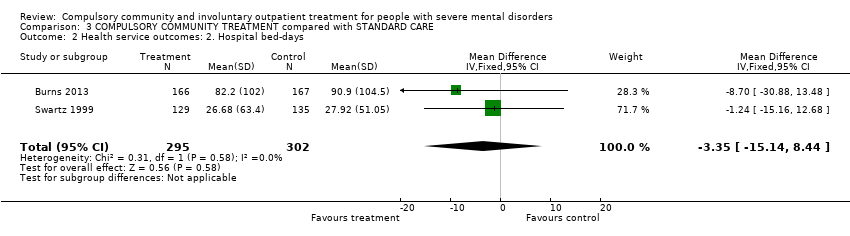 Comparison 3 COMPULSORY COMMUNITY TREATMENT compared with STANDARD CARE, Outcome 2 Health service outcomes: 2. Hospital bed‐days. | ||||
| 3 Health service outcomes: 3. Number with multiple readmissions by 12 months Show forest plot | 2 | 485 | Risk Ratio (M‐H, Random, 95% CI) | 1.02 [0.31, 3.33] |
| Analysis 3.3 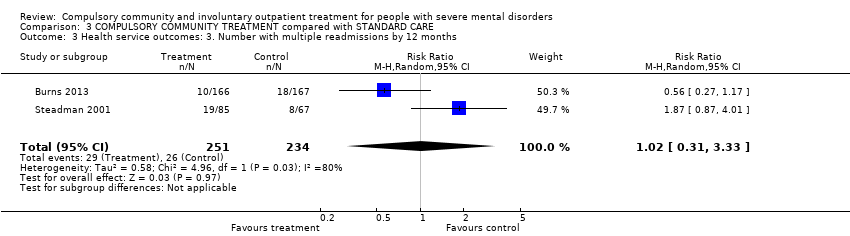 Comparison 3 COMPULSORY COMMUNITY TREATMENT compared with STANDARD CARE, Outcome 3 Health service outcomes: 3. Number with multiple readmissions by 12 months. | ||||
| 4 Participant level outcomes: 1. global state: GAF at 12 months Show forest plot | 2 | 335 | Mean Difference (IV, Fixed, 95% CI) | ‐1.36 [‐4.07, 1.35] |
| Analysis 3.4  Comparison 3 COMPULSORY COMMUNITY TREATMENT compared with STANDARD CARE, Outcome 4 Participant level outcomes: 1. global state: GAF at 12 months. | ||||
| 5 Participant level outcomes: 2. Satisfaction with care: perceived coercion or leverage at 11 to 12 months Show forest plot | 3 | 645 | Risk Ratio (M‐H, Fixed, 95% CI) | 1.30 [0.98, 1.71] |
| Analysis 3.5  Comparison 3 COMPULSORY COMMUNITY TREATMENT compared with STANDARD CARE, Outcome 5 Participant level outcomes: 2. Satisfaction with care: perceived coercion or leverage at 11 to 12 months. | ||||

Study flow diagram.

'Risk of bias' graph: review authors' judgements about each risk of bias item presented as percentages across all included studies.
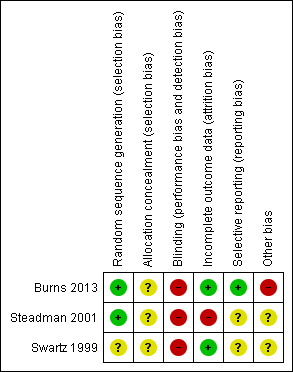
'Risk of bias' summary: review authors' judgements about each risk of bias item for each included study.

Comparison 1 COURT ORDERED OUTPATIENT COMMITMENT compared with ENTIRELY VOLUNTARY CARE, Outcome 1 Health service outcomes: 1. Readmission to hospital ‐ by 11 to 12 months.

Comparison 1 COURT ORDERED OUTPATIENT COMMITMENT compared with ENTIRELY VOLUNTARY CARE, Outcome 2 Health service outcomes: 2. Hospital bed‐days.
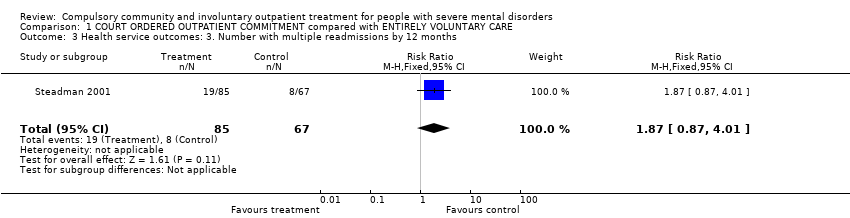
Comparison 1 COURT ORDERED OUTPATIENT COMMITMENT compared with ENTIRELY VOLUNTARY CARE, Outcome 3 Health service outcomes: 3. Number with multiple readmissions by 12 months.

Comparison 1 COURT ORDERED OUTPATIENT COMMITMENT compared with ENTIRELY VOLUNTARY CARE, Outcome 4 Health service outcomes: 4. Compliance with medication by 11 to 12 months.

Comparison 1 COURT ORDERED OUTPATIENT COMMITMENT compared with ENTIRELY VOLUNTARY CARE, Outcome 5 Participant level outcomes: 1. Mental state ‐ psychiatric symptoms and global state at 11 to 12 months.

Comparison 1 COURT ORDERED OUTPATIENT COMMITMENT compared with ENTIRELY VOLUNTARY CARE, Outcome 6 Participant level outcomes: 2. Social functioning: trouble with police by 11 to 12 months.

Comparison 1 COURT ORDERED OUTPATIENT COMMITMENT compared with ENTIRELY VOLUNTARY CARE, Outcome 7 Participant level outcomes: 3. Social functioning: homeless by 11 to 12 months.

Comparison 1 COURT ORDERED OUTPATIENT COMMITMENT compared with ENTIRELY VOLUNTARY CARE, Outcome 8 Participant level outcomes: 4. Quality of life: Lehman Quality of Life Scale.

Comparison 1 COURT ORDERED OUTPATIENT COMMITMENT compared with ENTIRELY VOLUNTARY CARE, Outcome 9 Participant level outcomes: 5. Quality of life: victimisation by 11 to 12 months.

Comparison 1 COURT ORDERED OUTPATIENT COMMITMENT compared with ENTIRELY VOLUNTARY CARE, Outcome 10 Participant level outcomes: 6. Satisfaction with care: perceived coercion by 11 to 12 months.

Comparison 2 COMMUNITY TREATMENT ORDERS compared with SUPERVISED DISCHARGE (SECTION 17), Outcome 1 Health service outcomes: 1a. Readmission to hospital ‐ by 12 months.
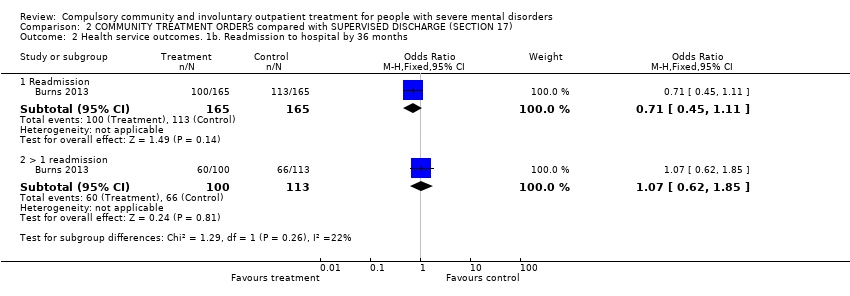
Comparison 2 COMMUNITY TREATMENT ORDERS compared with SUPERVISED DISCHARGE (SECTION 17), Outcome 2 Health service outcomes. 1b. Readmission to hospital by 36 months.

Comparison 2 COMMUNITY TREATMENT ORDERS compared with SUPERVISED DISCHARGE (SECTION 17), Outcome 3 Health service outcomes: 2. Hospital bed‐days by 12 months.

Comparison 2 COMMUNITY TREATMENT ORDERS compared with SUPERVISED DISCHARGE (SECTION 17), Outcome 4 Health service outcomes: 3. Number of readmissions by 12 months.

Comparison 2 COMMUNITY TREATMENT ORDERS compared with SUPERVISED DISCHARGE (SECTION 17), Outcome 5 Health service outcomes: 4. Number with multiple readmissions by 12 months.
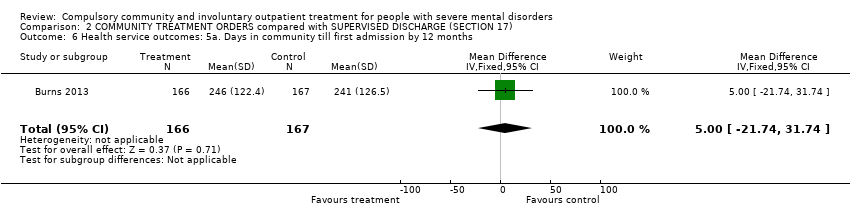
Comparison 2 COMMUNITY TREATMENT ORDERS compared with SUPERVISED DISCHARGE (SECTION 17), Outcome 6 Health service outcomes: 5a. Days in community till first admission by 12 months.

Comparison 2 COMMUNITY TREATMENT ORDERS compared with SUPERVISED DISCHARGE (SECTION 17), Outcome 7 Health service outcomes: 5b. Days in community till first admission and mean duration of bed‐days by 36 months.

Comparison 2 COMMUNITY TREATMENT ORDERS compared with SUPERVISED DISCHARGE (SECTION 17), Outcome 8 Participant level outcomes: 1. Mental state ‐ psychiatric symptoms at 12 months (BPRS).

Comparison 2 COMMUNITY TREATMENT ORDERS compared with SUPERVISED DISCHARGE (SECTION 17), Outcome 9 Participant level outcomes: 2. Global state: GAF at 12 months.

Comparison 2 COMMUNITY TREATMENT ORDERS compared with SUPERVISED DISCHARGE (SECTION 17), Outcome 10 Participant level outcomes: 3. Satisfaction with care: perceived coercion at 11 to 12 months.
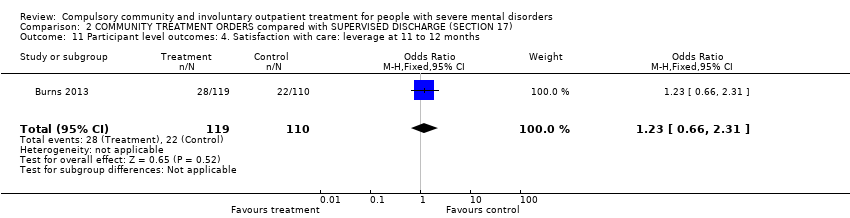
Comparison 2 COMMUNITY TREATMENT ORDERS compared with SUPERVISED DISCHARGE (SECTION 17), Outcome 11 Participant level outcomes: 4. Satisfaction with care: leverage at 11 to 12 months.

Comparison 2 COMMUNITY TREATMENT ORDERS compared with SUPERVISED DISCHARGE (SECTION 17), Outcome 12 Participant level outcomes: 5. Social Outcomes Index at 12 months.

Comparison 3 COMPULSORY COMMUNITY TREATMENT compared with STANDARD CARE, Outcome 1 Health service outcomes: 1. Readmission to hospital by 11 to 12 months.

Comparison 3 COMPULSORY COMMUNITY TREATMENT compared with STANDARD CARE, Outcome 2 Health service outcomes: 2. Hospital bed‐days.

Comparison 3 COMPULSORY COMMUNITY TREATMENT compared with STANDARD CARE, Outcome 3 Health service outcomes: 3. Number with multiple readmissions by 12 months.
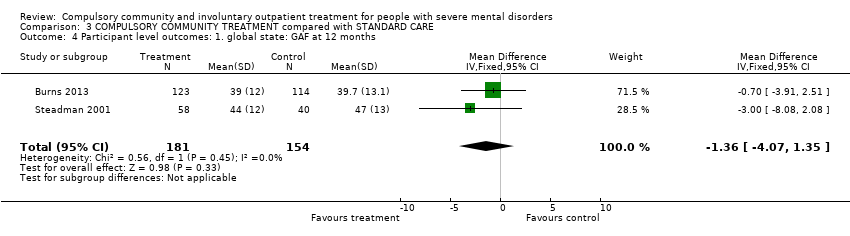
Comparison 3 COMPULSORY COMMUNITY TREATMENT compared with STANDARD CARE, Outcome 4 Participant level outcomes: 1. global state: GAF at 12 months.
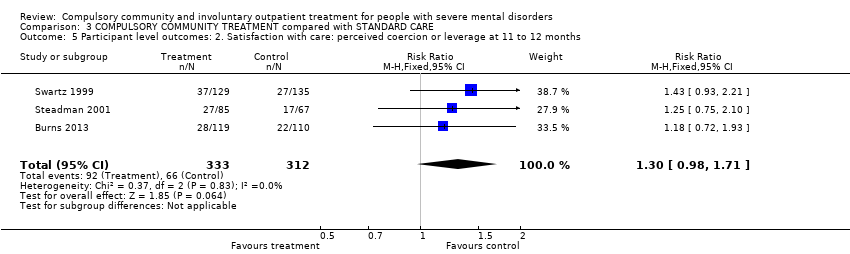
Comparison 3 COMPULSORY COMMUNITY TREATMENT compared with STANDARD CARE, Outcome 5 Participant level outcomes: 2. Satisfaction with care: perceived coercion or leverage at 11 to 12 months.
| COMPULSORY COMMUNITY AND INVOLUNTARY OUTPATIENT TREATMENT FOR PEOPLE WITH SEVERE MENTAL DISORDERS | ||||||
| Patient or population: people with severe mental disorders Settings: patients in community settings Intervention: COURT ORDERED OUTPATIENT COMMITMENT Comparison: ENTIRELY VOLUNTARY CARE | ||||||
| Outcomes | Illustrative comparative risks* (95% CI) | Relative effect | No of participants | Quality of the evidence | Comments | |
| Assumed risk | Corresponding risk | |||||
| VOLUNTARY CARE | COURT ORDERED OUTPATIENT COMMITMENT | |||||
| Health service outcomes: 1. Readmission to hospital by 11 to 12 months | Study population | RR 0.98 | 416 | ⊕⊕⊝⊝ | ‐ | |
| 460 per 1000 | 451 per 1000 | |||||
| Medium risk population | ||||||
| 446 per 1000 | 437 per 1000 | |||||
| Health service outcomes: 4. Compliance with medication by 11 to 12 months | Study population | RR 0.99 | 416 | ⊕⊕⊝⊝ | ‐ | |
| 505 per 1000 | 500 per 1000 | |||||
| Medium risk population | ||||||
| 554 per 1000 | 548 per 1000 | |||||
| Participant level outcomes: 2. Social functioning: trouble with police by 11 to 12 months, at least 1 arrest | Study population | RR 0.97 | 416 | ⊕⊕⊝⊝ | ‐ | |
| 158 per 1000 | 153 per 1000 | |||||
| Medium risk population | ||||||
| 156 per 1000 | 151 per 1000 | |||||
| Participant level outcomes: 2. Social functioning: trouble with police by 11 to 12 months, ever arrested/picked up by police for violence against a person | Study population | RR 0.82 | 416 | ⊕⊕⊝⊝ | ‐ | |
| 208 per 1000 | 171 per 1000 | |||||
| Medium risk population | ||||||
| 156 per 1000 | 128 per 1000 | |||||
| Participant level outcomes: 3. Social functioning: homeless by 11 to 12 months | Study population | RR 0.67 | 416 | ⊕⊕⊝⊝ | ‐ | |
| 134 per 1000 | 90 per 1000 | |||||
| Medium risk population | ||||||
| 145 per 1000 | 97 per 1000 | |||||
| Participant level outcomes: 5. Quality of life: victimisation by 11 to 12 months | Study population | RR 0.5 | 264 | ⊕⊕⊝⊝ | ‐ | |
| 311 per 1000 | 156 per 1000 | |||||
| Medium risk population | ||||||
| 311 per 1000 | 156 per 1000 | |||||
| Participant level outcomes: 6. Satisfaction with care/adverse events: perceived coercion by 11 to 12 months | Study population | RR 1.36 | 416 | ⊕⊕⊝⊝ | ‐ | |
| 218 per 1000 | 296 per 1000 | |||||
| Medium risk population | ||||||
| 227 per 1000 | 309 per 1000 | |||||
| *The basis for the assumed risk (e.g. the median control group risk across studies) is provided in footnotes. The corresponding risk (and its 95% confidence interval) is based on the assumed risk in the comparison group and the relative effect of the intervention (and its 95% CI). | ||||||
| GRADE Working Group grades of evidence | ||||||
| 1 Allocation concealment and blinding unclear: serious risk of bias, downgraded by one level. 2 Only 2 studies, both from the USA: serious imprecision, downgraded by one level. 3 Only 1 study: serious imprecision, downgraded by one level. | ||||||
| COMPULSORY COMMUNITY AND INVOLUNTARY OUTPATIENT TREATMENT FOR PEOPLE WITH SEVERE MENTAL DISORDERS | ||||||
| Patient or population: people with severe mental disorders Settings: community Intervention: COMMUNITY TREATMENT ORDERS Comparison: SUPERVISED DISCHARGE (Section 17) | ||||||
| Outcomes | Illustrative comparative risks* (95% CI) | Relative effect | No of participants | Quality of the evidence | Comments | |
| Assumed risk | Corresponding risk | |||||
| SECTION 17 | COMMUNITY TREATMENT ORDERS | |||||
| Health service outcomes: 1. Readmission to hospital by 12 months | Study population | RR 0.99 | 333 | ⊕⊕⊕⊝ | ‐ | |
| 359 per 1000 | 356 per 1000 | |||||
| Moderate risk population | ||||||
| 359 per 1000 | 355 per 1000 | |||||
| Health service outcomes: 2. Hospital bed‐days by 12 months | ‐ | The mean health service outcomes: 2. total duration of psychiatric hospital stays over 12 months in the intervention groups was | ‐ | 333 | ⊕⊕⊕⊝ | ‐ |
| Health service outcomes: 3. Number of readmissions by 12 months | ‐ | The mean health service outcomes: 3. number of readmissions by 12 months in the intervention groups was | ‐ | 119 | ⊕⊕⊕⊝ | ‐ |
| Health service outcomes: 4. Number with multiple readmissions by 12 months | Study population | RR 0.56 | 333 | ⊕⊕⊕⊝ | ‐ | |
| 108 per 1000 | 60 per 1000 | |||||
| Moderate risk population | ||||||
| 108 per 1000 | 60 per 1000 | |||||
| Health service outcomes: 5. Days in community to first admission by 12 months | ‐ | The mean days in community to 1st admission in the intervention groups was | ‐ | 333 | ⊕⊕⊕⊝ | ‐ |
| Participant level outcomes: 1. Mental state ‐ psychiatric symptoms at 12 months (BPRS) | ‐ | The mean patierticipant level outcomes: BPRS in the intervention groups was | ‐ | 234 | ⊕⊕⊕⊝ | |
| Participant level outcomes: 3. Satisfaction with care: perceived coercion at 11 ‐ 12 months | ‐ | The mean participant level outcomes: Satisfaction with care: perceived coercion intervention groups was | ‐ | 182 | ⊕⊕⊕⊝ | |
| Other pre‐stated participant level outcomes of interest: Social functioning: trouble with police, homeless; Quality of life: victimisation; not reported | ||||||
| *The basis for the assumed risk (e.g. the median control group risk across studies) is provided in footnotes. The corresponding risk (and its 95% confidence interval) is based on the assumed risk in the comparison group and the relative effect of the intervention (and its 95% CI). | ||||||
| GRADE Working Group grades of evidence | ||||||
| 1 Forty people (25%) allocated to Section 17 were subsequently placed on a CTO during the study. 2 35 people randomised to CTOs (22%) did not actually receive the intervention. 3 No adverse events reported. | ||||||
| COMPULSORY COMMUNITY AND INVOLUNTARY OUTPATIENT TREATMENT FOR PEOPLE WITH SEVERE MENTAL DISORDERS | ||||||
| Patient or population: people with severe mental disorders Settings: community Intervention: COMPULSORY COMMUNITY TREATMENT Comparison: STANDARD CARE | ||||||
| Outcomes | Illustrative comparative risks* (95% CI) | Relative effect | No of participants | Quality of the evidence | Comments | |
| Assumed risk | Corresponding risk | |||||
| STANDARD CARE | COMPULSORY COMMUNITY TREATMENT | |||||
| Health service outcomes: 1. Readmission to hospital by 11 to 12 months | Study population | RR 0.98 | 749 | ⊕⊕⊕⊝ | ‐ | |
| 415 per 1000 | 406 per 1000 | |||||
| Moderate | ||||||
| 403 per 1000 | 395 per 1000 | |||||
| Health service outcomes: 2. Hospital bed‐days | ‐ | The mean health service outcomes: 2. hospital bed‐days in the intervention groups was | ‐ | 597 | ⊕⊕⊕⊝ | ‐ |
| Health service outcomes: 3. Number with multiple readmissions by 12 months | Study population | RR 1.0 | 485 | ⊕⊕⊕⊝ | ‐ | |
| 111 per 1000 | 111 per 1000 | |||||
| Moderate | ||||||
| 114 per 1000 | 114 per 1000 | |||||
| Participant level outcomes: 1. Global state: GAF at 12 months | ‐ | The mean participant level outcomes: global state: GAF at 12 months in the intervention groups was | ‐ | 335 | ⊕⊕⊕⊝ | |
| Participant level outcomes: 2. Satisfaction with care: perceived coercion or leverage at 11 to 12 months | Study population | RR 1.3 | 645 | ⊕⊕⊕⊝ | ‐ | |
| 212 per 1000 | 275 per 1000 | |||||
| Moderate | ||||||
| 200 per 1000 | 260 per 1000 | |||||
| Other pre‐stated participant level outcomes of interest: Social functioning: trouble with police, homeless; Quality of life: victimisation; not reported | ||||||
| *The basis for the assumed risk (e.g. the median control group risk across studies) is provided in footnotes. The corresponding risk (and its 95% confidence interval) is based on the assumed risk in the comparison group and the relative effect of the intervention (and its 95% CI). | ||||||
| GRADE Working Group grades of evidence | ||||||
| 1 Forty people (25%) allocated to Section 17 were subsequently placed on a CTO during the study. 2 35 people randomised to compulsory community treatments (22%) did not actually receive the intervention. 3 No adverse events reported. | ||||||
| Outcome or subgroup title | No. of studies | No. of participants | Statistical method | Effect size |
| 1 Health service outcomes: 1. Readmission to hospital ‐ by 11 to 12 months Show forest plot | 2 | 416 | Risk Ratio (M‐H, Fixed, 95% CI) | 0.98 [0.79, 1.21] |
| 2 Health service outcomes: 2. Hospital bed‐days Show forest plot | 1 | 264 | Mean Difference (IV, Fixed, 95% CI) | ‐1.24 [‐15.16, 12.68] |
| 3 Health service outcomes: 3. Number with multiple readmissions by 12 months Show forest plot | 1 | 152 | Risk Ratio (M‐H, Fixed, 95% CI) | 1.87 [0.87, 4.01] |
| 4 Health service outcomes: 4. Compliance with medication by 11 to 12 months Show forest plot | 2 | 416 | Risk Ratio (M‐H, Fixed, 95% CI) | 0.99 [0.83, 1.19] |
| 5 Participant level outcomes: 1. Mental state ‐ psychiatric symptoms and global state at 11 to 12 months Show forest plot | 1 | 98 | Mean Difference (IV, Fixed, 95% CI) | ‐3.0 [‐8.08, 2.08] |
| 6 Participant level outcomes: 2. Social functioning: trouble with police by 11 to 12 months Show forest plot | 2 | Risk Ratio (M‐H, Fixed, 95% CI) | Subtotals only | |
| 6.1 at least 1 arrest | 2 | 416 | Risk Ratio (M‐H, Fixed, 95% CI) | 0.97 [0.62, 1.52] |
| 6.2 ever arrested/picked up by police for violence against a person | 2 | 416 | Risk Ratio (M‐H, Fixed, 95% CI) | 0.82 [0.56, 1.21] |
| 7 Participant level outcomes: 3. Social functioning: homeless by 11 to 12 months Show forest plot | 2 | 416 | Risk Ratio (M‐H, Fixed, 95% CI) | 0.67 [0.39, 1.15] |
| 8 Participant level outcomes: 4. Quality of life: Lehman Quality of Life Scale Show forest plot | 2 | 406 | Mean Difference (IV, Random, 95% CI) | ‐0.22 [‐0.95, 0.50] |
| 9 Participant level outcomes: 5. Quality of life: victimisation by 11 to 12 months Show forest plot | 1 | 264 | Risk Ratio (M‐H, Fixed, 95% CI) | 0.50 [0.31, 0.80] |
| 10 Participant level outcomes: 6. Satisfaction with care: perceived coercion by 11 to 12 months Show forest plot | 2 | 416 | Risk Ratio (M‐H, Fixed, 95% CI) | 1.36 [0.97, 1.89] |
| Outcome or subgroup title | No. of studies | No. of participants | Statistical method | Effect size |
| 1 Health service outcomes: 1a. Readmission to hospital ‐ by 12 months Show forest plot | 1 | 333 | Risk Ratio (M‐H, Fixed, 95% CI) | 0.99 [0.74, 1.32] |
| 2 Health service outcomes. 1b. Readmission to hospital by 36 months Show forest plot | 1 | Odds Ratio (M‐H, Fixed, 95% CI) | Subtotals only | |
| 2.1 Readmission | 1 | 330 | Odds Ratio (M‐H, Fixed, 95% CI) | 0.71 [0.45, 1.11] |
| 2.2 > 1 readmission | 1 | 213 | Odds Ratio (M‐H, Fixed, 95% CI) | 1.07 [0.62, 1.85] |
| 3 Health service outcomes: 2. Hospital bed‐days by 12 months Show forest plot | 1 | 333 | Mean Difference (IV, Fixed, 95% CI) | ‐8.70 [‐30.88, 13.48] |
| 4 Health service outcomes: 3. Number of readmissions by 12 months Show forest plot | 1 | 119 | Mean Difference (IV, Fixed, 95% CI) | ‐0.20 [‐0.45, 0.05] |
| 5 Health service outcomes: 4. Number with multiple readmissions by 12 months Show forest plot | 1 | 333 | Risk Ratio (M‐H, Fixed, 95% CI) | 0.56 [0.27, 1.17] |
| 6 Health service outcomes: 5a. Days in community till first admission by 12 months Show forest plot | 1 | 333 | Mean Difference (IV, Fixed, 95% CI) | 5.0 [‐21.74, 31.74] |
| 7 Health service outcomes: 5b. Days in community till first admission and mean duration of bed‐days by 36 months Show forest plot | 1 | Mean Difference (IV, Fixed, 95% CI) | Subtotals only | |
| 7.1 Time to 1st readmission in days | 1 | 330 | Mean Difference (IV, Fixed, 95% CI) | 60.0 [‐27.62, 147.62] |
| 7.2 Mean duration of bed‐days | 1 | 212 | Mean Difference (IV, Fixed, 95% CI) | ‐15.10 [‐89.39, 59.19] |
| 8 Participant level outcomes: 1. Mental state ‐ psychiatric symptoms at 12 months (BPRS) Show forest plot | 1 | 234 | Mean Difference (IV, Fixed, 95% CI) | ‐0.10 [‐3.17, 2.97] |
| 9 Participant level outcomes: 2. Global state: GAF at 12 months Show forest plot | 1 | 237 | Mean Difference (IV, Fixed, 95% CI) | ‐0.70 [‐3.91, 2.51] |
| 10 Participant level outcomes: 3. Satisfaction with care: perceived coercion at 11 to 12 months Show forest plot | 1 | 182 | Mean Difference (IV, Fixed, 95% CI) | ‐0.5 [‐1.71, 0.71] |
| 11 Participant level outcomes: 4. Satisfaction with care: leverage at 11 to 12 months Show forest plot | 1 | 229 | Odds Ratio (M‐H, Fixed, 95% CI) | 1.23 [0.66, 2.31] |
| 12 Participant level outcomes: 5. Social Outcomes Index at 12 months Show forest plot | 1 | 236 | Mean Difference (IV, Fixed, 95% CI) | ‐0.10 [‐0.40, 0.20] |
| Outcome or subgroup title | No. of studies | No. of participants | Statistical method | Effect size |
| 1 Health service outcomes: 1. Readmission to hospital by 11 to 12 months Show forest plot | 3 | 749 | Risk Ratio (M‐H, Fixed, 95% CI) | 0.98 [0.83, 1.17] |
| 2 Health service outcomes: 2. Hospital bed‐days Show forest plot | 2 | 597 | Mean Difference (IV, Fixed, 95% CI) | ‐3.35 [‐15.14, 8.44] |
| 3 Health service outcomes: 3. Number with multiple readmissions by 12 months Show forest plot | 2 | 485 | Risk Ratio (M‐H, Random, 95% CI) | 1.02 [0.31, 3.33] |
| 4 Participant level outcomes: 1. global state: GAF at 12 months Show forest plot | 2 | 335 | Mean Difference (IV, Fixed, 95% CI) | ‐1.36 [‐4.07, 1.35] |
| 5 Participant level outcomes: 2. Satisfaction with care: perceived coercion or leverage at 11 to 12 months Show forest plot | 3 | 645 | Risk Ratio (M‐H, Fixed, 95% CI) | 1.30 [0.98, 1.71] |