Obvezno liječenje u zajednici i prisilno izvanbolničko liječenje za ljude s teškim mentalnim poremećajima
Appendices
Appendix 1. Search strategies
Search in 2003
1. Cochrane Schizophrenia Group's Register (May 2003)
We searched using the phrase:
[((community* AND treatment* AND order*) OR (involuntary* AND outpatient* AND treatment*) OR (involuntary* AND outpatient* AND commitment*) OR (extended* AND leave*) in Title or (*community* AND *treatment* AND *order*) OR (*involuntary* AND *outpatient* AND *treatment*) OR (*involuntary* AND *outpatient* AND *commitment*) OR (*extended* AND *leave*) or (*supervised* AND *discharge*) in title, abstract, index terms of REFERENCE] or Involuntary Commitment in intervention of STUDY)]
The Schizophrenia Groups trials register is based on regular searches of BIOSIS Inside; CENTRAL; 95% CINAHL; EMBASE; MEDLINE and PsycINFO; the hand searching of relevant journals and conference proceedings, and searches of several key grey literature sources. A full description is given in the Group's module.
2. Cochrane Library (2003, Issue 2)
We searched using the phrase:
[(exp Commitment of Mentally Ill/ or (community NEAR treatment NEAR order) or (involuntary NEAR outpatient NEAR treatment) or (involuntary NEAR outpatient NEAR commitment) or (extended NEAR leave) or (supervised NEAR discharge)]
3. BIOSIS (1985 to July 2003)
We searched using the phrase:
[(Commitment AND Mentally AND Ill or (extended AND leave) or (community AND treatment AND order) or (involuntary AND outpatient AND treatment) or (involuntary AND outpatient AND commitment) or (extended AND leave) or (supervised AND discharge) or (mandatory AND programs))]
4. 95% CINAHL (1982 to July 2003)
We searched using the Cochrane Schizophrenia Group's phrase for randomised controlled trials combined with:
[(exp Involuntary Commitment/ or exp Hospitalization/ or (extended adj1 leave) or (community adj2 treatment adj2 order) or exp "NONCOMPLIANCE (NANDA)"/ or (involuntary adj3 outpatient adj3 treatment) or (involuntary adj3 outpatient adj3 commitment) or (supervised adj2 discharge) or (mandatory adj3 programs) or (extended adj3 leave))
5. EMBASE (1980 to July 2003)
We searched using the Cochrane Schizophrenia Group's phrase for randomised controlled trials combined with:
[(exp Commitment of Mentally Ill/ or (extended adj1 leave) or (community adj2 treatment adj2 order) or (involuntary adj3 outpatient adj3 treatment) or (involuntary adj3 outpatient adj3 commitment) or (extended adj3 leave) or (supervised adj2 discharge) or (mandatory adj3 programs))
6. MEDLINE (1966 to July 2003)
We searched using the Cochrane Schizophrenia Group's phrase for randomised controlled trials combined with:
[(exp Commitment of Mentally Ill/ or jurisprudence/ or exp mandatory programs/ or (extended adj1 leave) or (community adj2 treatment adj2 order) or (involuntary adj3 outpatient adj3 treatment) or (involuntary adj3 outpatient adj3 commitment) or (extended adj leave) or (extended adj3 leave) or (supervised adj2 discharge))
7. PsycINFO (1872 to July 2003)
We searched using the Cochrane Schizophrenia Group's phrase for randomised controlled trials combined with:
[(exp outpatient commitment/ or exp Legal Processes/ or exp "Commitment (Psychiatric)"/ or exp Psychiatric Hospitalization/ or exp Laws/ or exp Involuntary Treatment/ or (community adj2 treatment adj2 order) or (involuntary adj3 outpatient adj3 treatment) or (involuntary adj3 outpatient adj3 commitment) or (extended adj3 leave) or (supervised adj2 discharge) or (mandatory adj3 programs))]
8. S95% CISEARCH
Science Citation Index: we sought each of the included studies as a citation on the S95% CISEARCH database. We then inspected reports of articles that had cited these studies to identify further trials.
9. Google ‐ Internet search engine (July 2003)
We searched the Internet to identify any relevant publications using the following terms:
community treatment order, involuntary outpatient treatment, involuntary outpatient commitment, extended leave, extended release or supervised discharge.
Search in 2008
We searched the Cochrane Schizophrenia Group's register using the phrase:
[(((*treatment* AND * order* within the same field) OR *(involuntar* AND *outpatient* within the same field) OR (*extend* AND *leave* within the same field) OR (*supervis* AND *discharg* within the same field) OR (*compulsor* or *compulsion*) in title abstract or index terms of REFERENCE) OR (*commitment of mentally ill* in index terms of REFERENCE) OR (Involuntary* OR Outpatient* intervention of STUDY)]
This register is compiled by systematic searches of major databases, handsearches, and conference proceedings (see group module).
Additional searches by authors
1. Cochrane Library (2008, Issue 2)
We searched using the phrase:
[(exp Commitment of Mentally Ill/ or (community NEAR treatment NEAR order) or (involuntary NEAR outpatient NEAR treatment) or (involuntary NEAR outpatient NEAR commitment) or (extended NEAR leave) or (supervised NEAR discharge)]
2. BIOSIS (1985 to December 2008)
We searched using the phrase:
[(Commitment AND Mentally AND Ill or (extended AND leave) or (community AND treatment AND order) or (involuntary AND outpatient AND treatment) or (involuntary AND outpatient AND commitment) or (extended AND leave) or (supervised AND discharge) or (mandatory AND programs))]
3. 95% CINAHL (1982 to December 2008)
We searched using the Cochrane Schizophrenia Group's phrase for randomised controlled trials combined with:
[(exp Involuntary Commitment/ or exp Hospitalisation/ or (extended adj1 leave) or (community adj2 treatment adj2 order) or exp "NONCOMPLIANCE (NANDA)"/ or (involuntary adj3 outpatient adj3 treatment) or (involuntary adj3 outpatient adj3 commitment) or (supervised adj2 discharge) or (mandatory adj3 programs) or (extended adj3 leave))
4. EMBASE (1980 to December 2008)
We searched using the Cochrane Schizophrenia Group's phrase for randomised controlled trials combined with:
[(exp Commitment of Mentally Ill/ or (extended adj1 leave) or (community adj2 treatment adj2 order) or (involuntary adj3 outpatient adj3 treatment) or (involuntary adj3 outpatient adj3 commitment) or (extended adj3 leave) or (supervised adj2 discharge) or (mandatory adj3 programs))
5. MEDLINE (1966 to December 2008)
We searched using the Cochrane Schizophrenia Group's phrase for randomised controlled trials combined with:
[(exp Commitment of Mentally Ill/ or jurisprudence/ or exp mandatory programs/ or (extended adj1 leave) or (community adj2 treatment adj2 order) or (involuntary adj3 outpatient adj3 treatment) or (involuntary adj3 outpatient adj3 commitment) or (extended adj leave) or (extended adj3 leave) or (supervised adj2 discharge))
6. PsycINFO (1872 to December 2008)
We searched using the Cochrane Schizophrenia Group's phrase for randomised controlled trials combined with:
[(exp outpatient commitment/ or exp Legal Processes/ or exp "Commitment (Psychiatric)"/ or exp Psychiatric Hospitalization/ or exp Laws/ or exp Involuntary Treatment/ or (community adj2 treatment adj2 order) or (involuntary adj3 outpatient adj3 treatment) or (involuntary adj3 outpatient adj3 commitment) or (extended adj3 leave) or (supervised adj2 discharge) or (mandatory adj3 programs))]
7. S95% CISEARCH ‐ Science Citation Index
We sought each of the included studies as a citation on the S95% CISEARCH database. We then inspected reports of articles that had cited these studies to identify further trials.
8. Google ‐ Internet search engine (December 2008)
We searched the Internet to identify any relevant publications using the following terms:
community treatment order, involuntary outpatient treatment, involuntary outpatient commitment, extended leave, extended release or supervised discharge.
Search in 2012
Cochrane Schizophrenia Group's Trials Register (July 2012)
Sam Roberts, the Trial Search Co‐ordinator, searched the Cochrane Schizophrenia Group’s Trials Register (July 2012) using the phrase:
[(((*treatment* AND * order* within the same field) OR *(involuntar* AND *outpatient* within the same field) OR (*extend* AND *leave* within the same field) OR (*supervis* AND *discharg* within the same field) OR (*compulsor* or *compulsion*) in title abstract or index terms of REFERENCE) OR (*commitment of mentally ill* in index terms of REFERENCE) OR (Involuntary* OR Outpatient* intervention of STUDY)]
The Cochrane Schizophrenia Group’s Trials Register is compiled by systematic searches of major databases, handsearches of journals and conference proceedings (see Group Module). Incoming trials are assigned to relevant existing or new review titles.
Search in 2013
Cochrane Schizophrenia Group's Trials Register
The Trials Search Coordinator (TSC) searched the Cochrane Schizophrenia Group’s Registry of Trials (8 November 2013) using the following search strategies:
((*treatment* and *order*) or (*involuntar* and *outpatient*) or (*extend* and *leave*) or (*supervis* and *discharg*) or (*compulsor* or *compulsion*)) in Title, Abstract and Keyword Fields of REFERENCE and (Involuntary* or Outpatient*) in Intervention Field of STUDY
The Cochrane Schizophrenia Group’s Registry of Trials is compiled by systematic searches of major resources (including AMED, BIOSIS, 95% CINAHL, EMBASE, MEDLINE, PsycINFO, PubMed, and registries of clinical trials) and their monthly updates, handsearches, grey literature, and conference proceedings (see Group Module). There is no language, date, document type, or publication status limitations for inclusion of records into the register.
Appendix 2. Previous data collection and analysis
1. Extraction
Two review authors (SK and LAC) independently extracted data from included studies. We discussed any disagreement, documented our decisions and, if necessary, we contacted the authors of studies for clarification. Whenever possible we only extracted data presented in graphs and figures, we only included data if two review authors independently had the same result. We made attempts to contact authors through an open‐ended request in order to obtain any missing information or for clarification whenever necessary. Where possible, we extracted data relevant to each component centre of multicentre studies separately.
2. Management
2.1. Forms
Two review authors (SK and LAC) extracted data onto standard, simple forms.
2.2. Data from multi‐centre trials
Where possible, the review authors verified independently calculated centre data against original trial reports.
3. Rating scales
A wide range of instruments is available to measure outcomes in mental and physical health studies. They vary in quality and are often not validated or are created for a particular study. It is accepted generally that measuring instruments should be both reliable and have reasonable validity (Rust 1989). We included continuous data from rating scales only if the measuring instrument had been described in a peer‐reviewed journal (Marshall 2000); and not those written or modified by one of the trialists for a particular trial.
4. Endpoint versus change data
We preferred to use scale endpoint data, which typically cannot have negative values and are easier to interpret from a clinical point of view. Change data are often not ordinal and are very problematic to interpret. If endpoint data were unavailable, we used change data.
5. Skewed data
Continuous data on clinical and social outcomes are often not normally distributed. To avoid the problem of applying parametric tests to non‐parametric data, we aimed to apply the following standards to all data before inclusion:
-
standard deviations and means are reported in the paper or obtainable from the authors;
-
when a scale starts from the finite number zero, the standard deviation, when multiplied by two, is less than the mean (as otherwise the mean is unlikely to be an appropriate measure of the centre of the distribution (Altman 1996);
-
if a scale starts from a positive value (such as PANSS which can have values from 30 to 210) the calculation described above will be modified to take the scale starting point into account. In these cases, skew is present if 2 SD > (S ‐ Smin), where S is the mean score and Smin is the minimum score. Endpoint scores on scales often have a finite start and endpoint and these rules can be applied. When continuous data are presented on a scale which includes a possibility of negative values (such as change data), it is difficult to determine whether data are skewed or not. We entered skewed data from studies of fewer than 200 participants in additional tables rather than into an analysis. Skewed data pose less of a problem when looking at means if the sample size is large, and we entered skewed data from large sample sizes into syntheses.
6. Common measure
To facilitate comparison between trials, we intended to convert variables that could be reported in different metrics, such as days in hospital (mean days per year, per week or per month) to a common metric (e.g. mean days per month).
7. Conversion of continuous to binary
Where possible, we made efforts to convert outcome measures to dichotomous data. This could be done by identifying cut‐off points on rating scales and dividing participants accordingly into 'clinically improved' or 'not clinically improved'. It was generally assumed that if there had been a 50% reduction in a scale‐derived score such as the Brief Psychiatric Rating Scale (BPRS; Overall 1962) or the Positive and Negative Syndrome Scale (PANSS; Kay 1986; Kay 1987), this could be considered as a clinically significant response (Leucht 2005a; Leucht 2005b). If data based on these thresholds were not available, we used the primary cut‐off presented by the original authors.
8. Direction of graphs
Where possible, we entered data in such a way that the area to the left of the line of no effect indicates a favourable outcome for the experimental intervention.
Assessment of risk of bias in included studies
Two review authors (SK and LAC) independently assessed risk of bias using the tool described in the Cochrane Handbook for Systematic Reviews of Interventions (Higgins 2008). This tool encourages consideration of how the sequence was generated, how allocation was concealed, the integrity of blinding at outcome, the completeness of outcome data, selective reporting and other biases. We would have excluded studies where allocation was clearly not concealed.
We removed trials with high risk of bias (defined as at least three out of six domains categorised as 'No') from the 'included' category. If the raters disagreed, we made the final rating by consensus with the involvement of another member of the review group. Where inadequate details of randomisation and other characteristics of trials are provided, we contacted authors of the studies in order to obtain further information. We reported non‐concurrence in quality assessment.
Measures of treatment effect
1. Binary data
For binary outcomes, we calculated a standard estimation of the fixed‐effect risk ratio (RR) and its 95% confidence interval (CI) as well as the number needed to treat for an additional beneficial outcome (NNTB) or harmful outcome (NNTH). We calculated these using the methodology of Cook 1995 for the results that were not significant. If statistically significant, we took into account the event rate in the control group (Bandolier 1995). If we found heterogeneity, then we made a decision about whether a quantitative synthesis (meta‐analysis) was the appropriate method of summarising this body of research and used a random‐effects model.
2. Continuous data
For continuous outcomes, we estimated a mean difference (MD) between groups. If we found heterogeneity, then we made a decision about whether a quantitative synthesis (meta‐analysis) was the appropriate method of summarising this body of research and used a random‐effects model.
Unit of analysis issues
1. Cluster trials
We stated in our protocol that we would account for cluster randomisation in our analysis (Kisely 2004). However, both studies identified in our review were randomised by participant, not by clinician or practice. Studies increasingly employ 'cluster randomisation' (such as randomisation by clinician or practice) but analysis and pooling of clustered data poses problems. Authors often fail to account for intraclass correlation in clustered studies, leading to a 'unit of analysis' error (Divine 1992), whereby P values are spuriously low, CIs unduly narrow and statistical significance overestimated. This causes type I errors (Bland 1997; Gulliford 1999).
If clustering had not been accounted for in primary studies, we would have presented data in a table, with a (*) symbol to indicate the presence of a probable unit of analysis error. In subsequent versions of this review, we sought to contact first authors of studies to obtain intraclass correlation coefficient (ICC) of their clustered data and to adjust for this by using accepted methods (Gulliford 1999). Should clustering have been incorporated into the analysis of primary studies, we would have presented these data as if from a non‐cluster randomised study, but adjusted for the clustering effect.
We have sought statistical advice and have been advised that the binary data as presented in a report should be divided by a 'design effect'. This is calculated using the mean number of participants per cluster (m) and the ICC (design effect = 1 + (m ‐ 1) × ICC) (Donner 2002). If the ICC had not been reported, we would have assumed it to be 0.1 (Ukoumunne 1999).
If cluster studies had been appropriately analysed taking into account ICC and relevant data documented in the report, synthesis with other studies would have been possible using the generic inverse variance technique.
2. Cross‐over trials
A major concern of cross‐over trials is the carry‐over effect. It occurs if an effect (e.g. pharmacological, physiological or psychological) of the treatment in the first phase is carried over to the second phase. As a consequence, on entry to the second phase, the participants can differ systematically from their initial state despite a washout phase. For the same reason, cross‐over trials are not appropriate if the condition of interest is unstable (Elbourne 2002). As both effects are very likely in serious mental illness, we would only have used data of the first phase of cross‐over studies.
3. Studies with multiple treatment groups
Where a study involved more than two treatment arms, if relevant, we presented the additional treatment arms in comparisons. Where the additional treatment arms were not relevant, we did not reproduce these data.
Dealing with missing data
Reports of trials should give an adequate description of the loss of participants in terms of the number of withdrawals, dropouts and protocol deviations. We conducted an intention‐to‐treat analysis, including all those who were randomised to either compulsory community treatment or control, regardless of subsequent disposition.
1. Overall loss of credibility
At some degree of loss of follow‐up, data must lose credibility (Xia 2009). For any particular outcome, should more than 35% of data be unaccounted for, we had stated that we would not reproduce these data or use them within analyses (Kisely 2004). However, the New York study reported attrition rates of approximately 45% for 11‐month outcomes (Steadman 2001). As we were only able to identify two randomised controlled trials, we decided to subject this high attrition study to a sensitivity analysis. If we found that inclusion of these data resulted in a substantive change in the estimate of effect, we would not add them to results from Swartz 1999, but present them separately. This is a considerable post hoc change from the original protocol (see Differences between protocol and review).
2. Binary
In the case where attrition for a binary outcome is between 0% and 50% and where these data were not clearly described, we presented data on a 'once‐randomised‐always‐analyse' basis (an intention‐to‐treat analysis). Participants lost to follow‐up were all assumed to have the same rates of negative outcome as participants who completed, with the exception of the outcome of death. We undertook a sensitivity analysis testing how prone the primary outcomes were to change when 'completed' data only were compared to the intention‐to‐treat analysis using the above assumption.
3. Continuous
3.1. Attrition
In the case where attrition for a continuous outcome was between 0% and 50% and completer‐only data were reported, we have reproduced these.
3.2. Standard deviations
Where there were missing measures of variance for continuous data but exact standard error and CIs were available for group means, either P values or T values were available for differences in mean, we calculated standard deviation values according to method described in Section 7.7.3 of the Cochrane Handbook for Systemic Reviews of Interventions (Higgins 2008). If standard deviations were not reported and could not be calculated from available data, we asked authors to supply the data. In the absence of data from authors, we used the mean standard deviation from other studies.
3.3. Last observation carried forward
We anticipated that some studies would employ the method of last observation carried forward (LOCF). As with all methods of imputation to deal with missing data, LOCF introduces uncertainty about the reliability of the results. Therefore, where LOCF data were used in the trial, if less than 50% of the data had been assumed, we reproduced these data, and indicated that they are the product of LOCF assumptions.
Assessment of heterogeneity
1. Clinical heterogeneity
To judge clinical heterogeneity, we considered all included studies, initially without seeing comparison data. We simply inspected all studies for clearly outlying situations or people which we had not predicted would arise. Should such situations or participant groups arise we fully discussed these.
2. Methodological heterogeneity
We considered all included studies initially, without seeing comparison data, to judge methodological heterogeneity. We simply inspected all studies for clearly outlying methods which we had not predicted would arise. Should such methodological outliers arise we fully discussed these.
3. Statistical
3.1. Visual inspection
We visually inspected graphs to investigate the possibility of statistical heterogeneity.
3.2. Employing the I2 statistic
We investigated heterogeneity between studies by considering the I2 statistic alongside the P value of the Chi2 test. The I2 statistic provides an estimate of the percentage of inconsistency thought to be due to chance (Higgins 2003). The importance of the observed value of I2 statistic depends on the magnitude and direction of effects and the strength of evidence for heterogeneity (e.g. P value from Chi2 test, or a CI for the I2 statistic).
We interpreted an I2 statistic estimate of 75% or greater accompanied by a statistically significant Chi2 statistic as evidence of substantial levels of heterogeneity (Section 9.5.2 of the Cochrane Handbook for Systemic Reviews of Interventions; Higgins 2008) and explored reasons for heterogeneity. If the inconsistency was high and we found clear reasons, we presented data separately.
Assessment of reporting biases
Reporting biases arise when the dissemination of research findings is influenced by the nature and direction of results (Egger 1997). These are described in Section 10 of the of the Cochrane Handbook for Systemic Reviews of Interventions (Higgins 2008). We are aware that funnel plots may be useful in investigating reporting biases but are of limited power to detect small‐study effects. We did not use funnel plots for outcomes where there were 10 or fewer studies, or where all studies were of similar sizes. In other cases, where funnel plots were possible, we sought statistical advice in their interpretation. Because there were never more than two studies for each outcome, we were unable to use this technique to investigate publication/small‐study bias.
Data synthesis
We understand that there is no closed argument for preference for use of fixed‐effect or random‐effects models. The random‐effects method incorporates an assumption that the different studies are estimating different, yet related, intervention effects. This often seems to be true to us and the random‐effects model takes into account differences between studies even if there is no statistically significant heterogeneity. However, there is a disadvantage to the random‐effects model. It puts added weight onto small studies which often are the most biased ones. Depending on the direction of effect, these studies can either inflate or deflate the effect size. Therefore, we chose the fixed‐effect model for all analyses. However, the reader is able to choose to inspect the data using the random model.
Subgroup analysis and investigation of heterogeneity
1. Subgroups
In earlier versions of this review we were unable to investigate any differences in outcome between types of CCT (e.g. CTOs, involuntary outpatient treatment, involuntary outpatient commitment or supervised discharge).
2. Investigation of heterogeneity
2.1. Unanticipated heterogeneity
Should unanticipated clinical or methodological heterogeneity have been obvious, we would have simply stated hypotheses regarding these for future reviews or versions of this review. We did not anticipate undertaking analyses relating to these.
2.2. Anticipated heterogeneity
We did not anticipate specific reasons for heterogeneity.
Sensitivity analysis
We had anticipated undertaking a sensitivity analysis for primary outcomes should randomisation be implied rather than been stated explicitly. This analysis was not necessary with the two included studies.

Study flow diagram.

'Risk of bias' graph: review authors' judgements about each risk of bias item presented as percentages across all included studies.
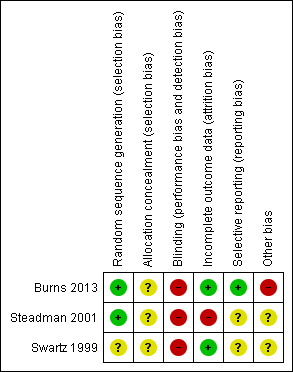
'Risk of bias' summary: review authors' judgements about each risk of bias item for each included study.
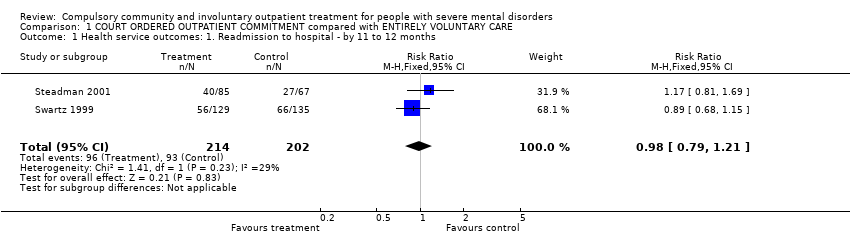
Comparison 1 COURT ORDERED OUTPATIENT COMMITMENT compared with ENTIRELY VOLUNTARY CARE, Outcome 1 Health service outcomes: 1. Readmission to hospital ‐ by 11 to 12 months.

Comparison 1 COURT ORDERED OUTPATIENT COMMITMENT compared with ENTIRELY VOLUNTARY CARE, Outcome 2 Health service outcomes: 2. Hospital bed‐days.
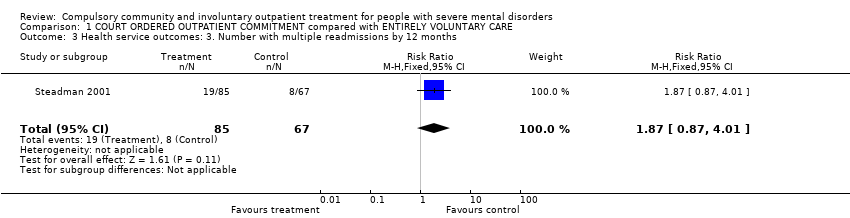
Comparison 1 COURT ORDERED OUTPATIENT COMMITMENT compared with ENTIRELY VOLUNTARY CARE, Outcome 3 Health service outcomes: 3. Number with multiple readmissions by 12 months.

Comparison 1 COURT ORDERED OUTPATIENT COMMITMENT compared with ENTIRELY VOLUNTARY CARE, Outcome 4 Health service outcomes: 4. Compliance with medication by 11 to 12 months.

Comparison 1 COURT ORDERED OUTPATIENT COMMITMENT compared with ENTIRELY VOLUNTARY CARE, Outcome 5 Participant level outcomes: 1. Mental state ‐ psychiatric symptoms and global state at 11 to 12 months.

Comparison 1 COURT ORDERED OUTPATIENT COMMITMENT compared with ENTIRELY VOLUNTARY CARE, Outcome 6 Participant level outcomes: 2. Social functioning: trouble with police by 11 to 12 months.

Comparison 1 COURT ORDERED OUTPATIENT COMMITMENT compared with ENTIRELY VOLUNTARY CARE, Outcome 7 Participant level outcomes: 3. Social functioning: homeless by 11 to 12 months.

Comparison 1 COURT ORDERED OUTPATIENT COMMITMENT compared with ENTIRELY VOLUNTARY CARE, Outcome 8 Participant level outcomes: 4. Quality of life: Lehman Quality of Life Scale.

Comparison 1 COURT ORDERED OUTPATIENT COMMITMENT compared with ENTIRELY VOLUNTARY CARE, Outcome 9 Participant level outcomes: 5. Quality of life: victimisation by 11 to 12 months.

Comparison 1 COURT ORDERED OUTPATIENT COMMITMENT compared with ENTIRELY VOLUNTARY CARE, Outcome 10 Participant level outcomes: 6. Satisfaction with care: perceived coercion by 11 to 12 months.

Comparison 2 COMMUNITY TREATMENT ORDERS compared with SUPERVISED DISCHARGE (SECTION 17), Outcome 1 Health service outcomes: 1a. Readmission to hospital ‐ by 12 months.
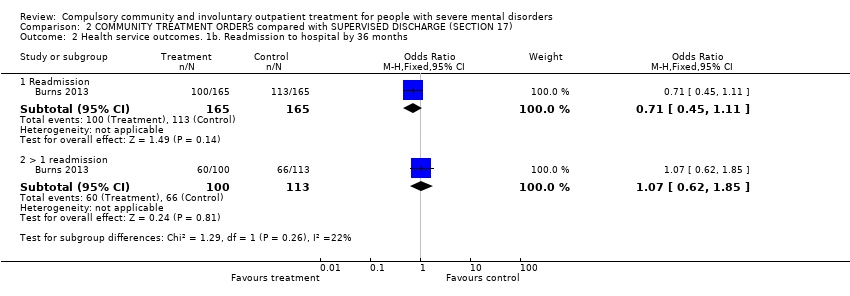
Comparison 2 COMMUNITY TREATMENT ORDERS compared with SUPERVISED DISCHARGE (SECTION 17), Outcome 2 Health service outcomes. 1b. Readmission to hospital by 36 months.

Comparison 2 COMMUNITY TREATMENT ORDERS compared with SUPERVISED DISCHARGE (SECTION 17), Outcome 3 Health service outcomes: 2. Hospital bed‐days by 12 months.

Comparison 2 COMMUNITY TREATMENT ORDERS compared with SUPERVISED DISCHARGE (SECTION 17), Outcome 4 Health service outcomes: 3. Number of readmissions by 12 months.

Comparison 2 COMMUNITY TREATMENT ORDERS compared with SUPERVISED DISCHARGE (SECTION 17), Outcome 5 Health service outcomes: 4. Number with multiple readmissions by 12 months.
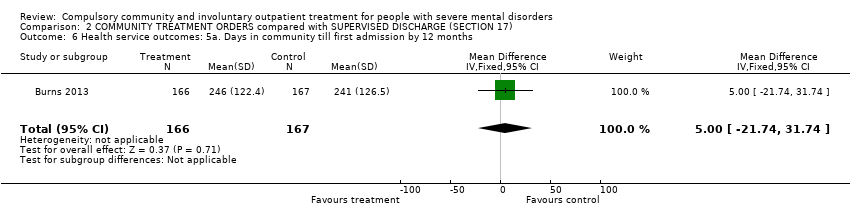
Comparison 2 COMMUNITY TREATMENT ORDERS compared with SUPERVISED DISCHARGE (SECTION 17), Outcome 6 Health service outcomes: 5a. Days in community till first admission by 12 months.

Comparison 2 COMMUNITY TREATMENT ORDERS compared with SUPERVISED DISCHARGE (SECTION 17), Outcome 7 Health service outcomes: 5b. Days in community till first admission and mean duration of bed‐days by 36 months.
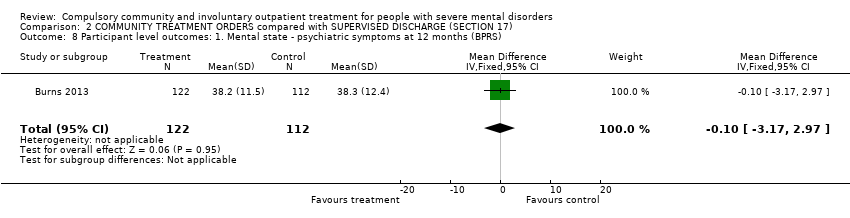
Comparison 2 COMMUNITY TREATMENT ORDERS compared with SUPERVISED DISCHARGE (SECTION 17), Outcome 8 Participant level outcomes: 1. Mental state ‐ psychiatric symptoms at 12 months (BPRS).
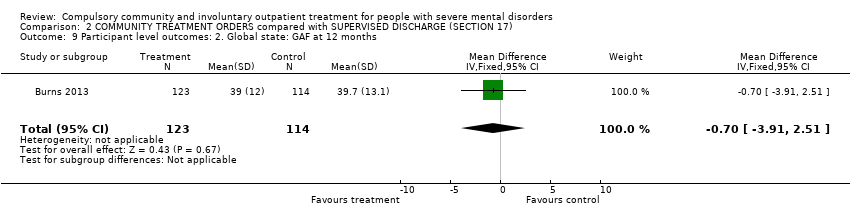
Comparison 2 COMMUNITY TREATMENT ORDERS compared with SUPERVISED DISCHARGE (SECTION 17), Outcome 9 Participant level outcomes: 2. Global state: GAF at 12 months.

Comparison 2 COMMUNITY TREATMENT ORDERS compared with SUPERVISED DISCHARGE (SECTION 17), Outcome 10 Participant level outcomes: 3. Satisfaction with care: perceived coercion at 11 to 12 months.
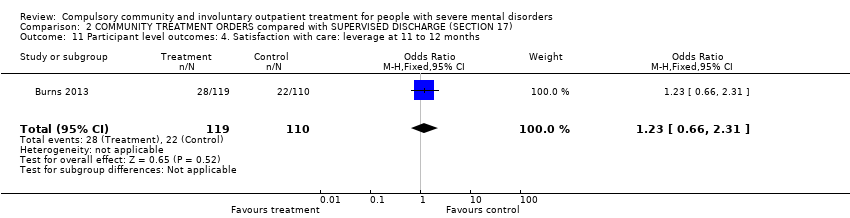
Comparison 2 COMMUNITY TREATMENT ORDERS compared with SUPERVISED DISCHARGE (SECTION 17), Outcome 11 Participant level outcomes: 4. Satisfaction with care: leverage at 11 to 12 months.

Comparison 2 COMMUNITY TREATMENT ORDERS compared with SUPERVISED DISCHARGE (SECTION 17), Outcome 12 Participant level outcomes: 5. Social Outcomes Index at 12 months.
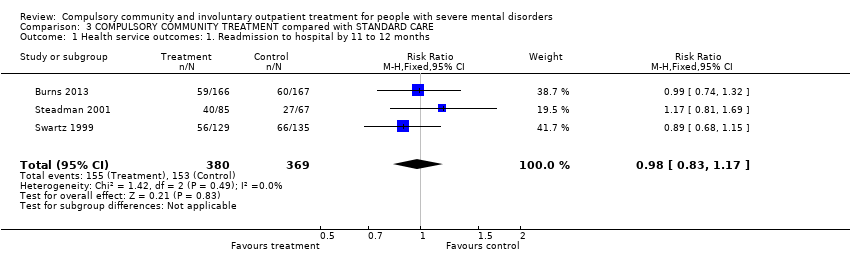
Comparison 3 COMPULSORY COMMUNITY TREATMENT compared with STANDARD CARE, Outcome 1 Health service outcomes: 1. Readmission to hospital by 11 to 12 months.
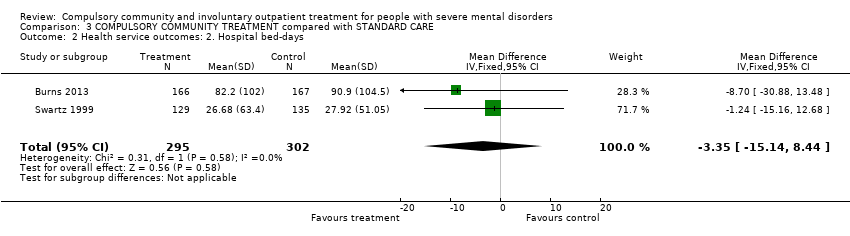
Comparison 3 COMPULSORY COMMUNITY TREATMENT compared with STANDARD CARE, Outcome 2 Health service outcomes: 2. Hospital bed‐days.

Comparison 3 COMPULSORY COMMUNITY TREATMENT compared with STANDARD CARE, Outcome 3 Health service outcomes: 3. Number with multiple readmissions by 12 months.
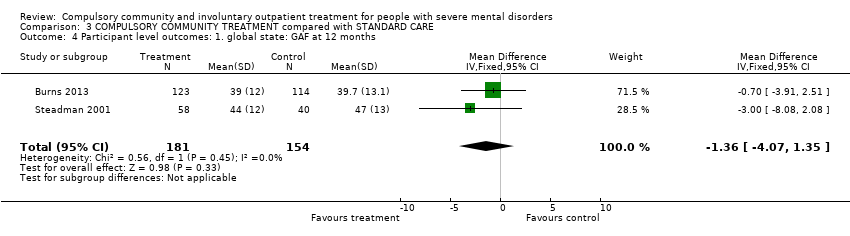
Comparison 3 COMPULSORY COMMUNITY TREATMENT compared with STANDARD CARE, Outcome 4 Participant level outcomes: 1. global state: GAF at 12 months.
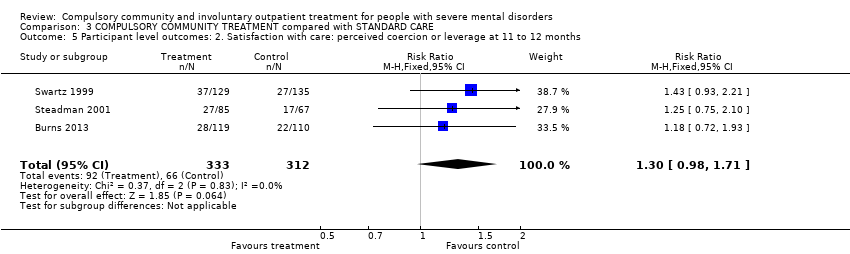
Comparison 3 COMPULSORY COMMUNITY TREATMENT compared with STANDARD CARE, Outcome 5 Participant level outcomes: 2. Satisfaction with care: perceived coercion or leverage at 11 to 12 months.
| COMPULSORY COMMUNITY AND INVOLUNTARY OUTPATIENT TREATMENT FOR PEOPLE WITH SEVERE MENTAL DISORDERS | ||||||
| Patient or population: people with severe mental disorders Settings: patients in community settings Intervention: COURT ORDERED OUTPATIENT COMMITMENT Comparison: ENTIRELY VOLUNTARY CARE | ||||||
| Outcomes | Illustrative comparative risks* (95% CI) | Relative effect | No of participants | Quality of the evidence | Comments | |
| Assumed risk | Corresponding risk | |||||
| VOLUNTARY CARE | COURT ORDERED OUTPATIENT COMMITMENT | |||||
| Health service outcomes: 1. Readmission to hospital by 11 to 12 months | Study population | RR 0.98 | 416 | ⊕⊕⊝⊝ | ‐ | |
| 460 per 1000 | 451 per 1000 | |||||
| Medium risk population | ||||||
| 446 per 1000 | 437 per 1000 | |||||
| Health service outcomes: 4. Compliance with medication by 11 to 12 months | Study population | RR 0.99 | 416 | ⊕⊕⊝⊝ | ‐ | |
| 505 per 1000 | 500 per 1000 | |||||
| Medium risk population | ||||||
| 554 per 1000 | 548 per 1000 | |||||
| Participant level outcomes: 2. Social functioning: trouble with police by 11 to 12 months, at least 1 arrest | Study population | RR 0.97 | 416 | ⊕⊕⊝⊝ | ‐ | |
| 158 per 1000 | 153 per 1000 | |||||
| Medium risk population | ||||||
| 156 per 1000 | 151 per 1000 | |||||
| Participant level outcomes: 2. Social functioning: trouble with police by 11 to 12 months, ever arrested/picked up by police for violence against a person | Study population | RR 0.82 | 416 | ⊕⊕⊝⊝ | ‐ | |
| 208 per 1000 | 171 per 1000 | |||||
| Medium risk population | ||||||
| 156 per 1000 | 128 per 1000 | |||||
| Participant level outcomes: 3. Social functioning: homeless by 11 to 12 months | Study population | RR 0.67 | 416 | ⊕⊕⊝⊝ | ‐ | |
| 134 per 1000 | 90 per 1000 | |||||
| Medium risk population | ||||||
| 145 per 1000 | 97 per 1000 | |||||
| Participant level outcomes: 5. Quality of life: victimisation by 11 to 12 months | Study population | RR 0.5 | 264 | ⊕⊕⊝⊝ | ‐ | |
| 311 per 1000 | 156 per 1000 | |||||
| Medium risk population | ||||||
| 311 per 1000 | 156 per 1000 | |||||
| Participant level outcomes: 6. Satisfaction with care/adverse events: perceived coercion by 11 to 12 months | Study population | RR 1.36 | 416 | ⊕⊕⊝⊝ | ‐ | |
| 218 per 1000 | 296 per 1000 | |||||
| Medium risk population | ||||||
| 227 per 1000 | 309 per 1000 | |||||
| *The basis for the assumed risk (e.g. the median control group risk across studies) is provided in footnotes. The corresponding risk (and its 95% confidence interval) is based on the assumed risk in the comparison group and the relative effect of the intervention (and its 95% CI). | ||||||
| GRADE Working Group grades of evidence | ||||||
| 1 Allocation concealment and blinding unclear: serious risk of bias, downgraded by one level. 2 Only 2 studies, both from the USA: serious imprecision, downgraded by one level. 3 Only 1 study: serious imprecision, downgraded by one level. | ||||||
| COMPULSORY COMMUNITY AND INVOLUNTARY OUTPATIENT TREATMENT FOR PEOPLE WITH SEVERE MENTAL DISORDERS | ||||||
| Patient or population: people with severe mental disorders Settings: community Intervention: COMMUNITY TREATMENT ORDERS Comparison: SUPERVISED DISCHARGE (Section 17) | ||||||
| Outcomes | Illustrative comparative risks* (95% CI) | Relative effect | No of participants | Quality of the evidence | Comments | |
| Assumed risk | Corresponding risk | |||||
| SECTION 17 | COMMUNITY TREATMENT ORDERS | |||||
| Health service outcomes: 1. Readmission to hospital by 12 months | Study population | RR 0.99 | 333 | ⊕⊕⊕⊝ | ‐ | |
| 359 per 1000 | 356 per 1000 | |||||
| Moderate risk population | ||||||
| 359 per 1000 | 355 per 1000 | |||||
| Health service outcomes: 2. Hospital bed‐days by 12 months | ‐ | The mean health service outcomes: 2. total duration of psychiatric hospital stays over 12 months in the intervention groups was | ‐ | 333 | ⊕⊕⊕⊝ | ‐ |
| Health service outcomes: 3. Number of readmissions by 12 months | ‐ | The mean health service outcomes: 3. number of readmissions by 12 months in the intervention groups was | ‐ | 119 | ⊕⊕⊕⊝ | ‐ |
| Health service outcomes: 4. Number with multiple readmissions by 12 months | Study population | RR 0.56 | 333 | ⊕⊕⊕⊝ | ‐ | |
| 108 per 1000 | 60 per 1000 | |||||
| Moderate risk population | ||||||
| 108 per 1000 | 60 per 1000 | |||||
| Health service outcomes: 5. Days in community to first admission by 12 months | ‐ | The mean days in community to 1st admission in the intervention groups was | ‐ | 333 | ⊕⊕⊕⊝ | ‐ |
| Participant level outcomes: 1. Mental state ‐ psychiatric symptoms at 12 months (BPRS) | ‐ | The mean patierticipant level outcomes: BPRS in the intervention groups was | ‐ | 234 | ⊕⊕⊕⊝ | |
| Participant level outcomes: 3. Satisfaction with care: perceived coercion at 11 ‐ 12 months | ‐ | The mean participant level outcomes: Satisfaction with care: perceived coercion intervention groups was | ‐ | 182 | ⊕⊕⊕⊝ | |
| Other pre‐stated participant level outcomes of interest: Social functioning: trouble with police, homeless; Quality of life: victimisation; not reported | ||||||
| *The basis for the assumed risk (e.g. the median control group risk across studies) is provided in footnotes. The corresponding risk (and its 95% confidence interval) is based on the assumed risk in the comparison group and the relative effect of the intervention (and its 95% CI). | ||||||
| GRADE Working Group grades of evidence | ||||||
| 1 Forty people (25%) allocated to Section 17 were subsequently placed on a CTO during the study. 2 35 people randomised to CTOs (22%) did not actually receive the intervention. 3 No adverse events reported. | ||||||
| COMPULSORY COMMUNITY AND INVOLUNTARY OUTPATIENT TREATMENT FOR PEOPLE WITH SEVERE MENTAL DISORDERS | ||||||
| Patient or population: people with severe mental disorders Settings: community Intervention: COMPULSORY COMMUNITY TREATMENT Comparison: STANDARD CARE | ||||||
| Outcomes | Illustrative comparative risks* (95% CI) | Relative effect | No of participants | Quality of the evidence | Comments | |
| Assumed risk | Corresponding risk | |||||
| STANDARD CARE | COMPULSORY COMMUNITY TREATMENT | |||||
| Health service outcomes: 1. Readmission to hospital by 11 to 12 months | Study population | RR 0.98 | 749 | ⊕⊕⊕⊝ | ‐ | |
| 415 per 1000 | 406 per 1000 | |||||
| Moderate | ||||||
| 403 per 1000 | 395 per 1000 | |||||
| Health service outcomes: 2. Hospital bed‐days | ‐ | The mean health service outcomes: 2. hospital bed‐days in the intervention groups was | ‐ | 597 | ⊕⊕⊕⊝ | ‐ |
| Health service outcomes: 3. Number with multiple readmissions by 12 months | Study population | RR 1.0 | 485 | ⊕⊕⊕⊝ | ‐ | |
| 111 per 1000 | 111 per 1000 | |||||
| Moderate | ||||||
| 114 per 1000 | 114 per 1000 | |||||
| Participant level outcomes: 1. Global state: GAF at 12 months | ‐ | The mean participant level outcomes: global state: GAF at 12 months in the intervention groups was | ‐ | 335 | ⊕⊕⊕⊝ | |
| Participant level outcomes: 2. Satisfaction with care: perceived coercion or leverage at 11 to 12 months | Study population | RR 1.3 | 645 | ⊕⊕⊕⊝ | ‐ | |
| 212 per 1000 | 275 per 1000 | |||||
| Moderate | ||||||
| 200 per 1000 | 260 per 1000 | |||||
| Other pre‐stated participant level outcomes of interest: Social functioning: trouble with police, homeless; Quality of life: victimisation; not reported | ||||||
| *The basis for the assumed risk (e.g. the median control group risk across studies) is provided in footnotes. The corresponding risk (and its 95% confidence interval) is based on the assumed risk in the comparison group and the relative effect of the intervention (and its 95% CI). | ||||||
| GRADE Working Group grades of evidence | ||||||
| 1 Forty people (25%) allocated to Section 17 were subsequently placed on a CTO during the study. 2 35 people randomised to compulsory community treatments (22%) did not actually receive the intervention. 3 No adverse events reported. | ||||||
| Outcome or subgroup title | No. of studies | No. of participants | Statistical method | Effect size |
| 1 Health service outcomes: 1. Readmission to hospital ‐ by 11 to 12 months Show forest plot | 2 | 416 | Risk Ratio (M‐H, Fixed, 95% CI) | 0.98 [0.79, 1.21] |
| 2 Health service outcomes: 2. Hospital bed‐days Show forest plot | 1 | 264 | Mean Difference (IV, Fixed, 95% CI) | ‐1.24 [‐15.16, 12.68] |
| 3 Health service outcomes: 3. Number with multiple readmissions by 12 months Show forest plot | 1 | 152 | Risk Ratio (M‐H, Fixed, 95% CI) | 1.87 [0.87, 4.01] |
| 4 Health service outcomes: 4. Compliance with medication by 11 to 12 months Show forest plot | 2 | 416 | Risk Ratio (M‐H, Fixed, 95% CI) | 0.99 [0.83, 1.19] |
| 5 Participant level outcomes: 1. Mental state ‐ psychiatric symptoms and global state at 11 to 12 months Show forest plot | 1 | 98 | Mean Difference (IV, Fixed, 95% CI) | ‐3.0 [‐8.08, 2.08] |
| 6 Participant level outcomes: 2. Social functioning: trouble with police by 11 to 12 months Show forest plot | 2 | Risk Ratio (M‐H, Fixed, 95% CI) | Subtotals only | |
| 6.1 at least 1 arrest | 2 | 416 | Risk Ratio (M‐H, Fixed, 95% CI) | 0.97 [0.62, 1.52] |
| 6.2 ever arrested/picked up by police for violence against a person | 2 | 416 | Risk Ratio (M‐H, Fixed, 95% CI) | 0.82 [0.56, 1.21] |
| 7 Participant level outcomes: 3. Social functioning: homeless by 11 to 12 months Show forest plot | 2 | 416 | Risk Ratio (M‐H, Fixed, 95% CI) | 0.67 [0.39, 1.15] |
| 8 Participant level outcomes: 4. Quality of life: Lehman Quality of Life Scale Show forest plot | 2 | 406 | Mean Difference (IV, Random, 95% CI) | ‐0.22 [‐0.95, 0.50] |
| 9 Participant level outcomes: 5. Quality of life: victimisation by 11 to 12 months Show forest plot | 1 | 264 | Risk Ratio (M‐H, Fixed, 95% CI) | 0.50 [0.31, 0.80] |
| 10 Participant level outcomes: 6. Satisfaction with care: perceived coercion by 11 to 12 months Show forest plot | 2 | 416 | Risk Ratio (M‐H, Fixed, 95% CI) | 1.36 [0.97, 1.89] |
| Outcome or subgroup title | No. of studies | No. of participants | Statistical method | Effect size |
| 1 Health service outcomes: 1a. Readmission to hospital ‐ by 12 months Show forest plot | 1 | 333 | Risk Ratio (M‐H, Fixed, 95% CI) | 0.99 [0.74, 1.32] |
| 2 Health service outcomes. 1b. Readmission to hospital by 36 months Show forest plot | 1 | Odds Ratio (M‐H, Fixed, 95% CI) | Subtotals only | |
| 2.1 Readmission | 1 | 330 | Odds Ratio (M‐H, Fixed, 95% CI) | 0.71 [0.45, 1.11] |
| 2.2 > 1 readmission | 1 | 213 | Odds Ratio (M‐H, Fixed, 95% CI) | 1.07 [0.62, 1.85] |
| 3 Health service outcomes: 2. Hospital bed‐days by 12 months Show forest plot | 1 | 333 | Mean Difference (IV, Fixed, 95% CI) | ‐8.70 [‐30.88, 13.48] |
| 4 Health service outcomes: 3. Number of readmissions by 12 months Show forest plot | 1 | 119 | Mean Difference (IV, Fixed, 95% CI) | ‐0.20 [‐0.45, 0.05] |
| 5 Health service outcomes: 4. Number with multiple readmissions by 12 months Show forest plot | 1 | 333 | Risk Ratio (M‐H, Fixed, 95% CI) | 0.56 [0.27, 1.17] |
| 6 Health service outcomes: 5a. Days in community till first admission by 12 months Show forest plot | 1 | 333 | Mean Difference (IV, Fixed, 95% CI) | 5.0 [‐21.74, 31.74] |
| 7 Health service outcomes: 5b. Days in community till first admission and mean duration of bed‐days by 36 months Show forest plot | 1 | Mean Difference (IV, Fixed, 95% CI) | Subtotals only | |
| 7.1 Time to 1st readmission in days | 1 | 330 | Mean Difference (IV, Fixed, 95% CI) | 60.0 [‐27.62, 147.62] |
| 7.2 Mean duration of bed‐days | 1 | 212 | Mean Difference (IV, Fixed, 95% CI) | ‐15.10 [‐89.39, 59.19] |
| 8 Participant level outcomes: 1. Mental state ‐ psychiatric symptoms at 12 months (BPRS) Show forest plot | 1 | 234 | Mean Difference (IV, Fixed, 95% CI) | ‐0.10 [‐3.17, 2.97] |
| 9 Participant level outcomes: 2. Global state: GAF at 12 months Show forest plot | 1 | 237 | Mean Difference (IV, Fixed, 95% CI) | ‐0.70 [‐3.91, 2.51] |
| 10 Participant level outcomes: 3. Satisfaction with care: perceived coercion at 11 to 12 months Show forest plot | 1 | 182 | Mean Difference (IV, Fixed, 95% CI) | ‐0.5 [‐1.71, 0.71] |
| 11 Participant level outcomes: 4. Satisfaction with care: leverage at 11 to 12 months Show forest plot | 1 | 229 | Odds Ratio (M‐H, Fixed, 95% CI) | 1.23 [0.66, 2.31] |
| 12 Participant level outcomes: 5. Social Outcomes Index at 12 months Show forest plot | 1 | 236 | Mean Difference (IV, Fixed, 95% CI) | ‐0.10 [‐0.40, 0.20] |
| Outcome or subgroup title | No. of studies | No. of participants | Statistical method | Effect size |
| 1 Health service outcomes: 1. Readmission to hospital by 11 to 12 months Show forest plot | 3 | 749 | Risk Ratio (M‐H, Fixed, 95% CI) | 0.98 [0.83, 1.17] |
| 2 Health service outcomes: 2. Hospital bed‐days Show forest plot | 2 | 597 | Mean Difference (IV, Fixed, 95% CI) | ‐3.35 [‐15.14, 8.44] |
| 3 Health service outcomes: 3. Number with multiple readmissions by 12 months Show forest plot | 2 | 485 | Risk Ratio (M‐H, Random, 95% CI) | 1.02 [0.31, 3.33] |
| 4 Participant level outcomes: 1. global state: GAF at 12 months Show forest plot | 2 | 335 | Mean Difference (IV, Fixed, 95% CI) | ‐1.36 [‐4.07, 1.35] |
| 5 Participant level outcomes: 2. Satisfaction with care: perceived coercion or leverage at 11 to 12 months Show forest plot | 3 | 645 | Risk Ratio (M‐H, Fixed, 95% CI) | 1.30 [0.98, 1.71] |