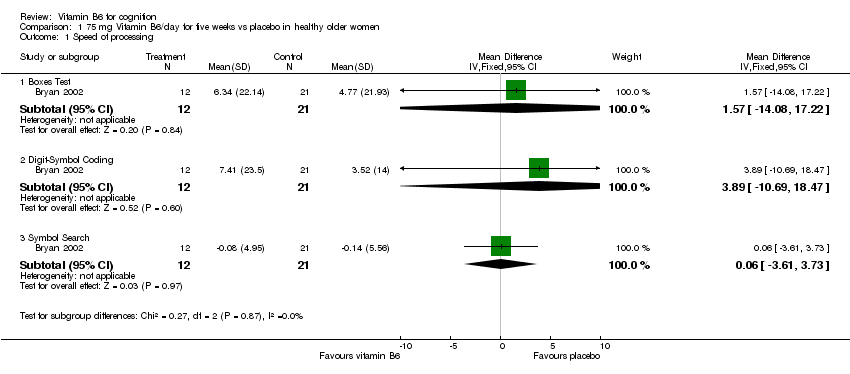
| 1 Speed of processing Show forest plot | 1 | | Mean Difference (IV, Fixed, 95% CI) | Subtotals only |
|
| 1.1 Boxes Test | 1 | 33 | Mean Difference (IV, Fixed, 95% CI) | 1.57 [‐14.08, 17.22] |
| 1.2 Digit‐Symbol Coding | 1 | 33 | Mean Difference (IV, Fixed, 95% CI) | 3.89 [‐10.69, 18.47] |
| 1.3 Symbol Search | 1 | 33 | Mean Difference (IV, Fixed, 95% CI) | 0.06 [‐3.61, 3.73] |
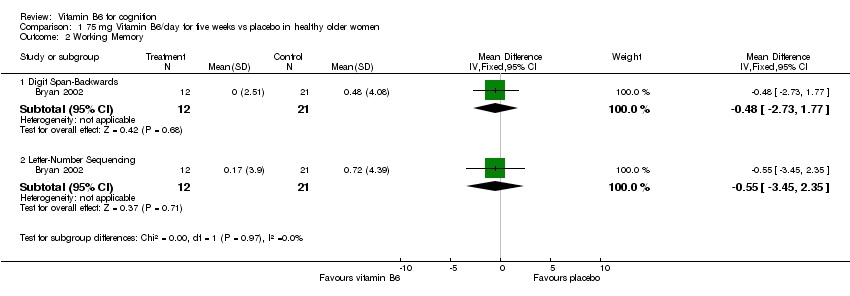
| 2 Working Memory Show forest plot | 1 | | Mean Difference (IV, Fixed, 95% CI) | Subtotals only |
|
| 2.1 Digit Span‐Backwards | 1 | 33 | Mean Difference (IV, Fixed, 95% CI) | ‐0.48 [‐2.73, 1.77] |
| 2.2 Letter‐Number Sequencing | 1 | 33 | Mean Difference (IV, Fixed, 95% CI) | ‐0.55 [‐3.45, 2.35] |
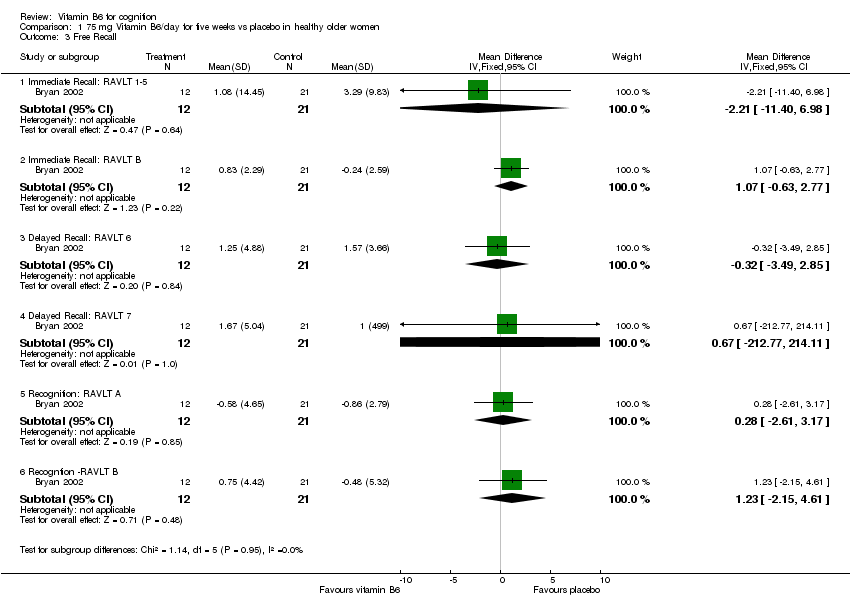
| 3 Free Recall Show forest plot | 1 | | Mean Difference (IV, Fixed, 95% CI) | Subtotals only |
|
| 3.1 Immediate Recall: RAVLT 1‐5 | 1 | 33 | Mean Difference (IV, Fixed, 95% CI) | ‐2.21 [‐11.40, 6.98] |
| 3.2 Immediate Recall: RAVLT B | 1 | 33 | Mean Difference (IV, Fixed, 95% CI) | 1.07 [‐0.63, 2.77] |
| 3.3 Delayed Recall: RAVLT 6 | 1 | 33 | Mean Difference (IV, Fixed, 95% CI) | ‐0.32 [‐3.49, 2.85] |
| 3.4 Delayed Recall: RAVLT 7 | 1 | 33 | Mean Difference (IV, Fixed, 95% CI) | 0.67 [‐212.77, 214.11] |
| 3.5 Recognition: RAVLT A | 1 | 33 | Mean Difference (IV, Fixed, 95% CI) | 0.28 [‐2.61, 3.17] |
| 3.6 Recogntion ‐RAVLT B | 1 | 33 | Mean Difference (IV, Fixed, 95% CI) | 1.23 [‐2.15, 4.61] |
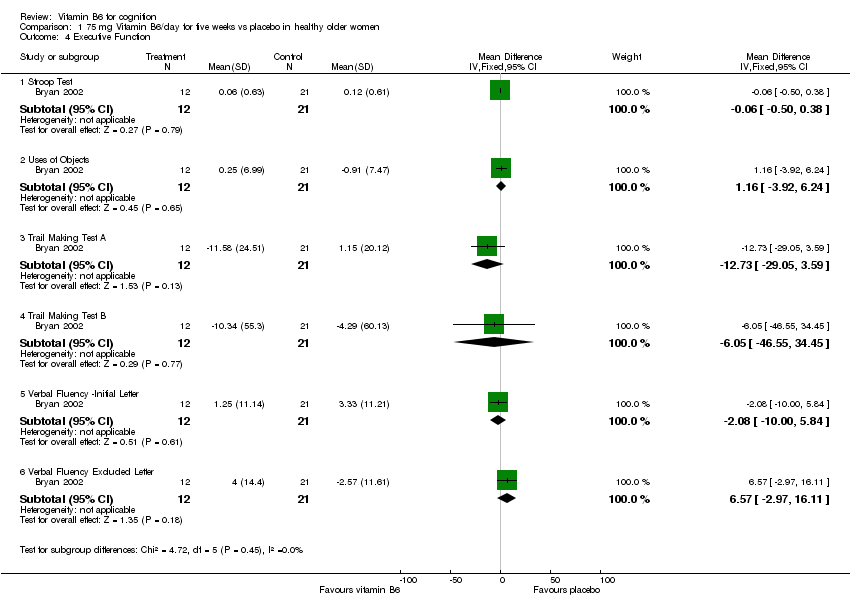
| 4 Executive Function Show forest plot | 1 | | Mean Difference (IV, Fixed, 95% CI) | Subtotals only |
|
| 4.1 Stroop Test | 1 | 33 | Mean Difference (IV, Fixed, 95% CI) | ‐0.06 [‐0.50, 0.38] |
| 4.2 Uses of Objects | 1 | 33 | Mean Difference (IV, Fixed, 95% CI) | 1.16 [‐3.92, 6.24] |
| 4.3 Trail Making Test A | 1 | 33 | Mean Difference (IV, Fixed, 95% CI) | ‐12.73 [‐29.05, 3.59] |
| 4.4 Trail Making Test B | 1 | 33 | Mean Difference (IV, Fixed, 95% CI) | ‐6.05 [‐46.55, 34.45] |
| 4.5 Verbal Fluency ‐Initial Letter | 1 | 33 | Mean Difference (IV, Fixed, 95% CI) | ‐2.08 [‐8.00, 5.84] |
| 4.6 Verbal Fluency Excluded Letter | 1 | 33 | Mean Difference (IV, Fixed, 95% CI) | 6.57 [‐2.97, 16.11] |
| 5 Verbal Ability Show forest plot | 1 | | Mean Difference (IV, Fixed, 95% CI) | Subtotals only |
|
| 5.1 Vocabulary | 1 | 33 | Mean Difference (IV, Fixed, 95% CI) | 0.74 [‐6.02, 7.50] |
| 5.2 Spot the Word | 1 | 33 | Mean Difference (IV, Fixed, 95% CI) | ‐1.65 [‐14.14, 10.84] |
| 6 Mood Measures Show forest plot | 1 | | Mean Difference (IV, Fixed, 95% CI) | Subtotals only |
|
| 6.1 CESD | 1 | 33 | Mean Difference (IV, Fixed, 95% CI) | 0.61 [‐4.78, 6.00] |
| 6.2 POMS total | 1 | 33 | Mean Difference (IV, Fixed, 95% CI) | 2.77 [‐12.28, 17.82] |
| 6.3 Tension/Anxiety | 1 | 33 | Mean Difference (IV, Fixed, 95% CI) | 0.20 [‐4.27, 4.67] |
| 6.4 Depression/dejection | 1 | 33 | Mean Difference (IV, Fixed, 95% CI) | ‐0.64 [‐4.78, 3.50] |
| 6.5 Anger/hostility | 1 | 33 | Mean Difference (IV, Fixed, 95% CI) | ‐1.28 [‐5.22, 2.66] |
| 6.6 Vigour/Activity | 1 | 33 | Mean Difference (IV, Fixed, 95% CI) | ‐2.35 [‐8.42, 3.72] |
| 6.7 Fatigue/inertia | 1 | 33 | Mean Difference (IV, Fixed, 95% CI) | 1.38 [‐2.16, 4.92] |
| 6.8 Confusion/bewilderment | 1 | 33 | Mean Difference (IV, Fixed, 95% CI) | 0.4 [‐1.90, 2.70] |