Musicoterapia para personas con autismo
Información
- DOI:
- https://doi.org/10.1002/14651858.CD004381.pub4Copiar DOI

- Base de datos:
-
- Cochrane Database of Systematic Reviews
- Versión publicada:
-
- 09 mayo 2022see what's new
- Tipo:
-
- Intervention
- Etapa:
-
- Review
- Grupo Editorial Cochrane:
-
Grupo Cochrane de Problemas de desarrollo, psicosociales y de aprendizaje
- Copyright:
-
- Copyright © 2022 The Cochrane Collaboration. Published by John Wiley & Sons, Ltd.
Cifras del artículo
Altmetric:
Citado por:
Autores
Contributions of authors
CG is the guarantor, conceived the review, designed the protocol and co‐ordinated the reviewing. MG co‐ordinated this review's update. CE, LFP, and MG searched for studies. CE, LFP, MG, and GV screened search results. LFP, MG, KM, and GV assessed risk of bias and assessed the certainty in the body of evidence. CE, LFP, MG, CG, KM, and GV extracted data, analysed data, interpreted data, wrote the report, and approved the full review.
Contribution of previous authors: Tony Wigram, co‐author of the 2006 version of this review, contributed to the development of the protocol, extracted and analysed data, and helped with writing the original report.
Sources of support
Internal sources
-
NORCE Norwegian Research Centre, Bergen, Norway
Monika Geretsegger, Christian Gold, and Karin A Mössler received salary support from NORCE during this update.
-
University of Vienna, Austria
Christian Gold received salary support from the University of Vienna during this update.
-
University of Haifa, Israel
Cochavit Elefant received salary support from the University of Haifa during this update.
External sources
-
Kavli Trust, Norway
Kavli Trust funded the Project 'Music for Autism (M4A)'. This review update is included among the expected publications from M4A. Kavli Trust had no role in the design, conduct or publication of this review update.
Declarations of interest
Cochavit Elefant (CE), Monika Geretsegger (MG), Christian Gold (CG), and Karin Mössler (KM) are clinically trained music therapists. CE, MG and KM report having been involved in publications from one study included in this review (Bieleninik 2017), without it supporting or influencing their work on this review; the study was funded by the Research Council of Norway (grant 213844, the Clinical Research and Mental Health Programmes); POLYFON Knowledge Cluster for Music Therapy; The Grieg Academy Department of Music, University of Bergen, Norway; and a range of further governmental and university funding sources and foundations across participating countries (see Characteristics of included studies for details). Assessment of eligibility, extraction of data, and assessment of risk of bias and the certainty of the evidence of this study was performed by two independent review authors who were not involved in the study.
Cochavit Elefant (CE) has declared that she has no other conflicts of interest.
Monika Geretsegger (MG) has declared that she has no other conflicts of interest.
Christian Gold (CG) is an Associate Editor of the Cochrane Developmental, Psychosocial and Learning Problems Review Group, without it supporting or influencing his work on this review. He is entirely excluded from the editorial decisions and related activities concerning this review. CG is a member of the Austrian Professional Association of Music Therapists, and until 2020, worked as a health professional. CG reports a grant from the Kavli Trust for the project 'Music for Autism' (M4A), paid to NORCE Norwegian Research Centre. CG reports being involved in publications from three studies included in this review (Bieleninik 2017; Kim 2008; and Thompson 2014). He also reports publishing an invited commentary in the Lancet Child and Adolescent Health in 2019. CG reports being the PI of two studies (Bieleninik 2017, funded by the Research Council of Norway, National Institute of Health Research; and NCT04936048, funded by the Kavli Trust), as well as a statistical advisor for one study (Kim 2008, funded by Aalborg University) eligible for inclusion in this review; none of which supported or influenced his work on this review. Assessment of eligibility, extraction of data, and assessment of risk of bias and the certainty of the evidence of these three studies were performed by two independent review authors who were not involved in the studies.
Laura Fusar‐Poli is a Clinical Research Fellow (RTD‐A) and psychiatrist in training at the University of Catania, Italy. She has declared that she has no conflicts of interest.
Giovanni Vitale is a child psychiatrist in training. He has declared that he has no conflicts of interest.
Karin Mössler has declared that she has no other conflicts of interest.
Acknowledgements
We thank Margaret Anderson, Information Specialist of the Cochrane Developmental, Psychosocial and Learning Problems Group (CDPLPG), for undertaking the searches for this and the previous update, and Joanne Duffield and Sarah Davies, Managing Editors of the CDPLPG, for their kind guidance and assistance throughout the review process.
We thank Xi‐Jing Chen, Jinah Kim, and Eajin Yoo for their kind help in retrieving Chinese and Korean studies, respectively, and for providing support in translating them. Thanks also go to Asli Doğrul and Ayşegül Yay Pençe for translating information from Turkish studies, to Xueli Tan and Yaning Wu for translating information from Chinese studies, and to Eun Jin Nausner for translating information from Korean studies.
We also thank all study authors who kindly provided additional data from their respective studies.
The CRG Editorial Team are grateful to the following peer reviewers for their time and comments: Dr Catherine E Carr, Unit for Social and Community Psychiatry, Queen Mary University of London, UK; Michelle Hintz, PsyD, MT‐BC, Cadenza Center for Psychotherapy & the Arts, Hollywood, FL; Ming Yuan Low, PhD, MT‐BC, Berklee College of Music, Boston, MA; and Vanessa M Young, MS, School of Social and Behavioral Sciences, Arizona State University.
The CRG Editorial Team are grateful to Anne Lethaby for copyediting this review.
Version history
| Published | Title | Stage | Authors | Version |
| 2022 May 09 | Music therapy for autistic people | Review | Monika Geretsegger, Laura Fusar-Poli, Cochavit Elefant, Karin A Mössler, Giovanni Vitale, Christian Gold | |
| 2014 Jun 17 | Music therapy for people with autism spectrum disorder | Review | Monika Geretsegger, Cochavit Elefant, Karin A Mössler, Christian Gold | |
| 2006 Apr 19 | Music therapy for autistic spectrum disorder | Review | Christian Gold, Tony Wigram, Cochavit Elefant | |
| 2003 Jul 21 | Music therapy for autistic spectrum disorder | Protocol | Christian Gold, Tony Wigram | |
Differences between protocol and review
Differences between protocol and original review
In compliance with the developments in systematic review methods since publication of the first version of this review (Gold 2006), a distinction was made between primary and secondary outcome measures, and risk of bias and summary of findings tables were included in the 2014 update (Geretsegger 2014).
Differences between previous versions of the review and this update
Title
We have updated the term 'people with autism spectrum disorder' to 'autistic people' throughout the text to meet the preferences generally expressed by autistic people.
Types of outcome measures
The knowledge of the condition itself and its nosological classification have changed a lot since the protocol was published in 2003. Back then, there was still the conception that ASD was mostly a paediatric condition; the concept of ASD was introduced in 2013 with DSM‐5 (APA 2013), and now we know that ASD is a life‐long condition which results in different aspects being relevant (i.e. mental health problems or self‐esteem). To ensure that all user‐important outcomes are addressed (McKenzie 2021), and to update our approach in correspondence with changes that occurred in the knowledge about ASD in recent years, we adapted the outcome categories used in the previous versions of the review as described in the Methods section (see Types of outcome measures). We also merged some previously separate outcome measures to broader outcome categories to keep the review focused and manageable for users.
Electronic searches
We made the following changes to the databases listed in the protocol (Gold 2003) and used in the in the previous versions of the review (Geretsegger 2014; Gold 2006), due to changes to standard search methods at the Cochrane Developmental, Psychosocial and Learning Problems Review Group. For this update, we searched the Cochrane Database of Systematic Reviews (CDSR), two trials registers, and two daily updated segments of MEDLINE (MEDLINE In‐Process and Other Non‐Indexed Citations, and MEDLINE EPub Ahead of Print). We also added Epistemonikos as a source of reviews.
Two subscription databases used in previous versions of the review (Dissertation Abstracts and ASSIA ) were no longer available for the updated review, and were replaced by Proquest Global Dissertations & Theses, and three specialist music databases (Proquest Music Periodical Database, Proquest Performing Arts Periodicals Database and RILM Abstracts of Music Literature Online).
Three other resources used in previous versions of the review were not used for this update as they were no longer maintained (musictherapyworld.net website) or no longer updated (Music Therapy Research CD ROM, AMTA 1999; Music Therapy World Info‐CD ROM IV, Aldridge 2002).
Data collection and analysis
In this update, we applied the Cochrane’s Screen4Me workflow to help assess the search results. We also added a new section, 'Summary of findings and assessment of the certainty of the evidence', in line with changes to standard methods in Cochrane.
Appendix 1
We removed search terms that identified irrelevant studies in the original search.
Keywords
MeSH
Medical Subject Headings (MeSH) Keywords
Medical Subject Headings Check Words
Adolescent; Child; Humans;
PICO

Study flow diagram
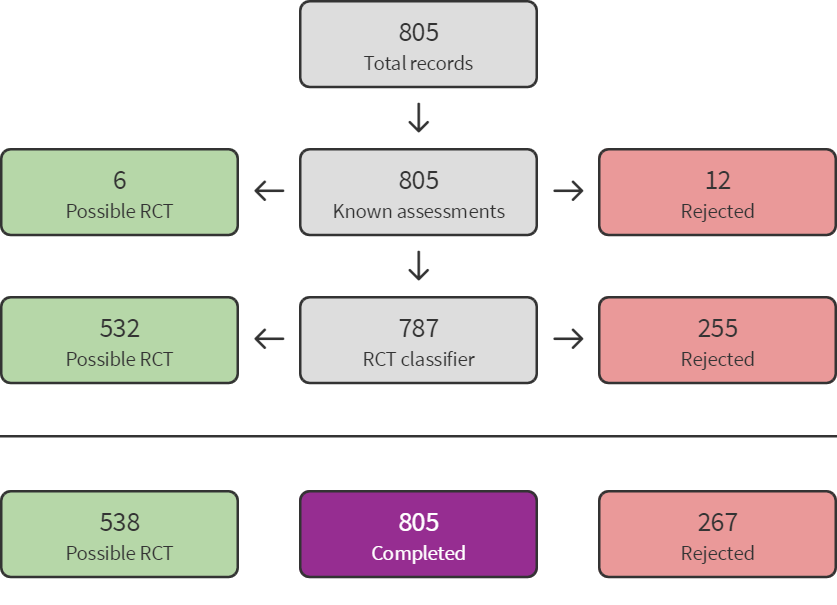
Sreen4Me summary diagram ‐ July 2020 search

Screen4Me summary diagram ‐ August 2021 search

Accumulation of evidence from 1995 to 2020.
Key: black circles = parallel design; red circles = cross‐over design. Bubble sizes in panels (c) and (d) reflect number of participants randomised.

Risk of bias graph: review authors' judgements about each risk of bias item presented as percentages across all included studies

Risk of bias summary: review authors' judgements about each risk of bias item for each included study

Comparison 1: Music therapy vs placebo therapy or standard care, Outcome 1: Global improvement

Comparison 1: Music therapy vs placebo therapy or standard care, Outcome 2: Social interaction

Comparison 1: Music therapy vs placebo therapy or standard care, Outcome 3: Non‐verbal communication

Comparison 1: Music therapy vs placebo therapy or standard care, Outcome 4: Verbal communication

Comparison 1: Music therapy vs placebo therapy or standard care, Outcome 5: Quality of life

Comparison 1: Music therapy vs placebo therapy or standard care, Outcome 6: Total autism symptom severity

Comparison 1: Music therapy vs placebo therapy or standard care, Outcome 7: Adverse events

Comparison 1: Music therapy vs placebo therapy or standard care, Outcome 8: Adaptive behaviour

Comparison 1: Music therapy vs placebo therapy or standard care, Outcome 9: Quality of family relationships

Comparison 1: Music therapy vs placebo therapy or standard care, Outcome 10: Identity formation

Comparison 1: Music therapy vs placebo therapy or standard care, Outcome 11: Depression
| Music therapy compared with placebo therapy or standard care for autistic people | ||||||
| Population: individuals with a diagnosis of autism spectrum disorder | ||||||
| Outcomes | Illustrative comparative risks* (95% CI) | Relative effect (95% CI) | Number of participants | Certainty of the evidence | Comments | |
|---|---|---|---|---|---|---|
| Assumed risk | Corresponding risk | Music therapy versus placebo therapy or standard care | ||||
| Risk with placebo or standard care | Risk with music therapy | |||||
| Global improvement
| Low‐risk populationa | RR 1.22 (1.06 to 1.40) | 583
| ⊕⊕⊕⊝ | Higher scores represent greater improvement.
| |
| 430 per 1000 | 525 per 1000 (456 to 602) | |||||
| High‐risk populationa | ||||||
| 800 per 1000 | 976 per 1000 (848 to 1000) | |||||
| Social interaction
| ‐ | The mean social interaction score at immediately post‐intervention in the intervention groups was 0.26 standard deviations higher (0.05 lower to 0.57 higher) | ‐ | 603 | ⊕⊕⊝⊝ | Higher scores represent higher social interaction capabilities.
Small to medium effect size according to Cohen 1988
|
| Non‐verbal communication
| ‐ | The mean non‐verbal communication score at immediately post‐intervention in the intervention groups was 0.26 standard deviations higher (0.03 lower to 0.55 higher) | ‐ | 192 | ⊕⊕⊝⊝ | Higher scores represent higher non‐verbal communication capabilities.
Small to medium effect size according to Cohen 1988
|
| Verbal communication Follow‐up: immediately post‐intervention (M = 3.2 months, SD = 2.8)
| ‐ | The mean verbal communication score at immediately post‐intervention in the intervention groups was 0.30 standard deviations higher (0.18 lower to 0.78 higher) | ‐ | 276 | ⊕⊝⊝⊝ | Higher scores represent higher verbal communication capabilities.
Small to medium effect size according to Cohen 1988
|
| Quality of life Follow‐up: immediately post‐intervention (M = 3.3 months, SD = 1.5)
| ‐ | The mean quality of life score at immediately post‐intervention in the intervention groups was | ‐ | 340 | ⊕⊕⊕⊝ | Higher scores represent higher quality of life.
Small to medium effect size according to Cohen 1988 |
| Total autism symptom severity
| ‐ | The mean total autism symptom severity score at immediately post‐intervention in the intervention groups was 0.83 standard deviations lower (1.41 to 0.24 lower) | ‐ | 575 | ⊕⊕⊕⊝ | Higher scores represent higher symptom severity.
Large effect size according to Cohen 1988 |
| Adverse events Any serious or non‐serious adverse event
| Low‐risk populationa | RR 1.52 (0.39 to 5.94) | 326 | ⊕⊕⊕⊝ | Higher scores represent higher numbers of adverse events.
Adverse events reported are hospitalisation periods, typically planned and short‐term.
One study with 36 participants reported no adverse events and was not included in the RR analysis. | |
| 0 per 1000 | 0 per 1000 (0 to 0) | |||||
| High‐risk populationa | ||||||
| 24 per 1000 | 37 per 1000 (9 to 150) | |||||
| *The basis for the assumed risk is provided in footnotes. The corresponding risk (and its 95% CI) is based on the assumed risk in the intervention group and the relative effect of the intervention (and its 95% CI).
CI: Confidence interval; M: Mean; RR: Risk ratio; SD: Standard deviation. |
| |||||
| GRADE Working Group grades of evidence |
| |||||
| aTypical risks are not known, so we chose the risk from included studies providing the second highest (Kim 2008) for a high‐risk population and the second lowest (Porter 2017) for a low‐risk population for the outcome 'Global improvement' (Schünemann 2021). For the outcome of 'Adverse events', where only two studies were included, we based the risk of the high‐risk population on Bieleninik 2017 and that of the low‐risk population on Porter 2017. | ||||||
| Outcome or subgroup title | No. of studies | No. of participants | Statistical method | Effect size |
| 1.1 Global improvement Show forest plot | 8 | Risk Ratio (M‐H, Fixed, 95% CI) | Subtotals only | |
| 1.1.1 Immediately post‐intervention | 8 | 583 | Risk Ratio (M‐H, Fixed, 95% CI) | 1.22 [1.06, 1.40] |
| 1.1.2 1‐5 months post‐intervention | 2 | 99 | Risk Ratio (M‐H, Fixed, 95% CI) | 1.19 [0.90, 1.57] |
| 1.1.3 6‐11 months post‐intervention | 1 | 364 | Risk Ratio (M‐H, Fixed, 95% CI) | 1.14 [0.91, 1.41] |
| 1.2 Social interaction Show forest plot | 14 | Std. Mean Difference (IV, Random, 95% CI) | Subtotals only | |
| 1.2.1 During intervention | 3 | 44 | Std. Mean Difference (IV, Random, 95% CI) | 1.15 [0.49, 1.80] |
| 1.2.2 Immediately post‐intervention | 12 | 603 | Std. Mean Difference (IV, Random, 95% CI) | 0.26 [‐0.05, 0.57] |
| 1.2.3 1‐5 months post‐intervention | 2 | 59 | Std. Mean Difference (IV, Random, 95% CI) | 0.54 [‐0.11, 1.19] |
| 1.2.4 6‐11 months post‐intervention | 1 | 258 | Std. Mean Difference (IV, Random, 95% CI) | ‐0.06 [‐0.30, 0.18] |
| 1.3 Non‐verbal communication Show forest plot | 9 | Std. Mean Difference (IV, Fixed, 95% CI) | Subtotals only | |
| 1.3.1 During intervention | 3 | 50 | Std. Mean Difference (IV, Fixed, 95% CI) | 1.06 [0.44, 1.69] |
| 1.3.2 Immediately post‐intervention | 7 | 192 | Std. Mean Difference (IV, Fixed, 95% CI) | 0.26 [‐0.03, 0.55] |
| 1.4 Verbal communication Show forest plot | 12 | Std. Mean Difference (IV, Random, 95% CI) | Subtotals only | |
| 1.4.1 During intervention | 4 | 129 | Std. Mean Difference (IV, Random, 95% CI) | ‐0.06 [‐0.41, 0.28] |
| 1.4.2 Immediately post‐intervention | 8 | 276 | Std. Mean Difference (IV, Random, 95% CI) | 0.30 [‐0.18, 0.78] |
| 1.4.3 1‐5 months post‐intervention | 1 | 52 | Std. Mean Difference (IV, Random, 95% CI) | 0.22 [‐0.33, 0.76] |
| 1.5 Quality of life Show forest plot | 3 | Std. Mean Difference (IV, Fixed, 95% CI) | Subtotals only | |
| 1.5.1 Immediately post‐intervention | 3 | 340 | Std. Mean Difference (IV, Fixed, 95% CI) | 0.28 [0.06, 0.49] |
| 1.5.2 6‐11 months post‐intervention | 1 | 249 | Std. Mean Difference (IV, Fixed, 95% CI) | 0.04 [‐0.21, 0.29] |
| 1.6 Total autism symptom severity Show forest plot | 9 | Std. Mean Difference (IV, Random, 95% CI) | Subtotals only | |
| 1.6.1 During intervention | 1 | 16 | Std. Mean Difference (IV, Random, 95% CI) | 0.15 [‐0.83, 1.14] |
| 1.6.2 Immediately post‐intervention | 9 | 575 | Std. Mean Difference (IV, Random, 95% CI) | ‐0.83 [‐1.41, ‐0.24] |
| 1.6.3 1‐5 months post‐intervention | 2 | 69 | Std. Mean Difference (IV, Random, 95% CI) | ‐0.93 [‐1.81, ‐0.06] |
| 1.6.4 6‐11 months post‐intervention | 1 | 289 | Std. Mean Difference (IV, Random, 95% CI) | 0.18 [‐0.05, 0.41] |
| 1.7 Adverse events Show forest plot | 1 | Risk Ratio (M‐H, Fixed, 95% CI) | Subtotals only | |
| 1.7.1 Immediately post‐intervention | 1 | 290 | Risk Ratio (M‐H, Fixed, 95% CI) | 1.52 [0.39, 5.94] |
| 1.7.2 6‐11 months post‐intervention | 1 | 290 | Risk Ratio (M‐H, Fixed, 95% CI) | 0.88 [0.23, 3.46] |
| 1.8 Adaptive behaviour Show forest plot | 9 | Std. Mean Difference (IV, Fixed, 95% CI) | Subtotals only | |
| 1.8.1 During intervention | 4 | 52 | Std. Mean Difference (IV, Fixed, 95% CI) | 1.19 [0.56, 1.82] |
| 1.8.2 Immediately post‐intervention | 5 | 462 | Std. Mean Difference (IV, Fixed, 95% CI) | ‐0.02 [‐0.20, 0.16] |
| 1.8.3 1‐5 months post‐intervention | 1 | 35 | Std. Mean Difference (IV, Fixed, 95% CI) | 0.56 [‐0.12, 1.24] |
| 1.8.4 6‐11 months post‐intervention | 1 | 290 | Std. Mean Difference (IV, Fixed, 95% CI) | ‐0.12 [‐0.36, 0.11] |
| 1.9 Quality of family relationships Show forest plot | 3 | Std. Mean Difference (IV, Fixed, 95% CI) | Subtotals only | |
| 1.9.1 Immediately post‐intervention | 3 | 56 | Std. Mean Difference (IV, Fixed, 95% CI) | 0.29 [‐0.24, 0.83] |
| 1.9.2 1‐5 months post‐intervention | 1 | 15 | Std. Mean Difference (IV, Fixed, 95% CI) | ‐0.04 [‐1.07, 0.99] |
| 1.10 Identity formation Show forest plot | 2 | Std. Mean Difference (IV, Random, 95% CI) | Subtotals only | |
| 1.10.1 Immediately post‐intervention | 2 | 55 | Std. Mean Difference (IV, Random, 95% CI) | 1.35 [‐0.58, 3.28] |
| 1.10.2 1‐5 months post‐intervention | 1 | 35 | Std. Mean Difference (IV, Random, 95% CI) | 0.86 [0.16, 1.55] |
| 1.11 Depression Show forest plot | 1 | Std. Mean Difference (IV, Fixed, 95% CI) | Subtotals only | |
| 1.11.1 Immediately post‐intervention | 1 | 34 | Std. Mean Difference (IV, Fixed, 95% CI) | ‐0.34 [‐1.01, 0.34] |
| 1.11.2 1‐5 months post‐intervention | 1 | 36 | Std. Mean Difference (IV, Fixed, 95% CI) | ‐0.60 [‐1.27, 0.07] |