Musicoterapia para personas con autismo
Resumen
Antecedentes
La interacción social y la comunicación social se encuentran entre las principales áreas de dificultad para las personas con autismo. La musicoterapia emplea las experiencias musicales y las relaciones que se desarrollan a través de ellas para permitir la comunicación y la expresión, por lo que intenta abordar algunos de los problemas fundamentales de las personas con autismo. La musicoterapia se aplica en el autismo desde principios de los años cincuenta, pero su disponibilidad para estas personas varía según los países y los contextos. La aplicación de la musicoterapia requiere una formación académica y clínica especializada que permite a los terapeutas adaptar la intervención a las necesidades específicas del individuo. La presente versión de esta revisión sobre la musicoterapia para personas con autismo es una actualización de la anterior actualización de la revisión Cochrane publicada en 2014 (tras la revisión Cochrane original publicada en 2006).
Objetivos
Revisar los efectos de la musicoterapia, o la musicoterapia añadida a la atención estándar, para las personas con autismo.
Métodos de búsqueda
En agosto de 2021 se hicieron búsquedas en CENTRAL, MEDLINE, Embase, en otras 11 bases de datos y en dos registros de ensayos. También se hicieron búsquedas de referencias, se comprobaron las listas de referencias y se estableció contacto con los autores de los estudios para identificar estudios adicionales.
Criterios de selección
Se consideraron para inclusión todos los ensayos controlados aleatorizados (ECA), ensayos cuasialeatorizados y ensayos clínicos controlados que compararan la musicoterapia (o la musicoterapia junto con atención estándar) con "placebo", ningún tratamiento o atención estándar en personas con diagnóstico de trastorno del espectro autista.
Obtención y análisis de los datos
Se utilizaron los procedimientos metodológicos estándar de Cochrane. Cuatro autores seleccionaron los estudios de forma independiente y extrajeron los datos de todos los estudios incluidos. Los resultados de los estudios incluidos se resumieron en metanálisis. Cuatro autores evaluaron de forma independiente el riesgo de sesgo de cada estudio incluido mediante la herramienta RoB original, así como la certeza de la evidencia mediante GRADE.
Resultados principales
En esta actualización se incluyeron 16 estudios nuevos, por lo que se alcanzó un número total de 26 estudios incluidos (1165 participantes). Estos estudios examinaron el efecto a corto y medio plazo de la musicoterapia (duración de la intervención: de tres días a ocho meses) para personas con autismo en contextos individuales o grupales. Más de la mitad de los estudios se realizaron en Norteamérica o Asia. Veintiún estudios incluyeron a niños de dos a 12 años de edad. Cinco estudios incluyeron a niños y adolescentes, así como a adultos jóvenes. Los niveles de gravedad, las habilidades lingüísticas y la cognición variaron mucho entre los estudios.
Medida inmediatamente después de la intervención, la musicoterapia comparada con la terapia "placebo" o la atención estándar tuvo más probabilidades de afectar positivamente la mejoría global (razón de riesgos [RR] 1,22; intervalo de confianza [IC] del 95%: 1,06 a 1,40; ocho estudios, 583 participantes; evidencia de certeza moderada; número necesario a tratar para un resultado beneficioso adicional [NNTB] = 11 para la población de bajo riesgo; IC del 95%: 6 a 39; NNTB = 6 para la población de alto riesgo; IC del 95%: 3 a 21) y aumentar ligeramente la calidad de vida (diferencia de medias estandarizada [DME] 0,28; IC del 95%: 0,06 a 0,49; tres ECA, 340 participantes; evidencia de certeza moderada, magnitud del efecto pequeña a mediana). Además, la musicoterapia probablemente produce una gran reducción de la gravedad total de los síntomas del autismo (DME ‐0,83; IC del 95%: ‐1,41 a ‐0,24; nueve estudios, 575 participantes; evidencia de certeza moderada). No se encontró evidencia clara de una diferencia entre la musicoterapia y los grupos de comparación inmediatamente después de la intervención en la interacción social (DME 0,26; IC del 95%: ‐0,05 a 0,57; 12 estudios, 603 participantes; evidencia de certeza baja); la comunicación no verbal (DME 0,26; IC del 95%: ‐0,03 a 0,55; siete ECA, 192 participantes; evidencia de certeza baja) ni en la comunicación verbal (DME 0,30; IC del 95%: ‐0,18 a 0,78; ocho estudios, 276 participantes; evidencia de certeza muy baja). Dos estudios investigaron los eventos adversos y uno de ellos (36 participantes) informó que no hubo eventos adversos; el otro estudio no encontró diferencias entre la musicoterapia y la atención estándar inmediatamente después de la intervención (RR 1,52; IC del 95%: 0,39 a 5,94; un estudio, 290 participantes; evidencia de certeza moderada).
Conclusiones de los autores
Los hallazgos de esta revisión actualizada aportan evidencia de que la musicoterapia se asocia probablemente con una mayor posibilidad de mejoría global en las personas con autismo, probablemente les ayuda a mejorar la gravedad total del autismo y la calidad de vida, y es posible que no aumente los eventos adversos inmediatamente después de la intervención. La certeza de la evidencia se consideró "moderada" para estos cuatro desenlaces, lo que significa que existe una confianza moderada en la estimación del efecto. No se encontró evidencia clara de una diferencia en la interacción social, la comunicación no verbal ni la comunicación verbal medidas inmediatamente después de la intervención. Para estos desenlaces, la certeza de la evidencia se consideró "baja" o "muy baja", lo que significa que el verdadero efecto podría ser considerablemente diferente a estos resultados. En comparación con las versiones anteriores de esta revisión, los nuevos estudios incluidos en esta actualización ayudaron a aumentar la certeza y la aplicabilidad de los hallazgos de esta revisión mediante tamaños muestrales más grandes, grupos etarios más amplios, períodos de intervención más prolongados y la inclusión de evaluaciones de seguimiento, y mediante el uso predominante de escalas validadas que miden el comportamiento generalizado (es decir, el comportamiento fuera del contexto de la terapia). Esta nueva evidencia es importante para las personas con autismo y sus familias, así como para los responsables de políticas sanitarias, los proveedores de servicios y los médicos, para ayudar en las decisiones sobre los tipos y la cantidad de intervención que debe proporcionarse y en la planificación de los recursos. La aplicabilidad de los resultados sigue estando limitada a los grupos etarios incluidos en los estudios, y no se pueden establecer conclusiones directas sobre la musicoterapia en personas con autismo por encima de la edad adulta joven. Se necesitan más estudios con diseños rigurosos, medidas de desenlace relevantes y seguimientos más largos para corroborar estos resultados y explorar si los efectos de la musicoterapia son duraderos.
PICO
Resumen en términos sencillos
Musicoterapia para personas con autismo
Pregunta de la revisión
Se examinó la evidencia acerca del efecto de la musicoterapia en las personas con autismo. Se compararon los resultados de las personas que recibieron musicoterapia (o musicoterapia añadida a la atención estándar) con los resultados de las personas que recibieron una terapia similar sin música (terapia "placebo"), atención estándar o ninguna terapia.
Antecedentes
El autismo es un trastorno del neurodesarrollo que dura toda la vida y que afecta la forma en que las personas perciben el mundo que les rodea y la forma en que se comunican y relacionan con los demás. Por lo tanto, la interacción y la comunicación social se encuentran entre las principales áreas de dificultad para las personas con autismo. La musicoterapia emplea las experiencias musicales y las relaciones que se desarrollan a través de ellas para permitirles relacionarse con otros, comunicarse y compartir sus sentimientos. En este sentido, la musicoterapia aborda algunos de los problemas fundamentales de las personas con autismo. La musicoterapia se aplica en el autismo desde principios de los años cincuenta. Su disponibilidad para las personas con autismo varía según los países y los contextos. La aplicación de la musicoterapia requiere formación académica y clínica especializada. Esto ayuda a los terapeutas a adaptar la intervención a las necesidades específicas de la persona. Se quería investigar si la musicoterapia ayuda a las personas con autismo en comparación con otras opciones.
Fecha de la búsqueda
La evidencia está actualizada hasta agosto de 2021.
Características de los estudios
Se incluyeron 16 estudios nuevos en esta actualización, de manera que la evidencia de esta revisión ahora se basa en 26 estudios con un total de 1165 participantes. Los estudios examinaron el efecto a corto y medio plazo de las intervenciones de musicoterapia (tres días a ocho meses) para niños, adolescentes y adultos jóvenes con autismo en contextos individuales o grupales. Ninguno de los estudios informó acerca de la financiación por parte de un organismo con un interés comercial en el resultado de los estudios; las fuentes de apoyo declaradas incluyeron la financiación gubernamental, académica y de fundaciones; en tres estudios, el apoyo fue proporcionado por una asociación de musicoterapia.
Resultados clave
La musicoterapia, comparada con la terapia "placebo" o la atención estándar, probablemente aumenta la posibilidad de mejora general al final de la terapia, probablemente mejora la calidad de vida y la gravedad total de los síntomas del autismo inmediatamente después de la terapia, y probablemente no aumenta los episodios adversos. A partir de la evidencia disponible, no es posible afirmar si la musicoterapia tiene algún efecto sobre la interacción social y la comunicación verbal y no verbal al final de la terapia.
Calidad de la evidencia
La evidencia encontrada en esta revisión es de certeza muy baja a moderada. Esto significa que los estudios de investigación futuros podrían cambiar estos resultados y la confianza en ellos. Se encontró que la musicoterapia es probablemente efectiva en lo que respecta a la mejoría global, la calidad de vida, la gravedad total de los síntomas del autismo y los episodios adversos medidos al final de la terapia, según la certeza moderada de la evidencia en estos dominios. No está claro si la musicoterapia tiene un efecto sobre la interacción social, la comunicación no verbal y la comunicación verbal al final de la terapia, ya que la certeza de la evidencia fue baja a muy baja. Las razones para la certeza limitada de la evidencia fueron los problemas con el diseño del estudio y el cegamiento (es decir, quienes aplicaron las medidas de desenlace a menudo sabían si los participantes habían recibido o no musicoterapia, lo que podría haber influido en sus evaluaciones).
Conclusiones de los autores
La musicoterapia, comparada con la terapia "placebo" o con la atención estándar, probablemente aumenta las posibilidades de mejora general al final de la terapia. También es probable que ayude a mejorar la calidad de vida y a disminuir la gravedad de los síntomas. La musicoterapia probablemente no aumente los episodios adversos. No es posible afirmar si la musicoterapia podría ayudar a la interacción social, la comunicación verbal y no verbal al final de la terapia. La mayoría de los estudios incluidos presentaron intervenciones que se corresponden bien con la musicoterapia en la práctica clínica en lo que respecta a metodología y contexto. Esta nueva evidencia es importante para las personas con autismo y sus familias, así como para los responsables de políticas sanitarias, los proveedores de servicios y los médicos, para ayudar en las decisiones sobre qué tipo de intervención elegir y en la planificación de los recursos. Se necesitan más estudios de investigación con un diseño adecuado (es decir, que produzcan evidencia fiable) que examinen las áreas que importan a las personas con autismo. Debido a que las personas con autismo y sus familias valoran los desenlaces a largo plazo de la terapia, es importante examinar específicamente cuánto tiempo duran los efectos de la musicoterapia.
Authors' conclusions
Summary of findings
| Music therapy compared with placebo therapy or standard care for autistic people | ||||||
| Population: individuals with a diagnosis of autism spectrum disorder | ||||||
| Outcomes | Illustrative comparative risks* (95% CI) | Relative effect (95% CI) | Number of participants | Certainty of the evidence | Comments | |
|---|---|---|---|---|---|---|
| Assumed risk | Corresponding risk | Music therapy versus placebo therapy or standard care | ||||
| Risk with placebo or standard care | Risk with music therapy | |||||
| Global improvement
| Low‐risk populationa | RR 1.22 (1.06 to 1.40) | 583
| ⊕⊕⊕⊝ | Higher scores represent greater improvement.
| |
| 430 per 1000 | 525 per 1000 (456 to 602) | |||||
| High‐risk populationa | ||||||
| 800 per 1000 | 976 per 1000 (848 to 1000) | |||||
| Social interaction
| ‐ | The mean social interaction score at immediately post‐intervention in the intervention groups was 0.26 standard deviations higher (0.05 lower to 0.57 higher) | ‐ | 603 | ⊕⊕⊝⊝ | Higher scores represent higher social interaction capabilities.
Small to medium effect size according to Cohen 1988
|
| Non‐verbal communication
| ‐ | The mean non‐verbal communication score at immediately post‐intervention in the intervention groups was 0.26 standard deviations higher (0.03 lower to 0.55 higher) | ‐ | 192 | ⊕⊕⊝⊝ | Higher scores represent higher non‐verbal communication capabilities.
Small to medium effect size according to Cohen 1988
|
| Verbal communication Follow‐up: immediately post‐intervention (M = 3.2 months, SD = 2.8)
| ‐ | The mean verbal communication score at immediately post‐intervention in the intervention groups was 0.30 standard deviations higher (0.18 lower to 0.78 higher) | ‐ | 276 | ⊕⊝⊝⊝ | Higher scores represent higher verbal communication capabilities.
Small to medium effect size according to Cohen 1988
|
| Quality of life Follow‐up: immediately post‐intervention (M = 3.3 months, SD = 1.5)
| ‐ | The mean quality of life score at immediately post‐intervention in the intervention groups was | ‐ | 340 | ⊕⊕⊕⊝ | Higher scores represent higher quality of life.
Small to medium effect size according to Cohen 1988 |
| Total autism symptom severity
| ‐ | The mean total autism symptom severity score at immediately post‐intervention in the intervention groups was 0.83 standard deviations lower (1.41 to 0.24 lower) | ‐ | 575 | ⊕⊕⊕⊝ | Higher scores represent higher symptom severity.
Large effect size according to Cohen 1988 |
| Adverse events Any serious or non‐serious adverse event
| Low‐risk populationa | RR 1.52 (0.39 to 5.94) | 326 | ⊕⊕⊕⊝ | Higher scores represent higher numbers of adverse events.
Adverse events reported are hospitalisation periods, typically planned and short‐term.
One study with 36 participants reported no adverse events and was not included in the RR analysis. | |
| 0 per 1000 | 0 per 1000 (0 to 0) | |||||
| High‐risk populationa | ||||||
| 24 per 1000 | 37 per 1000 (9 to 150) | |||||
| *The basis for the assumed risk is provided in footnotes. The corresponding risk (and its 95% CI) is based on the assumed risk in the intervention group and the relative effect of the intervention (and its 95% CI).
CI: Confidence interval; M: Mean; RR: Risk ratio; SD: Standard deviation. |
| |||||
| GRADE Working Group grades of evidence |
| |||||
| aTypical risks are not known, so we chose the risk from included studies providing the second highest (Kim 2008) for a high‐risk population and the second lowest (Porter 2017) for a low‐risk population for the outcome 'Global improvement' (Schünemann 2021). For the outcome of 'Adverse events', where only two studies were included, we based the risk of the high‐risk population on Bieleninik 2017 and that of the low‐risk population on Porter 2017. | ||||||
Background
Description of the condition
Autism is a complex neurodevelopmental condition that usually manifests in early childhood and persists throughout life. When following a medical paradigm, and according to the criteria of the International Classification of Diseases and Related Health Problems, 11th edition (ICD‐11) (WHO 2021), and the Diagnostic and Statistical Manual of Mental Disorders, fifth edition (DSM‐5) (APA 2013), autism spectrum disorder (ASD) is characterised by 'persistent deficits in social communication and social interaction across multiple contexts', and by the presence of 'restricted, repetitive patterns of behavior, interests, or activities'. For a diagnosis of ASD, children must show symptoms of ASD since early childhood (i.e. before the age of three) (APA 2013; WHO 2021). In some instances, these symptoms may only be detectable later when social demands become intractable, or may continue to be masked through learned strategies (APA 2013) in an attempt to mimic neurotypical behaviours.
The prevalence of ASD has considerably risen over the last decades. While the first epidemiological study estimated a prevalence of the condition as lower than 0.5% in young children (Lotter 1966), the latest estimates of the Centers for Disease Control and Prevention reported that one in 54 children in the United States may be on the autism spectrum (Maenner 2020). The increased prevalence rates are attributable to the broadening of the diagnostic criteria, diagnostic switching from other developmental disabilities, service availability, and awareness of the condition among the community and professionals (Elsabbagh 2012; Lyall 2017). Of note, ASD is more commonly diagnosed among males than females, with a ratio of 4:1 (Maenner 2020).
The clinical picture is widely variable in presentation, severity, and hence levels of support needed. Additionally, ASD may be accompanied by co‐occurring conditions, such as intellectual disability (ID), language impairments, as well as other neurodevelopmental, mental, and behavioural disorders (APA 2013). The most frequent co‐occurring mental health conditions are attention‐deficit hyperactivity disorders (ADHD), anxiety disorders, sleep‐wake disorders, depression, disruptive, impulse‐control, and conduct disorders (Lai 2019). Autistic people might be more vulnerable to negative life experiences (Griffiths 2019) and to the development of post‐traumatic stress symptoms (Rumball 2020). As a consequence, outcome domains beyond the core symptoms of ASD, such as depression, anxiety, or quality of life, are increasingly receiving more attention in autism research.
As autistic ways of communicating and being social deviate from neurotypical socialising, approaches following a medical model tend to seek to change this deviation. Within such a model, challenges emerging from being autistic are situated within the autistic individuals rather than the environment, culture or society surrounding them. The medical model has been criticised by scholars as well as by the autistic community (De Jaegher 2013; Milton 2012 ). Instead, a social or cultural model of autism has been suggested (Sinclair 2010; Sinclair 2012). A social model of understanding autism looks at autistic characteristics as part of human diversity and understands social interaction as a shared responsibility and participatory practice (De Jaegher 2007). Hence, challenges causing dysfunction in social interaction can also be located outside the autistic person and might require changes from the environment rather than solely from the individual. Accordingly, the enabling and disabling impact any given interaction, context or society can hold for autistic people needs to be considered when defining autism or interacting with autistic people (Milton 2019).
Regarding the terminology used in autism research, there is an ongoing debate on the type of language that is most appropriate and most respectful to people with a diagnosis of ASD, their families and caregivers. A growing body of literature documents that person‐first language (e.g. 'people with ASD') may actually increase effects of stigmatisation for autistic people (Bottema‐Beutel 2021; Gernsbacher 2017), and that people with a diagnosis of ASD themselves often prefer using identity‐first language (e.g. "autistic individuals") as a means of showing that autism is a central part of their identity rather than something that needs to be fixed or cured (Bury 2020; Kenny 2016). This preference has also been expressed by autistic people and their families who have been consulted by the authors while conducting this review. Considering these contexts and perspectives, we chose to use identity‐first language in this review.
Depending on the way autism is conceptualised ‐ either as a set of cognitive or behavioural deficits (APA 2013) or as a social construction and as a description of a culturally filtered experience (Milton 2019) ‐ therapeutic aims and approaches will differ. Following a medical paradigm, psychosocial and behavioural therapies are considered the first‐line evidence‐based treatments for people with a diagnosis of ASD. These therapy approaches traditionally aim at achieving changes regarding the way autistic people communicate and interact with others and often follow a normalising agenda which tries to lessen or remove outward signs of autism. Contrary to this, some of the same therapies may follow a maximising agenda (Winter 2012) where the aims of any intervention are to maximise an individual's capabilities as an autistic person.
A variety of music therapy approaches have been developed for working with autistic people, many of them defined as relational or child‐led (Carpente 2009; Geretsegger 2015; Schumacher 1994), following the individual's strengths and resources and allowing for participatory processes in the development of social interaction and understanding, thus more aligned with a maximising agenda and a cultural or social model of autism.
As symptom change is often assessed as a primary outcome in scientific research, a normalisation agenda might be considered to form the epistemological background of music therapy research as well. However, music therapy research also combines these two agendas (Pickard 2020) by applying music therapy approaches striving for maximisation, while concurrently using outcomes measuring neurotypical social behaviour and communication and general domains such as quality of life (see, for example, Bieleninik 2017). Thus, music therapy can be seen as relating to the coexisting "dual nature of autism" (Lai 2020), being categorised as medical condition leading to developmental disability and at the same time being an example of neurodivergent development forming identity and culture.
Description of the intervention
Music therapy for autistic people is often provided as individual therapy, although there are also reports of group‐based and peer‐mediated interventions (e.g. Boso 2007; Ghasemtabar 2015; Kern 2006; Kern 2007; LaGasse 2014; Mateos‐Moreno 2013). Family‐centred approaches, where parents or other family members are included in therapy sessions (Oldfield 2012; Pasiali 2004; Thompson 2014; Thompson 2012) or trained in relevant music‐based techniques for social engagement (Gottfried 2016), have increasingly become an important part of music therapy for autistic children, especially to help generalise skills acquired in therapy to everyday contexts, that is, to transfer these skills from the therapy context to new and different settings.
Music therapy has been defined as "a systematic process of intervention wherein the therapist helps the client to promote health, using music experiences and the relationships that develop through them as dynamic forces of change" (Bruscia 1998, p. 20). Music therapy approaches for autistic people are based on sensory‐perceptional, developmental, creative, behavioural, and educational conceptualisations (Bergmann 2016). Accordingly, aims in music therapy are wide including the work on communication and interaction, sensory processing and integration, affect regulation, identity formation as well as creative and recreational needs that can lead to an increased quality of life. Active music‐making with a variety of instruments that are easy to play is widely used, involving the client and the therapist in joint musical play. Central music therapy techniques include free and structured improvisation, recreating songs and vocalisation, or songwriting. Listening to pre‐recorded or live music played by the therapist can be used for e.g. relaxation purposes or, in the context of behavioural approaches of music therapy, focusing on training of specific skills. Some music therapy approaches also include movement activities or story‐telling. The delivery of music therapy varies in its degree of structuredness: while behavioural approaches often make use of fixed manuals specifying training phases and materials (e.g. Lim 2011), developmental or improvisational approaches are usually less pre‐structured. However, there are also some flexible yet systematic treatment guidelines for improvisational music therapy in autism which specify core therapeutic principles and techniques (Geretsegger 2015; Kim 2006; Thompson 2014; Wigram 2006).
Music therapy has been applied in autism since the early 1950s (Fusar‐Poli in press; Reschke‐Hernández 2011), but its availability to autistic individuals varies across countries, depending on other factors such as age or educational setting (Kern 2017). The application of music therapy requires specialised academic and clinical training, typically achieved through Bachelor and Master's level degree courses in music therapy which usually lead to accreditation with professional associations or governmental registries, or both. Training courses in music therapy not only teach clinical music therapy techniques, but also aim at developing the therapist's personality and clinical sensitivity, which is necessary to apply music therapy responsibly. Thus, this specialised training enables music therapists to tailor their methods and techniques to meet individual therapeutic goals and needs (Fusar‐Poli in press).
How the intervention might work
The processes that occur within musical interaction may help autistic people to develop communication skills and the capacity for social interaction. Through engaging in musical interaction, participants in music therapy can shift between verbal, non‐verbal and pre‐verbal modes of communication. Thus, musical interaction can be understood and described as a means for verbal people to access sensory experiences and for people without spoken language to interact communicatively without words. It enables all to engage on a more emotional, relationship‐oriented level than may be accessible through verbal language (Alvin 1991). Behaviouristic and educational approaches typically use music activities to motivate the child and to reinforce targeted behaviour. Developmental approaches often use music to focus on the sensory, motor‐coordination and affective aspects of music‐making, e.g. through intra‐ and inter‐personal synchronisation experiences (Berger 2002; Schumacher 2019). In improvisational approaches, therapists attune to the child's intrinsic way of sound‐making and moving, using the shared history of musical interaction and jointly developed musical activities to motivate and engage the child in interactive processes (Geretsegger 2015; Holck 2004). Listening to music within music therapy also involves an interactive process that often includes selecting music that is meaningful for the person (e.g. relating to an issue that the person is occupied with) and, where possible, reflecting on personal issues related to the music or associations brought up by the music. For those with verbal abilities, verbal reflection on the musical processes is often an important part of music therapy (Wigram 2002).
There are several psychological theories and neurobiological models that aim to explain the mechanisms through which music therapy helps autistic individuals (Fusar‐Poli in press). One area of research underpinning the potential of music therapy in autism is based on findings suggesting that motor timing and sensorimotor integration are disrupted in autistic people (De Jaegher 2013; Sharda 2018), which may contribute to broader challenges in interacting with others (Mössler 2019). Functional neuroimaging studies with autistic individuals showed an overconnectivity between sensory brain networks which is related to the sensory processing differences and multisensory integration difficulties (Chen 2020). Thus, sensorimotor integration facilitated by musical interaction may lead to modulation of atypical sensory processing, which may in turn enhance social communication (Thye 2018).
Another, related rationale for the use of music therapy for individuals with communication disorders is based on the findings of infancy researchers such as Stern and Trevarthen who describe sound dialogues between mothers and infants using 'musical' terms (Stern 1985; Stern 1989; Stern 2010; Trevarthen 1999b). When describing tonal qualities, researchers use the terms pitch, timbre, and tonal movement and, when describing temporal qualities, they speak of pulse, tempo, rhythm, and timing (Wigram 2002). Trevarthen 1999a describes the sensitivity of very young infants to the rhythmic and melodic dimensions of maternal speech, and to its emotional tone, as demonstrating that we are born ready to engage with the 'communicative musicality' of conversation. The experience of attunement through synchronisation in timing, tonality or affective dynamics shapes the attachment between infant and caregivers and has been suggested as influencing the development of social understanding (Greenspan 2007; Stern 1985; Trevarthen 2011). These premises allow music to act as an effective medium for engaging in non‐verbal social exchange for autistic children and adults. Communicative behaviours, such as joint attention, eye contact, and turn‐taking, are characteristic events in shared, active music‐making and, therefore, inherent components of music therapy processes. Recent research has shown that musical and emotional attunement within music therapy processes can support social responsiveness in autistic children (Mössler 2019; Mössler 2020). In addition to music's potential to stimulate communication (as described for vocal communication in Salomon‐Gimmon 2019), music therapists use music, especially improvisational music‐making, to provide autistic people with opportunities to experience structure combined with measured flexibility, thus helping them to find ways of coping in less predictable situations that will typically pose challenges for them (Wigram 2009).
The potential for predictability and anticipation brought about by musical structures is an element also used in behavioural approaches where music is utilised as a stimulus facilitating the perception and production of speech and language and enhancing communication skills (Lim 2010; Lim 2011). Another rationale for using music in this way is the increased attention and enjoyment observed in autistic individuals when presented with musical as opposed to verbal stimuli (Buday 1995; Lim 2010; Lim 2011).
Why it is important to do this review
This is an update of a Cochrane review first published in 2006 (Gold 2006) and previously updated in 2014 (Geretsegger 2014). The first version of this review concluded that music therapy may help autistic children to improve their communicative skills, but also noted that more research was needed to investigate the effects of music therapy in typical clinical practice and within longer periods of observation (Gold 2006). In the 2014 update of this review, we found that music therapy may help autistic children to improve their skills in social interaction, verbal communication, initiating behaviour, and social‐emotional reciprocity; we also concluded that more research with larger samples addressing relevant outcomes through standardised scales was needed to corroborate these findings and to examine long‐term effects of music therapy as well as effects of music therapy for adolescents and adults (Geretsegger 2014).
More recently, further systematic reviews have appeared, often with limited scope (e.g. Shi 2016 focusing on only Chinese data), methodological flaws (e.g. Whipple 2012 where designs of included studies lacked homogeneity and included sample sizes of only one), or providing only narrative summaries (e.g. De Vries 2015), thus highlighting the continued need for an updated, comprehensive review. Furthermore, considerable changes have occurred in the knowledge about ASD in recent years, and a number of new studies of music therapy for autism were published since the 2014 version of this review, which necessitated an update of the previous review. We conducted the current update to summarise and evaluate these new studies in order to provide comprehensive and up‐to‐date conclusions, as well as implications for practice and research that are based on the most recent findings. This information is highly relevant for autistic individuals and their families as well as for policymakers, service providers and clinicians, to help in decisions around the types and amount of intervention and support that should be provided, and in the planning of resources.
Objectives
To review the effects of music therapy, or music therapy added to standard care, for autistic people.
Methods
Criteria for considering studies for this review
Types of studies
All relevant randomised controlled trials (RCTs), quasi‐randomised trials and controlled clinical trials (CCTs), including cluster‐trials were considered for inclusion. Studies using single‐case experimental designs were included if they also met the definition of RCTs or CCTs, that is, if the different interventions were provided in a different order to different participants (i.e. cross‐over RCTs/CCTs). Studies in which all participants received interventions in the same order (i.e. case series) were excluded.
Types of participants
Individuals of any age who were diagnosed with ASD as defined in DSM‐5 (APA 2013) or ICD‐11 (WHO 2021) criteria, whether identified by a psychological assessment or a psychiatric diagnosis, were considered for inclusion. Moreover, we included individuals diagnosed with pervasive developmental disorders, as defined in ICD‐10 criteria (WHO 1994) or in previous versions of the DSM, including childhood autism, atypical autism, Asperger's syndrome, and pervasive developmental disorder not otherwise specified, as these previous diagnostic labels are now included in the category of ASD in DSM‐5 and ICD‐11. Individuals with Rett's disorder or childhood disintegrative disorder were not included as they have been excluded from the ASD diagnostic category in the current classifications, given their significantly different clinical course.
Types of interventions
Interventions included music therapy (i.e. regular sessions of music therapy involving music experiences and relationships developing through them as defined above, delivered by a professional music therapist).
Comparators
Interventions were compared with either 'placebo' therapy (i.e. a similar intervention without the elements specific to music therapy, e.g. play therapy without music, or music listening without interaction with a music therapist; the concept of attention placebo in psychotherapy research is discussed in Kendall 2004), no treatment, or standard care control; or music therapy added to standard care compared with standard care (with or without 'placebo' therapy).
Types of outcome measures
To ensure that all user‐important outcomes were addressed (McKenzie 2021), and to update our approach in correspondence with changes that occurred in the knowledge and nosological classification of the condition in recent years (see Differences between protocol and review), we adapted the outcome categories used in the previous version of the review, as described below. In our adaptations, we also sought to broaden outcome areas in order to not only address specific skills (e.g. social adaptation; communicative skills such as eye contact, imitating gestures or words), but also wider areas of capacity (e.g. adaptive behaviour in more than just the social domain; communication including all domains of verbal or non‐verbal communication, pragmatics, language structure, and communication behaviours such as withdrawal within a group).
We considered the broad‐based measures 'global improvement' (binary) and 'total autism symptom severity' (continuous) as primary outcomes. Although not endorsed when applying a social‐model approach to autism, measures relating to these overall categories are still considered important in a medical‐model perspective on autism which is likely to be relevant for many policymakers, service providers and clinicians. As in the 2014 version of this review, we also regarded outcome measures in all areas of social communication as primary outcomes as they refer to the core characteristics defining ASD (social interaction, non‐verbal communication, verbal communication). In addition, we moved the category of 'quality of life' (secondary outcome 'quality of life in school, home, and other environments' in the 2014 version of this review) into primary outcomes due to the increased relevance of this outcome to autistic individuals and their families, as demonstrated in recent studies and reports (e.g. McConachie 2015; Provenzani 2020). To keep this review focused and manageable for users (McKenzie 2021), we merged previously separate outcomes that concern specific sub‐skills of social interaction ('initiating behaviour', 'social‐emotional reciprocity', 'joy'), with the wider category of 'social interaction'. Finally, we retained 'adverse events' as a primary outcome category.
We regarded other commonly examined outcome measures in areas not specific to defining ASD characteristics as secondary outcomes. The outcome 'social adaptation skills' was re‐labelled as 'adaptive behaviour'. In order to address outcomes that are regarded as highly relevant by autistic people, their family members and professionals (Lipinski 2019; McConachie 2015) and that were evaluated in included studies, we newly added 'identity formation' (including self‐esteem) and 'depression' as secondary outcome categories.
Finally, we removed the outcome category 'hyperacusis (hypersensitivity to sound)', as we did not find it measured in any study, or mentioned in any review.
Data sources could have included non‐standardised or standardised instruments (for a review of relevant standardised instruments, see Ozonoff 2005; McConachie 2015; Provenzani 2020), parent or teacher report, or school records. Data from rating scales were only included if the instrument was either a self‐report or completed by an independent rater or relative (i.e. not the therapist, unless reconfirmed by an independent rater).
Primary outcomes
Primary outcomes included the following.
-
Global improvement: binary (improved versus not improved or unknown, on a scale measuring clinical global impressions or on a global measure used as primary outcome in a study);
-
Social interaction: continuous;
-
Non‐verbal communication: continuous;
-
Verbal communication: continuous;
-
Quality of life: continuous; could be measured in various contexts (school, home, other) and with varying scope (individual, family);
-
Total autism symptom severity: continuous;
-
Adverse events: binary (any adverse event/no adverse event), as defined by study authors.
Secondary outcomes
Secondary outcomes included the following.
8. Adaptive behaviour: continuous; this could be measured as positive adaptive behaviours (enabling a person to get along in their environment with greatest success and least conflict with others) or as maladaptive, dysfunctional behaviours (which stop a person from adapting to new or difficult circumstances, including 'restricted and repetitive behaviours');
9. Quality of family relationships: continuous;
10. Identity formation: continuous; including self‐esteem and related concepts;
11. Depression: continuous;
12. Cognitive ability: continuous; including attention and concentration.
Changes in generalised skills that are measured outside of the immediate therapy context pose the biggest challenge for any interventions for autism (Warren 2011). Generalised outcomes refer to changes that generalise to other behaviours and to other contexts across settings, people, or materials. In the summary of findings Table 1, we report the results of seven generalised outcomes (all listed under Primary outcomes) measured immediately post‐intervention.
We grouped outcome time points as follows: during the intervention (previously labelled "within sessions/non‐generalised"); immediately post‐intervention; one to five months post‐intervention; six to 11 months post‐intervention; 12 to 23 months post‐intervention; and 24 to 35 months post‐intervention. Where outcomes were measured at multiple time points during the course of therapy, we used mean values of all data from the second therapy session onwards.
Search methods for identification of studies
We ran the searches for this update in July 2020 and again in August 2021. We revised the original search strategy by removing redundant search terms, and by adding relevant database sources which were either not available at the time of search for the previous update (e.g. MEDLINE Epub Ahead of Print) or not routinely included previously (e.g. trial registers). Where possible, searches were limited to the period since the last update (2013 onwards). For newly added databases, searches were conducted since their inception.
Electronic searches
The Cochrane Developmental, Psychosocial and Learning Problems Group Information Specialist, Margaret Anderson, conducted systematic searches in the following databases for randomised controlled trials and controlled clinical trials without language or publication status restrictions.
-
Cochrane Central Register of Controlled Trials (CENTRAL; 2021, Issue 8), part of the Cochrane Library (searched 4 August 2021).
-
MEDLINE Ovid (1946 to July week 4 2021).
-
MEDLINE In‐Process & Other Non‐indexed Ciations Ovid (1946 to 3 August 2021).
-
MEDLINE EPub Ahead of Print Ovid (3 August 2021).
-
Embase Ovid (1974 to 3 August 2021).
-
LILACS (lilacs.bvsalud.org/en/; searched 4 August 2021).
-
APA PsycINFO Ovid (1806 to July week 4 2021).
-
CINAHL EBSCOhost (1937 to 4 August 2021).
-
ERIC EBSCOhost (1966 to 4 August 2021).
-
Sociological Abstracts Proquest (1952 to 4 August 2021).
-
Proquest Global Dissertations & Theses (searched 4 August 2021).
-
Proquest Music Periodicals Database (1996 to 4 August 2021).
-
Proquest Performing Arts Periodicals Database (1864 to 4 August 2021).
-
RILM Abstracts of Music Literature Online (1967 to 4 August 2021).
-
Cochrane Database of Systematic Reviews (CDSR; 2021, Issue 8), part of the Cochrane Library (searched 4 August 2021).
-
Epistemonikos (www.epistemonikos.org/en/; searched 4 August 2021).
-
ClinicalTrials.gov (clinicaltrials.gov/ct2/home; searched 5 August 2021).
-
WHO International Clinical Trials Registry Platform (apps.who.int/trialsearch/; searched 5 August 2021).
Detailed search strategies for this update are reported in Appendix 1. Details of the previous search strategies are available in Geretsegger 2014.
Searching other resources
Adverse events
We did not perform a separate search for adverse events. We considered adverse events described in included studies only.
Searching reference lists
We checked the bibliographies of included studies and relevant reviews (Accordino 2007; Ball 2004; Brondino 2015; De Vries 2015; Pater 2017; Reschke‐Hernández 2011; Shi 2016; Simpson 2011; Weitlauf 2014; Whipple 2004; Whipple 2012) for further references to relevant trials.
Searching by contacting individuals or organisations
We contacted experts and organisations in the field through correspondence in researcher networks, conferences and social media to gather information on ongoing trials and any relevant material not captured by our searches. Where necessary, we contacted authors of key papers and abstracts to request further information about their trials.
Data collection and analysis
Selection of studies
We used Cochrane’s Screen4Me workflow to help assess the search results. Screen4Me comprises three components: known assessments — a service that matches records in the search results to records that have already been screened in Cochrane Crowd and been labelled as an RCT or as Not an RCT; the RCT classifier — a machine learning model that distinguishes RCTs from non‐RCTs and, if appropriate, Cochrane Crowd — Cochrane’s citizen science platform where the Crowd help to identify and describe health evidence. For more information about Screen4Me and the evaluations that have been done, please go to the Screen4Me webpage on the Cochrane Information Specialist’s portal: https://community.cochrane.org/organizational‐info/resources/resourcesgroups/ information‐specialists‐portal. In addition, more detailed information regarding evaluations of the Screen4Me components can be found in the following publications: Marshall 2018; Noel‐Storr 2020; Noel‐Storr 2021; Thomas 2020.
Four authors (CE, LFP, MG, GV) independently inspected all titles and abstracts identified from the search in such a way that each record was screened by two authors. We obtained potentially relevant papers and resolved any disagreement about eligibility through discussion or consultation with the other authors. For non‐English study reports, we provided for their translation. We recorded the reasons for excluding trials.
We recorded the selection process in sufficient detail to produce a PRISMA flow diagram (Liberati 2009).
Data extraction and management
Four reviewers (CE, LFP, MG, GV) independently performed data extraction using a data collection form so that data from each study were extracted by two reviewers. We made sure that studies in which any of the reviewers were involved with were dealt with by two other reviewers not involved in these studies. The data collection form was initially piloted to ensure feasibility and included details on study design, participants, interventions, outcomes including measurement time points and allocation to outcome categories, and funding sources. Any disagreements were resolved by discussion, or consultation with the other reviewers, or both. When necessary, we contacted the study authors to provide missing data.
Assessment of risk of bias in included studies
Four authors (KM, MG, LFP, GV) independently assessed the risk of bias of each included study using the Cochrane risk of bias tool (Higgins 2011). We made sure that studies where any of the reviewers were involved were dealt with by other reviewers not involved in these studies. Any disagreements were resolved by discussion, or consultation with the other reviewers, or both.
For each included study, we presented the risk of bias assessments in a table where the judgement of the review authors (low, high or unclear risk of bias) was followed by a text box providing details on the available information that led to each judgement.
We assessed the following items:
-
random sequence generation;
-
allocation concealment;
-
blinding of participants and personnel;
-
blinding of outcome assessment;
-
completeness of outcome data;
-
selective reporting; and
-
other sources of bias.
The criteria for assigning judgements of high, low and unclear risk of bias are provided in Appendix 2.
Measures of treatment effect
Where available, we used individual participant data (IPD) in order to calculate measures of treatment effect consistently.
Binary data
We calculated the risk ratio (RR) and corresponding 95% confidence interval (95% CI) for binary outcomes. The number needed to treat for one beneficial outcome was calculated, where appropriate.
Continuous data
We preferred endpoints over change scores. If IPD were available, the distributions of values were visually checked for skewness. Where skewness was found, we attempted to remove it by log‐transformation. We then examined how log‐transformation influenced the effect size estimate and used the more conservative estimate.
We calculated the standardised mean difference (SMD) and corresponding 95% CI for all continuous outcomes. When combining different scales for the same outcome, it was necessary to standardise the effects in order to make them comparable. When combining results for the same scale, either the mean difference (MD) or SMD could have been used. We decided to use SMD in order to facilitate the interpretation of effect sizes as small (up to 0.2), medium (around 0.5) or large (0.8 and above) based on guidelines that are commonly used in the behavioural sciences (Cohen 1988; Schünemann 2021a ). In the absence of any anchor‐based minimally clinical important differences (MCIDs) for the outcomes in this review, the general guidelines for the behavioural sciences developed by Cohen 1988 state that an effect size needs to reach at least a level of 0.2 to be regarded as potentially meaningful; effects smaller than 0.2 may be negligible. It is noted that the choice of SMD or MD does not usually affect the significance level of the results and the authors cautiously assessed whether this was the case.
All SMDs, regardless of whether the study was a parallel or a cross‐over design, were standardised by the pooled standard deviation between participants, rather than the standard deviation of the difference within participants. This is the standard procedure, which enables comparisons of different scales and facilitates interpretation of the magnitude of effects (Cohen 1988; Gold 2004). The calculation of the standard error then depends on the study design. For parallel designs, the standard error was calculated using the standard formulae for SMDs as implemented in RevMan Web (RevMan Web 2020). For cross‐over studies, outcomes are usually positively correlated within participants; we assumed a correlation of 0 as a conservative estimate; this avoided giving too high weight to small studies and also enabled use of standard methods for SMDs within RevMan (Elbourne 2002; Higgins 2021).
For studies where outcomes were measured on several occasions during each treatment intervention, we used the mean of all measurements from the second occasion onwards. Where the same outcome was measured on multiple occasions using the same scale, we calculated the mean and the pooled SD and entered these into RevMan. Where the same outcome was measured on multiple occasions using different scales, we calculated a mean effect size for that study outcome and entered that into RevMan (along with SD 1 and mean in control 0).
In comparison to the previous review update, these procedures ensure better consistency and transparency, but also tend to show more conservative results. Thus, a study that in Geretsegger 2014 showed a significant effect (using the generic inverse variance method in RevMan and possibly a change score or a positive correlation estimate) might show no effect in this update.
Unit of analysis issues
Cluster‐RCTs
For cluster‐RCTs, we adjusted the sample size according to the design effect, based on an intraclass coefficient calculated from IPD, if available.
Cross‐over trials
The appropriateness of cross‐over designs is difficult to assess. In general, autism as a lifelong condition lends itself well to such designs. However, it is less clear how lasting any effects of music therapy may be. In general, we judged cross‐over designs as appropriate unless there was clear evidence to the contrary (e.g. a clearly irreversible outcome). We therefore combined the results of cross‐over trials with the results of parallel‐group trials, and used data from all periods in order to retain a maximum of information provided by those studies. Data from washout periods in cross‐over studies were excluded from the analysis.
Multiple treatment arms
For studies including more than one relevant music therapy group or more than one relevant control group, we combined the data of the relevant groups by calculating a weighted mean and pooled SD.
Dealing with missing data
We assessed loss to follow‐up and dropouts in the included studies as reported in the risk of bias tables. Where unclear, we contacted the study authors to confirm any loss to follow‐up and dropouts in their studies. We applied an intention‐to‐treat analysis (except for adverse events) for available cases and did not impute missing values for continuous outcomes. We are aware that this may introduce bias if being lost to follow‐up is related to a participants’ response to intervention (Moher 2010). Therefore, we examined the impact of studies with high risk of bias due to dropout using sensitivity analyses, where these studies were excluded.
Assessment of heterogeneity
Because statistical tests of heterogeneity have low power, particularly when the number of studies is low, we relied primarily on descriptive analyses of heterogeneity. We visually inspected forest plots for consistency of results and calculated the I² statistic (Higgins 2002), which describes the proportion of variation in point estimates that is due to heterogeneity rather than sampling error, and followed suggested threshold bands for interpreting the I² statistic which define 0% to 40% as "might not be important"; 30% to 60% as "may represent moderate heterogeneity"; 50% to 90% as "may represent substantial heterogeneity"; and 75% to 100% as "considerable heterogeneity" (Deeks 2021). We supplemented this by calculating the Chi2 statistic to determine the strength of evidence that the heterogeneity was genuine. We investigated possible sources of heterogeneity when it was detected.
Assessment of reporting biases
We used funnel plots to investigate any relationship between effect size and study precision in cases where 10 or more studies were pooled for an outcome. With other design aspects equal, a funnel plot would be symmetric within chance variation in the absence of publication bias; a noticeable asymmetry may therefore indicate a strong publication bias. However, because the method may not work well when larger studies differ in other design aspects, as well as because of its subjective interpretation, we did not interpret a lack of an apparent asymmetry as evidence of absence of publication bias.
Data synthesis
Using RevMan Web (RevMan Web 2020), we conducted meta‐analyses utilising RRs for dichotomous outcomes and SMDs for continuous outcomes. A fixed‐effect model was initially used for all analyses. If a common effect size was not tenable because a substantial amount of heterogeneity (i.e. 50% or higher; Deeks 2021) was identified that could not be explained by clinical subgroups in the outcome domain immediately post‐intervention (see Subgroup analysis and investigation of heterogeneity), we chose a random‐effects model. Where we conducted fixed‐effect analyses, we also examined whether random‐effects analyses would have altered the results by conducting sensitivity analyses, and reported any differences in the Effects of interventions section. We used the inverse variance method, which is most commonly used, in random‐effects analyses of dichotomous outcomes and in all analyses of continuous outcomes. In fixed‐effect meta‐analyses of dichotomous outcomes, we used the Mantel‐Haenszel method, which is the default method in RevMan Web and is commonly preferred because it has better statistical properties when there are few events (Deeks 2021).
Subgroup analysis and investigation of heterogeneity
When substantial heterogeneity was identified (I2 ≥ 50%), we examined the impact of clients' age (children versus adolescents or adults), intensity of therapy (i.e. number and frequency of music therapy sessions), and treatment quality (i.e. adequate music therapy methods; adequate training of therapists; see definitions specified in Appendix 2, 'Other bias') in subgroup analyses.
Sensitivity analysis
We conducted sensitivity analyses to determine the impact of attrition bias risk by removing studies at high risk of attrition bias. We also investigated the impact of the choice of model by conducting a random‐effects analysis where fixed analysis was chosen and comparing the findings.
Summary of findings and assessment of the certainty of the evidence
We created a summary of findings table for our main comparison: music therapy compared with placebo therapy or standard care. We included the following primary outcomes, assessed immediately post‐intervention: global improvement; social interaction; non‐verbal communication; verbal communication; quality of life; total autism symptom severity; adverse events.
Four review authors (KM, MG, LFP, GV) assessed the overall certainty of the body of evidence using the GRADE approach (Schünemann 2013). We made sure that studies in which any of the reviewers were involved with were dealt with by two other reviewers not involved in these studies. Any disagreements were resolved by discussion, or consultation with the other review authors, or both. The certainty of the evidence for each outcome was graded as high, moderate, low, or very low, according to the presence of the following five criteria: risk of bias, inconsistency, indirectness, imprecision and publication bias. Downgrading the certainty of evidence for the included study outcomes was related to issues concerning the risk of bias (e.g. reported randomisation; blinding of outcomes; incomplete outcome data) as well as imprecision (e.g. wide CI, total number of participants lower than 400). We downgraded up to a maximum of three levels. We presented these ratings in the summary of findings table and provided our reasons for downgrading the certainty of the evidence in the explanations.
Results
Description of studies
Results of the search
The electronic searches for this update identified a total of 1356 records (see Figure 1). These were imported in EndNote where 355 duplicates were identified, leaving 1001 records from electronic searches. Seven additional records were identified through other sources, so that 1008 records needed to be screened. We used Cochrane’s Screen4Me workflow to help screen the 1001 records from the electronic searches. First, we identified 28 database records of reviews or systematic reviews which we separated from the rest of the records. The remaining 973 records from electronic searches were classified using Cochrane’s Screen4Me workflow to help identify potential reports of randomised trials. The results of the Screen4Me assessment process can be seen in Figure 2 (July 2020 search) and Figure 3 (August 2021 search). We excluded 321 records as they were ineligible regarding study type (267 records when applying the Sceen4Me workflow on the results of the July 2020 search, and 45 records following the August 2021 search). Based on title and abstract assessment, we then screened the remaining 652 records left in after Screen4Me and the seven records identified through other sources, and excluded 624 (July 2020: 509; August 2021: 115). We examined the remaining 35 records in full text, and excluded nine (Bringas 2015; Cowan 2016; Dezfoolian 2013; Gooding 2011; Iseri 2014; Kim 2000; Mendelson 2016; Sanglakh Goochan Atigh 2017; Yoo 2018; see Characteristics of excluded studies). Six of these were excluded because they were not RCTs or CCTs; one because participants were not diagnosed with ASD; one because the intervention was not music therapy; and one because no relevant comparison condition was included. Additionally, four relevant ongoing studies were identified, and another ongoing study is still awaiting classification. Thus, we included 16 new studies from 20 reports, along with 10 studies from the previous update (including a new report of a previously included study, Thompson 2014), which brought the total number of included studies to 26 (see Characteristics of included studies). 25 of these studies were included in the meta‐analysis. Figure 4 (a) shows the accumulation of studies over time.

Study flow diagram

Sreen4Me summary diagram ‐ July 2020 search

Screen4Me summary diagram ‐ August 2021 search

Accumulation of evidence from 1995 to 2020.
Key: black circles = parallel design; red circles = cross‐over design. Bubble sizes in panels (c) and (d) reflect number of participants randomised.
Included studies
Twenty‐six studies met the criteria for the review (see Characteristics of included studies). Of these, three studies were included in the first version of this review in 2006, seven studies were added for the update of 2014, and 16 new studies (from 20 reports) were added for the present update (see Table 1 for details on this and on further summarised characteristics of included studies).
Most studies (n = 12) were conducted in North America, of which 11 were in the USA and one, Sharda 2018, in Canada. Seven studies were conducted in Asia, specifically three in China (Chen 2010; Chen 2013; Huang 2015), two in Korea (Kim 2008; Moon 2010), one in India (Bharathi 2019), and one in Iran (Ghasemtabar 2015). Four studies were conducted in Europe, i.e. France (Rabeyron 2020), Spain (Mateos‐Moreno 2013), Turkey (Yurteri 2019), and the UK (Porter 2017). One study was conducted in Brazil (Gattino 2011) and one in Australia (Thompson 2014). Finally, one study (Bieleninik 2017) was a multinational trial that recruited participants in nine different countries across the world (Australia, Austria, Brazil, Korea, Israel, Italy, Norway, UK, USA).
IPD were available for 14 studies, either published or from correspondence with authors.
Length of trials
The mean duration of follow‐up was 3.0 months (SD = 2.87; median 2.5; range 3 days to 12 months). The mean duration of the intervention was 2.5 months (SD = 2.05; median 2 months; range 3 days to 8 months). Figure 4 (c) and (d) shows the duration of interventions and follow‐up, respectively. It can be seen that most studies lasted up to about six months (cross‐over trials up to three months).
Participants
Age
Most studies (n = 21) included only children aged between two and 12 years. One study, Porter 2017, included children and adolescents, with ages ranging between eight and 16 years. Another study, Sa 2020, recruited students aged 10 to 14, but this study's data were not used in the meta‐analyses. Two studies recruited both children and adults who were between nine and 21 years old (Schwartzberg 2013; Schwartzberg 2016). Finally, the study by Mateos‐Moreno 2013 included only adults, with a mean age of 25 years. The majority of the participants were males (range 50 to 100%).
Diagnosis
All participants had received a diagnosis of ASD according to current or past classification systems (ICD and DSM), whether identified by a psychological assessment or a psychiatric diagnosis. The study by Porter 2017 included participants with different diagnoses (i.e. anxiety, depression, or ASD); however, only participants with an ASD diagnosis were included in the meta‐analyses.
Standardised tools for diagnosis were used in eight studies (Bieleninik 2017; Ghasemtabar 2015; Gattino 2011; Kim 2008; Mateos‐Moreno 2013; Rabeyron 2020; Sa 2020; Sharda 2018). Specifically, the Autism Diagnostic Observation Schedule (ADOS; Lord 1999) was used in three studies (Bieleninik 2017; Kim 2008; Sharda 2018) for diagnostic confirmation. Of these, two studies (Bieleninik 2017; Sharda 2018) used the Autism Diagnostic Interview‐Revised (ADI‐R; Lord 1994) in addition to the ADOS. The Childhood Autism Rating Scale (CARS; Schopler 1980) was adopted in five studies as a diagnostic tool (Gattino 2011; Ghasemtabar 2015; Kim 2008; Rabeyron 2020; Sharda 2018). The High‐Functioning Version of the Childhood Autism Rating Scale (CARS2‐HF;
Schopler 2010) was used in Sa 2020. In the Mateos‐Moreno 2013 study, the diagnosis of ASD was confirmed using the Structured Clinical Interview for DSM IV Axis I Disorders (SCID‐I; First 2004). Three studies (Buday 1995; Lim 2010; Lim 2011) reported that the ASD diagnoses were performed by healthcare providers of participants. LaGasse 2014 included participants with 'a formal documentation of ASD'.
With a few exceptions (Brownell 2002; Mateos‐Moreno 2013; Rabeyron 2020; Sharda 2018), the studies included both non‐verbal and verbal children with varied cognitive and adaptive abilities, ranging from mild to severe autism. Brownell 2002 recruited four verbal children with 'at least prereading skills'. The Mateos‐Moreno 2013 study included only young adults with severe autism. Rabeyron 2020 reported that all participants had an IQ below 70. Conversely, Sharda 2018 included only participants without intellectual disability (ID), although it was reported that 13 participants in the music therapy group had associated language impairments.
Intelligence quotient (IQ) was reported only in four studies, and was evaluated using different instruments. Bieleninik 2017 used either the Kaufman Assessment Battery for Children (KABC; Kaufman 1987), other instruments, or clinical judgement, with 45% of the sample having an IQ < 70. Gattino 2011 adopted the Raven's Coloured Progressive Matrices as a cognitive measure in 22 participants (Pasquali 2002), with six having ID. Two trials used the Wechsler scales in line with participants' chronological age: Sharda 2018 used the Wechsler Abbreviated Scale of Intelligence (WASI; Wechsler 1999) or the Wechsler Intelligence Scale for Children (WISC; Wechsler 1949), while Rabeyron 2020 used the Wechsler Preschool and Primary Scale of Intelligence (WPPSI; Wechsler 1967). Finally, Buday 1995 reported participants to be ranging from mildly to severely mentally retarded (according to DSM III‐R), but did not systematically evaluate the IQ of participants.
Autism severity
Severity levels were reported in 14 studies, ranging from mild to severe autism, and were mostly evaluated using the CARS (Bharathi 2019; Buday 1995; Chen 2010; Gattino 2011; Ghasemtabar 2015; Kim 2008; LaGasse 2014; Lim 2010; Mateos‐Moreno 2013; Rabeyron 2020; Sa 2020; Sharda 2018). Levels of functioning and adaptive abilities at baseline were systematically assessed only in four studies: Sharda 2018 and Thompson 2014 used different versions of the Vineland Scales (Sparrow 1998; Sparrow 1984); Chen 2013 and Kim 2008 used the Psychoeducational Profile (PEP; Schopler 1979).
Setting
The participants received therapy either at home (Thompson 2014), at school (Brownell 2002; Buday 1995; Sa 2020), in hospital (Chen 2010; Chen 2013; Gattino 2011; Huang 2015; Moon 2010), at outpatient therapy centres (Bieleninik 2017; Ghasemtabar 2015; Kim 2008; Mateos‐Moreno 2013; Porter 2017; Rabeyron 2020), or a combination thereof (Farmer 2003; Lim 2010). Two studies were conducted during summer camps (Schwartzberg 2013; Schwartzberg 2016). For the remaining seven studies, the therapy setting was not reported.
Study size and design
The present systematic review involved a total of 1165 participants, with sample size ranging from 4 (Brownell 2002) to 364 (Bieleninik 2017). The median sample size was 24 participants (M = 45, SD = 70).
Twenty trials adopted a parallel design, of which two were cluster‐randomised (Schwartzberg 2013; Schwartzberg 2016). Six studies had a cross‐over design (Arezina 2011; Brownell 2002; Buday 1995; Kim 2008; Lim 2011; Thomas 2003). The high proportion of parallel designs is in contrast to the previous update, where the majority of included trials used cross‐over designs. The cross‐over trials included in this update were designed to compensate for small sample sizes: the cross‐over trials ranged from four to 22 participants, whereas the parallel trials ranged from 10 to 364 participants. From Figure 4 (b) it can be seen that the sample size of studies tended to increase over time, especially in parallel trials.
Interventions
Music therapy
The majority of studies included in this review examined music therapy in an individual (i.e. one‐to‐one) setting (n = 13). In eight trials, music therapy was delivered in a group setting (Bharathi 2019; Ghasemtabar 2015; LaGasse 2014; Mateos‐Moreno 2013; Rabeyron 2020; Sa 2020; Schwartzberg 2013; Schwartzberg 2016). One study reported that music therapy was delivered either individually or in small groups of up to three people (Yurteri 2019). Thompson 2014 applied a family‐based setting where parents or other family members were also involved in therapy sessions. In four studies, it was unclear whether music therapy sessions were conducted in an individual or group setting (Chen 2010; Chen 2013; Huang 2015; Moon 2010).
The frequency of music therapy sessions ranged from daily to weekly. In seven studies music therapy was provided daily, all with a very short duration of one or two weeks. Of the studies that provided music therapy over a longer time period, it was provided weekly in nine studies, twice weekly in six studies, and in the remaining studies three (Bharathi 2019), four (Chen 2010), or six times (Huang 2015) per week. One study (Bieleninik 2017) randomised to either one or three sessions per week. The duration of sessions ranged from 10 (Arezina 2011; Lim 2010) to 60 minutes (Ghasemtabar 2015; Mateos‐Moreno 2013) with a median of 30 minutes.
In two studies, we combined the data from the two music therapy groups (i.e. low‐intensity and high‐intensity music therapy in Bieleninik 2017; social stories music therapy and music therapy without lyrics in Chen 2013).
Content of the intervention
Twelve studies utilised a highly structured approach to music therapy using receptive techniques (i.e. listening to live or, in the case of Lim 2010 and Rabeyron 2020, pre‐recorded music presented by the therapist) or a mix of receptive elements and active music‐making. Songs sung by the music therapist were composed or chosen individually for the participants and were usually used with specific aims. For example, songs were based on a social story addressing a central problem behaviour of the particular individual in treatment (Brownell 2002) or autistic individuals in general (Schwartzberg 2013; Schwartzberg 2016); they contained signs and words to be learned (Buday 1995; Lim 2010; Lim 2011); or they were used to build a relationship and to provide a safe and understandable structure for the participants in the study (Chen 2010, Chen 2013, Farmer 2003). Active music‐making by the participants, which is often typical for music therapy in clinical practice (Wigram 2006), was reported in five of those studies (Chen 2010; Chen 2013; Farmer 2003; Moon 2010; Sa 2020). Participants were invited to play guitar, pitched or unpitched percussion instruments, and sing songs. Playing instruments was partly used to reinforce adjusted behaviour. Moon 2010 used a music drama based on a theory of mind approach, including narration, singing, and musical instrument playing.
In the other fourteen studies, particular emphasis was put on the interactive and relational aspects of music therapy. Music therapy techniques included improvisation, songs, and structured musical games. Interventions followed a non‐directive approach and focused on engaging the individual in musical interaction, offering opportunities for the individual to make choices and to initiate contact. Generally, the therapist's interventions were depicted as drawing on the individual person's skills, interests, preferences, and motivations as well as on their immediate expression and behaviour. By attuning to the individual musically and emotionally, the therapists create moments of synchronisation that help the individual to experience and recognise core elements of reciprocal communication (Kim 2008; Schumacher 1999a; Schumacher 1999b; Stephens 2008; Thompson 2014; Wigram 2009). Mateos‐Moreno 2013 combined music therapy with dance/movement therapy activities, such as massages with small balls, simulation situations, imitation, role‐playing, and dancing.
Several of the studies employed specifically developed treatment guidelines in the form of a treatment contingency plan (Thompson 2014), or a treatment manual (Bieleninik 2017; Ghasemtabar 2015; Kim 2008; LaGasse 2014; Porter 2017; Sa 2020; Sharda 2018). In these protocols, principles and procedures of therapy are specified whilst allowing the therapist to adapt interventions flexibly according to the child's needs and the specific requirements of the situation.
Comparators
'Placebo' therapy
A total of 15 studies used a 'placebo' therapy to control for the non‐specific elements of the therapy. Thirteen of these used a 'placebo' activity to control for the non‐specific effects of therapeutic attention. Since, in all of these studies, music was considered as the specific ingredient of music therapy, the placebo conditions were constructed to closely match the music therapy condition, only that music was not used. Specifically, a social story was read instead of sung to the participants (Brownell 2002; Moon 2010; Schwartzberg 2013; Schwartzberg 2016); rhythmic or normal speech was used instead of singing (Buday 1995; Lim 2010; Lim 2011); play activities were offered without using songs or musical instruments (Farmer 2003); the therapist engaged in interaction with the child by responding to the child's behaviour non‐musically and using non‐music toys (Arezina 2011; Kim 2008; Sharda 2018; Thomas 2003); or the participants were involved in a social skills group (LaGasse 2014). Two studies (Bharathi 2019; Rabeyron 2020) used another type of 'placebo' therapy consisting of passive music listening. In both studies participants passively listened to songs played using a CD player, without any interaction with the therapists. Thus, not the music, but the therapist's attention was seen as the specific ingredient in these studies.
Standard care
Eleven studies compared music therapy with standard care. In Bieleninik 2017, the control group received enhanced standard care, which consisted of the routine care available at the site, plus three 60‐minute sessions of parent counselling over the five months of intervention (at 0, two, and 5 months). Three studies (Chen 2010; Chen 2013; Huang 2015) compared music therapy with a comprehensive/integrated treatment including several activities, such as auditory integration training, sensory integration, special education, language therapy, speech therapy, and play therapy. Gattino 2011 reported that participants received routine clinical services, including medical examinations and consultations. Sa 2020, where a waiting‐list control design was applied, and Ghasemtabar 2015 described no intervention. In Mateos‐Moreno 2013, participants in the control group were attending their regular therapies as well as receiving pharmacological treatment. Analogously, in the Porter 2017 study, participants were following psychiatric counselling and/or medication. In the Thompson 2014 study, participants received varying forms of services and support from early childhood intervention centres. Finally, in Yurteri 2019, participants in the control condition received no treatment except monthly routine child psychiatric follow‐up and special education.
Multiple‐armed trials
Some studies included other conditions whose data were not included in this review. Brownell 2002 reported observations during a baseline period and a washout period with no intervention. Arezina 2011 also observed behaviour in an 'independent play' group, which we considered was neither 'placebo' therapy nor 'standard care'. Therefore, data from this group were not included in this review. Lim 2010 and Lim 2011 compared music training with both a speech training (included) and a 'no training' group (excluded).
Outcome measures
Both generalised and non‐generalised outcomes were used in the included studies. Non‐generalised outcomes refer to changes in the child's non‐generalised behaviour in the same setting where the intervention takes place, as opposed to generalised outcomes which are observed in other settings (Warren 2011).
Primary outcomes
1) Global improvement
Global improvement was defined as a binary outcome (improved versus not improved or unknown, on a scale measuring clinical global impressions or on a global measure used as primary outcome in a study). The negative outcome was imputed for missing values, enabling a full intention‐to‐treat analysis. Global improvement was measured using the Clinical Global Impression scale (CGI; Busner 2007) or if this was not available, the primary outcome chosen by study authors.
Rabeyron 2020 used the Clinical Global Impression‐Severity scale (CGI‐S; Busner 2007). The CGI‐S is a 7‐point clinician‐rated scale used to rate the severity of a disorder, with higher scores indicating greater severity. The scores range between 1 ('normal') and 7 ('among the most extremely ill patients').
Seven studies (Bieleninik 2017; Bharathi 2019; Kim 2008; LaGasse 2014; Porter 2017; Schwartzberg 2013; Thompson 2014) had a clearly defined primary outcome (other than CGI) and provided IPD from which to calculate global improvement.
2) Social interaction
Social interaction was examined in 14 studies. The following scales were used:
i. The TRIAD Social Skills Assessment (TSSA; Stone 2010) is a 'criterion‐based tool' which provides specific assessment considering parent, teacher, observation, and direct interaction with the children aged six to 12 years. It consists of three components: Problem Behavior Rating Scale, Social Skills Survey, and Social Skills Rating Form. In Bharathi 2019, one of the three components of the TSSA (i.e. the Social Skills Rating Form) was used. Each item is rated on a 4‐point Likert scale, with higher scores indicating more favourable behaviours.
ii. The 'social communication' domain of the Childhood Autism Rating Scale (CARS; Magyar 2007; Brazilian version: Pereira 2008; Rapin 2008) was used in three studies (Chen 2013; Gattino 2011; Rabeyron 2020). The CARS (Schopler 1980) is a 15‐item observation‐based behavioural rating scale administered by health professionals for the diagnosis of children with autism and pervasive developmental disorders. Total scores can range between 15 and 60, with higher scores indicating higher severity. The 'social communication' domain has been derived from the factor analysis of the CARS (see Magyar 2007; McConachie 2015) and is composed of five items of the original tool, all related to social communication skills (i.e. imitation, verbal and nonverbal communication, consistency of intellectual responses and general impressions). Similarly to the full scale, this domain was administered by investigators blind to group allocation (unclear for Chen 2013). As in Chen 2013 SD were missing, we imputed SD = 3 in line with other studies using the same scale.
iii. The 'social affect' (SA) subscale of the Autism Diagnostic Obervation Schedule (ADOS; Lord 1999) was used in Bieleninik 2017. The ADOS is a semi‐structured, interactive observation by trained health professionals. It has been designed to assess aspects of communication, social reciprocal interaction, play, and stereotyped behaviours and restricted interests. It consists of four modules, appropriate for individuals with different developmental and language levels. ADOS‐SA is composed of two subdomains, i.e. 'language and Communication' and 'reciprocal Social interaction'. The ADOS‐SA score can range from 0 to 24 (module 1 and 2) or 0 to 27 (module 3), with higher scores indicating greater symptom severity. In the study by Bieleninik 2017, it was rated by independent, blinded health professionals.
iv. The total score of the Social Responsiveness Scale (SRS; Constantino 2005) was used in four studies (Bieleninik 2017; LaGasse 2014; Sharda 2018; Thompson 2014). The SRS is a 65‐item scale measuring the severity of autism symptoms as they occur in natural social settings. The total score can range from 0 to 195. Higher scores are indicative of greater symptom severity. The SRS is rated by parents or teachers and it is appropriate for use with children from four to 18 years of age. In Thompson 2014, the Preschool Version of the SRS was used. Sharda 2018 used the SRS‐2, a revised and more recent version of the SRS (Constantino 2012). For Sharda 2018, where the SD was not reported, we imputed SD = 30 based on other studies using the same scale.
v. The Social Skills Rating System scale (SSRS; Gresham 1990), elementary form, was completed by participants' parents in Ghasemtabar 2015. The total score can range between 0 and 80. Higher scores indicate higher social skills and thus favourable outcome.
vi. The 'social approach behaviours' subscale of the Pervasive Developmental Disorder Behavior Inventory, Korean version (PDDBI; Cohen 1999) was used in Kim 2008. The scale was filled out by professionals (i.e. a teacher or a therapist of the child) who were blind to experimental condition. Higher scores are indicative of better social skills.
vii. The total score of the Social Skills Improvement System (SSIS) rating scales (Gresham 2008) was used in one study (Porter 2017). The scale was rated by parents and self‐rated by youth. The SSIS is a scale with 75 (self) to 79 (parent) items across 3 subdomains (i.e. social skills, competing problem behaviours, academic competence). The total score can range from 0 to 225 (self) or 237 (parent), with higher scores representing favourable outcomes.
viii. The Autism Social Skills Profile (ASSP; Bellini 2007) was used in Schwartzberg 2013. The ASSP is a 49‐item tool divided into three sub‐categories: social reciprocity (SR), composed of 23 items; social participation (SP), composed of 12 items; and detrimental social behaviours (DSB), composed of 10 items. Each item is rated on a 4‐point Likert scale. Even though Schwartzberg 2013 calculated the ASSP score for each sub‐category, the ASSP total score was used for the outcome 'social interaction'. The scale was completed by participants’ legal guardians.
ix. The Vineland Social‐Emotional Early Childhood Scales (SEEC; Sparrow 1998) were used in one study (Thompson 2014). The Vineland SEEC is a 88‐item measure used to assess the social and emotional functioning of children from birth through 5.11 years. In Thompson 2014, It was administered through a semi‐structured interview with the child's parent participating in the study. Only two out of three subscales (i.e. interpersonal relationships; play and leisure time) were used in the study.
Some studies used more than one score to measure social interaction at the same time point. Bieleninik 2017 used both ADOS‐SA and SRS; only ADOS assessors were blinded, however both perspectives of parents (SRS) and professionals (ADOS‐SA) were important so we merged both. Porter 2017 used parent and self‐reports of the same scale; both were considered equally valid; we merged both to represent both perspectives. Thompson 2014 used both the SRS and Vineland SEEC; again, we merged both because both were equally valid.
For the meta‐analysis, given that some scales in this domain were 'negative' (ADOS, SRS, CARS) and others 'positive' (ASSP, SSIS, SSRS), we reversed the 'negative' scales in the analysis so that the positive sign of the analysis matches the positive meaning conveyed by 'social interaction' (i.e. positive effects represent a favourable outcome).
Three studies assessed social interaction skills using non‐validated outcome measures, through the observation of participants' behaviour within therapy sessions:
i. In Arezina 2011, the researcher coded videotaped sessions for 'requesting (initiating joint attention)' behaviours such as pointing, giving an object to the therapist, or touching the therapist while making eye contact; an independent observer additionally coded a third of the session material. In Thomas 2003, 'requesting behavior' was defined in a similar way. Video tapes were coded by a music therapy intern and rated for two outcomes, task behaviour and requesting.
ii. One study (Kim 2008) also investigated observed behaviours related to social interaction in the intervention setting. These measures included frequency and duration of the child's turn‐taking, frequency of imitation behaviours, frequency and duration of both 'emotional synchronicity' and 'musical synchronicity', and behaviours associated with the frequency and duration of joy (i.e. smiling and laughing) on the part of the child. The coding procedure was conducted by the lead investigator by microanalytically (second by second) observing DVD recordings, with subsequent coding supplemented by a trained research assistant who was blind to session order.
3) Non‐verbal communication
Non‐verbal (i.e. gaze‐related and gestural) communication was examined in 11 studies. Six studies used validated outcome measures, as follows:
i. The 'non‐verbal communication' domain of the CARS was used in three studies (Chen 2013; Gattino 2011; Rabeyron 2020).
ii. The Early Social Communication Scales (ESCS; Mundy 2003) is a videotaped structured play‐based assessment measuring non‐verbal social communication skills in children aged between six and 30 months. In Kim 2008, the shortened version of the ESCS was used. The ESCS provides frequencies of scores for 'initiation of joint attention' and 'responding to joint attention'. The scoring was administered by the researcher and by two trained research assistants who were blind to group assignment.
iii. The Children’s Communication Checklist (CCC‐2; Bishop 1998), used in Sharda 2018, is a parent/caregiver‐administered 70‐item rating scale to measure children’s social communication skills across 10 domains. This tool is focused on the assessment of non‐verbal communication, pragmatics, as well as aspects of language structure and discourse. Sharda 2018 used the standard general communication composite standard score as a measure of the child's general pragmatics and communication ability. Higher scores indicate better social communication skills.
iv. The MacArthur‐Bates Communicative Development Inventories – Words and Gestures (MBCDI‐W&G; Fenson 2007) are a set of parent‐rated measures designed to evaluate the verbal and non‐verbal communicative skills of young children. The section 'action and gestures' of the MBCDI‐W&G was used as a measure of non‐verbal communication in Thompson 2014. Higher scores are indicative of higher levels of non‐verbal communication.
Four studies assessed non‐verbal communication skills using non‐validated outcome measures, through the observation of participants' behaviour within therapy sessions (Buday 1995; Farmer 2003; Kim 2008; LaGasse 2014). Measures of non‐verbal communication skills in these studies are reported below:
i. In Buday 1995, the outcome consisted simply of the number of signs correctly imitated within a session.
ii. In Farmer 2003, a completed gesture was given a score of two, and an attempt a score of one, and the outcome consisted of the sum of these scores for all attempted and completed gestures within a session.
iii. In Kim 2008, frequency and duration of eye contact (i.e. the child looking at the therapist) was coded by microanalytic analysis of the session material.
iv. In LaGasse 2014, video recordings of children in both groups were analysed for instances of group communication and social interaction attempts. Two trained music therapy research assistants completed the coding of predefined behaviours (i.e., eye gaze, joint attention, initiation of communication, response to communication, withdrawal behaviours). Five‐minute clips were randomly selected from each session for each child. The session order was concealed from the coders.
4) Verbal communication
Communicative skills in verbal communication were addressed in 11 studies. The authors used the following outcome measures:
i. The 'verbal communication' domain of the CARS was used in three studies (Chen 2013; Gattino 2011; Rabeyron 2020).
ii. Thompson 2014 used the subscales 'phrases understood', 'words understood' and 'words produced' of the MBCDI‐W&G (Fenson 2007).
iii. Comprehension Checks (CCs) were used by Schwartzberg 2013 and Schwartzberg 2016. They consisted of a series of five close‐ended questions (yes or no) to evaluate participants' comprehension of social stories.
iv. The Peabody Picture Vocabulary Test (PPVT‐4; Dunn 1981), a short, standardised measure of one‐word receptive vocabulary, was used in one study (Sharda 2018). The test requires the participant to choose one of four colour pictures on a page. Higher scores indicate better receptive vocabulary.
v. For Buday 1995, Farmer 2003, Lim 2010, and Lim 2011, independent observers rated in‐session behaviour by counting the frequency of appropriate verbal responses in a manner similar to the previous outcome. The outcome measures used in these four studies were unpublished.
5) Quality of life
Quality of life (QoL) was measured in three studies, using three different scales:
i. Bieleninik 2017 evaluated the QoL of both the child and the family as a whole using a Visual Analogue Scale (VAS) ranging from 0 to 100, where 0 corresponded to the worst and 100 to the best possible QoL.
ii. Sharda 2018 used the Beach Center Family Quality of Life Scale (FQoL; Park 2003) to assess satisfaction with different aspects of family quality of life. FQoL is a 25‐item questionnaire containing five subscales: family interaction, parenting, emotional well‐being, physical/material well‐being, and disability‐related support. Higher scores correspond to better satisfaction in QoL.
iii. Yurteri 2019 evaluated participants' QoL using the Pediatric Quality of Life Inventory (PedsQL; Varni 1999). It consists of a 23‐item scale designed to measure the core dimensions of health as delineated by the World Health Organization, as well as role (school) functioning. In Yurteri 2019, the scale was completed by parents according to participants' age. The PedsQL is a multidimensional scale composed of four dimensions (i.e. physical functioning, emotional functioning, social functioning, school functioning). Moreover, three summary scores can be calculated (i.e. total scale score, physical health summary score, psychosocial health summary score). The Yurteri 2019 paper reported both the total scale and the psychosocial health summary scores. Higher scores correspond to better quality of life.
6) Total autism symptom severity
Total autism symptom severity was measured in nine studies. Outcome measures included the following:
i. The CARS (Schopler 1980) was used in three studies (Bharathi 2019; Chen 2013; Rabeyron 2020), although in Chen 2013 CARS scores were not reported or made available to us.
ii. The total score of the ADOS (Lord 1999) was used by Bieleninik 2017. The ADOS total score is calculated summing up the raw scores of the ADOS‐SA and 'restricted and repetitive behaviour' (ADOS‐RRB) scores.
iii. the Autism Treatment Evaluation Checklist (ATEC; Rimland 1999) was used by LaGasse 2014. The ATEC is a 77‐item checklist that includes four areas (speech and communication, sociability, sensory/cognitive awareness, health/physical behaviour). It is completed by parents, teachers and/or primary caretakers of autistic children. Total ATEC scores range from 0 to 180. Lower scores on ATEC demonstrate higher functioning.
iii. The total score of the Autism Behavior Checklist (AuBC; Krug 1980) was adopted as a measure of total symptom severity in four studies (Chen 2010; Chen 2013; Huang 2015; Yurteri 2019). It consists of 57 items with higher scores indicating higher severity. For Huang 2015, where no SD was reported, we imputed SD = 12 from other studies that used the AuBC (Chen 2010; Chen 2013; Yurteri 2019).
v. The Revised Clinical Scale for the Evaluation of Autistic Behavior (ECA‐R; Barthélémy 2003) was used by one study (Mateos‐Moreno 2013). It is composed of 29 items with lower scores corresponding to favourable outcomes.
7) Adverse events
Two studies collected adverse event data. In Bieleninik 2017, hospitalisation or other institutional stay (including pre‐planned stays) were included as adverse events; these and any other serious or non‐serious adverse events were reported by parents. Porter 2017 collected serious adverse events and non‐serious adverse events related to study procedures. None of the other studies reported information on adverse events.
Secondary outcomes
8) Adaptive behaviour
Nine studies evaluated adaptive behaviours. Validated scales were used in five studies, along with other non‐validated measures:
i. The Psychoeducational Profile (PEP; Schopler 1979; Muris 1997) was used by Chen 2010. The PEP consists of a series of toys, objects, and games which are offered to the child. It provides information on developmental items and pathology items. Higher scores are favourable. In the Chen 2010 study, a total score as well as the scores of three domains (i.e. relationship and emotions, interest in games and objects, sensory response) were provided. The total scores were used as measure of adaptive behaviour.
ii. The Child Behavior Checklist (CBC; Achenbach 2001), used by Porter 2017, is a parent‐rated tool consisting of 113 questions, scored on a three‐point Likert scale (0: absent, 1: occurs sometimes, 2: occurs often). Thus, lower scores are favourable. CBC scores were not reported in the publication, but available in IPD from the study authors.
iii. The Aberrant Behavior Checklist (ABC; Aman 1985) is a 58‐item caregiver‐report checklist designed to assess maladaptive behaviours in people with developmental disabilities. Higher scores correspond to greater maladaptive behaviours. The ABC Total Score was used in Rabeyron 2020.
iv. The maladaptive behaviours subdomain of the Vineland Adaptive Behavior Scales (VABS; Sparrow 1984) was used by Sharda 2018 to identify the presence of behavioural problems, such as challenging internalising and externalising behaviours. The scale is administered as a semi‐structured interview to a parent or caregiver. Lower scores are favourable.
v. Three studies investigated adaptive behaviours within the interventions setting (Arezina 2011; Kim 2008; Thomas 2003). In Arezina 2011 and Thomas 2003, videotaped sessions were coded for 'interaction (engaging in joint attention)' and 'on‐task behavior', respectively; this included activities such as following a direction, physically manipulating a toy in a functional manner, and imitating a movement or vocal sound. In Kim 2008, sessions were scored by frequencies of 'compliant response', 'non‐compliant response', and 'no response'.
vi. Restricted and repetitive behaviours were measured in Bieleninik 2017 using the ADOS‐RRB domain (Lord 1999). Higher scores indicate more severe repetitive behaviours.
vii. Brownell 2002 addressed occurrence of individually targeted repetitive behaviours outside therapy sessions. Independent observers (i.e. teachers) counted how often the targeted behaviour occurred in the classroom. The frequency count was used as the outcome measure. No published scale was used in the Brownell 2002 study.
Where necessary, we reversed scores so that a high score on adaptive behaviour indicated a favourable outcome.
9) Quality of family relationships
Family relationships were evaluated in three studies, with different tools:
i. Kim 2008 used the Mother Play Intervention Profile (MPIP), a measure specifically developed for the study to describe characteristics of interactions between mothers and autistic children during a casual play situation at their home. Scores were based on video observations conducted by the researcher, supplemented by an independent observer's coding for a third of the sessions.
ii. In Porter 2017, the McMaster Family Assessment Device (FAD; Epstein 1983) was completed by parents. The FAD is a 60‐item questionnaire that measures an individual’s perceptions of his/her family. Each item is scored on a 4‐point scale. The higher the score, the more problematic the family member perceives the family's overall functioning
iii. Thompson 2014 used the Parent‐Child Relationship Inventory (PCRI; Gerard 1994), a self‐report questionnaire for parents to assess the parent‐child relationship and parents' attitudes towards parenting. The full instrument consists of 78 items, rated on a 4‐level scale ranging from 'strongly agree' to 'strongly disagree'. Higher scores are indicative of positive parenting.
10) Identity formation
Identity formation includes all the processes that allow autistic people to develop a clear and unique view of themselves and of their identity. Domains related to identity formation were evaluated in two studies.
i. the Bandura self‐efficacy scale (Bandura 1978) was used to measure self‐efficacy in the Moon 2010 study. The scale is composed of nine items. Higher scores indicate higher self‐efficacy levels.
ii. the Fenigstein self‐awareness scale (Fenigstein 1979) was used to measure self‐awareness in the Moon 2010 study. It is composed of 20 items, with higher scores indicating greater levels of self‐awareness.
iii. the Rosenberg self‐esteem scale (Rosenberg 1965) was adopted as a measure of self‐esteem in both Moon 2010 and Porter 2017. It is a 10‐item self‐report scale that measures global self‐worth by measuring both positive and negative feelings about oneself. All items are answered using a 4‐point Likert scale format ranging from 'strongly agree' to 'strongly disagree'. The total score can range between 10 and 40. Higher scores indicate higher self‐esteem.
11) Depression
Depression was evaluated in one study (Porter 2017), using the Center for Epidemiological Studies Depression Scale for Children (CES‐DC; Faulstich 1986; Weissman 1980). This is a 20‐item self‐report questionnaire for young people between the ages of six and 17. It asks young people to rate how many depressive symptoms they have experienced in the last week. Higher scores represent higher levels of symptoms.
12) Cognitive ability
Cognitive ability was evaluated in one study (Sa 2020), using the Test of Everyday Attention for Children 2 (TEA‐Ch2; Manly 2016). The TEA‐Ch2 is a tool for young people between the ages of five and 15 that assesses three areas of attention skills (selective attention, sustained attention, and attentional control/switching attention) using eight tasks. However, data from this study were not included as the outcome measure was not applied by an independent rater, but by the researcher who also administered the intervention protocol (i.e. the therapist), thus violating this review's eligibility criteria for outcome measures.
Funding sources
The American Music Therapy Association (AMTA) provided funding support for two studies (LaGasse 2014: Arthur Flagler Fultz Research Fund; Thomas 2003: Mid‐Atlantic Region of the AMTA). University funding was available for two studies (Kim 2008: Aalborg University, Denmark; Thompson 2014: University of Melbourne, Australia). The Thompson 2014 study was also supported by the Victorian Department of Education and Early Childhood Development. Further funding sources included the Science and Engineering Research Board, Government of India, New Delhi (Bharathi 2019); the Chongquing Natural Science Foundation (Chen 2010; Chen 2013); the Chongqing Medical Specialty Construction (Chen 2013); the Fund of Incentive to Research of Porto Alegre Clinical Hospital and the Brazilian Research Council (Gattino 2011); the Big Lottery Fund (Porter 2017); Entreprendre pour Aider and the Academie Francaise (Rabeyron 2020); the Canadian Institutes of Health Research and Quebec Bioimaging Network (Sharda 2018). Bieleninik 2017 was supported by the Research Council of Norway, the University of Bergen, Norway, POLYFON Knowledge Cluster for Music Therapy, and a range of further governmental and university funding sources and foundations across participating countries (see Characteristics of included studies for details). For the remaining 14 studies, no funding sources were reported, or sources of support were reported as 'nil' (Ghasemtabar 2015).
Ongoing studies
Four relevant studies were still ongoing at the time of assessment (see Ongoing studies). Conducted in the USA, NCT03560297 used a cross‐over design and applied a parent‐child music class programme including parent training, peer inclusion, and musical play for 12 weeks, compared with a waiting‐list programme. The estimated sample size of children aged 20 to 72 months was 68. Primary outcomes included a standardised motor imitation assessment, and parent questionnaires on non‐verbal communication, parenting stress, and parenting efficacy/quality.
Conducted in South Korea, ISRCTN18340173 used a parallel design involving propensity score matching and applied weekly improvisational music therapy sessions for one year in addition to standard care, compared with standard care alone. The estimated sample size of children aged 24 to 72 months was 50. Primary outcomes were the ADOS and the CARS‐2.
Conducted in Hong Kong, NCT04557488 used a parallel design and applied a 12‐week social skill intervention using group music therapy, compared with a 12‐week non‐musical intervention (i.e. behavioural‐based social skill group training). The estimated sample size of children aged six to 13 years was 80. Primary outcomes included the CARS‐2, the SRS‐2, and in‐session social behaviour.
Conducted in Austria and Norway, NCT04936048 uses a cross‐over design and applied 12 weekly sessions of one‐on‐one music therapy with an equal number of non‐musical one‐on‐one play therapy sessions. The estimated sample size of children aged six to 12 years was 80. Primary outcomes included the CCC‐2 and measures of brain connectivity of frontotemporal regions.
Studies awaiting classification
One potentially relevant study is awaiting assessment since the information available in the trial registration was not sufficient to assess eligibility (NCT03267095); recruitment has not started. It is planned to be a randomised, unblinded study, conducted in Egypt, comparing the effects of a music therapy intervention to parent counselling over a 12‐month period. The researchers planned to recruit 60 children between three and seven years old with an IQ > 75. The outcome was focused on verbal communication, through the administration of an Arabic Language test evaluating semantics, expressive morphology, syntax, and pragmatics.
Excluded studies
Nine studies identified through the update search were excluded for the following reasons: six studies did not have an RCT or CCT design (six case series, i.e. studies comparing different treatments that all participants received in the same order); one study because the intervention was not music therapy, but movement activities with music; one study because participants were not diagnosed with ASD, but with severe neurological disorders; and one study because it did not include a relevant comparison condition (both groups were music therapy). See Characteristics of excluded studies, where in addition to the nine studies excluded with reasons in this update, we also report seven studies that were excluded in previous versions of this review. From the fifty‐nine studies excluded with reasons in the two previous versions of this review, these seven were selected in a process of reassessment as the most relevant that one might expect to see in this review. Six of them were excluded because they did not have an RCT or CCT design; one study because it was not an intervention, but an assessment study.
Risk of bias in included studies
A visual representation of the included studies' risk of bias for each domain, as specified below, is shown in Figure 5. Figure 6 provides a summary of the risk of bias results for each included study.

Risk of bias graph: review authors' judgements about each risk of bias item presented as percentages across all included studies

Risk of bias summary: review authors' judgements about each risk of bias item for each included study
Allocation
Twenty of the included studies stated explicitly that randomisation was used to assign participants to treatment groups. Methods of randomisation included using computer‐generated random sequences for determining allocation to an experimental condition (Bieleninik 2017; Gattino 2011; LaGasse 2014; Rabeyron 2020; Sharda 2018; Thompson 2014), manually generated random sequences by, for example, coin tossing (Kim 2008; Lim 2011; Sharda 2018), and a Latin Square for determining session order (Arezina 2011). We judged these studies as being at low risk of bias. In eleven of the 26 studies (Buday 1995; Chen 2010; Chen 2013; Farmer 2003; Huang 2015; Lim 2010; Thomas 2003; Sa 2020; Schwartzberg 2013; Schwartzberg 2016; Yurteri 2019), methods of randomisation were not specified and the risk of bias was judged as unclear. In the remaining five studies, no information about randomisation was provided or the described methods of randomisation did not ensure a random allocation of participants; these were rated as having high risk of bias.
The description of allocation concealment was adequately described in two studies (Bieleninik 2017; Thompson 2014) and partly clarified in three studies (Gattino 2011; Porter 2017; Sharda 2018); we judged these to be at low risk of bias. For three studies, allocation was not concealed and these were judged as being at high risk of bias (Bharathi 2019; Ghasemtabar 2015; Mateos‐Moreno 2013). The remaining eighteen studies did not provide specific information on allocation concealment and the risk of bias was rated as unclear.
Blinding
Due to the nature of the intervention, it was not possible to blind those who delivered music therapy or those who received it. Consequently, neither participants nor therapists of the studies under review could be declared as blinded. However, although autistic individuals were not blinded, this was unlikely to introduce bias as they were usually not fully aware of available treatment options or study design (Cheuk 2011). The possible risk of bias introduced by therapists administering the intervention was unknown. Therefore, we judged the risk of performance bias as unclear in all studies in the review.
In four of the included studies, assessors were blinded to the treatment condition (Bieleninik 2017; Gattino 2011; Rabeyron 2020; Sharda 2018). In three further studies (Buday 1995; Lim 2010; Lim 2011), assessors were blinded to the purpose of the research. We judged all these seven studies as being at low risk of bias. In Kim 2008, non‐generalised outcome measures and two of the measures assessing generalised skills (ESCS, MPIP) were rated by the researcher and complemented by independent coders (inter‐rater reliability ranging from 0.70 to 0.98). We judged the risk of bias as being unclear. Studies primarily using parent reports as outcomes were judged as being at unclear risk of bias (Ghasemtabar 2015; LaGasse 2014; Yurteri 2019). In Thompson 2014, measures were based on parent reports; however, they contained internal safeguards to address bias as evidenced by high correlations with non‐parent‐rated measures and high test‐retest correlations (e.g. Pearson's r = 0.70, P = 0.01, for the SRS's one‐month test‐retest reliability). Nevertheless, we judged this study to be at unclear risk. We also judged studies as being at unclear risk of bias where detailed information about assessor blinding was missing (Arezina 2011; Brownell 2002; Chen 2010; Chen 2013; Huang 2015; Mateos‐Moreno 2013; Thomas 2003). In four studies, outcomes were assessed by the participants through self‐report questionnaires (Moon 2010; Porter 2017; Schwartzberg 2013; Schwartzberg 2016). In two studies, outcome assessors were not blinded (Bharathi 2019; Farmer 2003), and in one study, Sa 2020, the outcome measure was applied by the therapist administering the intervention (thus yielding the data ineligible for our meta‐analysis). For these remaining seven studies, we judged the risk of bias to be high.
Six studies used more than one rater to independently assess outcomes. Five of those studies reported a high inter‐rater reliability for the assessment of outcomes (Arezina 2011: inter‐observer agreement ranging from 85.7% to 98.9%; Brownell 2002: inter‐rater reliability 0.86 to 0.94; Buday 1995: agreement rate 98%; Farmer 2003: agreement rate 91%; Kim 2008: inter‐rater reliability 0.70 to 0.98, as reported above). In Mateos‐Moreno 2013, measures were taken independently by two assessors. Any possible disagreement was discussed until agreement was reached on a final score to be used for analysis.
Incomplete outcome data
Twenty‐three studies reported no or low attrition rates, leading to a low risk of bias judgement. Out of these studies, very low to acceptable dropout rates, ranging from 2% to 28% until the post‐intervention assessment, were reported for five studies (Bieleninik 2017; Porter 2017; Rabeyron 2020; Sharda 2018; Thompson 2014). LaGasse 2014 excluded a participant with available data from the published analysis; however, the IPD‐based analyses presented here included all participants. Three studies had dropout rates above 30% and were judged as entailing a high risk of bias due to attrition (Kim 2008: 5/15, 33%; Schwartzberg 2013: 77/107, 72%; Schwartzberg 2016: 64/93, 69%).
Selective reporting
There was no evidence of selective reporting of outcomes in the included studies, leading to a low risk of bias judgement.
Other potential sources of bias
We considered inadequate music therapy methods and inadequate music therapy training of therapists as additional potential sources of bias. For the majority of studies, we detected none of these sources of bias. For Chen 2013 and Huang 2015, it was unclear whether the music therapy was provided by a trained music therapist. Moon 2010 described a music drama approach which might closely link to music therapy, but it was unclear whether this approach was provided by a trained music therapist. For Buday 1995, we found both the music therapy methods and the training of the person delivering the intervention to be of unclear adequacy.
Effects of interventions
Twenty‐five of the included studies were included in the meta‐analyses; in one study (Sa 2020), outcomes were measured by the therapist and therefore not eligible to be included. We used fixed‐effect analyses for all outcomes, but changed to a random‐effects model when a substantial amount of heterogeneity (i.e. 50% or higher; Deeks 2021) was identified immediately post‐intervention that could not be explained by clinical subgroups.
Primary outcomes
Global improvement
Post‐intervention
In eight studies, global improvement was assessed immediately post‐intervention (Bharathi 2019; Bieleninik 2017; Kim 2008; LaGasse 2014; Porter 2017; Rabeyron 2020; Schwartzberg 2013; Thompson 2014). The RR for global improvement between music therapy and comparison groups was 1.22 (95% confidence interval (CI) 1.06 to 1.40, P = 0.006; number needed to treat for an additional beneficial outcome NNTB = 11 for low‐risk population, 95% CI 6 to 39; NNTB = 6 for high‐risk population, 95% CI 3 to 21; 8 studies, 583 participants; moderate‐certainty evidence; Analysis 1.1), suggesting that global improvement is more likely to occur with music therapy than with 'placebo therapy' or standard care alone. There was no heterogeneity (Chi2 = 5.53, P = 0.60, I2 = 0%) and therefore we did not examine potential moderators; we retained the fixed‐effect model for this outcome. Changing to a random‐effects model yielded similar results (P = 0.002). In a sensitivity analysis excluding data from two high‐attrition studies (Kim 2008; Schwartzberg 2013), the effect for global improvement showed no substantial changes (P = 0.004).
One to five months follow‐up
Two studies (Bharathi 2019; Porter 2017) also evaluated global improvement in the period one to five months post‐intervention. The RR for global improvement between music therapy and comparison groups for this period was 1.19 (95% CI 0.90 to 1.57; P = 0.22; 2 studies, 99 participants), indicating no clear evidence of a difference between music therapy and comparison groups.
Six to 11 months follow‐up
One study (Bieleninik 2017) measured global improvement in the period six to 11 months post‐intervention. The RR for global improvement between music therapy and comparison groups for this period was 1.14 (95% CI 0.91 to 1.41, P = 0.25; 1 study, 364 participants), again indicating no clear evidence of a difference between the groups.
Social interaction
Post‐intervention
Immediately post‐intervention, average endpoint scores of social interaction were available from 12 studies (Bharathi 2019; Bieleninik 2017; Chen 2013; Gattino 2011; Ghasemtabar 2015; Kim 2008; LaGasse 2014; Porter 2017; Rabeyron 2020; Schwartzberg 2013; Sharda 2018; Thompson 2014). As heterogeneity was substantial (Chi2 = 29.51, P = 0.002, I2 = 63%) and could not be explained clinically via subgroup analyses (results not shown), we accordingly conducted a random‐effects analysis for this outcome. The SMD effect estimate was in the small to medium range, but the CI ranged from no effect to a medium effect (SMD 0.26, 95% CI −0.05 to 0.57, P = 0.11; 12 studies, 603 participants; low‐certainty evidence; Analysis 1.2), thus indicating no clear evidence of a difference between music therapy and comparison groups. Investigating the related funnel plot did not yield any asymmetry, thus there was no clear indication of a risk of non‐reporting bias.
During intervention
Average endpoint scores of social interaction during the intervention were available from three studies (Arezina 2011; Kim 2008; Thomas 2003) and showed a large effect (SMD 1.15, 95% CI 0.49 to 1.80, P < 0.001; 3 studies, 44 participants; Analysis 1.2), favouring music therapy over comparison groups. The results were homogeneous (Chi2 = 1.50, P = 0.47, I2 = 0%). We conducted a sensitivity analysis excluding data from the high‐attrition study (Kim 2008), and found that the effect for social interaction remained statistically significant (P = 0.05). No heterogeneity was detected for this analysis (Chi2 = 0.64, P = 0.42, I2 = 0%).
One to five months follow‐up
Effect estimates in the period one to five months post‐intervention (SMD 0.54, 95% CI −0.11 to 1.19, P = 0.10; 2 studies, 59 participants) showed little to no difference between the conditions.
Six to 11 months follow‐up
Effect estimates in the period six to 11 months post‐intervention (SMD −0.06, 95% CI −0.30 to 0.18, P = 0.63; 1 study, 258 participants) indicated no clear evidence of a difference between music therapy and comparison groups.
Non‐verbal communication
Post‐intervention
Seven studies assessed non‐verbal communication immediately post‐intervention (Chen 2013; Gattino 2011; Kim 2008; LaGasse 2014; Rabeyron 2020; Sharda 2018; Thompson 2014). The heterogeneity found for this comparison was only moderate (Chi² = 9.81, P = 0.13, I² = 39%), and therefore we did not examine potential moderators; we kept a fixed‐effect SMD model for this outcome. The effect size for difference between music therapy and control was in the small to medium range, but the CI ranged from no effect to a medium effect (SMD 0.26, 95% CI −0.03 to 0.55, P = 0.08; 7 studies, 192 participants; low‐certainty evidence; Analysis 1.3), suggesting little to no difference between the conditions. Changing to a random‐effects model yielded similar results (P = 0.14). A sensitivity analysis excluding the study with a high dropout rate (Kim 2008) also did not lead to substantial changes in the results for generalised non‐verbal communication (P = 0.15).
During intervention
Average endpoint scores for non‐verbal communication during the intervention were available from three studies (Buday 1995; Farmer 2003; Kim 2008) and indicated a large effect favouring music therapy (SMD 1.06, 95% CI 0.44 to 1.69, P < 0.001; 3 studies, 50 participants; Analysis 1.3). The results showed heterogeneity (Chi² = 4.71, P = 0.09, I² = 58%), which may be related to the relatively high attrition rate in Kim 2008, or the unclear quality of music therapy methods and therapist's training in Buday 1995. When excluding data from both studies, the overall effect did not show substantial changes (SMD 1.64, 95% CI 0.10 to 3.19, P = 0.04).
Verbal communication
Post‐intervention
Eight studies assessed verbal communication immediately post‐intervention (Chen 2013; Gattino 2011; Lim 2010; Lim 2011; Rabeyron 2020; Schwartzberg 2013; Sharda 2018; Thompson 2014). The results showed substantial heterogeneity (Chi² = 25.30, P < 0.001, I² = 72%) that could not be explained clinically via subgroup analyses (results not shown), resulting in a random‐effects model being used for this outcome. The effect size for difference in verbal communication immediately post‐intervention was in the small to medium range, but the CI ranged from no effect to a medium effect (SMD 0.30, 95% CI −0.18 to 0.78; P = 0.21; 8 studies, 276 participants; very low‐certainty evidence; Analysis 1.4), suggesting little to no difference between the conditions.
During intervention
Four studies investigated verbal communication during the intervention (Buday 1995; Farmer 2003; Schwartzberg 2013; Schwartzberg 2016). The CI of the effect estimate for difference in verbal communication during the intervention ranged from a medium harmful effect to a small to medium beneficial effect (SMD −0.06, 95 % CI −0.41 to 0.28, P = 0.71; 4 studies, 129 participants; Analysis 1.4), indicating no clear evidence of a difference between the groups. There was no heterogeneity (Chi2 = 1.95, P = 0.58, I2 = 0%).
One to five months follow‐up
Data for verbal communication, measured in the period of one to five months post‐intervention using a standardised scale, were available from one study (Bharathi 2019). The SMD effect size for this follow‐up period was small, but the CI ranged from a small to medium harmful to a large beneficial effect (SMD 0.22, 95% CI −0.33 to 0.76, P = 0.44; 1 study, 52 participants; Analysis 1.4), indicating no clear evidence of a difference between music therapy and comparison groups, a similar finding to the other time points for this outcome.
Quality of life
Post‐intervention
Three studies investigated quality of life (QoL) of participants and/or their families immediately post‐intervention (Bieleninik 2017; Sharda 2018; Yurteri 2019). The SMD effect size across studies was 0.28 (95% CI 0.06 to 0.49, P = 0.01; 3 studies, 340 participants; moderate‐certainty evidence; Analysis 1.5), indicating a small to medium effect favouring music therapy, which suggests that music therapy probably increases QoL compared with 'placebo therapy' or standard care alone. Heterogeneity was low (Chi² = 2.41, P = 0.30, I² = 17%) and therefore we did not examine potential moderators; we retained the fixed‐effects model for this outcome. Changing to a random‐effects model did not lead to substantial changes of the results (P = 0.02).
Six to 11 months follow‐up
One of the studies also measured QoL seven months after the end of the intervention, i.e. in the period six to 11 months post‐intervention (Bieleninik 2017). The CI of the effect estimate for difference in quality of life in this period ranged from a small harmful to a small to medium beneficial effect (SMD 0.04, 95% CI −0.21 to 0.29, P = 0.73; 1 study, 249 participants), indicating no clear evidence of a difference between music therapy and comparison groups.
Total autism symptom severity
Post‐intervention
Nine studies assessed total autism symptom severity immediately post‐intervention (Bharathi 2019; Bieleninik 2017: Chen 2010; Chen 2013; Huang 2015; LaGasse 2014; Mateos‐Moreno 2013; Rabeyron 2020; Yurteri 2019). The results showed substantial heterogeneity (Chi² = 61.33, P < 0.001, I² = 87%) that could not be explained clinically via subgroup analyses (results not shown), so we chose a random‐effects model. The effect size for difference in total autism symptom severity immediately post‐intervention was large (SMD −0.83, 95% CI −1.41 to −0.24, P = 0.005; 9 studies, 575 participants; moderate‐certainty evidence; Analysis 1.6), suggesting that music therapy probably decreases total autism symptom severity compared to 'placebo therapy' or standard care alone.
During the intervention
Total autism symptom severity during the intervention was measured in one study (Mateos‐Moreno 2013). The effect estimate was small, with a wide CI (SMD 0.15, 95% CI ‐0.83 to 1.14, P = 0.76; 1 study, 16 participants; Analysis 1.6), indicating no clear evidence of a difference between music therapy and comparison groups.
One to five months follow‐up
Average endpoint scores of total autism symptom severity measured in the period of one to five months post‐intervention were available from two studies (Bharathi 2019; LaGasse 2014) and showed a large effect in favour of music therapy (SMD −0.93, 95% CI −1.81 to −0.06, P = 0.04; 2 studies, 69 participants).
Six to 11 months follow‐up
One study also assessed total autism symptom severity seven months after the end of the intervention, i.e. in the period six to 11 months post‐intervention (Bieleninik 2017). The SMD effect size for this time point was small, but the CI ranged from no effect to a small to medium effect (SMD 0.18, 95% CI −0.05 to 0.41, P = 0.13; 1 study, 289 participants), indicating no certain differences between music therapy and comparison groups.
Adverse events
Data for adverse events immediately post‐intervention and in the period six to 11 months post‐intervention were available from two studies (Bieleninik 2017; Porter 2017). However, as no events occurred in Porter 2017, only Bieleninik 2017 contributed an effect estimate (Analysis 1.7). Adverse events were rare, and no differences were observed between music therapy or standard care in either time period (RR 1.52, 95% CI 0.39 to 5.94, P = 0.55 immediately post‐intervention, 1 study, 290 participants; RR 0.88, 95% CI 0.23 to 3.46, P = 0.86 at 6‐11 months post‐intervention, 1 RCT, 290 participants; moderate‐certainty evidence), indicating similar frequencies of adverse events in both trial arms. Bieleninik 2017 reported that adverse events included hospitalisation and institutional stay, as reported by parents, and mainly referred to planned and short‐term institutional stays. Porter 2017 reported that no serious adverse events or non‐serious adverse events attributable to either arm of the trial occurred (personal communication, 25 January 2021). No other adverse events were reported in any of the other included studies.
Secondary outcomes
Adaptive behaviour
Post‐intervention
Immediately post‐intervention, average endpoint scores of adaptive behaviour were available from five studies (Bieleninik 2017; Chen 2010; Porter 2017; Rabeyron 2020; Sharda 2018). The CI of the effect estimate for difference in adaptive behaviour at this time point ranged from no effect to a small effect (SMD −0.02, 95% CI −0.20 to 0.16, P = 0.84; 5 studies, 462 participants; Analysis 1.8), indicating no differences between music therapy and comparison groups. No heterogeneity was detected for this comparison (Chi2 = 0.62, P = 0.96, I2 = 0%), so we did not examine potential moderators and retained the fixed‐effects model for this outcome. Changing to a random‐effects model did not lead to substantial changes of the results (P = 0.84).
During the intervention
Four studies investigated adaptive behaviour during the intervention (Arezina 2011; Brownell 2002; Kim 2008; Thomas 2003). The SMD effect size for difference between music therapy and 'placebo' therapy groups was 1.19 (95 % CI 0.56 to 1.82, P < 0.001; 4 studies, 52 participants; Analysis 1.8), indicating a large effect in favour of music therapy. Heterogeneity was low (Chi2 = 4.16, P = 0.24, I2 = 28%). The effect on adaptive behaviour during the intervention remained large and homogeneous in a sensitivity analysis excluding two studies with high risk of bias (Brownell 2002; Kim 2008).
One to five months follow‐up
Effects in the period one to five months post‐intervention (Porter 2017; SMD 0.56, 95% CI −0.12 to 1.24, P = 0.11; 1 study, 35 participants) indicated no clear evidence of a difference between music therapy and comparison groups.
Six to 11 months follow‐up
Similarly, effects in the period six to 11 months post‐intervention (Bieleninik 2017; SMD −0.12, 95% CI −0.36 to 0.11, P = 0.29; 1 study, 290 participants) indicated no clear evidence of a difference between music therapy and comparison groups.
Quality of family relationships
Post‐intervention
Three studies assessed the quality of family relationships immediately following the intervention (Kim 2008; Porter 2017; Thompson 2014). The effect size for difference between music therapy and control groups was in the small to medium range, but the CI ranged from a small harmful to a large beneficial effect (SMD 0.29, 95% CI −0.24 to 0.83, P = 0.28; 3 studies, 56 participants; Analysis 1.9), indicating no clear evidence of a difference between music therapy and comparison groups. There was no indication of heterogeneity between studies (Chi2 = 0.37, P = 0.83, I2 = 0%), therefore we did not examine potential moderators and retained the fixed‐effects model for this outcome. Changing to a random‐effects model yielded similar results (P = 0.28).
One to five months follow‐up
For follow‐up in the period of one to five months post‐intervention, the CI of the effect estimate ranging from a large harmful to a large beneficial effect indicated uncertain differences between music therapy and standard care (Porter 2017; SMD −0.04, 95% CI −1.07 to 0.99, P = 0.94; 1 study, 15 participants).
Identity formation
Post‐intervention
Two studies assessed aspects of identity formation (including self‐esteem, self‐awareness, and self‐efficacy) immediately post‐intervention (Moon 2010; Porter 2017). The results showed substantial heterogeneity (Chi² = 7.82, P = 0.005, I² = 87%) that could not be explained clinically via subgroup analyses (results not shown), so we used a random‐effects model. The SMD effect size for difference in identity formation immediately post‐intervention was large, but the CI ranged from a medium harmful to a large beneficial effect (SMD 1.35, 95% CI −0.58 to 3.28, P = 0.17; 2 studies, 55 participants; Analysis 1.10), indicating no clear evidence of a difference between music therapy and comparison groups.
One to five months follow‐up
For the period of one to five months post‐intervention, results from one study (Porter 2017) for self‐esteem indicated a large effect in favour of music therapy (SMD 0.86, 95% CI 0.16 to 1.55, P = 0.02; 1 study, 35 participants).
Depression
Post‐intervention
Depression was assessed in one study (Porter 2017). Results showed no clear evidence of a difference between music therapy and treatment‐as‐usual (SMD −0.34, 95% CI −1.01 to 0.34, P = 0.33; 1 study, 34 participants; Analysis 1.11).
One to five months follow‐up
There was little to no difference between the conditions at the period of one to five months post‐intervention (SMD −0.60, 95% CI −1.27 to 0.07, P = 0.08; 1 study, 36 participants).
Cognitive ability
Post‐intervention
One study assessed aspects of cognitive ability by measuring attention skills immediately post‐intervention (Sa 2020). However, data from this study were not included as the outcome measure was applied by the therapist.
Discussion
Summary of main results
We found 26 trials that evaluated the effects of music therapy for autistic individuals aged two years to young adult age. Outcomes were assessed during the intervention, immediately post‐intervention, and within two periods of follow‐up post‐intervention (one to five months; six to 11 months after the end of therapy). Music therapy was compared with standard care, or with a 'placebo' therapy which attempted to control for all non‐specific elements of music therapy, such as the use of music or the attention of a therapist.
The results show evidence of a large effect in favour of music therapy on social interaction during the intervention. However, the certainty of the evidence using the GRADE system (Schünemann 2013) was rated as 'low' meaning that our confidence in the effect estimate is limited. There was also a large effect in favour of music therapy on non‐verbal communication during the intervention, again with a 'low' certainty of the evidence meaning that results should be considered with caution. In addition, a large effect in favour of music therapy was found for total autism symptom severity both immediately and one to five months post‐intervention; we rated the certainty as 'moderate' for this outcome, meaning that we are moderately confident in the effect estimate.
Large effects in favour of music therapy were also found for the secondary outcomes adaptive behaviour during the intervention, and for identity formation one to five months post‐intervention. Small to moderate effect sizes resulted for the primary outcomes global improvement and quality of life immediately post‐intervention. The certainty of the evidence was rated as 'moderate' for these two outcomes, meaning that the true effect is likely to be close to the estimate of the effect, but there is a possibility that it is substantially different.
No evidence of effect was found for the primary outcome verbal communication (rated as 'very low' certainty of the evidence immediately post‐intervention), and for secondary outcomes quality of family relationships and depression. For adverse events, no differences were found between music therapy and standard care ('moderate' certainty of the evidence, which means that we are moderately confident about this result).
It is interesting to note that social interaction and non‐verbal communication skills, which may be more closely related to non‐verbal interaction occurring within music therapy, showed change compared with no change detected for verbal communication. However, it may also be that social interaction and non‐verbal communication skills are relatively easier to address than verbal communication skills, especially in minimally verbal children and through short‐ to medium‐term interventions. It is also interesting to see that both social interaction and non‐verbal communication showed change during the intervention, but not following the intervention. Generalising skills acquired within the intervention context to novel contexts and across interaction partners is a known difficulty in autism (Green 2018), and it may be that helping individuals in generalising their skills requires longer periods of intervention, and/or different approaches such as including the individual's everyday/family system in interventions. Considering this challenge of skill generalisation across contexts, it is remarkable to see the benefits of music therapy based on measures outside of the therapy environment and after completion of therapy in four outcome areas (global improvement, quality of life, total autism symptom severity, and identity formation).
Overall completeness and applicability of evidence
Music therapy conditions
An important improvement regarding the applicability of the evidence in this update is that it includes more clinical techniques and components of music therapy that are in line with those used in clinical practice. The early studies that were included in the first version of this review (Gold 2006) were of limited generalisability to clinical practice (Brownell 2002; Buday 1995; Farmer 2003). These studies only used a limited subset of the music therapy techniques described in the clinical literature in the experimental treatment conditions. Receptive music therapy techniques with a high level of structuring predominated in those interventions; improvisational techniques were not utilised. However, active and improvisational techniques are widely used in many parts of the world (Edgerton 1994; Gattino 2011; Geretsegger 2015; Holck 2004; Kim 2006; Schumacher 1999a; Schumacher 1999b; Thompson 2014; Thompson 2012; Wigram 2006; Wigram 2009). In addition to five of the seven studies added in the previous review update (Geretsegger 2014), 20 newly included studies added in this review update reflect active techniques. Most of them emphasise relational and/or improvisational approaches to music therapy, thus considerably increasing the applicability of findings to clinical practice and hence the external validity of this review.
In terms of therapy setting, it is noteworthy that in about half of the newly added studies in this update, music therapy was provided in a group setting, while group music therapy was not applied in any of the studies in the previous version of this review (Geretsegger 2014; except for the family‐based setting in Thompson 2014). We did not plan to analyse the comparative effects of these settings. Clinically, both settings may be relevant for different individuals, or for the same individuals at different times. Although a group setting may be overwhelming for some autistic individuals, music therapy groups with a tailored mix of structured and more flexible elements may also provide valuable opportunities for engaging in predictable and pleasurable social interactions with a variety of persons. This aspect of our review may also help in applying this review's findings to contemporary healthcare settings where individual therapy is often difficult to obtain due to economical reasons.
Generally speaking, music therapy for autistic individuals should be backed by research evidence from both music therapy and related fields, aiming at cooperation with others involved in treatment and care of clients, active engagement of clients, and establishing structure, predictability, and routines. It is important to note that providing structure does not equal rigidity within interventions. Music contains rhythmic, melodic, harmonic, and dynamic structure which, when applied systematically and skilfully, can be effective in engaging autistic children. Intervention strategies employing music improvisation are usually not pre‐structured in the sense of a fixed manual. In recent years, flexible but systematic treatment protocols for music therapy have been developed in clinical practice and research investigations in autism (Geretsegger 2015; Kim 2006; Thompson 2014; Wigram 2006) as well as in other fields (Baker 2019; Millstein 2021; Rolvsjord 2005). As described above (see Included studies), several of the studies in this review have successfully applied such guidelines. More studies employing therapy approaches which are close to those applied in clinical practice will be needed in order to further improve the clinical applicability of research findings.
Control conditions
Thirteen of the included studies used a 'dismantling' strategy to isolate the effect of the specific 'ingredients' of music therapy by setting up comparison conditions which were very similar to the music therapy interventions, excluding only the music component (Arezina 2011; Brownell 2002; Buday 1995; Farmer 2003; Kim 2008; LaGasse 2014; Lim 2010; Lim 2011; Moon 2010; Schwartzberg 2013; Schwartzberg 2016; Sharda 2018; Thomas 2003). Any conclusion from such comparisons will therefore address the effects of specific music therapy techniques, rather than the absolute effects of music therapy in general. This type of design is most justified in explanatory trials (Thorpe 2009) or when exploring music therapy intervention strategies. However, such comparison conditions are less appropriate in pragmatic trials designed to inform practice (Thorpe 2009) as they may introduce some artificiality into the studies through selecting out and applying a single intervention strategy. This is not typically undertaken in clinical treatment, although it does isolate specific components of music therapy. In the broader field of psychotherapy research, similar constructions of 'placebo' therapy to control for the therapist's attention and the non‐specific elements have been broadly used (Kendall 2004, pp. 20‐1). However, research on common factors in psychotherapy raise the question of how adequate it is conceptually, and also whether it is technically possible to separate the active from the non‐active elements of therapy (Lambert 2004, pp. 150‐2).
Duration, population, and outcomes
Autism as a pervasive developmental disorder is a chronic condition, which requires sustained therapeutic intervention starting as early as possible. In clinical reports for autism, music therapy is usually described as a longer‐term intervention and, given the typical emergence of entrenched and deteriorating behaviour, therapeutic intervention relies on consolidating progress over time. With the therapy duration of included studies ranging up to eight months, we consider this review's findings as sufficiently applicable to clinical contexts.
With regards to the population addressed, it is noteworthy that, different from the previous version of this review (Geretsegger 2014) which only included studies with children up to nine years, this update included studies with adolescents and young adults. The applicability of the findings is still limited to the age groups included in the studies (two years to young adult age). No direct conclusions can be drawn about music therapy in autistic individuals above the young adult age. As with most autism research, the majority of the participants in this review were males from Western countries. It is positive that some included studies have been conducted in non‐Western countries. To improve generalisability to the broader population, it will be important to further diversify the populations studied in future trials to include non‐male, non‐Western participants.
The outcomes addressed in the included studies cover areas that form the core of the condition and relevant related areas that we consider as highly relevant to autistic individuals and their families. Having said that, it is also important to consider possible detrimental effects of approaches aiming at reducing autism severity, particularly in the areas of social interaction and communication. Such approaches might support or even provoke the masking of autistic traits, which has been reported to be associated with negative consequences for mental health including an increase in the risk of lifetime suicidality (Cassidy 2020). Additionally, the concept of autism severity and functioning‐level descriptors such as 'high‐functioning' are highly contentious and have recently shown to be an imprecise understanding of autistic peoples’ specific needs; it has been suggested to instead acknowledge that the level of support needs of autistic people likely varies across domains, so that describing support needs in different domains (e.g. unstructured recreation activities, academic work) would be more appropriate (Bottema‐Beutel 2021). However, as described above, many of the included studies employed music therapy approaches where therapists follow the individual's strengths and resources in an effort to maximise the individual's capabilities rather than to simply decrease autism symptoms or teaching specific skills for neurotypical interaction and communication. This and an emerging focus on outcomes such as quality of life, depression, and identity formation enhance the relevance of this review's findings for autistic individuals.
Quality of the evidence
Using the GRADE system (Schünemann 2013), we rated the certainty of the evidence as 'moderate' for four outcomes, 'low' for two outcomes, and 'very low' for one outcome included in the summary of findings Table 1, which means that further research is likely to change the effect estimates and our confidence that they are precise; results should therefore be considered with caution. Our assessments of the certainty of the evidence mainly reflect concerns about risk of bias and imprecision due to wide CIs and small sample sizes. Limitations to the methodological strength of the evidence are due to poor reporting of randomisation and allocation procedures or lack of randomisation and/or concealment in some studies. When interpreting the results, it is important to note that, due to the nature of the intervention, it was not possible to blind those who delivered music therapy or those who received it. However, although participants were not blinded, this was unlikely to introduce bias as they are usually not fully aware of available therapy options or study design (Cheuk 2011). Additionally, blinding of assessors was not assured in the majority of studies as some of the measures in the included studies relied on reports from parents or participants themselves who were aware of the respective group allocation. However, change in participants' skills as assessed by parents or self‐report may reflect effects of interventions that are meaningful and relevant to clients and their families and is therefore considered important to include.
Overall, we also observed several positive trends in this update that improve the certainty of the evidence: Most notably, both the median number of participants per study and the total number of participants included have considerably increased (from a median of 10 and a total of 165 participants in the previous review to 24 and 1165 participants, respectively, in the present update). Studies also employed longer periods of intervention on average, and a fifth of the studies in this review also included follow‐up assessments ranging from three weeks until seven months after the end of the intervention, thus providing important information regarding the question of whether the effects of music therapy are enduring. It is also noteworthy that the number of studies in this review that used validated scales (usually measuring generalised behaviour) has substantially increased; thus, the findings are both more relevant and more reliable, and more comparable across interventions.
Potential biases in the review process
One can never be completely sure that all relevant trials have been identified. However, our searches included not only exhaustive electronic and handsearches, but relied additionally on an existing international network of leading researchers in the field. Therefore, it seems unlikely that an important trial exists that did not come to our attention. Furthermore, this field does not seem to be characterised by strongly selective publication. The trials that were unpublished or published only in the grey literature tended to have positive results and were unpublished for reasons unrelated to study results (Arezina 2011; Thomas 2003).
The potential bias regarding the inclusion of studies in which one or more review authors were involved (Bieleninik 2017; Kim 2008; Thomas 2003) was mitigated by ensuring that eligibility, risk of bias and certainty of evidence assessment and data extraction were performed by two independent reviewers not involved in these studies.
We found five ongoing studies (one of which is awaiting classification due to incomplete information regarding eligibility); incorporating these studies in a future update may alter the conclusions of this review.
Agreements and disagreements with other studies or reviews
The findings of the present systematic review add substantial and relevant information to previous works about the effectiveness of music therapy for autistic people (Gold 2006; James 2015; Marquez‐Garcia 2021; Mayer‐Benarous 2021; Wheeler 2008; Whipple 2004; Whipple 2012).
Focusing on the most recent reviews on the topic, Marquez‐Garcia (Marquez‐Garcia 2021) summarized 36 longitudinal and retrospective peer‐reviewed studies published between 2008 and 2018. The review examined family interaction, communication, psychological, and physiological changes. The authors concluded that the poor methodology of the included studies (e.g. experimental designs, sample sizes, outcome measures) prevented them from recommending music therapy in this population. They also encouraged the integration of behavioural evaluations with neuroscience (e.g. neuroimaging) and a more detailed characterisation of study participants (e.g. severity level, presence of intellectual disability).
Mayer‐Benarous 2021 evaluated the efficacy of educational and improvisational music therapy in children with neurodevelopmental disorders such as ASD, attention deficit‐hyperactivity disorder (ADHD), and learning and intellectual disabilities. The authors principally analysed outcomes related to socio‐communication. Evidence on the efficacy of educational music therapy was based on 12 studies and supported a positive but small effect of educational music therapy for autistic children. According to the nine studies evaluating improvisational music therapy, efficacy appeared limited, but promising. Similarly to Marquez‐Garcia 2021, Mayer‐Benarous 2021 highlighted the methodological issues of the included studies.
The findings of the present meta‐analysis add considerably to the external validity of older and more recently published systematic reviews. First, the methodology was more rigorous, with clear predefined inclusion/exclusion criteria, especially concerning the population under study, the type of intervention, and the study design. Second, our systematic review was more inclusive in terms of timeframe, age of participants, and outcomes examined; of note, electronic searches were combined with a consultation of the grey literature and experts in the field. Most importantly, we performed not only a qualitative, but also a quantitative synthesis, which may allow a clearer and more objective interpretation of findings, especially in light of the scattered outcome measures adopted in the included trials. The evaluation of outcomes with immediate relevance for autistic individuals, such as quality of life, identity formation, and depression may add a considerable value to the results of the present review. Notwithstanding, in agreement with the most recent systematic reviews on the topic (Marquez‐Garcia 2021; Mayer‐Benarous 2021), we have underlined the urgent need for improving the methodology of trials evaluating the efficacy of music therapy for autistic people.

Study flow diagram
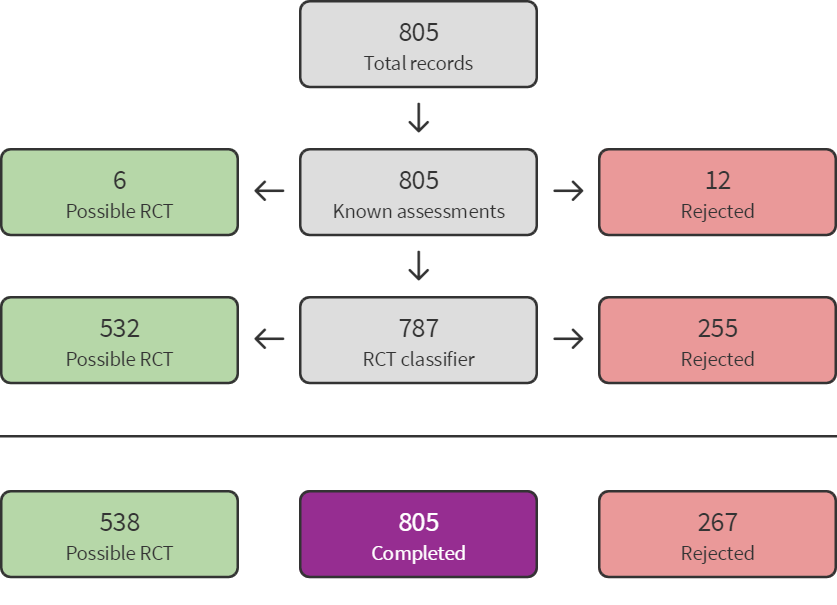
Sreen4Me summary diagram ‐ July 2020 search

Screen4Me summary diagram ‐ August 2021 search

Accumulation of evidence from 1995 to 2020.
Key: black circles = parallel design; red circles = cross‐over design. Bubble sizes in panels (c) and (d) reflect number of participants randomised.

Risk of bias graph: review authors' judgements about each risk of bias item presented as percentages across all included studies

Risk of bias summary: review authors' judgements about each risk of bias item for each included study

Comparison 1: Music therapy vs placebo therapy or standard care, Outcome 1: Global improvement

Comparison 1: Music therapy vs placebo therapy or standard care, Outcome 2: Social interaction

Comparison 1: Music therapy vs placebo therapy or standard care, Outcome 3: Non‐verbal communication

Comparison 1: Music therapy vs placebo therapy or standard care, Outcome 4: Verbal communication

Comparison 1: Music therapy vs placebo therapy or standard care, Outcome 5: Quality of life

Comparison 1: Music therapy vs placebo therapy or standard care, Outcome 6: Total autism symptom severity

Comparison 1: Music therapy vs placebo therapy or standard care, Outcome 7: Adverse events

Comparison 1: Music therapy vs placebo therapy or standard care, Outcome 8: Adaptive behaviour

Comparison 1: Music therapy vs placebo therapy or standard care, Outcome 9: Quality of family relationships

Comparison 1: Music therapy vs placebo therapy or standard care, Outcome 10: Identity formation

Comparison 1: Music therapy vs placebo therapy or standard care, Outcome 11: Depression
| Music therapy compared with placebo therapy or standard care for autistic people | ||||||
| Population: individuals with a diagnosis of autism spectrum disorder | ||||||
| Outcomes | Illustrative comparative risks* (95% CI) | Relative effect (95% CI) | Number of participants | Certainty of the evidence | Comments | |
|---|---|---|---|---|---|---|
| Assumed risk | Corresponding risk | Music therapy versus placebo therapy or standard care | ||||
| Risk with placebo or standard care | Risk with music therapy | |||||
| Global improvement
| Low‐risk populationa | RR 1.22 (1.06 to 1.40) | 583
| ⊕⊕⊕⊝ | Higher scores represent greater improvement.
| |
| 430 per 1000 | 525 per 1000 (456 to 602) | |||||
| High‐risk populationa | ||||||
| 800 per 1000 | 976 per 1000 (848 to 1000) | |||||
| Social interaction
| ‐ | The mean social interaction score at immediately post‐intervention in the intervention groups was 0.26 standard deviations higher (0.05 lower to 0.57 higher) | ‐ | 603 | ⊕⊕⊝⊝ | Higher scores represent higher social interaction capabilities.
Small to medium effect size according to Cohen 1988
|
| Non‐verbal communication
| ‐ | The mean non‐verbal communication score at immediately post‐intervention in the intervention groups was 0.26 standard deviations higher (0.03 lower to 0.55 higher) | ‐ | 192 | ⊕⊕⊝⊝ | Higher scores represent higher non‐verbal communication capabilities.
Small to medium effect size according to Cohen 1988
|
| Verbal communication Follow‐up: immediately post‐intervention (M = 3.2 months, SD = 2.8)
| ‐ | The mean verbal communication score at immediately post‐intervention in the intervention groups was 0.30 standard deviations higher (0.18 lower to 0.78 higher) | ‐ | 276 | ⊕⊝⊝⊝ | Higher scores represent higher verbal communication capabilities.
Small to medium effect size according to Cohen 1988
|
| Quality of life Follow‐up: immediately post‐intervention (M = 3.3 months, SD = 1.5)
| ‐ | The mean quality of life score at immediately post‐intervention in the intervention groups was | ‐ | 340 | ⊕⊕⊕⊝ | Higher scores represent higher quality of life.
Small to medium effect size according to Cohen 1988 |
| Total autism symptom severity
| ‐ | The mean total autism symptom severity score at immediately post‐intervention in the intervention groups was 0.83 standard deviations lower (1.41 to 0.24 lower) | ‐ | 575 | ⊕⊕⊕⊝ | Higher scores represent higher symptom severity.
Large effect size according to Cohen 1988 |
| Adverse events Any serious or non‐serious adverse event
| Low‐risk populationa | RR 1.52 (0.39 to 5.94) | 326 | ⊕⊕⊕⊝ | Higher scores represent higher numbers of adverse events.
Adverse events reported are hospitalisation periods, typically planned and short‐term.
One study with 36 participants reported no adverse events and was not included in the RR analysis. | |
| 0 per 1000 | 0 per 1000 (0 to 0) | |||||
| High‐risk populationa | ||||||
| 24 per 1000 | 37 per 1000 (9 to 150) | |||||
| *The basis for the assumed risk is provided in footnotes. The corresponding risk (and its 95% CI) is based on the assumed risk in the intervention group and the relative effect of the intervention (and its 95% CI).
CI: Confidence interval; M: Mean; RR: Risk ratio; SD: Standard deviation. |
| |||||
| GRADE Working Group grades of evidence |
| |||||
| aTypical risks are not known, so we chose the risk from included studies providing the second highest (Kim 2008) for a high‐risk population and the second lowest (Porter 2017) for a low‐risk population for the outcome 'Global improvement' (Schünemann 2021). For the outcome of 'Adverse events', where only two studies were included, we based the risk of the high‐risk population on Bieleninik 2017 and that of the low‐risk population on Porter 2017. | ||||||
| Outcome or subgroup title | No. of studies | No. of participants | Statistical method | Effect size |
| 1.1 Global improvement Show forest plot | 8 | Risk Ratio (M‐H, Fixed, 95% CI) | Subtotals only | |
| 1.1.1 Immediately post‐intervention | 8 | 583 | Risk Ratio (M‐H, Fixed, 95% CI) | 1.22 [1.06, 1.40] |
| 1.1.2 1‐5 months post‐intervention | 2 | 99 | Risk Ratio (M‐H, Fixed, 95% CI) | 1.19 [0.90, 1.57] |
| 1.1.3 6‐11 months post‐intervention | 1 | 364 | Risk Ratio (M‐H, Fixed, 95% CI) | 1.14 [0.91, 1.41] |
| 1.2 Social interaction Show forest plot | 14 | Std. Mean Difference (IV, Random, 95% CI) | Subtotals only | |
| 1.2.1 During intervention | 3 | 44 | Std. Mean Difference (IV, Random, 95% CI) | 1.15 [0.49, 1.80] |
| 1.2.2 Immediately post‐intervention | 12 | 603 | Std. Mean Difference (IV, Random, 95% CI) | 0.26 [‐0.05, 0.57] |
| 1.2.3 1‐5 months post‐intervention | 2 | 59 | Std. Mean Difference (IV, Random, 95% CI) | 0.54 [‐0.11, 1.19] |
| 1.2.4 6‐11 months post‐intervention | 1 | 258 | Std. Mean Difference (IV, Random, 95% CI) | ‐0.06 [‐0.30, 0.18] |
| 1.3 Non‐verbal communication Show forest plot | 9 | Std. Mean Difference (IV, Fixed, 95% CI) | Subtotals only | |
| 1.3.1 During intervention | 3 | 50 | Std. Mean Difference (IV, Fixed, 95% CI) | 1.06 [0.44, 1.69] |
| 1.3.2 Immediately post‐intervention | 7 | 192 | Std. Mean Difference (IV, Fixed, 95% CI) | 0.26 [‐0.03, 0.55] |
| 1.4 Verbal communication Show forest plot | 12 | Std. Mean Difference (IV, Random, 95% CI) | Subtotals only | |
| 1.4.1 During intervention | 4 | 129 | Std. Mean Difference (IV, Random, 95% CI) | ‐0.06 [‐0.41, 0.28] |
| 1.4.2 Immediately post‐intervention | 8 | 276 | Std. Mean Difference (IV, Random, 95% CI) | 0.30 [‐0.18, 0.78] |
| 1.4.3 1‐5 months post‐intervention | 1 | 52 | Std. Mean Difference (IV, Random, 95% CI) | 0.22 [‐0.33, 0.76] |
| 1.5 Quality of life Show forest plot | 3 | Std. Mean Difference (IV, Fixed, 95% CI) | Subtotals only | |
| 1.5.1 Immediately post‐intervention | 3 | 340 | Std. Mean Difference (IV, Fixed, 95% CI) | 0.28 [0.06, 0.49] |
| 1.5.2 6‐11 months post‐intervention | 1 | 249 | Std. Mean Difference (IV, Fixed, 95% CI) | 0.04 [‐0.21, 0.29] |
| 1.6 Total autism symptom severity Show forest plot | 9 | Std. Mean Difference (IV, Random, 95% CI) | Subtotals only | |
| 1.6.1 During intervention | 1 | 16 | Std. Mean Difference (IV, Random, 95% CI) | 0.15 [‐0.83, 1.14] |
| 1.6.2 Immediately post‐intervention | 9 | 575 | Std. Mean Difference (IV, Random, 95% CI) | ‐0.83 [‐1.41, ‐0.24] |
| 1.6.3 1‐5 months post‐intervention | 2 | 69 | Std. Mean Difference (IV, Random, 95% CI) | ‐0.93 [‐1.81, ‐0.06] |
| 1.6.4 6‐11 months post‐intervention | 1 | 289 | Std. Mean Difference (IV, Random, 95% CI) | 0.18 [‐0.05, 0.41] |
| 1.7 Adverse events Show forest plot | 1 | Risk Ratio (M‐H, Fixed, 95% CI) | Subtotals only | |
| 1.7.1 Immediately post‐intervention | 1 | 290 | Risk Ratio (M‐H, Fixed, 95% CI) | 1.52 [0.39, 5.94] |
| 1.7.2 6‐11 months post‐intervention | 1 | 290 | Risk Ratio (M‐H, Fixed, 95% CI) | 0.88 [0.23, 3.46] |
| 1.8 Adaptive behaviour Show forest plot | 9 | Std. Mean Difference (IV, Fixed, 95% CI) | Subtotals only | |
| 1.8.1 During intervention | 4 | 52 | Std. Mean Difference (IV, Fixed, 95% CI) | 1.19 [0.56, 1.82] |
| 1.8.2 Immediately post‐intervention | 5 | 462 | Std. Mean Difference (IV, Fixed, 95% CI) | ‐0.02 [‐0.20, 0.16] |
| 1.8.3 1‐5 months post‐intervention | 1 | 35 | Std. Mean Difference (IV, Fixed, 95% CI) | 0.56 [‐0.12, 1.24] |
| 1.8.4 6‐11 months post‐intervention | 1 | 290 | Std. Mean Difference (IV, Fixed, 95% CI) | ‐0.12 [‐0.36, 0.11] |
| 1.9 Quality of family relationships Show forest plot | 3 | Std. Mean Difference (IV, Fixed, 95% CI) | Subtotals only | |
| 1.9.1 Immediately post‐intervention | 3 | 56 | Std. Mean Difference (IV, Fixed, 95% CI) | 0.29 [‐0.24, 0.83] |
| 1.9.2 1‐5 months post‐intervention | 1 | 15 | Std. Mean Difference (IV, Fixed, 95% CI) | ‐0.04 [‐1.07, 0.99] |
| 1.10 Identity formation Show forest plot | 2 | Std. Mean Difference (IV, Random, 95% CI) | Subtotals only | |
| 1.10.1 Immediately post‐intervention | 2 | 55 | Std. Mean Difference (IV, Random, 95% CI) | 1.35 [‐0.58, 3.28] |
| 1.10.2 1‐5 months post‐intervention | 1 | 35 | Std. Mean Difference (IV, Random, 95% CI) | 0.86 [0.16, 1.55] |
| 1.11 Depression Show forest plot | 1 | Std. Mean Difference (IV, Fixed, 95% CI) | Subtotals only | |
| 1.11.1 Immediately post‐intervention | 1 | 34 | Std. Mean Difference (IV, Fixed, 95% CI) | ‐0.34 [‐1.01, 0.34] |
| 1.11.2 1‐5 months post‐intervention | 1 | 36 | Std. Mean Difference (IV, Fixed, 95% CI) | ‐0.60 [‐1.27, 0.07] |